Disease-associated mutations in the human TRPM3 render the channel overactive via two distinct mechanisms
- Department of Pharmacology, Physiology and Neuroscience, New Jersey Medical School, Rutgers University, United States
Figures
Figure 1 with 3 supplements
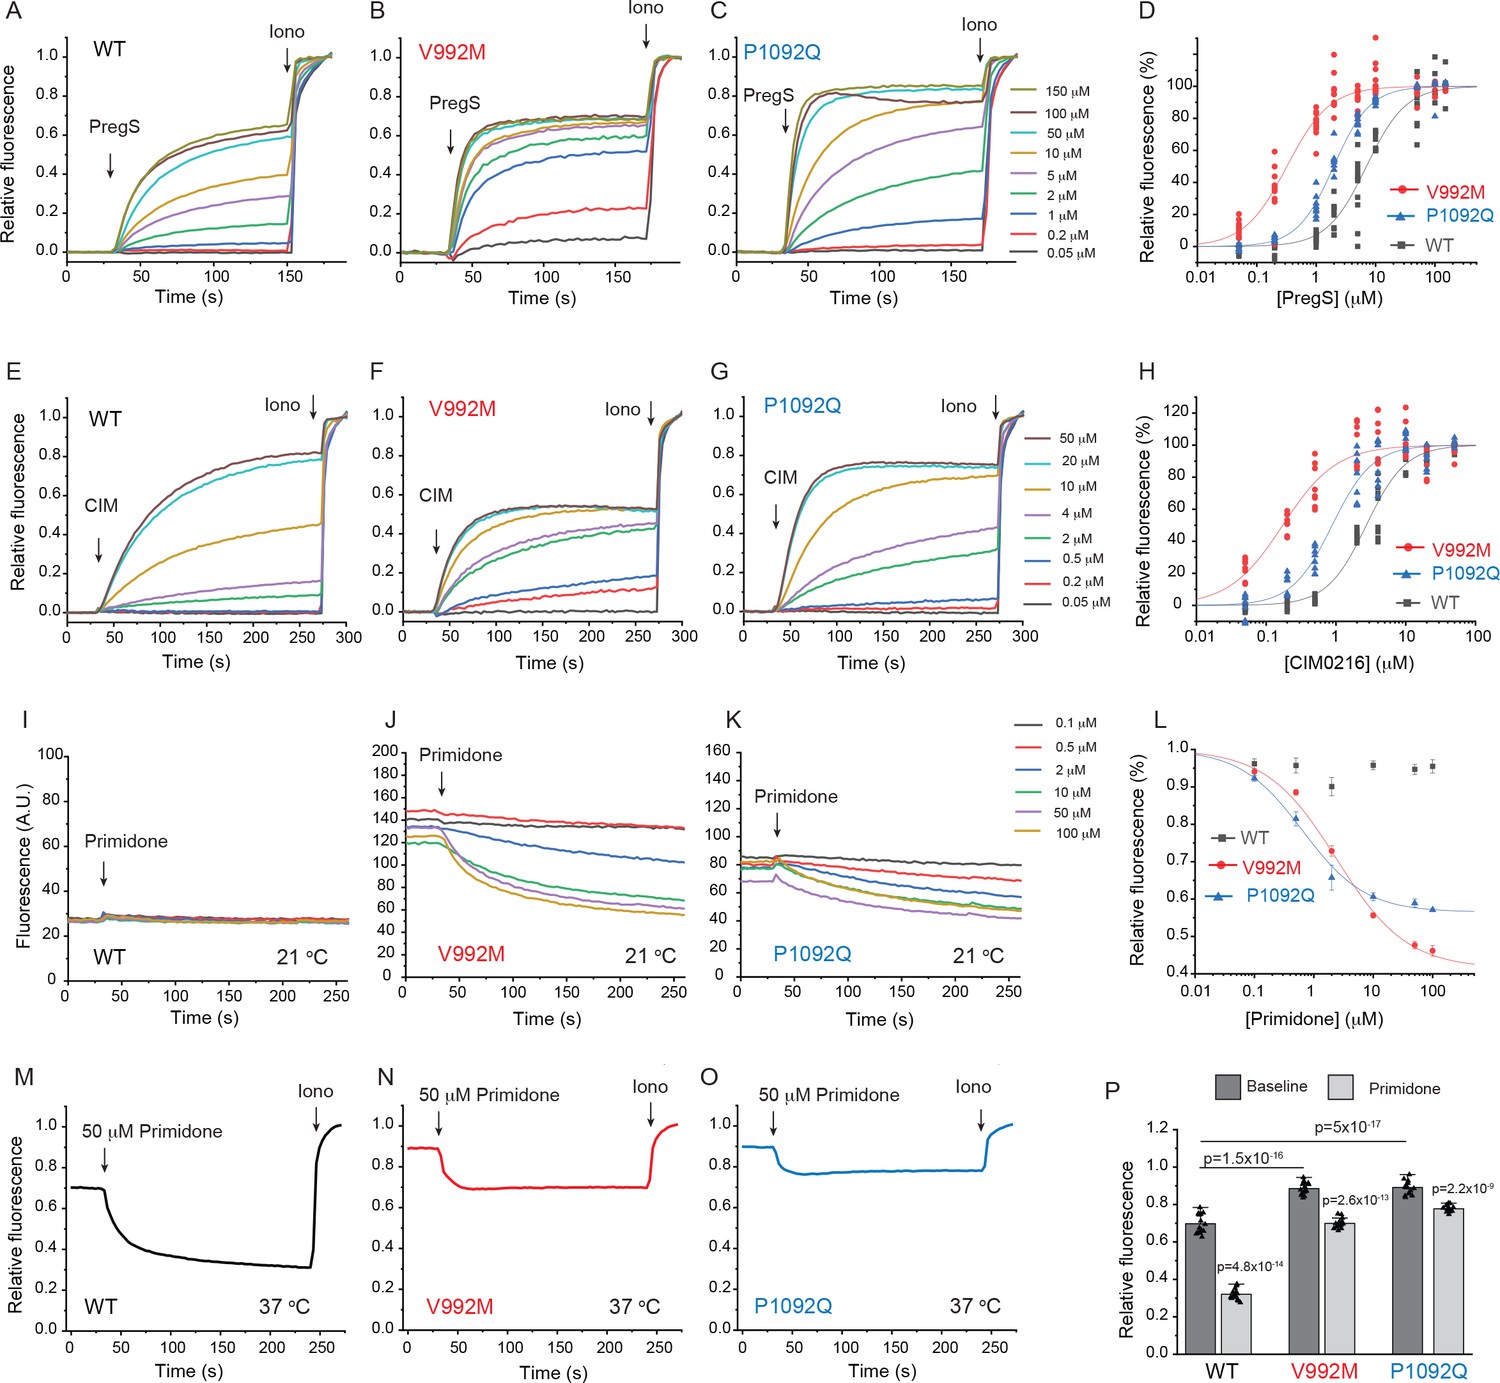
Disease-associated mutations increase agonist sensitivity and basal activity of TRPM3.
HEK293 cells were transfected with the Ca2+ indicator GCaMP6f and the hTRPM3α2 or its mutants, and fluorescence was measured in a 96-well plate reader (Flexstation-3) as described in the Materials and methods section. (A-C) Fluorescence traces for TRPM3 (A), V992M (B) and P1092Q (C); the applications of various concentrations of PregS and 2 μM ionomycin are indicated by the arrows. Basal fluorescence before the application of PregS was first subtracted, then the traces were normalized to the fluorescence after the application of ionomycin. Each trace shows the average of four replicates from the same 96-well plate. Measurements were performed at 21°C. (D) Hill fits of the concentration dependence of the fluorescence signals evoked by PregS. Symbols represent individual wells from three independent transfections. The EC50 values were 7.01 ± 0.69 μM for wild-type channels, 0.32 ± 0.03 μM for V992M and 1.97 ± 0.08 μM for P1092Q. (E-G) Fluorescence traces for TRPM3 (E), V992M (F) and P1092Q (G), the applications of various concentrations of CIM0216 and 2 μM ionomycin are indicated by the arrows. Basal fluorescence before the application of CIM0216 was first subtracted, then the traces were normalized to the fluorescence after the application of ionomycin. Measurements were performed at 21°C. (H) Hill fits of the concentration dependence of the fluorescence signals evoked by CIM0216. Symbols represent individual wells from two independent transfections. The EC50 values were 2.72 ± 0.17 μM for wild-type channels, 0.17 ± 0.02 μM for V992M and 0.88 ± 0.08 μM for P1092Q. (I-K) Fluorescence traces for TRPM3 (I), V992M (J) and P1092Q (K), the applications of various concentrations of primidone are indicated by the arrows; traces were not normalized and shown as arbitrary fluorescence units (A.U.). Measurements were performed at 21°C. (L) Hill1 fits of the concentration dependence of the inhibition evoked by primidone. Symbols represent mean ± SEM from two independent transfections, five or six wells in each. The IC50 values were 2.41 ± 0.74 μM for V992M and 0.64 ± 0.09 μM for P1092Q. (M-O) Fluorescence traces for TRPM3 (M), V992M (N) and P1092Q (O), the applications of 50 μM primidone are indicated by the arrows; traces show the average of 16 wells from two independent transfections, normalized to the effect of ionomycin. Measurements were performed at 37°C. (P) Summary of the data, Mean ± SEM and scatter plots. Statistical significance was calculated with one-way analysis of variance with Bonferroni post hoc comparison for differences of basal fluorescence values between mutant and wild-type channels. The effect of primidone in wild type and mutant channel was evaluated with paired t-test; the p values for significance are shown above the bars.
Figure 1—figure supplement 1
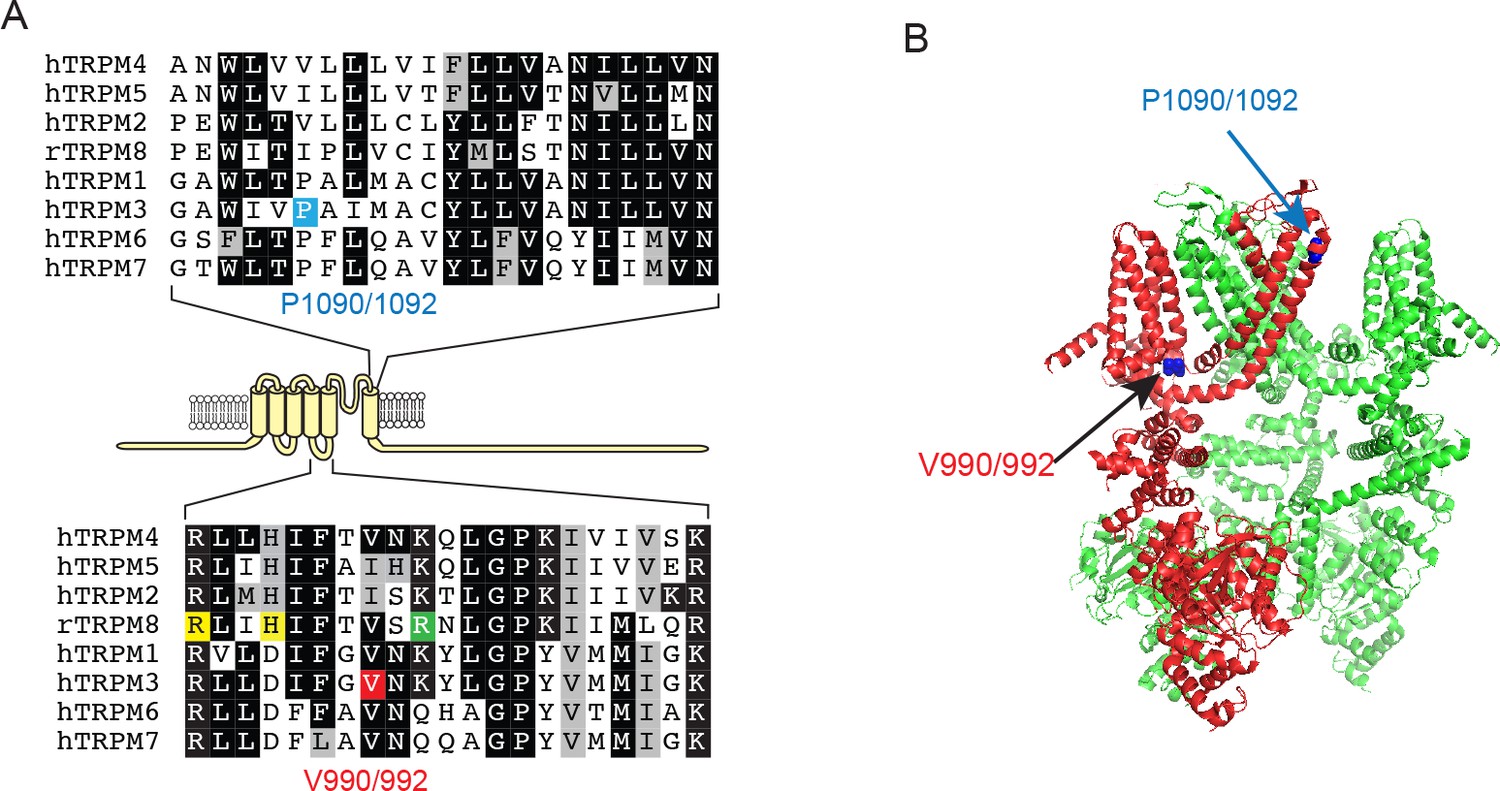
Location of the V990/992 and P1090/1092 residues.
(A) Top: Sequence alignment of the outer part of S6 in TRPM channels, the P1090/1092 residue in TRPM3 is highlighted blue. Bottom: Sequence alignment of the S4-S5 loop of TRPM channels, the V990/992 residue in TRPM3 is labeled red, yellow highlights indicate residues in contact with the agonists icilin and/or WS12 in the TRPM8 structures (6nr3, 6nr4, 6nr2), the residue highlighted green is in contact with PI(4,5)P2 in TRPM8. (B) The location of residues equivalent to V990/992 and P1090/1092 on the structure of TRPM4 (6bcj); one subunit is hidden for visibility. The V990/992 residue corresponds to V837 in Dyment et al. (2019) while the P1090/1092 corresponds to P937.
Figure 1—figure supplement 2
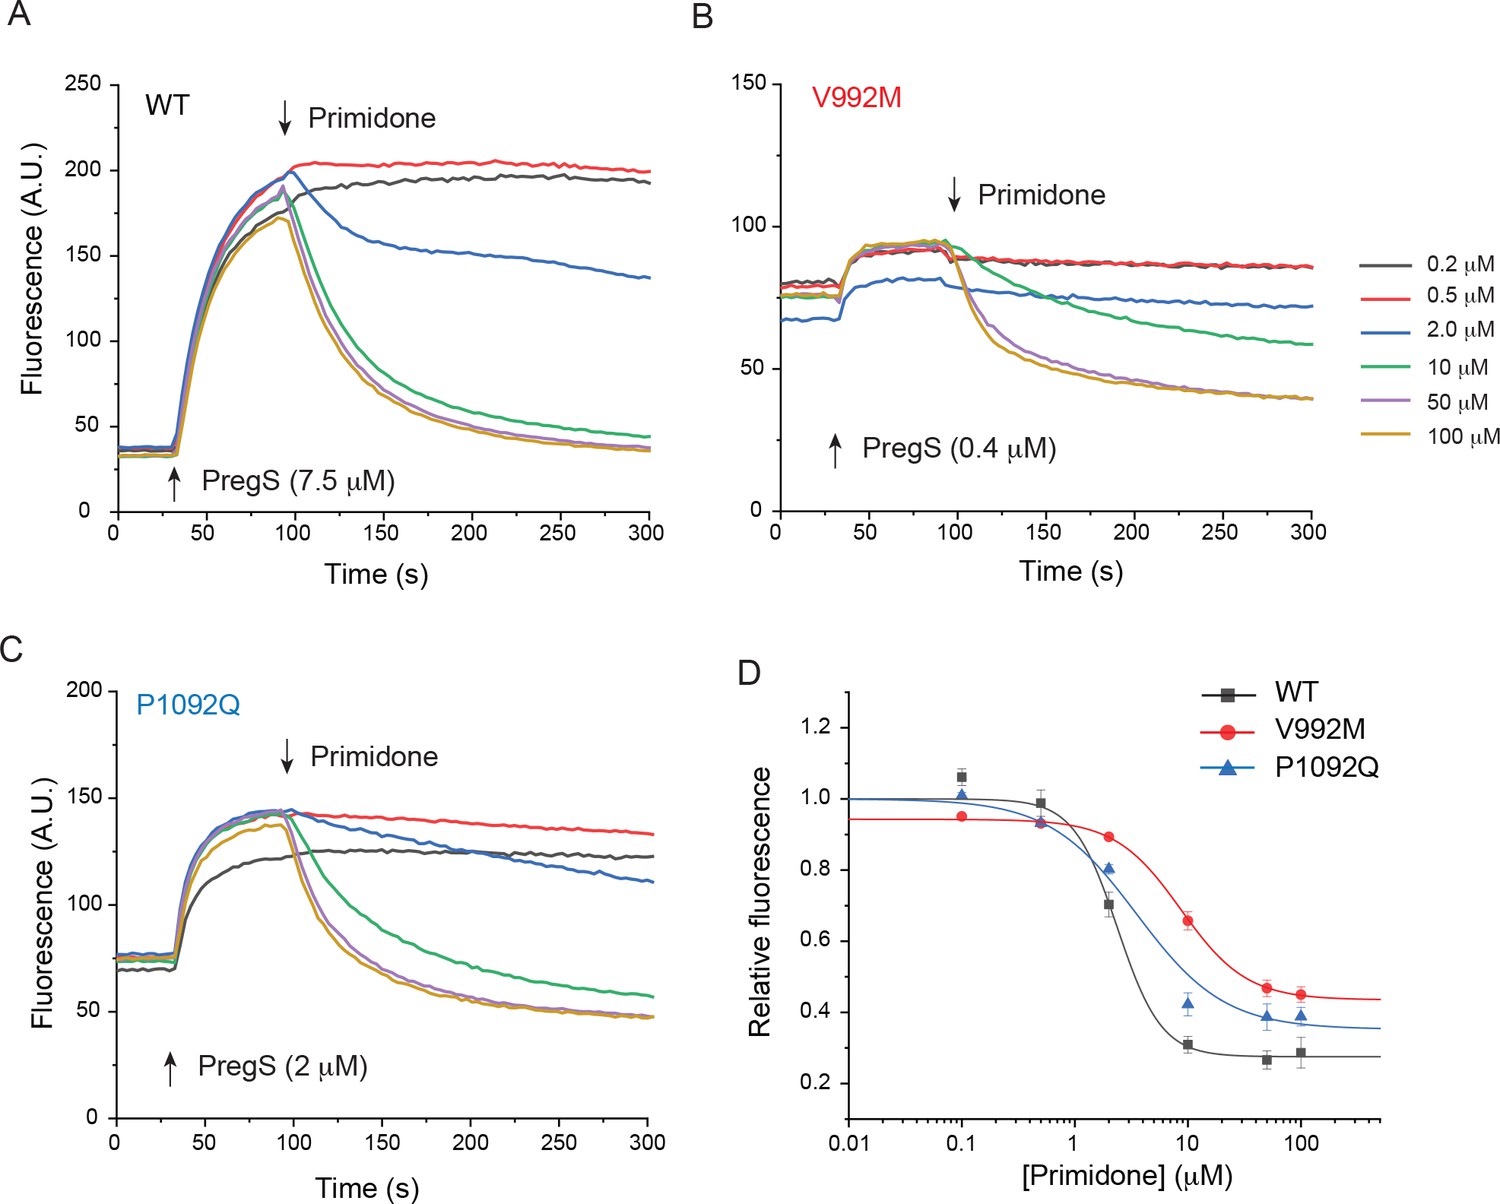
Primidone inhibits Ca2+ responses induced by EC50 concentrations of PregS.
HEK293 cells were transfected with the Ca2+ indicator GCaMP6f and the hTRPM3α2 or its mutants, and fluorescence was measured in a 96-well plate reader (Flexstation-3) at room temperature (~21°C) as described in the Materials and method section. (A-C) Cells were stimulated by PregS at its EC50 concentration for each construct, as indicated by the first arrow, then various concentrations of primidone were applied (second arrow). (D) Hill1 fits of the concentration dependence of primidone; symbols show mean ± SEM from five or six wells, from two independent transfections. The IC50 values were 2.37 ± 0.39 μM for wild-type channels, 8.62 ± 1.42 μM for V992M and 3.52 ± 1.13 μM for P1092Q.
Figure 1—figure supplement 3
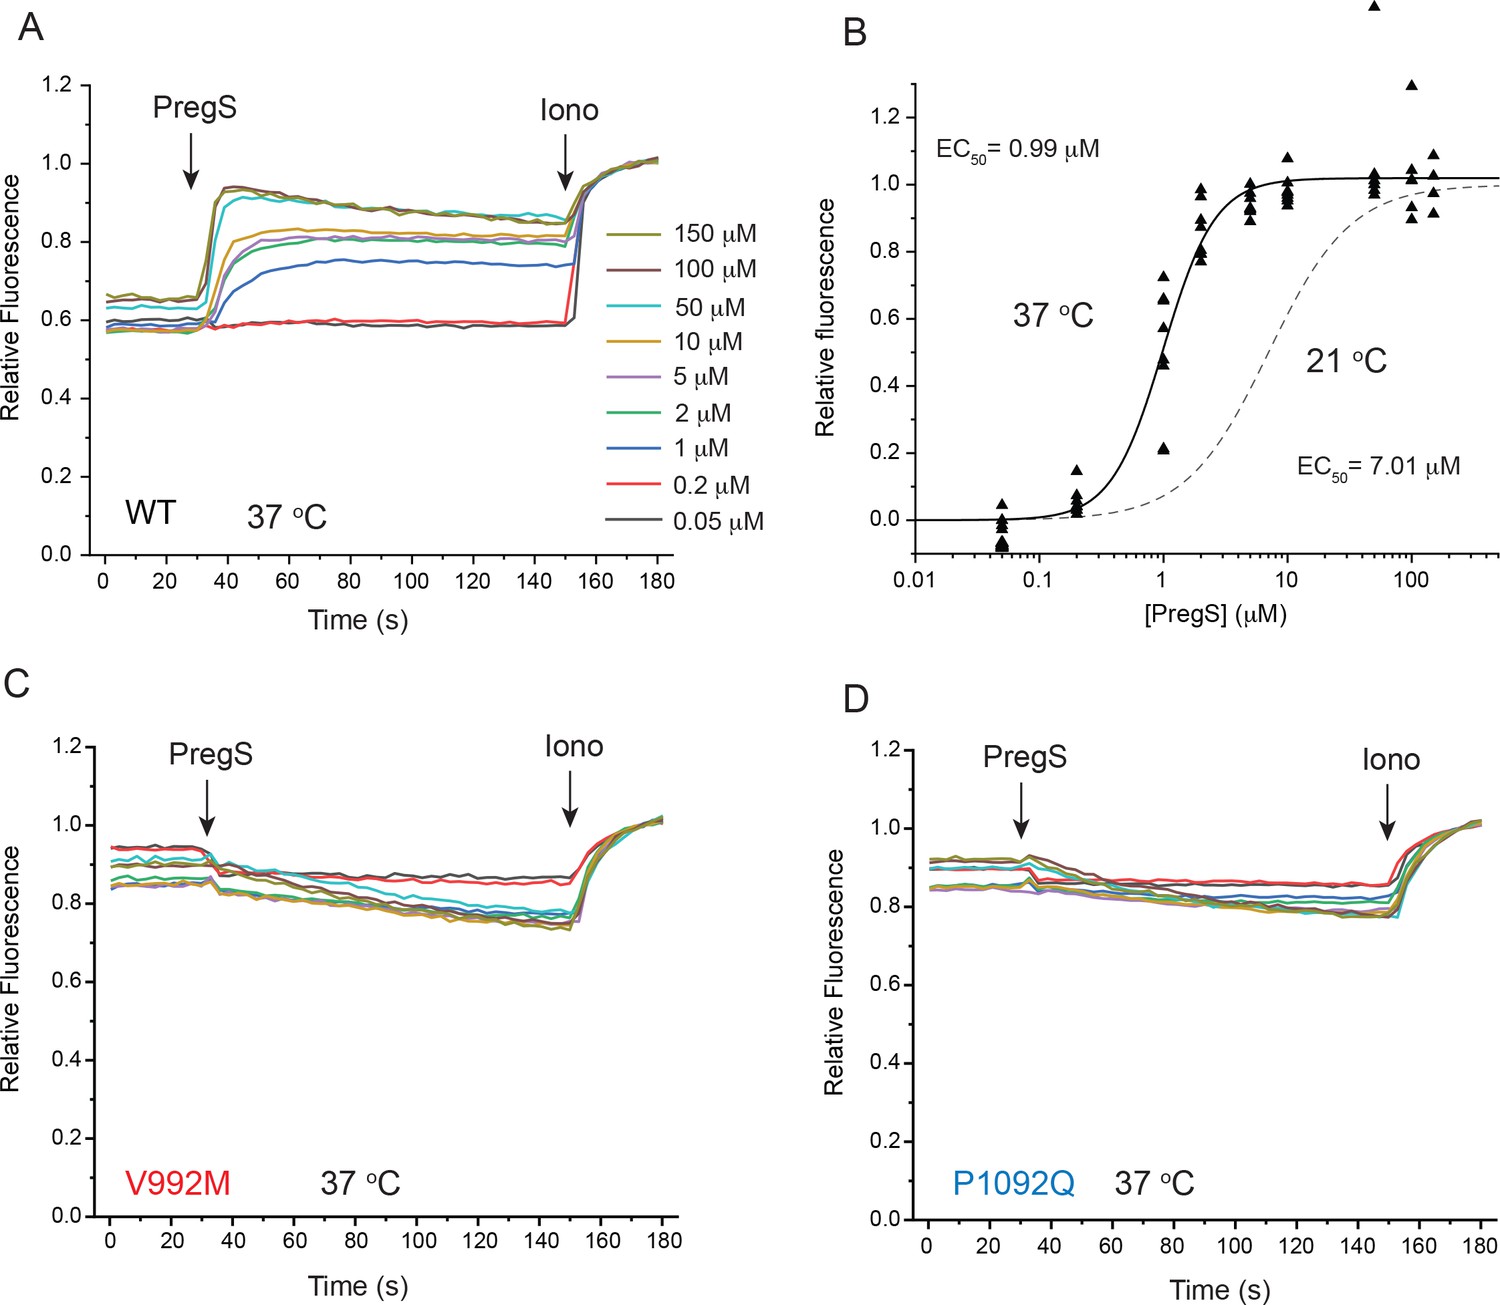
PregS responses of wild type and mutant TRPM3 at 37°C.
HEK293 cells were transfected with the Ca2+ indicator GCaMP6f and the hTRPM3α2 or its mutants, and fluorescence was measured in a 96-well plate reader (Flexstation-3) as described in the Materials and method section. (A) Average traces from one plate (four wells for each condition) for stimulation with different concentrations of PregS for cells expressing wild type TRPM3; at the end of the experiment, 2 μM ionomycin was applied as a normalizing stimulus. (B) Hill fit of the PregS concentration response relationship, symbols show values obtained in individual wells n = 8 from two independent transfections. The dashed line shows the fit for the concentration response curve obtained at 21°C from Figure 1D. (C-D) Identical experiments to those shown in panel A, on cells expressing the V992M (C) and the P1092Q (D) mutants.
Figure 2
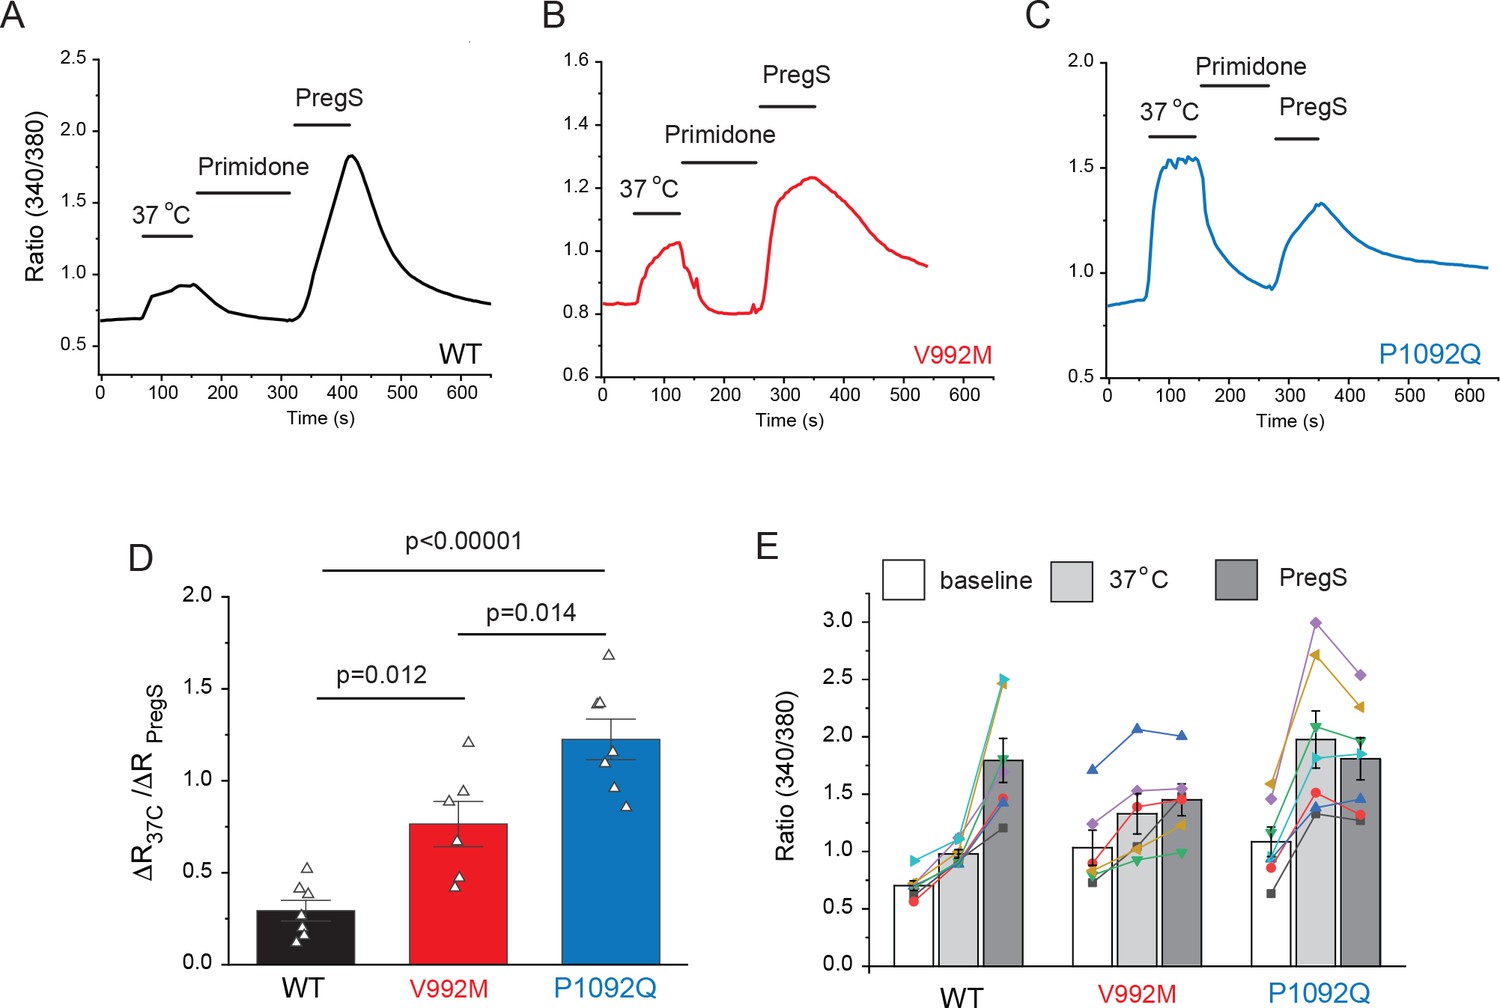
Disease-associated mutations increase temperature activation of TRPM3.
HEK293 cells were transfected with the human TRPM3α2, or its mutants; fura-2 Ca2+ imaging experiments were performed as described in the Materials and methods section. (A-C) Averaged fluorescence ratio traces (340 nm/380 nm) for all PregS-responsive cells from one coverslip in cells expressing TRPM3 (A), V992M (B) and P1092Q (C). The cells were first stimulated by increasing the temperature to 37°C, followed by 10 μM primidone at room temperature to facilitate return of Ca2+ to baseline, finally 25 μM PregS was applied. (D) The change in 340/380 ratio induced by 37°C expressed as a fraction of the response to 25 μM PregS. (E) 340/380 ratios at baseline, in response to 37°C and in response to 25 μM PregS. Each symbol represents the average value from all PregS-responsive cells from one coverslip, lines connect data points from the same coverslip. Each coverslips had around 70–80 PregS-responsive cells in the WT group; 35–45 for P1092Q, and 15–25 for V992M. Data were collected from three independent transfections.
Figure 3
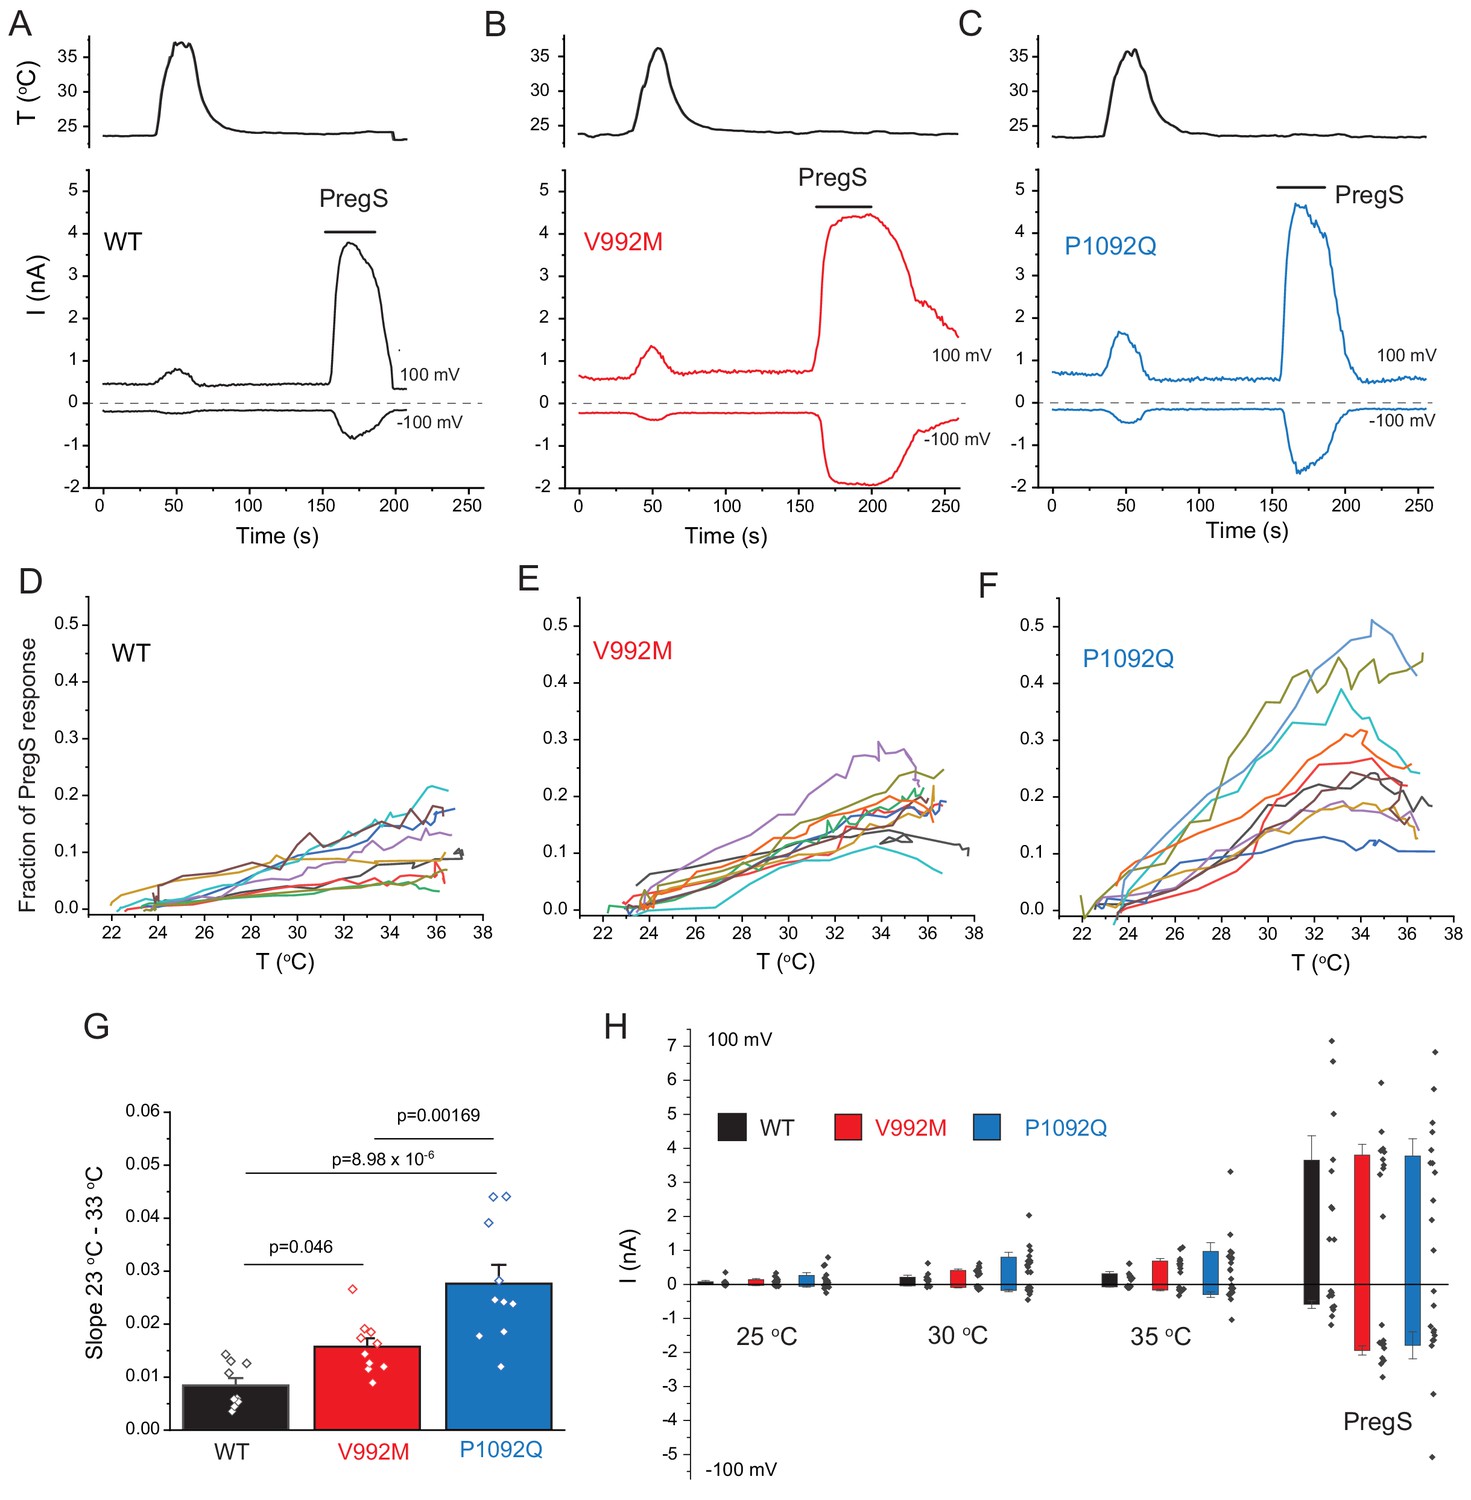
Disease-associate mutations increase temperature sensitivity of TRPM3. HEK293 cells were transfected with the human TRPM3α2, or its mutants; whole-cell patch clamp electrophysiology was performed as descried in the Materials and methods section using a ramp protocol from −100 to 100 mV.
(A-C) Representative measurements, top panels show temperature recordings, bottom panels show currents at 100 mV and −100 mV. The applications of 100 μM PregS are indicated by the horizontal lines. (D-F) The heat-induced current amplitudes at 100 mV were normalized to the currents induced by PregS and plotted as a function of the temperature from the same data presented in panels A-C. (G) Summary of the slopes of the current increases between 23°C and 33°C determined from linear fits from panels D-F. (H) Summary of current amplitudes at 100 and −100 mV induced by increasing the temperature to 25°C, 30°C and 35°C as well as in response to PregS.
Figure 4 with 3 supplements
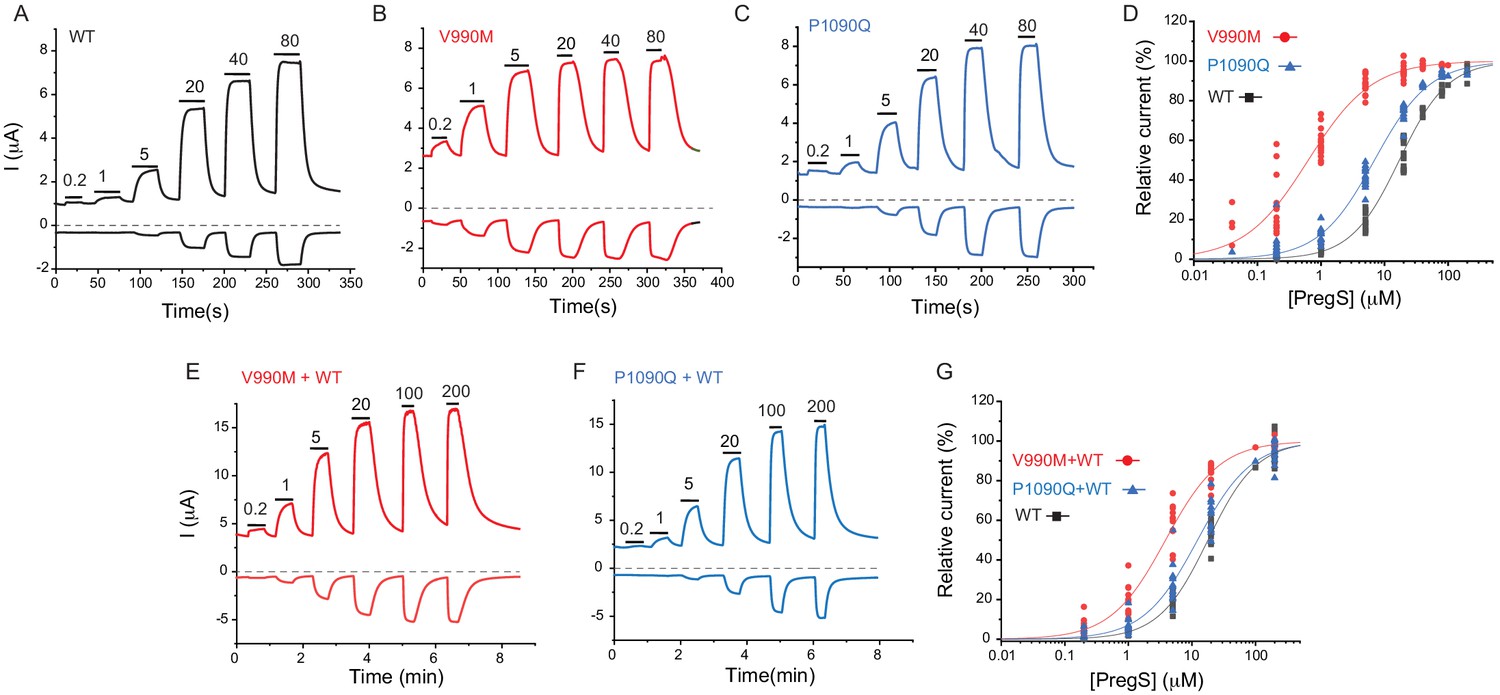
Disease-associated mutations increase sensitivity of TRPM3 to PregS.
Two electrode voltage clamp experiments in oocytes expressing the hTRPM31325 splice variant and its mutants were performed as described in the Materials and methods section using a ramp protocol from −100 to 100 mV every 0.5 s. (A-C) Representative measurements for wild-type (A), V990M (B) and P1090Q (C); top traces show currents at +100 mV, bottom traces at −100 mV, dashed line shows zero current. The applications of different concentrations of PregS (μM) are indicated by the horizontal lines. (D) Hill fits of the concentration dependence of the effect of PregS at 100 mV for wild-type and mutant channels. The EC50 values were 17.1 ± 0.9 μM for wild-type channels, 0.63 ± 0.05 μM for V990M and 6.94 ± 0.38 μM for P1090Q. (E-F) Representative traces for measurements in oocytes injected with cRNA for wild type and mutant channels (1:1 ratio). (G) Hill fits of the concentration dependence of the effects of PregS at 100 mV for wild type and mutant channel combinations; symbols represent individual oocytes from two different preparations. The EC50 values were 17.8 ± 1.04 μM for wild-type channels, 3.83 ± 0.27 μM for V990M + WT and 12.2 ± 1.1 μM for P1090Q + WT.
Figure 4—figure supplement 1
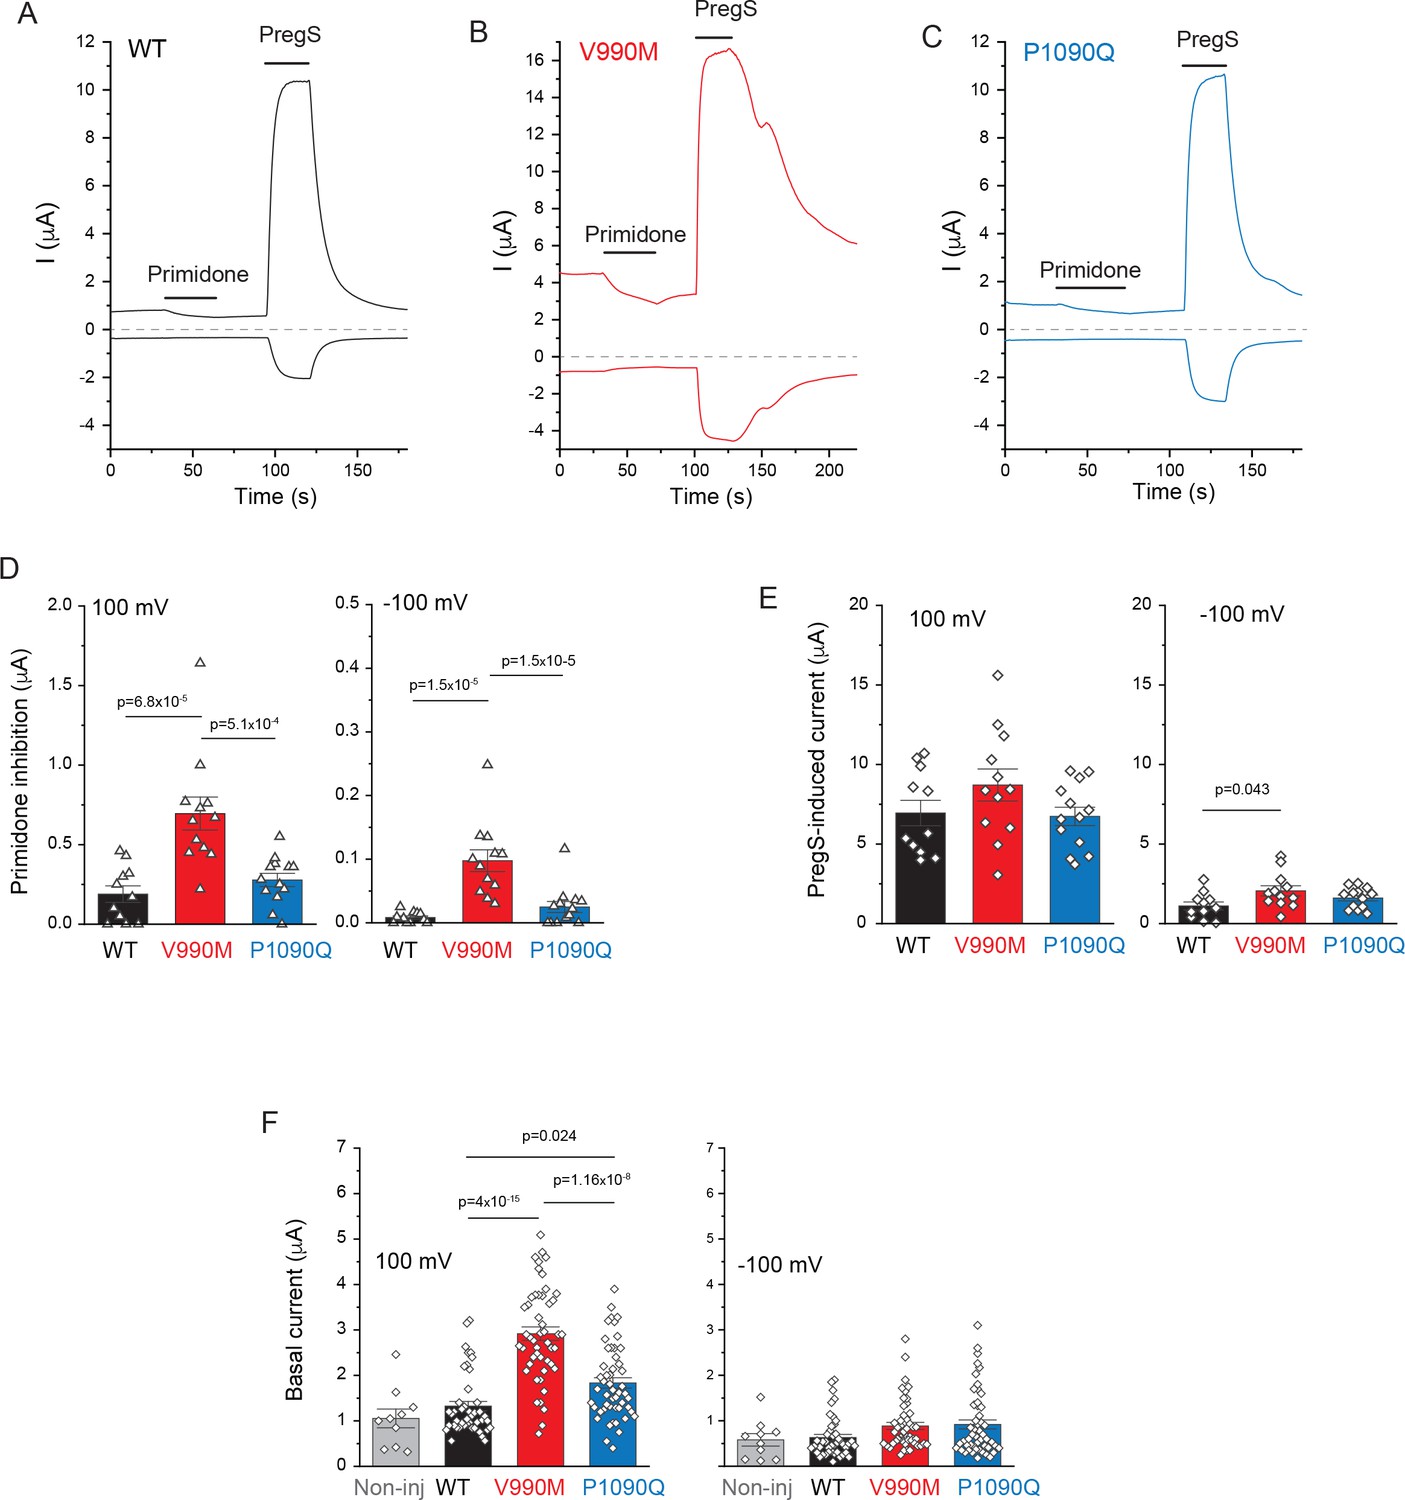
Basal channel activity in disease-associated mutants of TRPM3.
Two electrode voltage clamp experiments in oocytes expressing the hTRPM31325 splice variant and its mutants were performed as described in the Materials and methods section. (A-C) Representative measurements for wild-type (A), V990M (B) and P1090Q (C) top traces show currents at 100 mV, bottom traces at −100 mV, dashed lines show zero currents. The applications of 50 μM primidone and 100 μM PregS are indicted by the horizontal lines. (D) Summary of current inhibition evoked by primidone at 100 mV (left) and −100 mV (right). (E) Summary of current amplitudes evoked by 100 μM PregS at 100 mV (left) and −100 mV (right). Bars represent mean ± SEM and scatter plots for individual oocytes from two independent oocyte preparations. (F) Basal currents are increased in disease-associated mutants of TRPM3. Current amplitudes are plotted at 100 mV (left) and at −100 mV (right) before application of any agonist. Data are pooled from five different oocyte preparations from experiments shown in Figure 4; Figure 4—figure supplement 2; Figure 4—figure supplement 3; bars represent mean ± SEM and scatter plots. Statistical significance was calculated with one-way analysis of variance with Bonferroni post hoc test for panels D-F.
Figure 4—figure supplement 2

Increased temperature activation in disease-associated mutants of TRPM3.
Two electrode voltage clamp experiments in oocytes expressing the hTRPM31325 splice variant and its mutants were performed as described in the Materials and methods section. (A-C) Representative measurements for wild-type (A), V990M (B) P1090Q (C), and non-injected oocytes (D), top traces show currents at +100 mV, bottom traces at −100 mV, dashed line shows zero current. The temperature curves are shown above the current traces, and the applications of 50 μM PregS are indicated by the horizontal lines. (E) Summary of the temperature responses expressed as a fraction of the currents induced by 50 μM PregS in the same measurements. (F) Current amplitudes induced by increased temperatures and by PregS; symbols represent responses in individual oocytes from two different oocyte preparations; lines connect measurements in the same oocytes, bars are mean ± SEM. The current amplitudes induced by 50 μM PregS were, on average, smaller in both mutants than in wild type in these experiments, most likely because oocytes expressing these mutants showed substantially higher rate of death than those injected with wild type TRPM3, therefore the oocytes we used for electrophysiology were selected for lower expression. To be able to compare temperature-induced currents, we normalized current amplitudes to those induced by 50 μM PregS in panel E.
Figure 4—figure supplement 3
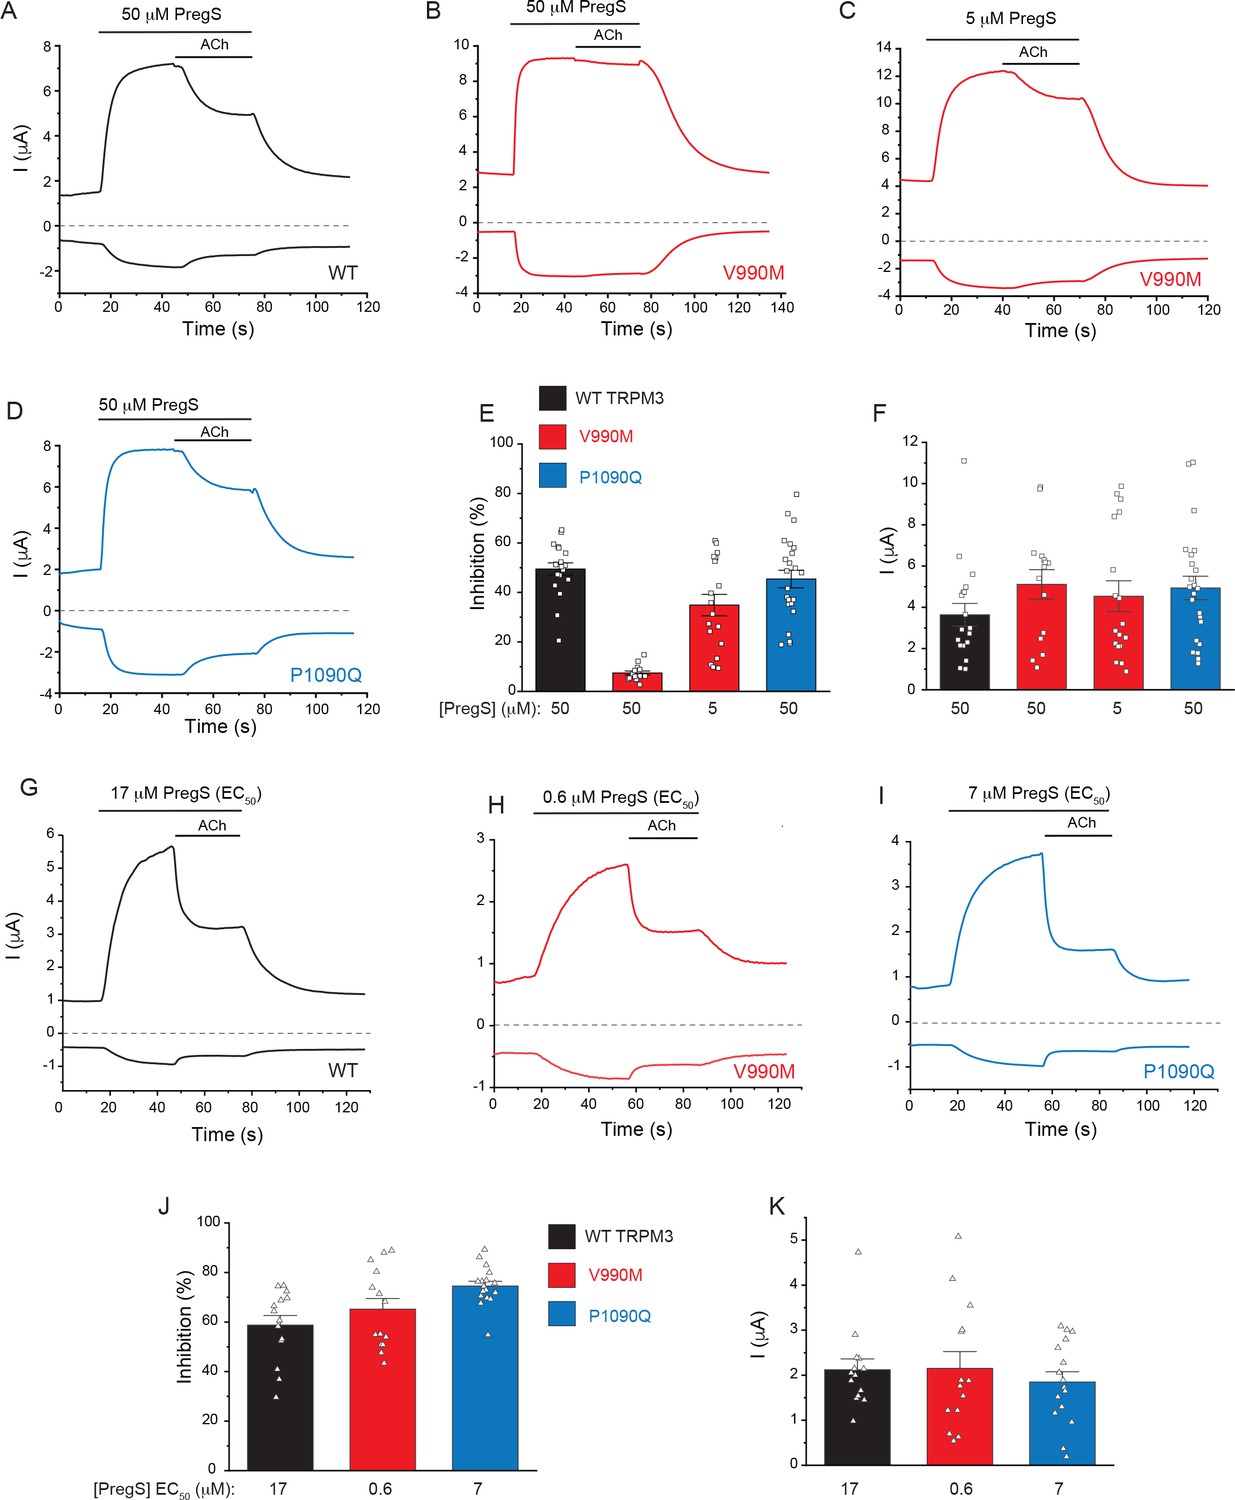
M2 muscarinic receptor inhibition of wild type and mutant TRPM3 channels.
Two electrode voltage clamp experiments in oocytes expressing the hTRPM31325 splice variant and its mutants were performed as described in the Materials and methods. (A-D) Representative measurements for wild-type (A), V990M (B,C) and P1090Q (D); top traces show currents at +100 mV, bottom traces at −100 mV, dashed line shows zero current. The applications of 50 μM or 5 μM PregS and 5 μM ACh are indicated by the horizontal lines. (E) Summary of current inhibition in wild type and mutant TRPM3 channels at 100 mV. (F) Summary of current amplitudes at 100 mV. (G-I) Representative traces for the effect of M2 activation of channels stimulated by EC50 concentrations of PregS for wild-type (G), V990M (H) and P1090Q (I). (J) Summary of current inhibition; (K) Summary of current amplitudes. Data are shown as mean ± SEM and scatter plots. Symbols represent individual oocytes from three (A-D) and two (G-H) different preparations.
Tables
Key resources table
| Reagent type (species) or resource | Designation | Source or reference | Identifiers | Additional information |
|---|---|---|---|---|
| Recombinant DNA reagent | hTRPM3α2; hTRPM3 variant 10 | Genescript | NM_001366141.2 | In pCDNA3.1(+); tagged with GFP on its N-terminus |
| Recombinant DNA reagent | hTRPM3α2-V992M | Genescript | NM_001366141.2 Modified by V992M mutation | In pCDNA3.1(+); tagged with GFP on its N-terminus |
| Recombinant DNA reagent | hTRPM3α2-P1092Q | Genescript | NM_001366141.2 Modified by P1092Q mutation | In pCDNA3.1(+); tagged with GFP on its N-terminus |
| Recombinant DNA reagent | hTRPM31325 | Grimm et al 203 JBC, 278, 21493 | AJ505026 | Original clone was subcloned into the pGEMSH oocyte vector |
| Recombinant DNA reagent | GCaMP6f | Addgene | # 40755 RRID:Addgene_40755 | |
| Cell line (human) | HEK293 | ATCC | CRL-1573, RRID:CVCL_0045 | |
| Strain, strain background | Xenopus Leavis | Nasco | LM00535 | Female frogs to extract oocytes |
| Commercial assay or kit | mMessage mMachine | Thermo Fisher Scientific | Catalogue # AM1344 | In vitro transcription kit |
| Commercial assay or kit | Effectene | Qiagen | Catalogue # 301425 | Transfection reagent |
| Commercial assay or kit | QuikChange II XL | Agilent Technologies | Catalogue # 200522 | Site-Directed Mutagenesis Kit |
| Chemical compound, drug | Pregnenolone Sulfate | Cayman Chemicals | Catalogue # 21004 | TRPM3 agonist |
| Chemical compound, drug | CIM0126 | Calbiochem | Catalogue # 534359 | TRPM3 agonist |
| Chemical compound, drug | Primidone | Sigma | Catalogue # p7295 | TRPM3 antagonist |
| Chemical compound, drug | Ionomycin | Cayman Chemicals | Catalogue # 56092-81-0 | Calcium ionophore |
| Chemical compound, drug | Fura2-AM | Invitrogen | Catalogue # F1221 RRID:AB_11156243 | Calcium indicator; |
| Software, algorithm | Origin 2019b | Originlab.com | ||
| Software, algorithm | pClamp10.6 | Molecular Devices | RRID:SCR_011323 | |
| Software, algorithm | Image Master 5 | Photon Technology International | ||
| Software, algorithm | Prism6 | www.graphpad.com |
Additional files
Download links
A two-part list of links to download the article, or parts of the article, in various formats.
Downloads (link to download the article as PDF)
Open citations (links to open the citations from this article in various online reference manager services)
Cite this article (links to download the citations from this article in formats compatible with various reference manager tools)
Disease-associated mutations in the human TRPM3 render the channel overactive via two distinct mechanisms
eLife 9:e55634.
https://doi.org/10.7554/eLife.55634


