Developmental loss of MeCP2 from VIP interneurons impairs cortical function and behavior
- Department of Neuroscience, Yale University, United States
- Dominick P. Purpura Department of Neuroscience, Albert Einstein College of Medicine, United States
- Kavli Institute for Neuroscience, Yale University, United States
Figures
Figure 1 with 2 supplements
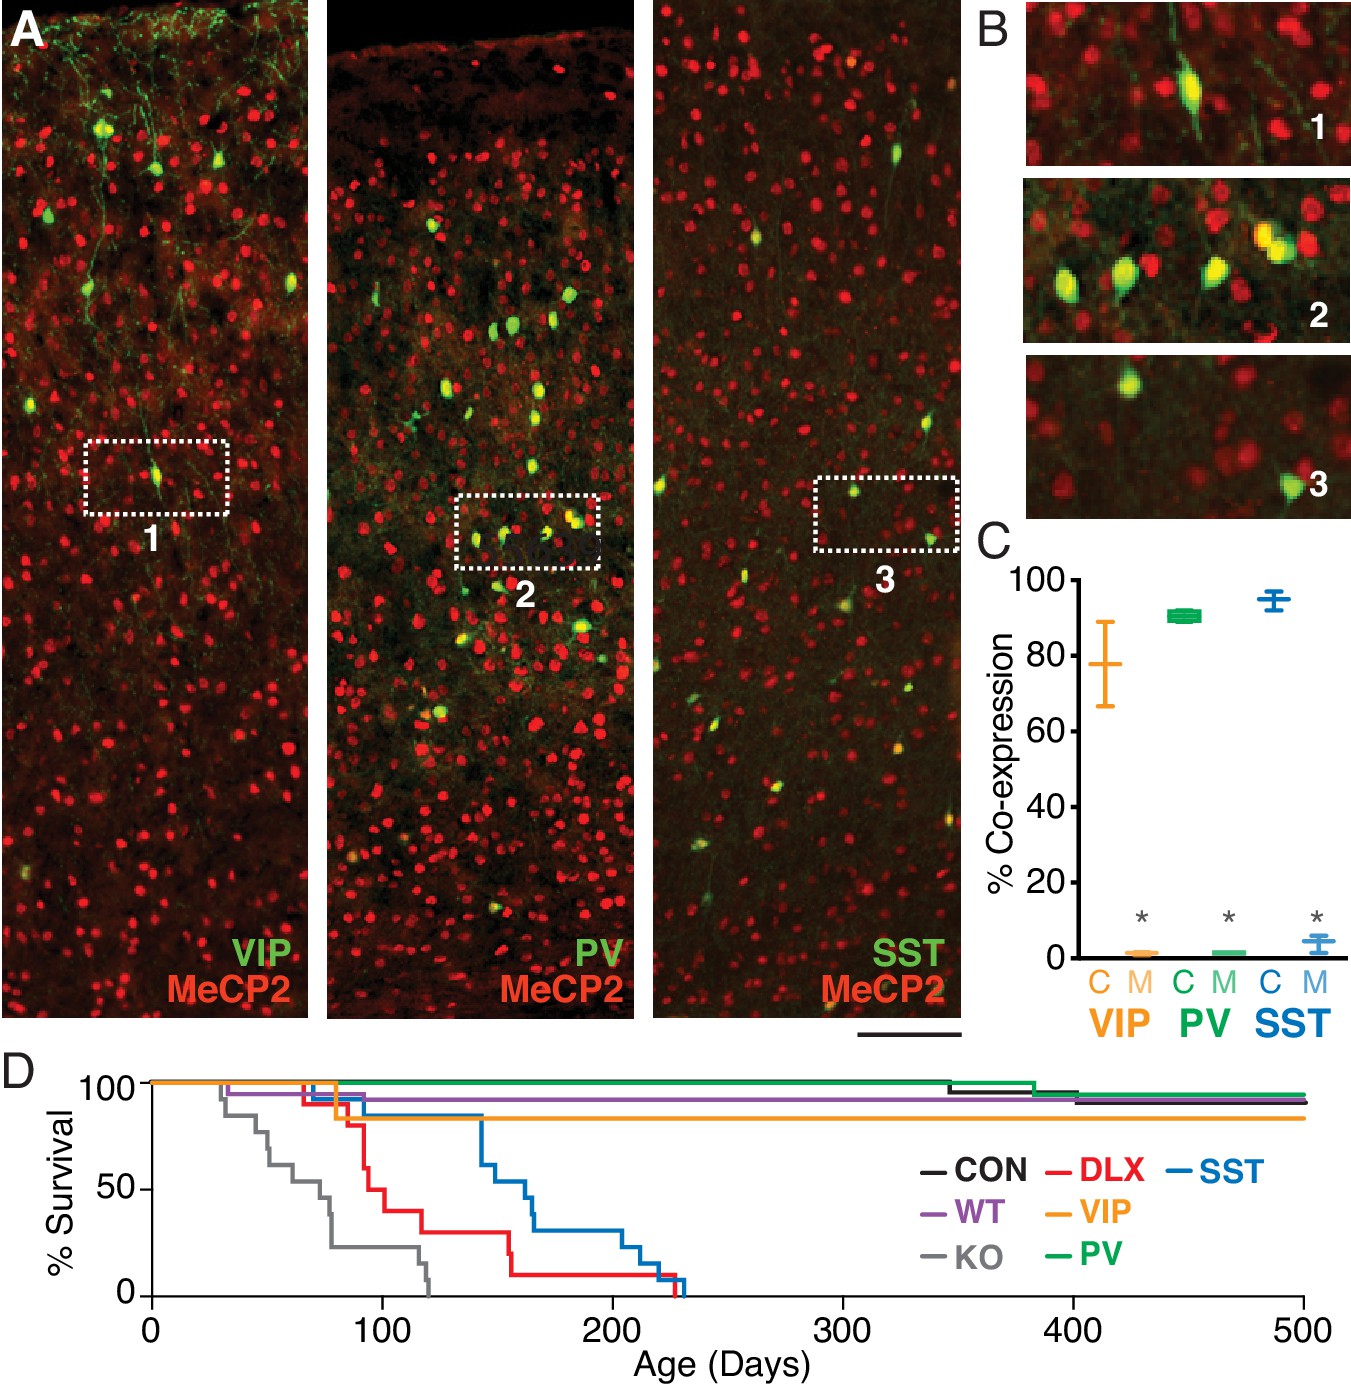
MeCP2 is expressed in three major GABAergic interneuron classes.
(A) Co-staining for interneuron markers (green) and MeCP2 (red) reveals a high degree of co-expression in VIP (left), PV (middle), and SST (right) interneurons in the cortex. Scale bar denotes 100 μm. (B) Expanded view of insets 1–3 from panel (A). (C) Crossing interneuron-specific Cre lines with the conditional Mecp2 line results in near-complete removal of MeCP2 expression from each target population in mutants (M) as compared to controls (C) (n = 4 mice per group). (D) Cumulative distribution plots of survival for controls (CON; black; n = 38), wild-types (WT; magenta; n = 10), and Mecp2-/y (KO; gray; n = 10), Dlx5/6 (DLX; red; n = 13), VIP (orange; n = 8), PV (green; n = 22), and SST (cyan; n = 36) mutants. *, p<0.05.
-
Figure 1—source data 1
Statistical values for Figure 1, Figure 1—figure supplement 1, and Figure 1—figure supplement 2.
- https://cdn.elifesciences.org/articles/55639/elife-55639-fig1-data1-v2.xlsx
Figure 1—figure supplement 1
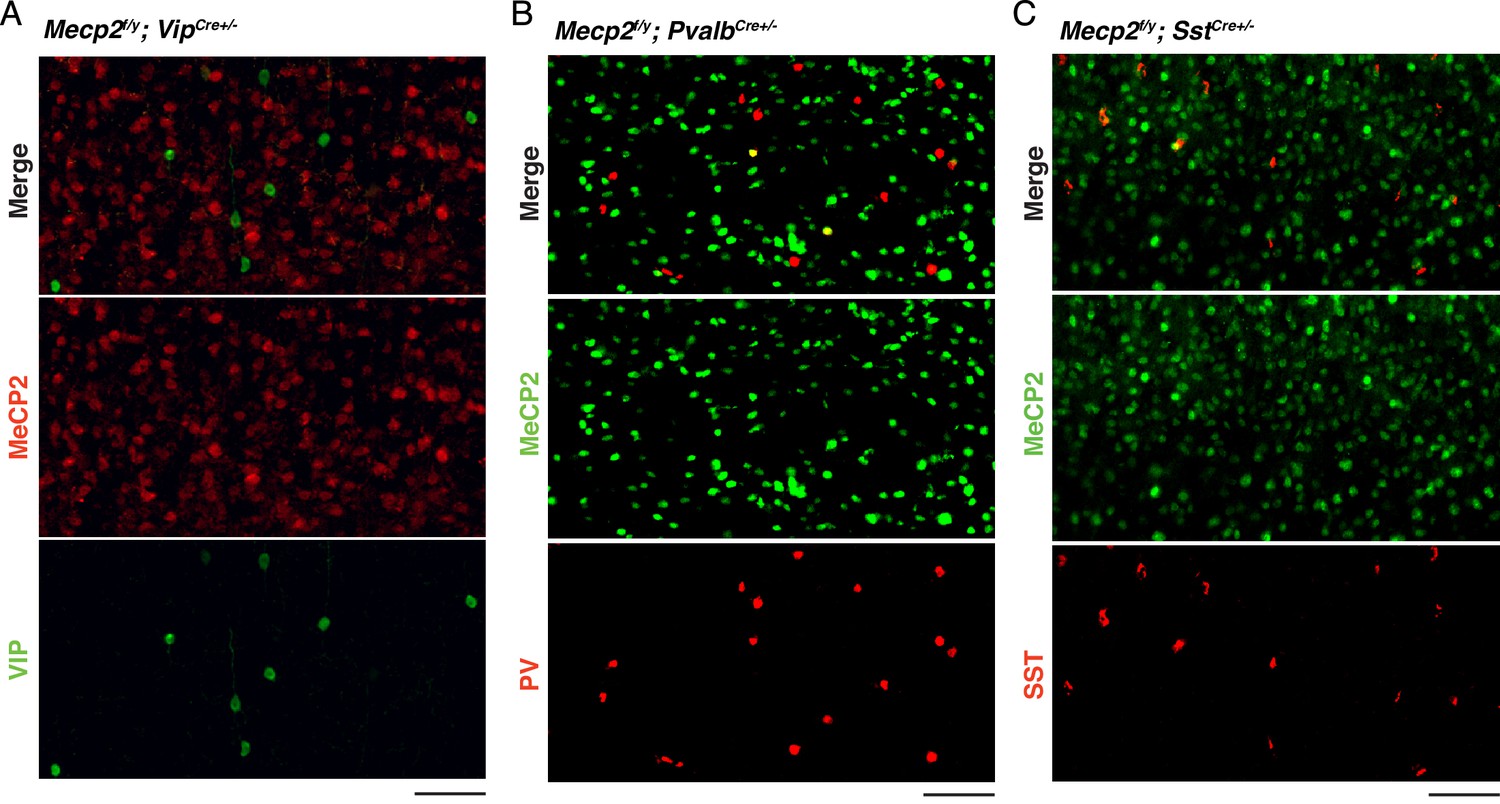
MeCP2 expression in conditional deletion mice.
(A) Staining for MeCP2 (red) and VIP (green) in a Mecp2f/y VipCre+/– mouse. (B) Staining for MeCP2 (green) and PV (red) in an Mecp2f/y PvalbCre+/– mouse. (C) Staining for MeCP2 (green) and SST (red) in an Mecp2f/y SstCre+/– mouse. Scale bars denote 100 μm.
Figure 1—figure supplement 2
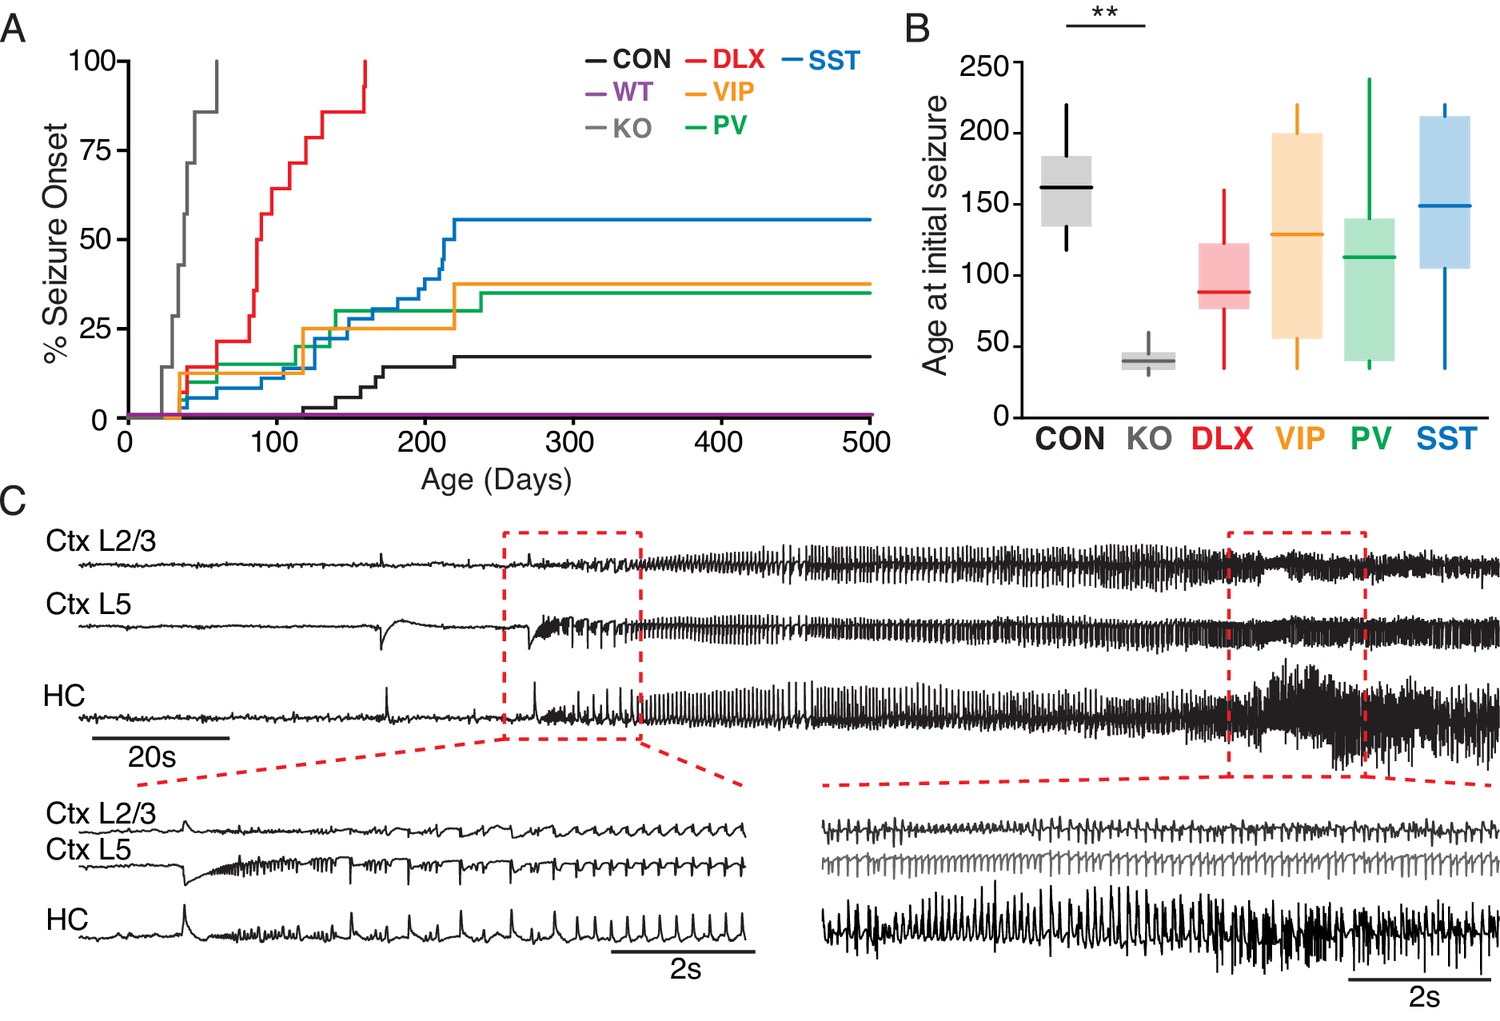
Seizure incidence following conditional deletion of Mecp2 from GABAergic interneurons.
(A) Cumulative distribution plot of the ages at which animals exhibited initial seizure activity for Mecp2f/y controls (CON; black; n = 38), wild-types (WT; magenta; n = 10), Mecp2–/y (KO, gray; n = 10), and Dlx5/6 (DLX; red; n = 13), VIP (orange; n = 8), PV (green; n = 22), and SST (cyan; n = 36) mutants. (B) Mean age at initial seizure for Mecp2f/y controls (n = 7) and Mecp2–/y (n = 10), Dlx5/6 (n = 13), VIP (n = 3), PV (n = 7), and SST (n = 19) mutants. (C). Example local field potential recordings from parietal cortical layers 2/3 and 5 and from the CA1 of the hippocampus showing spontaneous ictal activity in an awake SstCre+/–Mecp2 f/y animal at P220. **, p<0.01.
Figure 2 with 3 supplements
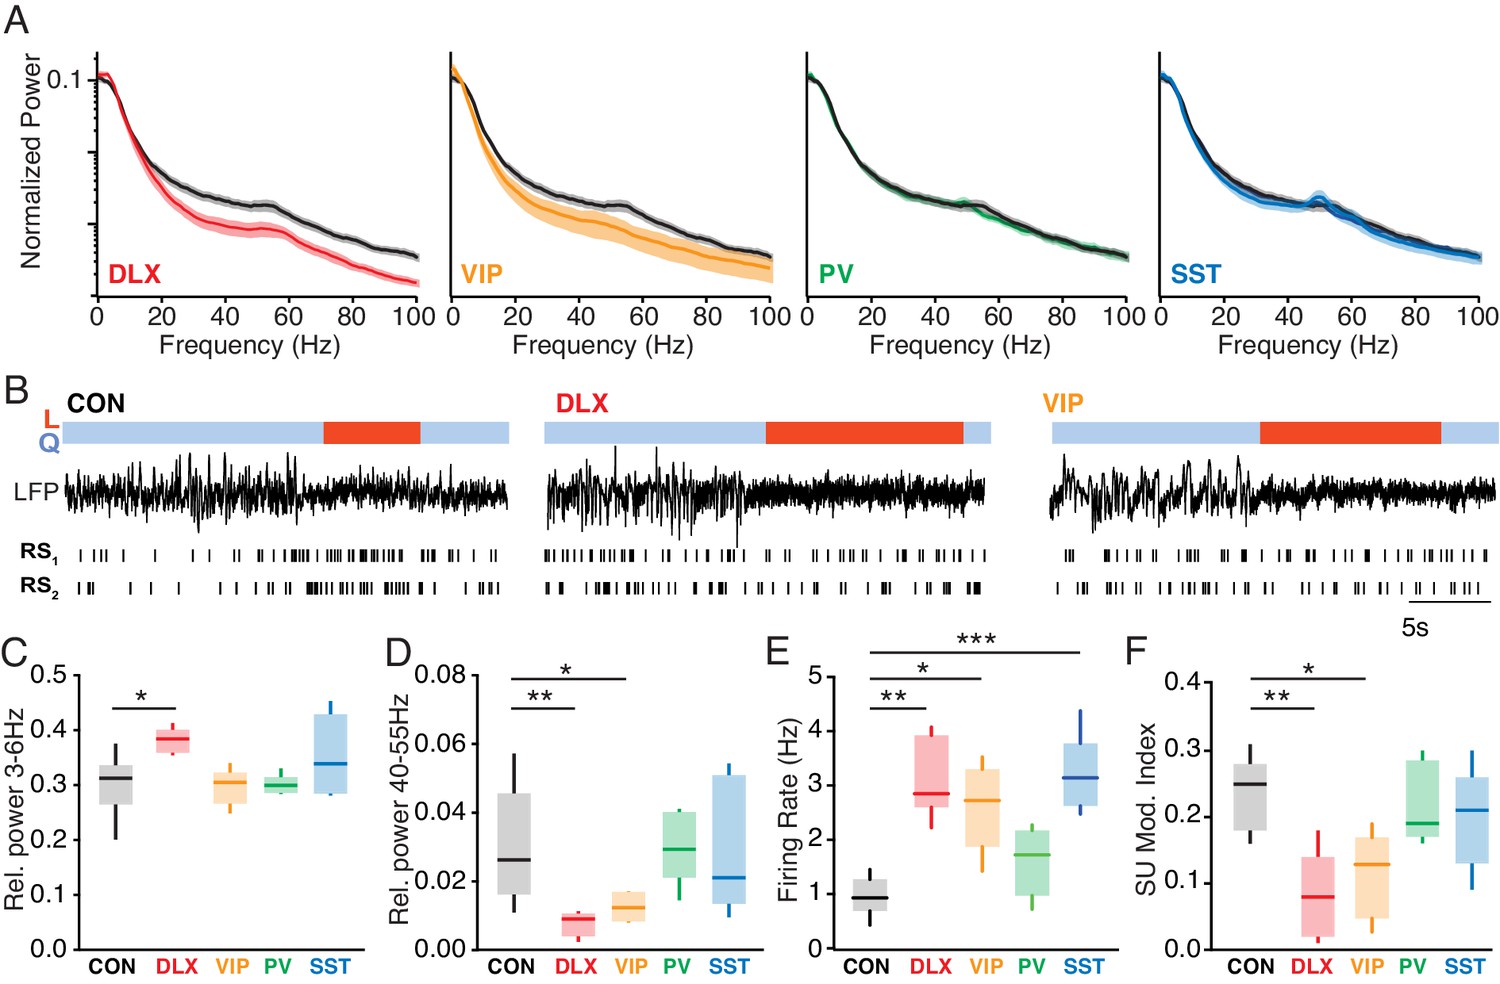
Altered state-dependent cortical activity following Mecp2 deletion from VIP interneurons.
(A) Population-averaged normalized cortical power spectra during quiescent sitting periods for Dlx5/6 mutants (red), VIP mutants (orange), PV mutants (green), and SST mutants (blue) compared to Mecp2f/y controls (black). (B) Example cortical LFP traces and raster plots for regular spiking (RS), putative pyramidal neurons during quiescence (Q, blue) and locomotion (L, red) periods in a Mecp2f/y control (CON), a Dlx5/6 mutant, and a VIP mutant. (C) Cortical relative LFP power in the 3–6 Hz band in during quiescent periods in Mecp2f/y controls (black; n = 12) and in Dlx5/6 (red; n = 5), VIP (orange; n = 6), PV (green; n = 6), and SST (cyan; n = 8) mutants. (D) Cortical relative LFP power in the 40–55 Hz band during quiescence. (E) Population-averaged single-unit firing rate of cortical RS cells during quiescence in Mecp2f/y controls (n = 7) and Dlx5/6 (n = 5), VIP (n = 5), PV (n = 5), and SST (n = 7) mutants. (F) Modulation of single-unit firing rate at locomotion onset in each group, measured as an index value. *, p<0.05; **, p<0.01; ***, p<0.001.
-
Figure 2—source data 1
Statistical values for Figure 2, Figure 2—figure supplement 1, Figure 2—figure supplement 2, and Figure 2—figure supplement 3.
- https://cdn.elifesciences.org/articles/55639/elife-55639-fig2-data1-v2.xlsx
Figure 2—figure supplement 1
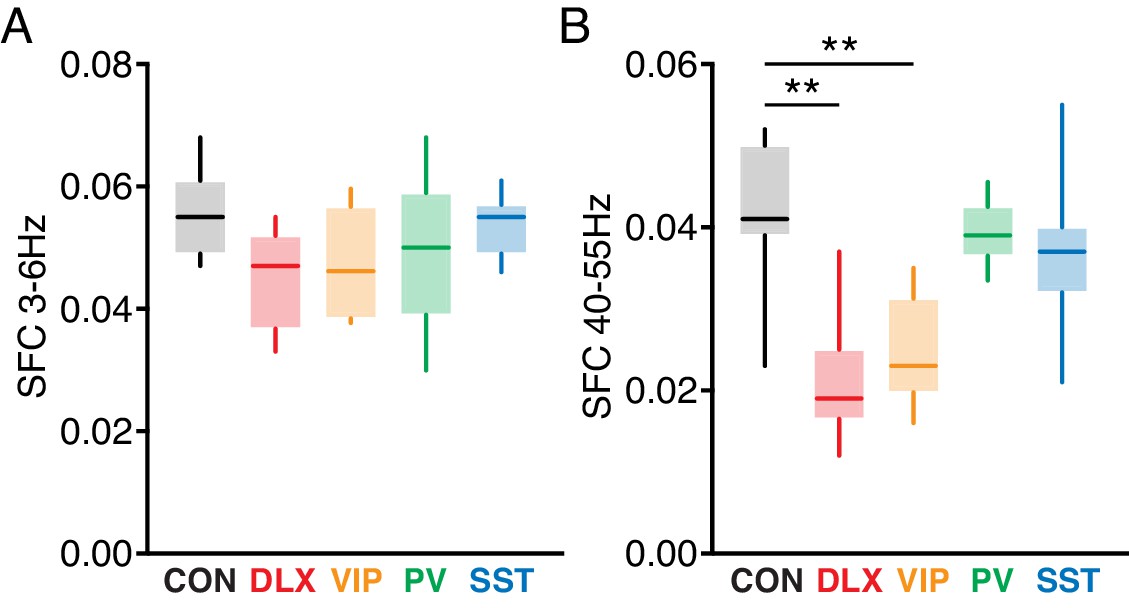
Alteration in the temporal pattern of spiking.
(A) Mean spike-field coherence (SFC) in the 3–6 Hz band for units recorded in Mecp2f/y controls (n = 7) and in Dlx5/6 (n = 5), VIP (n = 5), PV (n = 5), and SST (n = 7) mutants. (B) Mean SFC in the 40–55 Hz band. **, p<0.01.
Figure 2—figure supplement 2
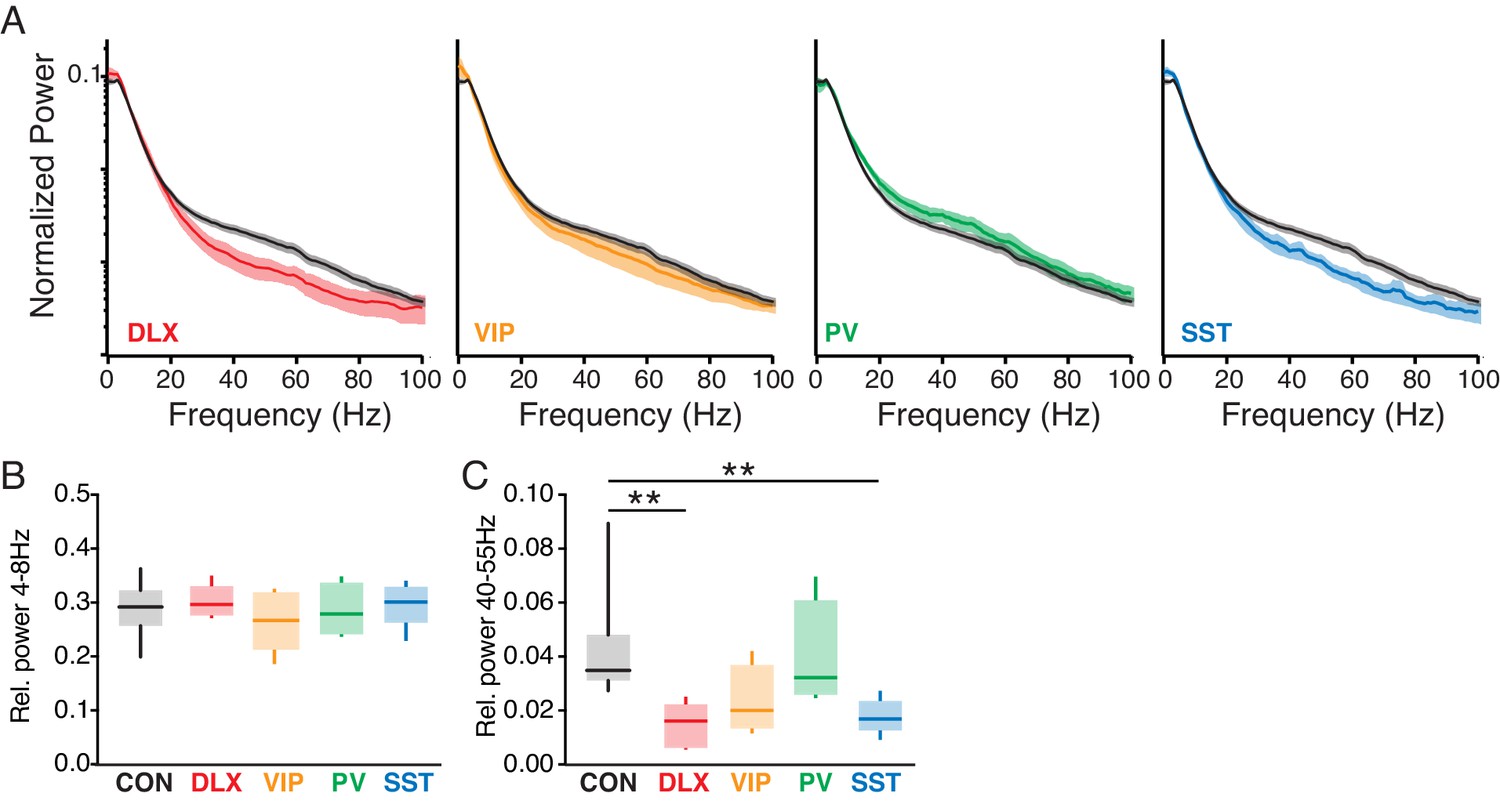
Altered hippocampal activity patterns in Mecp2 mutants.
(A) Population-averaged normalized hippocampal CA1 power spectra during quiescent sitting periods for Dlx5/6 mutants (red; n = 5), VIP mutants (orange; n = 5), PV mutants (green; n = 4), and SST mutants (blue; n = 6) compared to Mecp2f/y controls (black; n = 9). (B) Population-averaged hippocampal relative LFP power in the theta (4–8 Hz) band in each group. (C) Hippocampal relative LFP power in the gamma (40–55 Hz) band in each group. **, p<0.01.
Figure 2—figure supplement 3
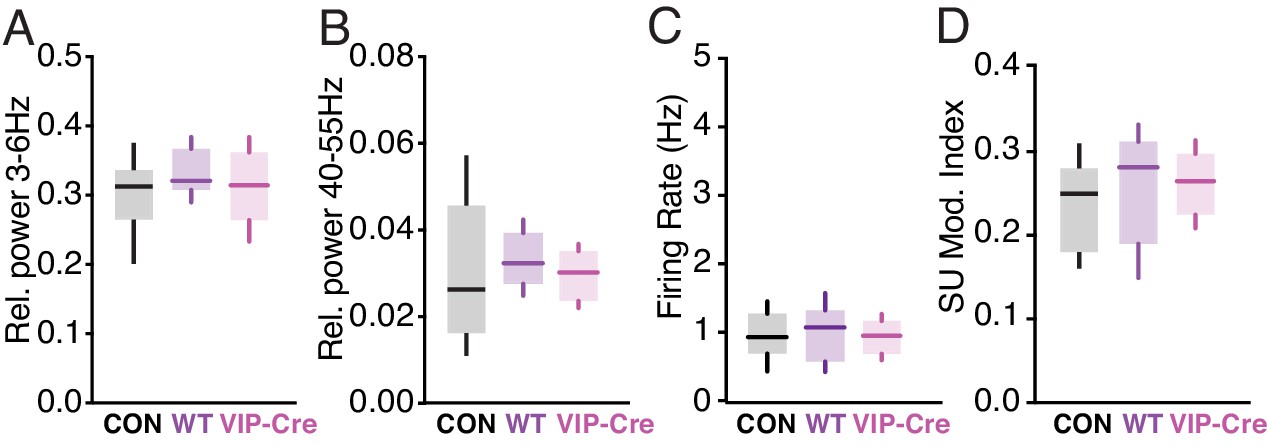
No difference in neural activity among control groups.
(A) Cortical relative LFP power in the 3–6 Hz band during quiescent periods in Mecp2f/y controls (black; n = 12), wild-types (magenta; n = 6), and VipCre animals (pink; n = 7). (B) Cortical relative power in the 40–55 Hz band during quiescence. (C) Population-averaged single-unit firing rate of RS cells during quiescence in Mecp2f/y controls (n = 7), wild-types (n = 9), and VipCre controls (n = 7). (D) Modulation of single-unit firing rate in each group at locomotion onset, measured as an index value.
Figure 3 with 2 supplements
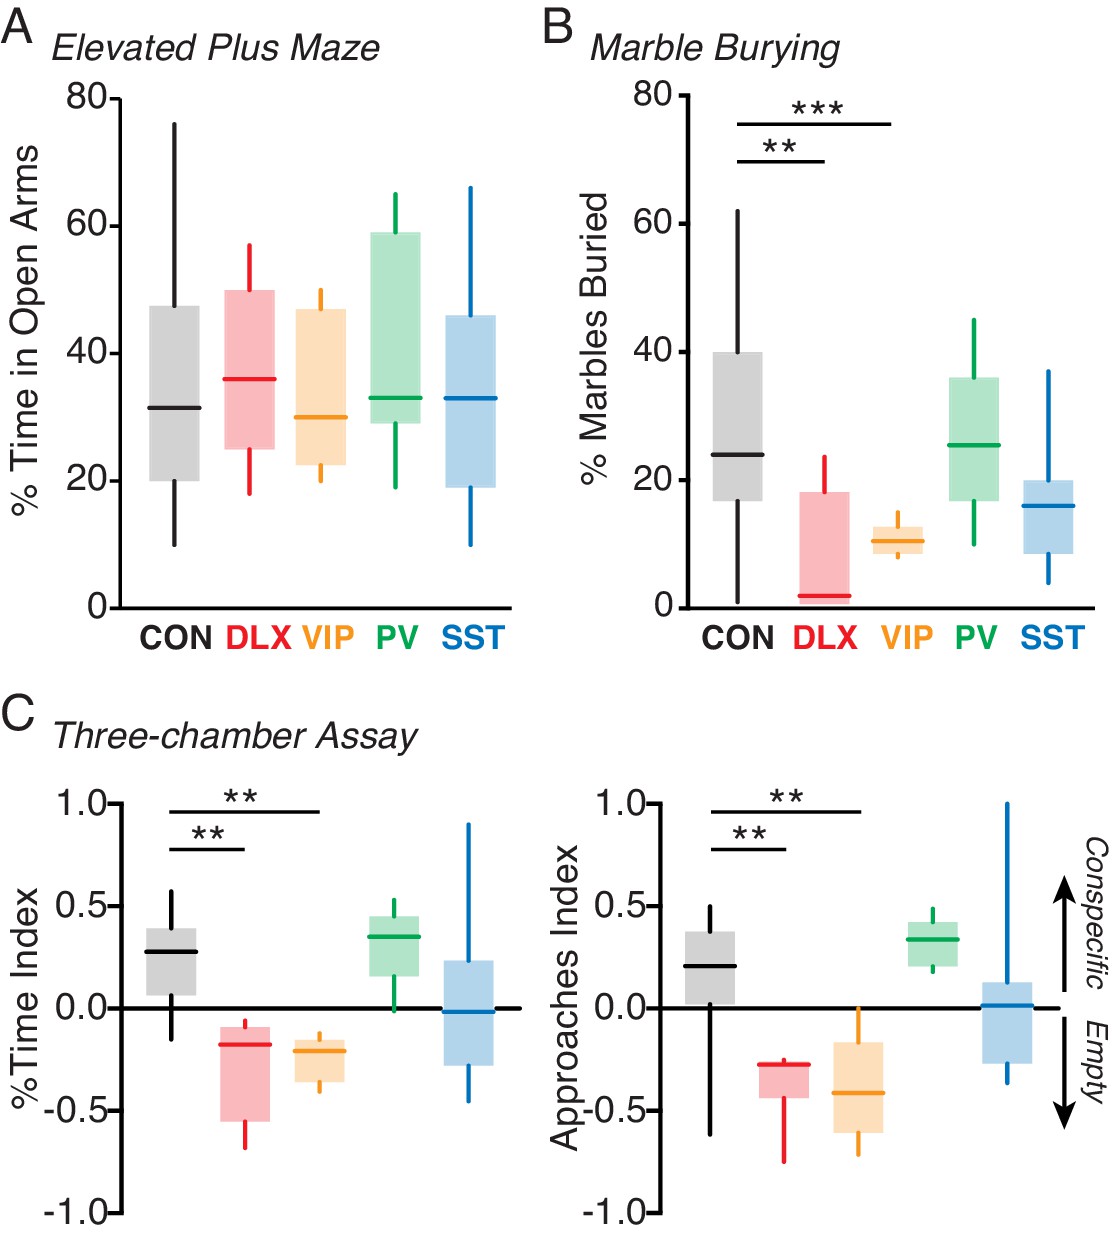
Loss of MeCP2 in VIP interneurons disrupts behavior.
(A) Mean time spent in the open arms of the elevated plus maze for Mecp2f/y controls (CON; black; n = 18) and Dlx5/6 (red; n = 5), VIP (orange; n = 5), PV (green; n = 7), and SST (cyan; n = 14) mutants. (B) Mean percentage of marbles buried by controls (n = 16) and by Dlx5/6 (n = 5), VIP (n = 8), PV (n = 6), and SST (n = 12) mutants. (C) Left: preference index for time spent with an unfamiliar conspecific in a small holding cage versus an empty cage for Mecp2f/y controls (n = 16) and Dlx5/6 (n = 7), VIP (n = 6), PV (n = 5), and SST (n = 14) mutants. Right: preference index for approaches made to within 5 cm of the conspecific or the empty holding cage for each group. **, p<0.01; ***, p<0.001.
-
Figure 3—source data 1
Statistical values for Figure 3, Figure 3—figure supplement 1, and Figure 3—figure supplement 2.
- https://cdn.elifesciences.org/articles/55639/elife-55639-fig3-data1-v2.xlsx
Figure 3—figure supplement 1
Social behavior preferences are disrupted by Mecp2 deletion from VIP interneurons.
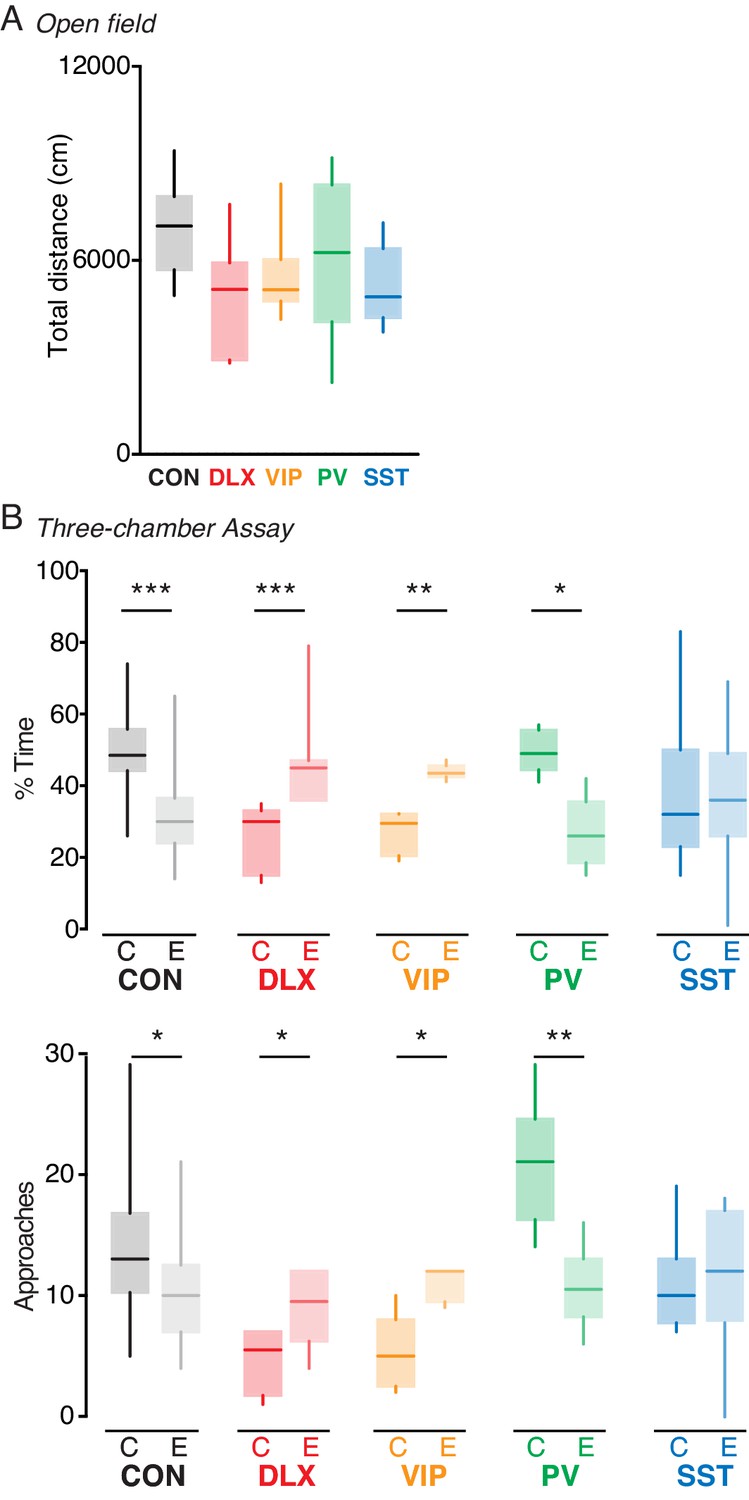
(A) Total distance traveled in the open field assay for the Mecp2f/y controls (CON; black; n = 15) and for Dlx5/6 (red; n = 13), VIP (orange; n = 5), PV (green; n = 8), and SST (cyan; n = 14) mutant mice. (B) Upper: mean percentage of time spent with an unfamiliar conspecific (C) in a small holding cage versus time spent in an empty cage (E) for Mecp2f/y controls (n = 14) and for Dlx5/6 (n = 7), VIP (n = 6), PV (n = 13), and SST (n = 6) mutants. Lower: mean number of approaches made to within 5 cm of the conspecific or the empty holding cage for each group. *, p<0.05; **, p<0.01; ***, p<0.001.
Figure 3—figure supplement 2
No difference in behavior among control groups.
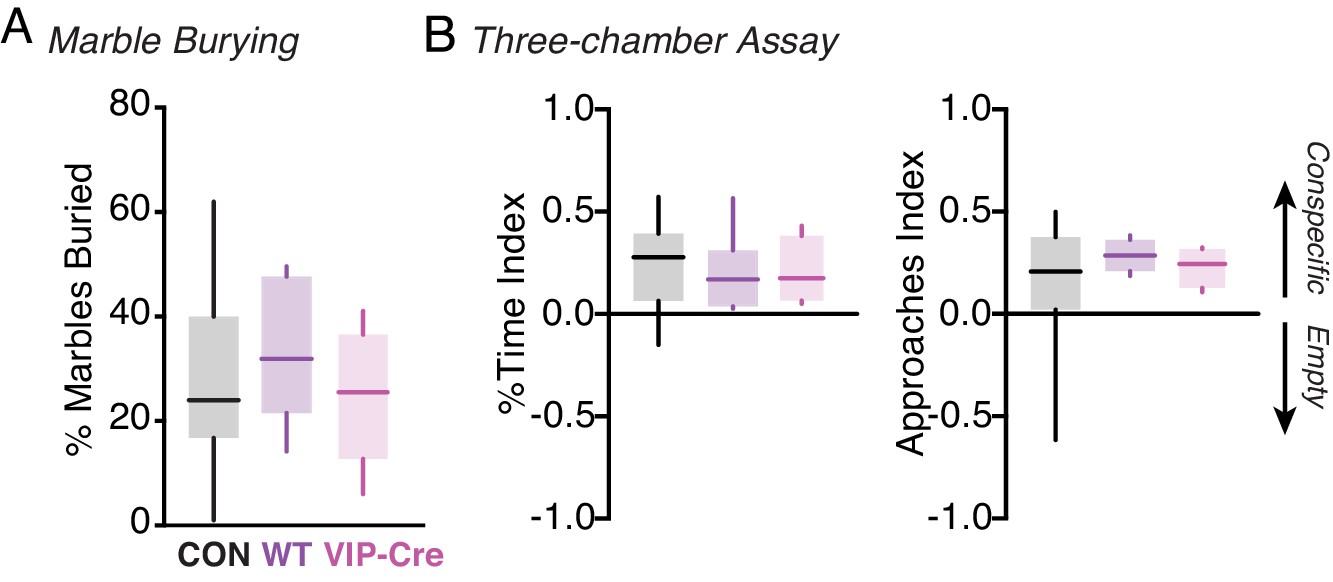
(A) Mean percentage of marbles buried by Mecp2f/y controls (n = 16), wild-types (n = 5), and VipCre controls (n = 4). (B) Left: preference index for time spent with an unfamiliar conspecific in a small holding cage versus time spent in an empty cage for Mecp2f/y controls (n = 16), wild-types (n = 6), and VipCre controls (n = 4). Right: preference index for approaches made to within 5 cm of the conspecific or the empty holding cage for each group.
Additional files
-
Supplementary file 1
Consequences of cell-type-specific Mecp2 deletion.
Summary table of phenotypes observed in conditional deletion mice with loss of Mecp2 function in GABAergic interneurons (upper) and glutamatergic excitatory neurons (lower). Observed phenotypes are noted as Y/N, assays that were not performed in a given study are left blank. The two distinct PvalbCre mouse lines used by different studies are identified by their JAX line numbers.
- https://cdn.elifesciences.org/articles/55639/elife-55639-supp1-v2.xlsx
-
Transparent reporting form
- https://cdn.elifesciences.org/articles/55639/elife-55639-transrepform-v2.pdf
Download links
A two-part list of links to download the article, or parts of the article, in various formats.
Downloads (link to download the article as PDF)
Open citations (links to open the citations from this article in various online reference manager services)
Cite this article (links to download the citations from this article in formats compatible with various reference manager tools)
Developmental loss of MeCP2 from VIP interneurons impairs cortical function and behavior
eLife 9:e55639.
https://doi.org/10.7554/eLife.55639


