The antibiotic bedaquiline activates host macrophage innate immune resistance to bacterial infection
- Unit for Integrated Mycobacterial Pathogenomics, CNRS UMR 3525, Institut Pasteur, France
- Université Paris Diderot, Sorbonne Paris Cité, Cellule Pasteur, France
- Mycobacterial Genetics Unit, Institut Pasteur, France
- Bioinformatics and Biostatistics, Department of Computational Biology, USR 3756 CNRS, Institut Pasteur, France
- MRC Centre for Molecular Bacteriology and Infection, Department of Life Sciences, Faculty of Natural Sciences, Imperial College London, United Kingdom
- Host-Pathogen Interactions in Tuberculosis Laboratory, The Francis Crick Institute, United Kingdom
- Department of Tuberculosis Control and Prevention, Shenzhen Nanshan Center for Chronic Disease Control, China
Figures
Figure 1 with 2 supplements
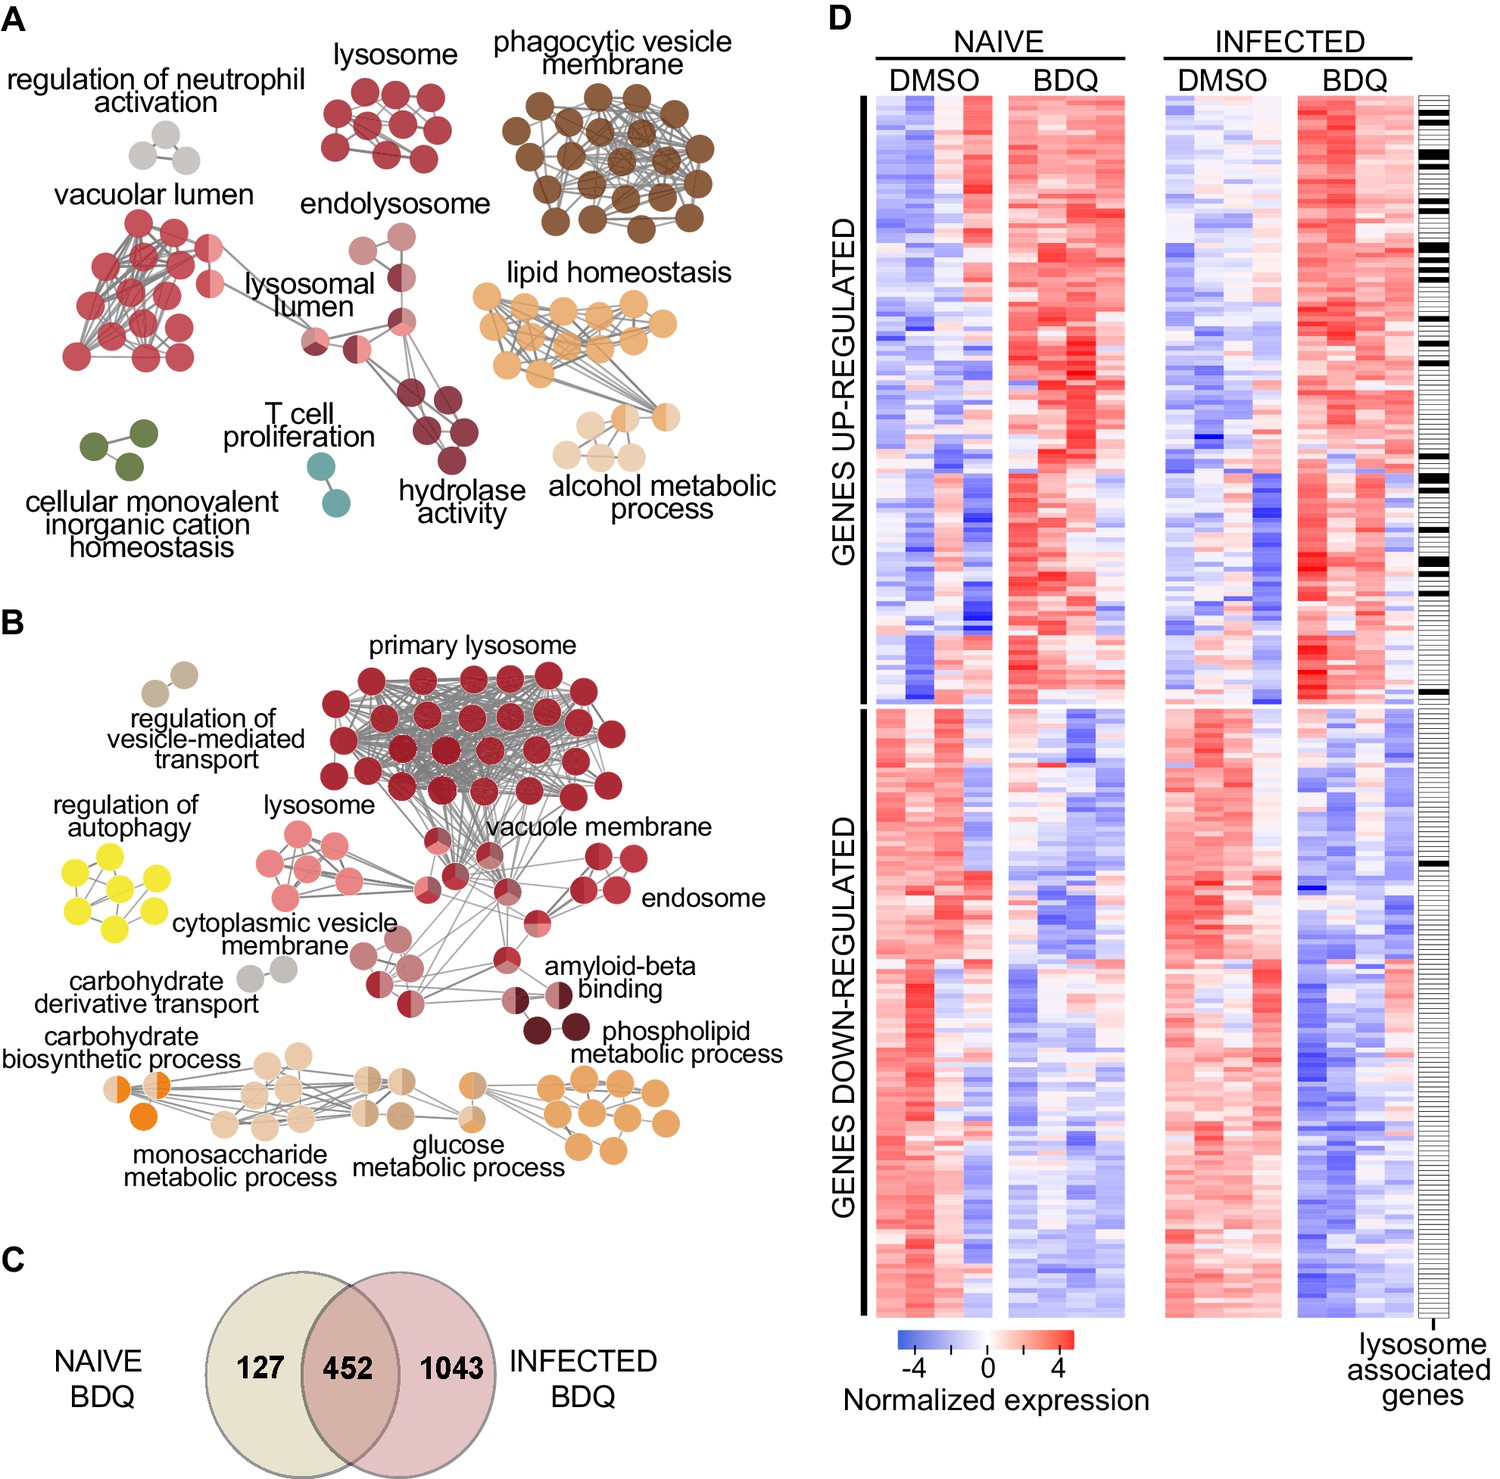
BDQ modulates the response of human macrophages.
Cells from four individual donors were treated with BDQ (5 μg/mL) for 18 hr. Differentially expressed genes were identified by mRNAseq. (A) Gene ontology enrichment analysis of genes whose expression is upregulated by BDQ treatment, using the Cytoscape app ClueGO (FDR < 0.05; LogFC >0.5). (B) Cells were infected with BDQ-resistant MTB for 24 hr and then treated with BDQ (5 μg/mL) for an additional 18 hr. Gene ontology enrichment analysis of genes whose expression is up-regulated by BDQ treatment in BDQr-MTB-infected cells, using the Cytoscape app ClueGO (FDR < 0.05; LogFC >0.5). (C) Venn diagram showing the number of genes regulated by BDQ treatment in naive and BDQr-MTB-infected macrophages, relative to untreated controls. (D) Heatmap showing differential expression of genes differentially expressed by BDQ in naive and BDQr-MTB-infected cells. Each column corresponds to one donor. Data were normalized to determine the log ratio with respect to the median expression of each gene.
-
Figure 1—source data 1
Genes whose expression is upregulated in naive macrophages upon BDQ treatment.
FDR < 0.05.
- https://cdn.elifesciences.org/articles/55692/elife-55692-fig1-data1-v1.xlsx
-
Figure 1—source data 2
Genes whose expression is downregulated in naive macrophages upon BDQ treatment.
FDR < 0.05.
- https://cdn.elifesciences.org/articles/55692/elife-55692-fig1-data2-v1.xlsx
-
Figure 1—source data 3
Genes whose expression is upregulated in BDQr-MTB-infected macrophages upon BDQ treatment.
FDR < 0.05.
- https://cdn.elifesciences.org/articles/55692/elife-55692-fig1-data3-v1.xlsx
-
Figure 1—source data 4
Genes whose expression is downregulated in BDQr-MTB-infected macrophages upon BDQ treatment.
FDR < 0.05.
- https://cdn.elifesciences.org/articles/55692/elife-55692-fig1-data4-v1.xlsx
-
Figure 1—source data 5
Genes differentially expressed in BDQr-MTB infected macrophages by BDQ.
FDR < 0.05.
- https://cdn.elifesciences.org/articles/55692/elife-55692-fig1-data5-v1.xlsx
-
Figure 1—source data 6
Genes differentially expressed in naive macrophages by BDQ.
FDR < 0.05.
- https://cdn.elifesciences.org/articles/55692/elife-55692-fig1-data6-v1.xlsx
-
Figure 1—source data 7
Differentially expressed genes both in naive and in BDQr-MTB infected macrophages upon BDQ treatment.
FDR < 0.05.
- https://cdn.elifesciences.org/articles/55692/elife-55692-fig1-data7-v1.xlsx
Figure 1—figure supplement 1
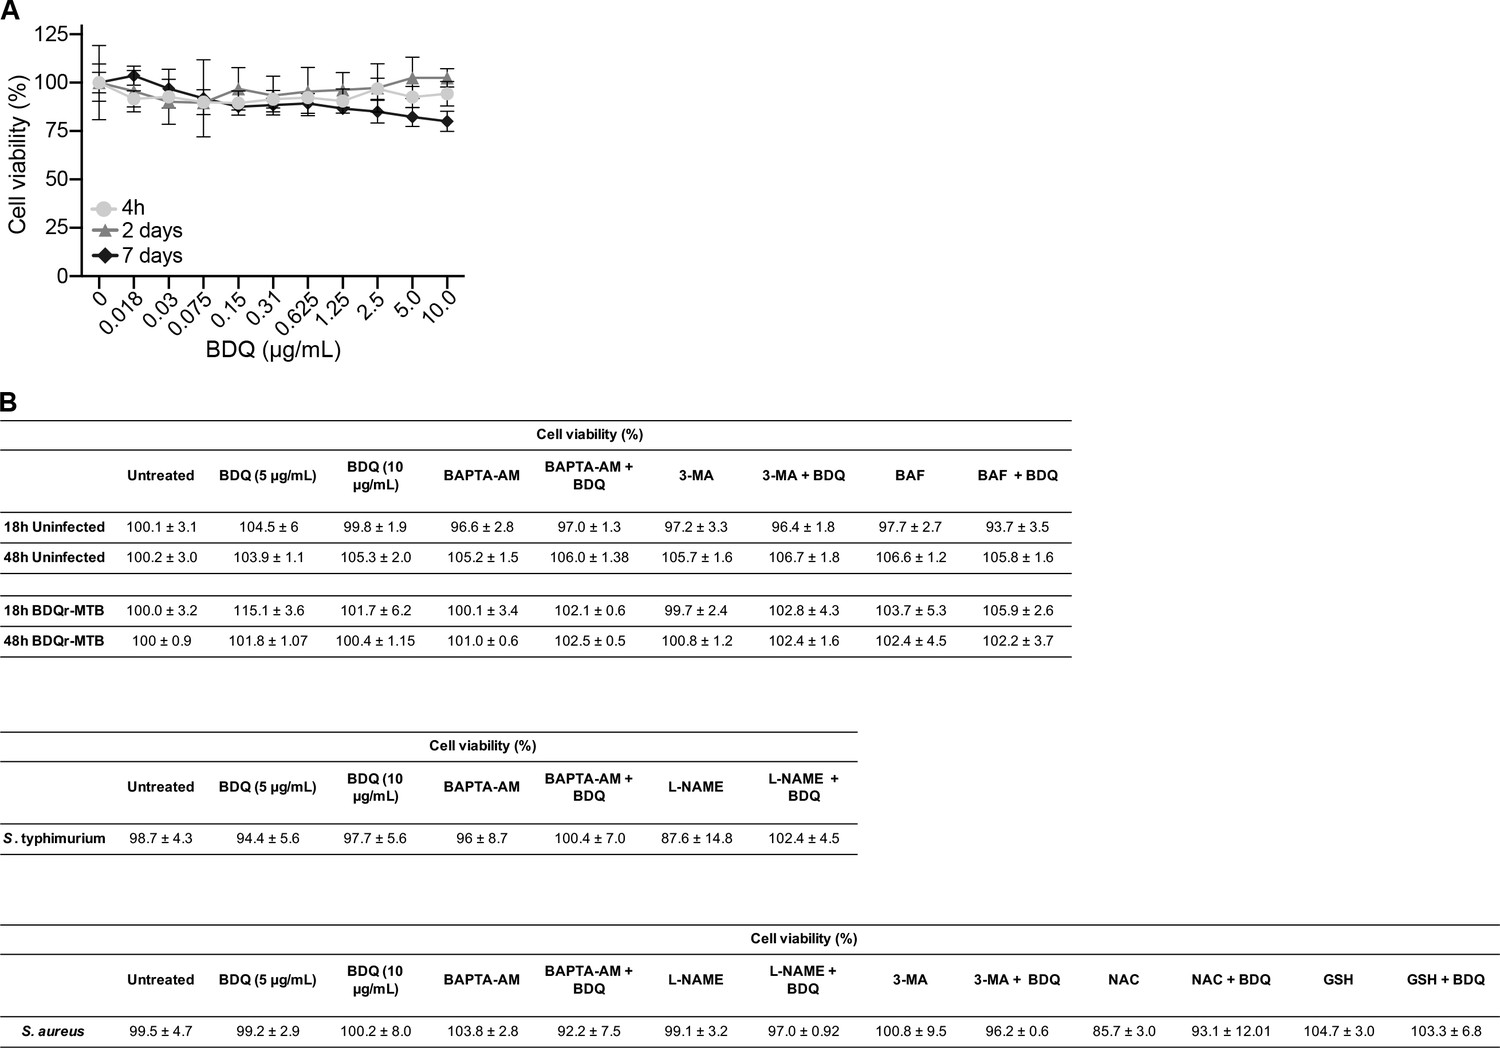
Cell viability assay of macrophages incubated with BDQ.
(A) Cells were treated with various concentrations of BDQ. After 4 hr, 2 and 7 days, cell viability was evaluated with the MTT assay (Trevigen) according to the manufacturer's instructions. (B) Uninfected and cells infected with BDQr-MTB, S. Typhimurium and S. aureus were treated with BDQ with/without the inhibitors used in this study. Cell viability was evaluated with the LDH assay according to the manufacturer’s instructions. Results represent the mean ± SD of three replicates. One representative experiment (out of three) is shown.
Figure 1—figure supplement 2
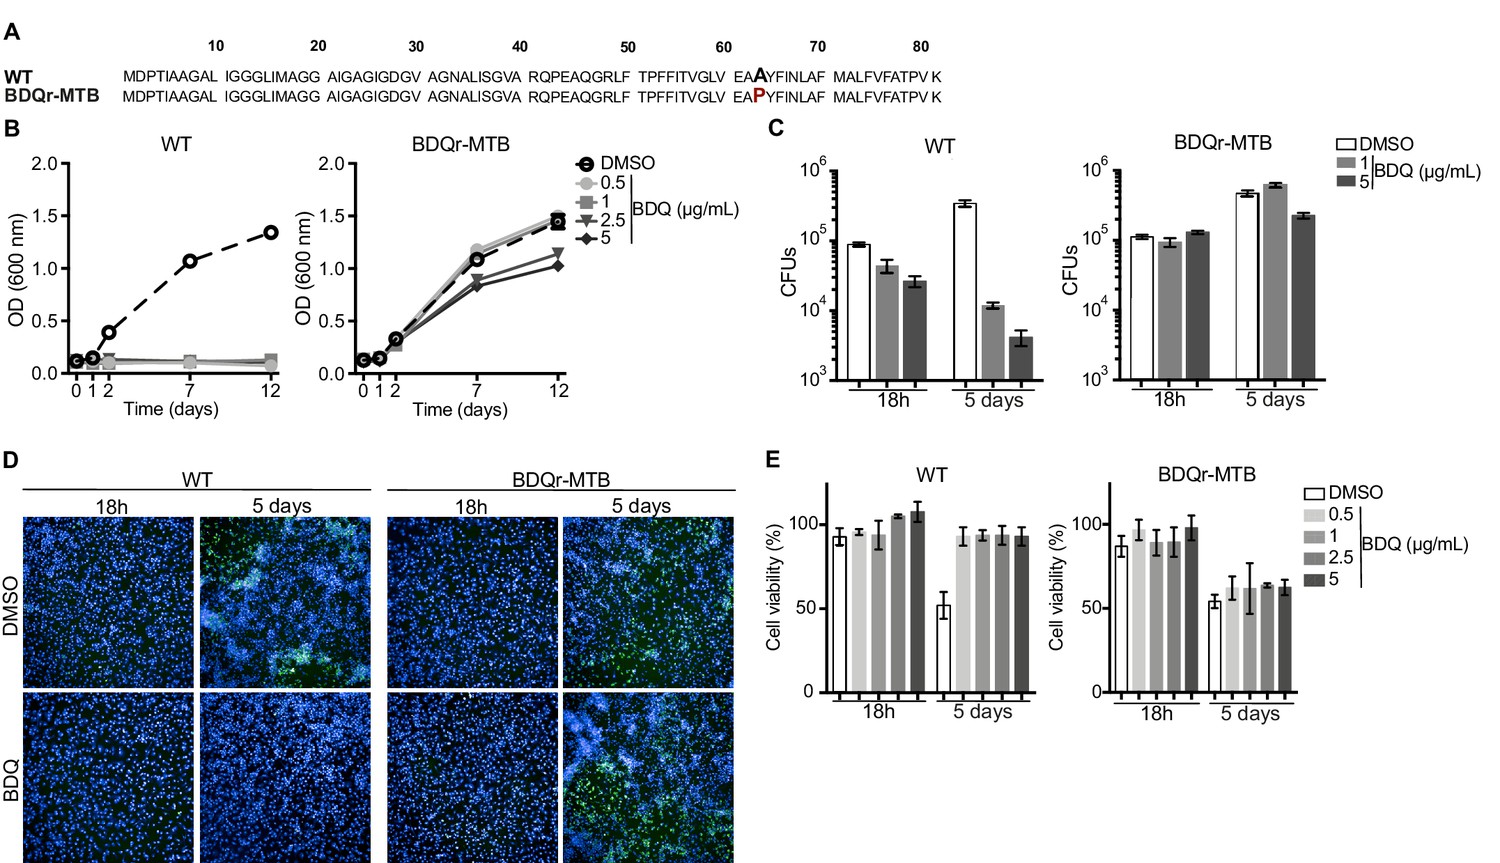
Generation of BDQ resistant MTB strain (BDQr-MTB) and evaluation of its virulence.
(A) Amino acid sequence alignment of the ATP synthase c-subunit gene in wild-type (WT) and BDQ-resistant H37Rv strain. The mutation was indicated in red, at position 63. (B) Optical density (OD) measurements of bacterial growth of WT and BDQr-MTB. Bacteria were cultured in 7H9 medium supplemented with 10% OADC enrichment with/without BDQ. (C) Intracellular growth of wild-type (WT) and BDQ-resistant H37Rv strain. Macrophages were infected with the two strains and incubated with BDQ. After 18 hr and 5 days, the cells were lysed and the number of bacterial colonies was counted. (D) Macrophages were infected with WT and BDQr-MTB expressing the GFP protein and treated with BDQ. After 18 hr and 5 days post-infection, the cells were analyzed by confocal microscopy. DAPI (blue) was used to visualize nuclei. (E) Determination of the number of DAPI-positive cells, relative to uninfected macrophages. One representative experiment (of three) is shown. Results are means ± SD. **p<0.01, unpaired two tailed Student’s t test.
Figure 2 with 1 supplement
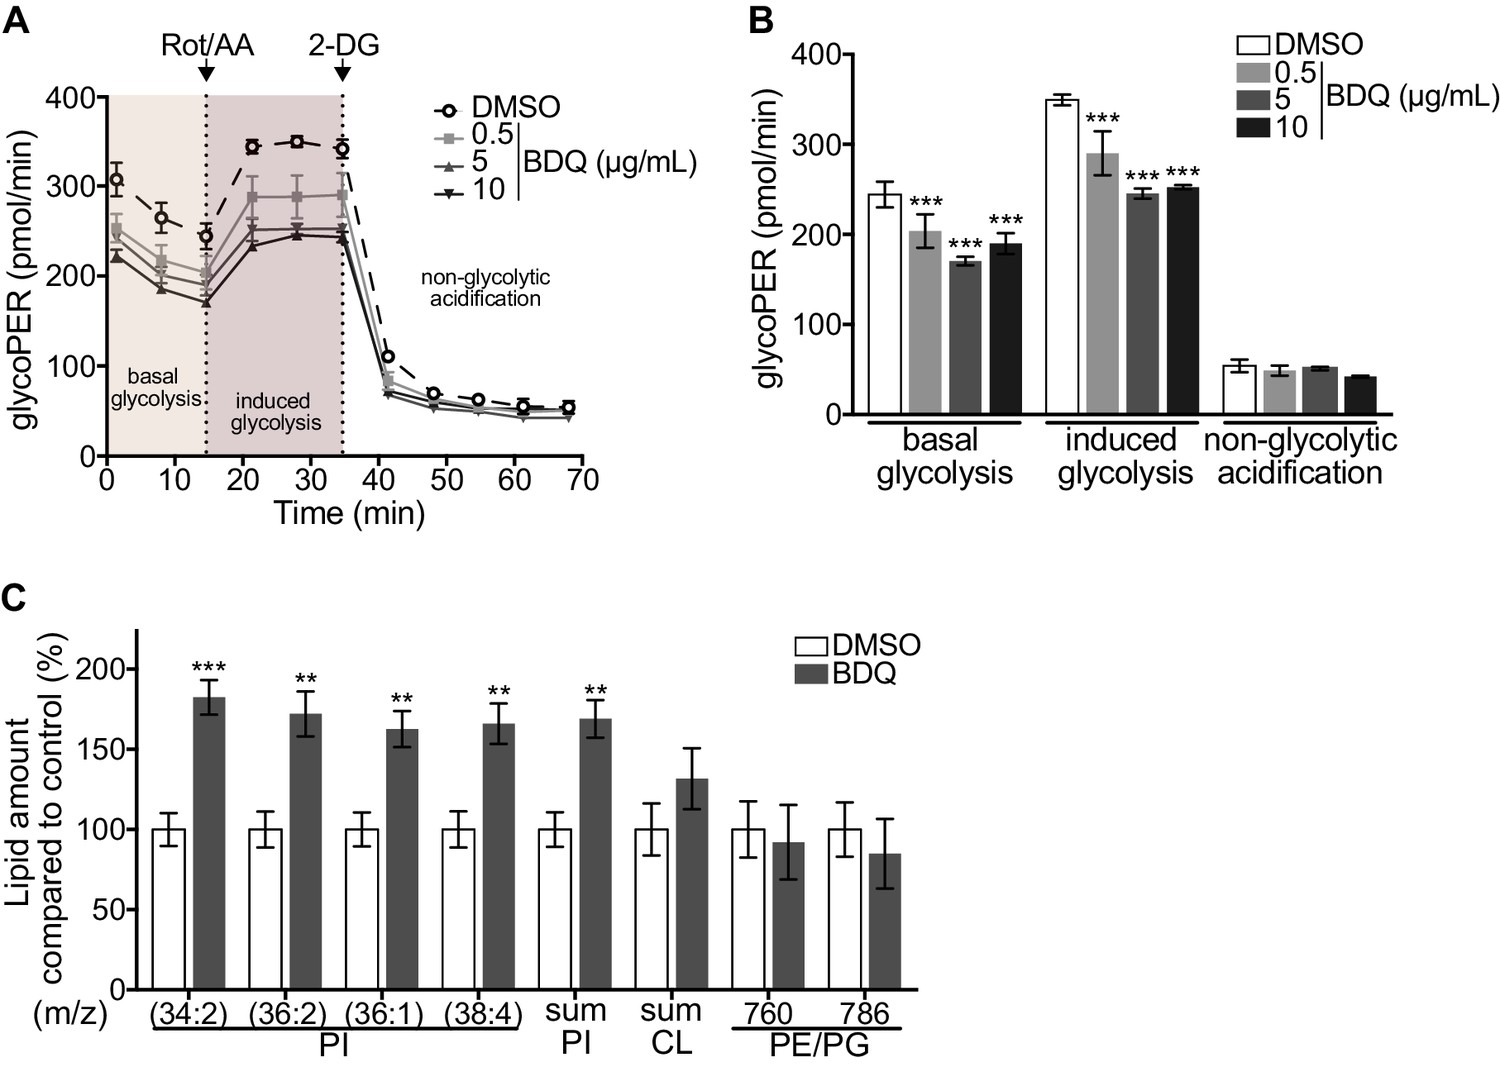
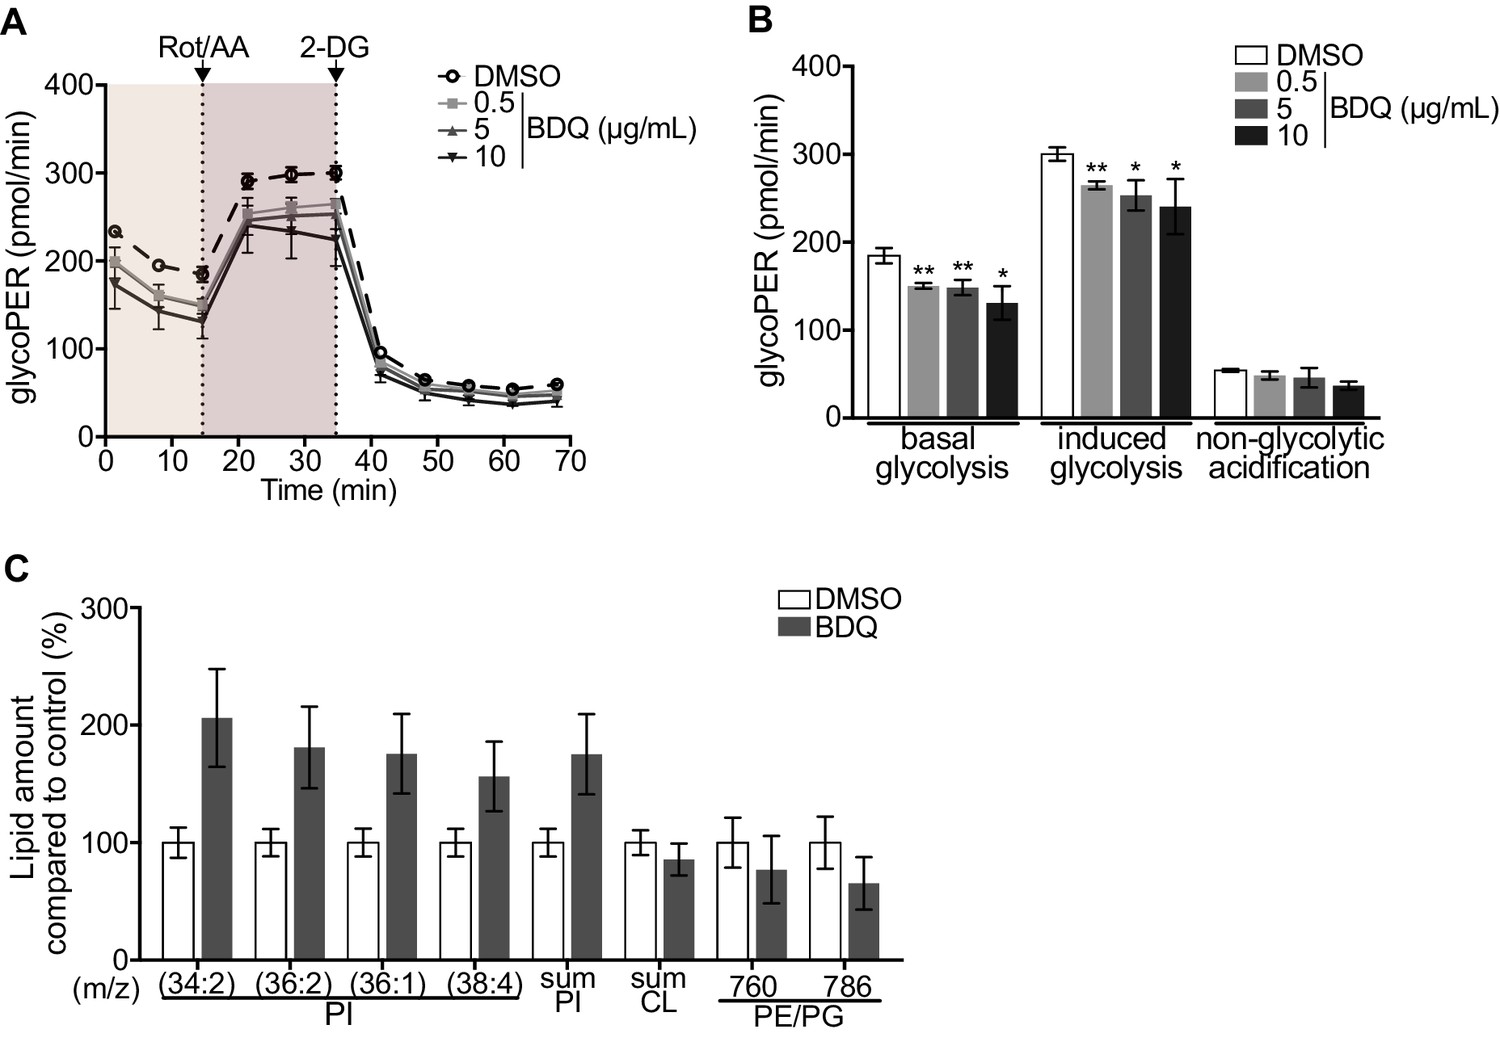
Modulation of host metabolism by BDQ.
(A–B) The Glycolytic Rate Assay was performed in heat killed-MTB stimulated macrophages treated with BDQ, in the presence of rotenone/antimycin A (Rot/AA) and 2-deoxy-D-glycose (2-DG), inhibitors of the mitochondrial electron transport chain and glycolysis, respectively (one-way ANOVA test). One representative experiment (of two) is shown. (C) Lipid profile of BDQr-MTB infected cells treated with BDQ, by MALDI-TOF (unpaired two tailed Student’s t test). PI: Phosphotidylinositol; CL: Cardiolipids; PE: Phosphatidylethanolamine; PG: Phosphatidylglycerol. Numbers correspond to mass-to-charge ratio (m/z). Cells derived from three donors were analyzed. Error bars represent the mean ± SD and significant differences between treatments are indicated by an asterisk, in which *p<0.05, **p<0.01, ***p<0.001.
Figure 2—figure supplement 1
BDQ modulates the metabolism of naïve macrophages.
(A–B) The Glycolytic Rate Assay was performed in macrophages, in the presence of rotenone/antimycin A (Rot/AA) and 2-deoxy-D-glycose (2-DG), respectively inhibitors of mitochondrial electron transport chain and of glycolysis (one-way ANOVA test). One representative experiment (of two) is shown. (C) Lipid profile of cells by MALDI-TOF (unpaired two tailed Student’s t test). PI: Phosphotidylinositol; CL: Cardiolipids; PE: Phosphatidylethanolamine; PG: Phosphatidylglycerol. Numbers correspond to mass-to-charge ratio (m/z). Cells derived from three donors were analyzed. Error bars represent the mean ± SD and significant differences between treatments are indicated by an asterisk, in which *p<0.05, **p<0.01.
Figure 3 with 2 supplements
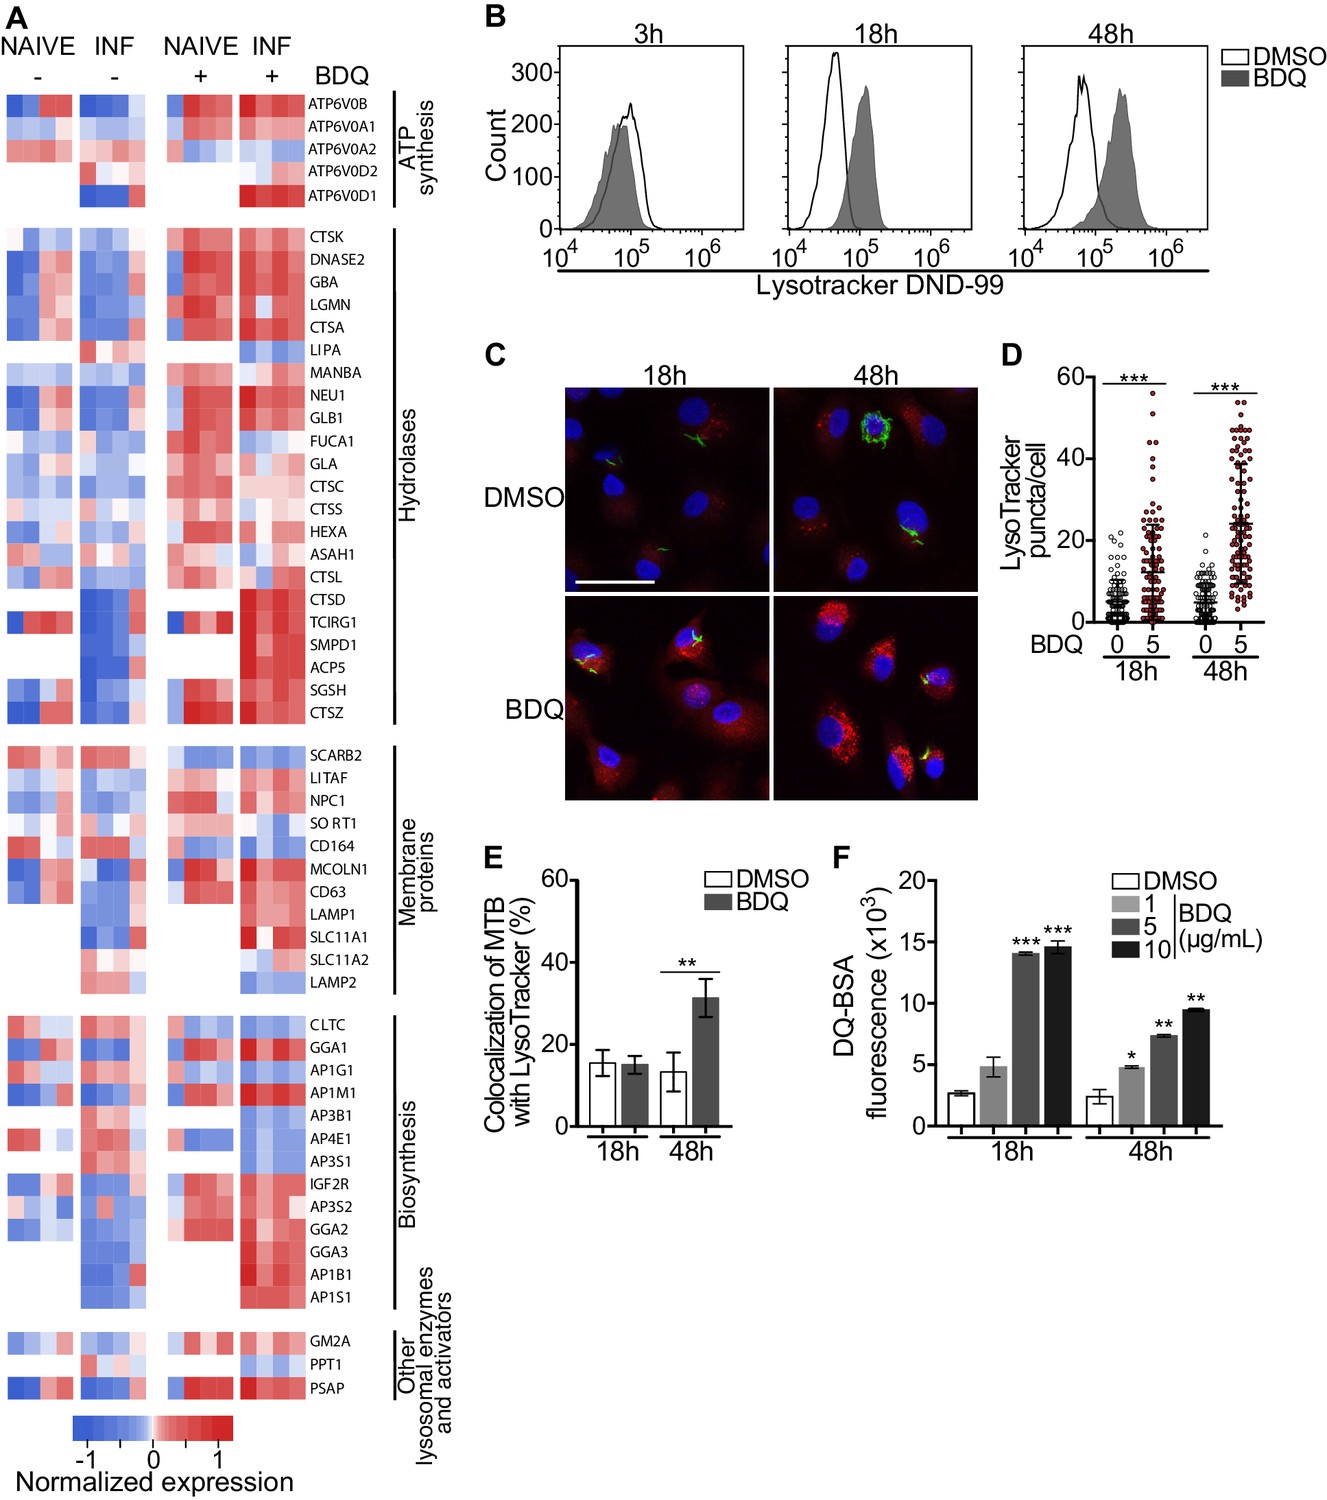
BDQ activates the lysosomal pathway in human MTB-infected macrophages.
(A) Heatmap showing differential expression of genes included in the Lysosome KEGG category (p-value<0.05). Each column corresponds to one donor. Data were normalized to determine the log ratio with respect to the median expression of each gene. (B) Macrophages were infected with BDQr-MTB expressing the GFP protein and incubated with BDQ (5 μg/mL) for 3 hr, 18 hr and 48 hr. Acid organelles were then labeled with 100 nM LysoTracker DND-99 for 1 hr. The fluorescence intensity was quantified by flow cytometry. (C–E) Cells were infected with GFP expressing BDQr-MTB (green) and treated with BDQ (5 μg/mL). After 18 hr and 48 hr of treatment, cells were labelled with LysoTracker (red) and fluorescence was analyzed by confocal microscopy. DAPI (blue) was used to visualize nuclei (scale bar: 10 μm). The quantification of LysoTracker staining and the percentage of LysoTracker-positive MTB phagosomes were performed using Icy software. (F) Macrophages were activated with heat-killed MTB and treated with BDQ for 18 hr and 48 hr. Cells were then incubated with DQ-Green BSA. Fluorescence was quantified by flow cytometry. Significant differences between BDQ treatment and control (DMSO) are indicated by an asterisk. One representative experiment (of at least three) is shown. Error bars represent the mean ± SD. *p<0.05, **p<0.01, ***p<0.001.
Figure 3—figure supplement 1
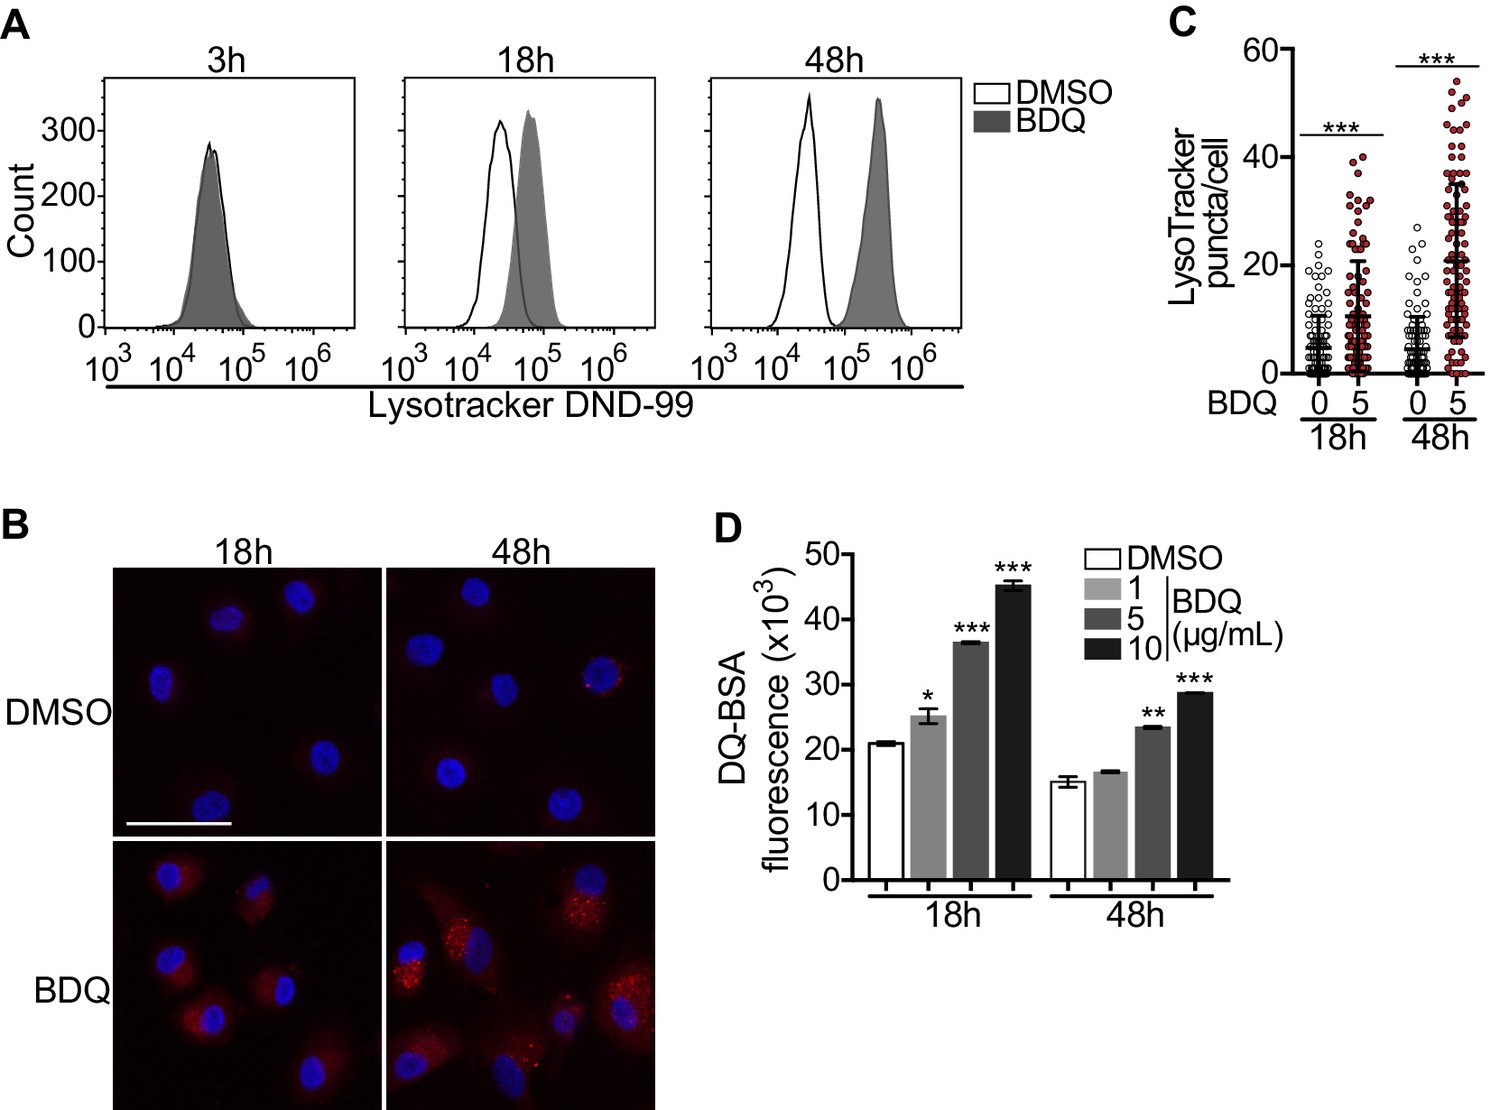
BDQ activates the lysosomal pathway in human naive macrophages.
(A) Macrophages were incubated with BDQ (5 μg/mL) for 3 hr, 18 hr and 48 hr. Acid organelles were then labeled with 100 nM LysoTracker DND-99 for 1 hr. The fluorescence intensity was quantified by flow cytometry. (B–C) Cells were treated with BDQ (5 μg/mL). After 18 hr and 48 hr of treatment, cells were labeled with LysoTracker (red) and fluorescence was analyzed by confocal microscopy. DAPI (blue) was used to visualize nuclei (scale bar: 10 μm). The quantification of LysoTracker staining and the percentage of LysoTracker-positive MTB phagosomes were performed using Icy software. (D) Macrophages were left untreated or treated with BDQ for 18 hr and 48 hr. Cells were then incubated with DQ-Green BSA. Fluorescence was quantified by flow cytometry. Significant differences between BDQ treatment and control (DMSO) are indicated by an asterisk. One representative experiment (of at least three) is shown. Error bars represent the mean ± SD. *p<0.05, **p<0.01, ***p<0.001.
Figure 3—figure supplement 2
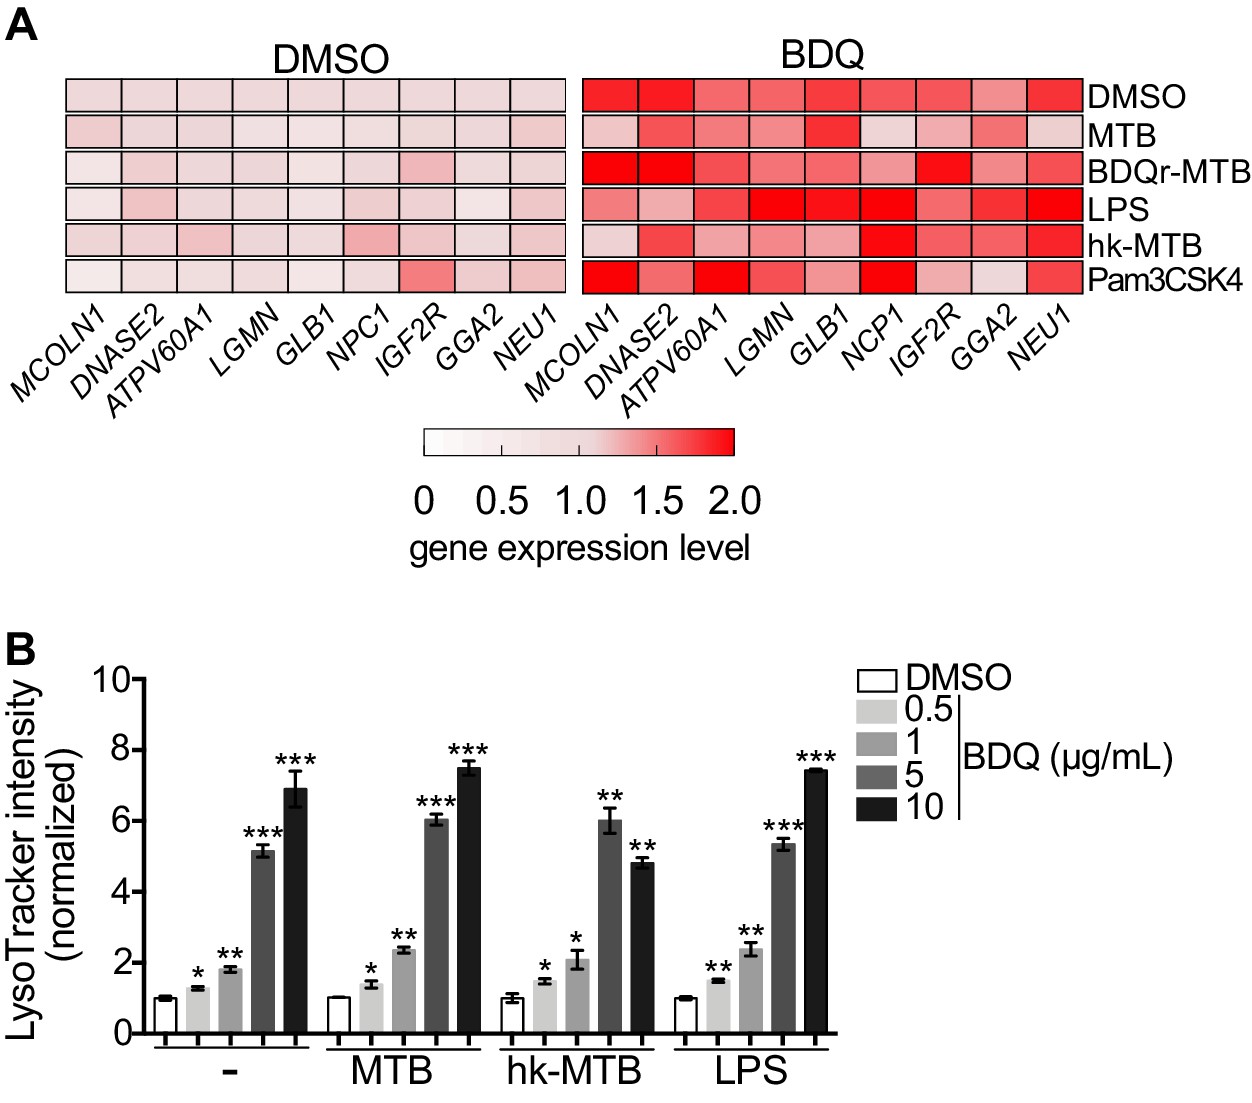
BDQ activates the lysosomal pathway, regardless of infection with live MTB.
(A) Briefly, cells were untreated, infected with drug-susceptible MTB or BDQr-MTB, or stimulated with LPS (TLR4 agonist), Pam3CSK4 (TLR1/2 agonist) or heat-killed bacteria, and then treated with BDQ. After 18 hr, RNA was collected and RT-qPCR performed on a panel of lysosomal genes. (B) Control, drug-susceptible MTB infected macrophages and cells stimulated with LPS or hk-MTB, were treated with BDQ and then stained with LysoTracker. Fluorescence intensity was analyzed by flow cytometry. Error bars represent the mean ± SD and significant differences between treatments are indicated by an asterisk, in which *p<0.05, **p<0.01, ***p<0.001.
Figure 4 with 1 supplement
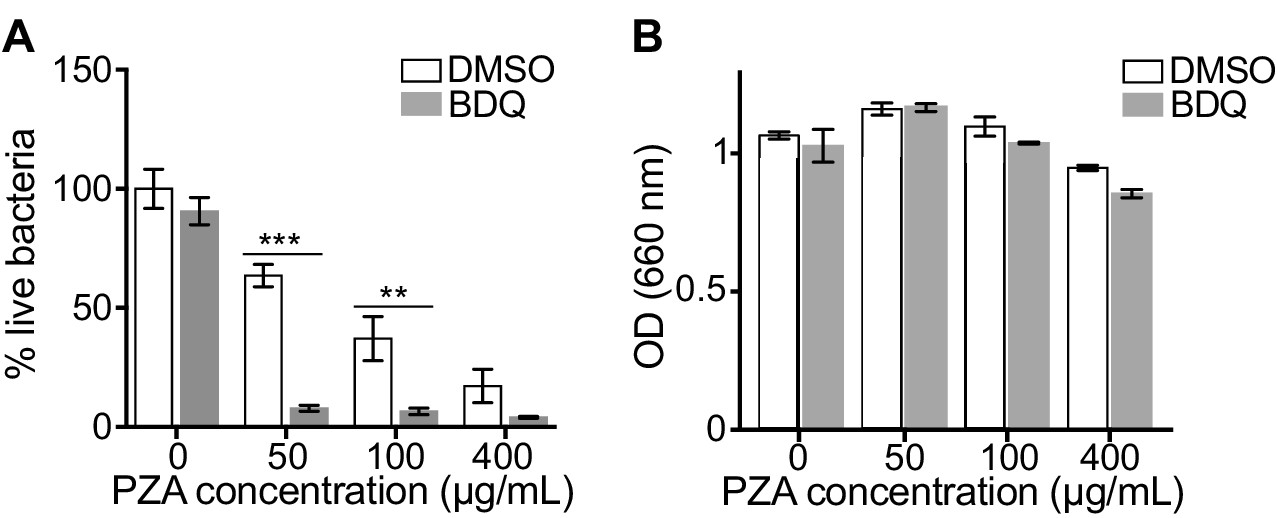
BDQ potentiates PZA antimycobacterial activity.
(A) Macrophages were infected with BDQr-MTB and treated with BDQ (1 μg/mL) and PZA. After 7 of days treatment, cells were lysed and bacteria were enumerated by CFU (counted in triplicate). (B) Optical density (OD) measurements of bacterial growth of BDQr-MTB in the presence of BDQ (1 μg/mL) and different concentrations of PZA. Bacteria were cultured in 7H9 medium supplemented with 10% OADC enrichment with/without the drugs. One representative experiment (of at least three) is shown. Error bars represent the mean ± SD. *p<0.05, **p<0.01, ***p<0.001.
Figure 4—figure supplement 1
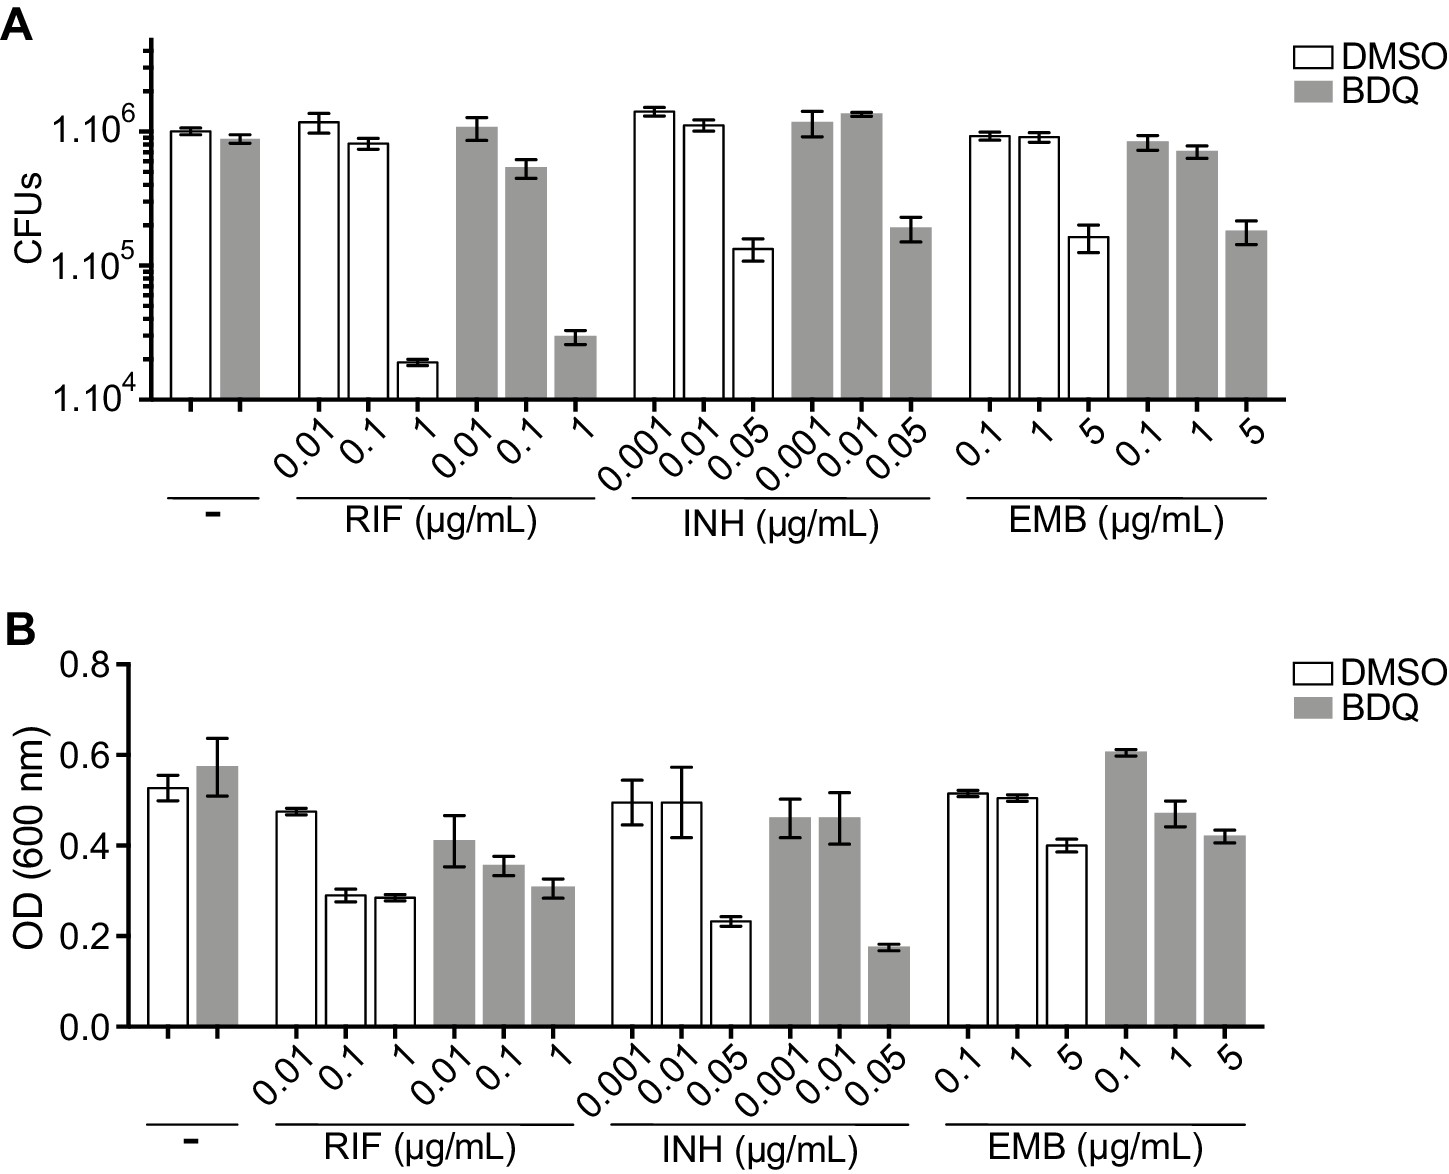
BDQ did not potentiate the activity of the other first-line anti-TB drugs, in liquid culture or in BDQr-MTB infected macrophages.
(A) Cells were infected with BDQr-MTB and treated with BDQ (1 μg/mL) and RIF, INH or EMB. After 5 days treatment, cells were lysed and bacteria were enumerated by CFU (counted in triplicate). (B) Optical density (OD) measurements of bacterial growth of BDQr-MTB in the presence of BDQ (1 μg/mL) and different concentrations of RIF, INH and EMB. Bacteria were cultured in 7H9 medium supplemented with 10% OADC enrichment with/without the drugs during 5 days. One representative experiment (of at least three) is shown. Error bars represent the mean ± SD. *p<0.05, **p<0.01, ***p<0.001.
Figure 5 with 1 supplement
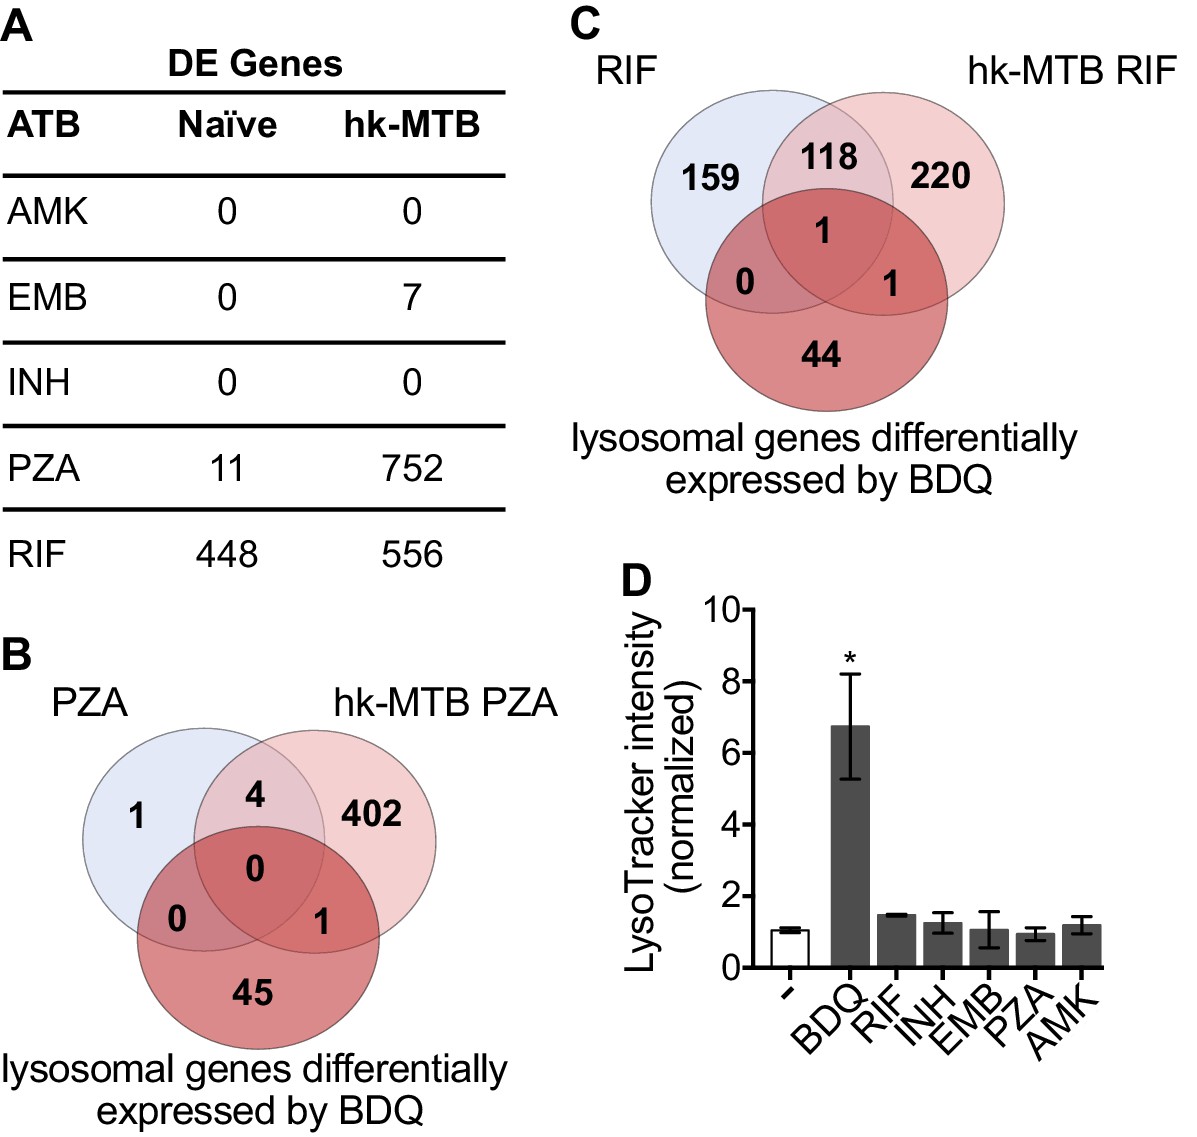
Classical anti-TB drugs did not activate the lysosomal pathway in human macrophages.
(A) Number of differentially-expressed genes upon treatment with commonly used anti-TB drugs relative to untreated control. Briefly, naïve- and hk-MTB-stimulated macrophages were treated with AMK (20 µg/mL), EMB (20 µg/mL), INH (10 µg/mL), PZA (200 µg/mL) or RIF (20 µg/mL). After 18 hr, differentially expressed (DE) genes were identified by mRNAseq. (B–C) Venn diagram showing the number of genes regulated by PZA and RIF in naive and hk-MTB-stimulated macrophages, in comparison with the number of lysosomal genes differentially expressed by BDQ (FDR < 0.05, absLogFC >0.1). (D) Macrophages were incubated for 48 hr with AMK, BDQ, EMB, INH, PZA or RIF, and then stained with Lysotracker. Fluorescence intensity was analyzed by flow cytometry. One representative experiment (of at least three) is shown. Error bars represent the mean ± SD. *p<0.05.
-
Figure 5—source data 1
Differentially expressed genes in hk-MTB stimulated macrophages upon EMB treatment.
FDR < 0.05.
- https://cdn.elifesciences.org/articles/55692/elife-55692-fig5-data1-v1.xlsx
-
Figure 5—source data 2
Differentially expressed genes in hk-MTB stimulated macrophages upon RIF treatment.
FDR < 0.05.
- https://cdn.elifesciences.org/articles/55692/elife-55692-fig5-data2-v1.xlsx
-
Figure 5—source data 3
Differentially expressed genes in naive macrophages upon RIF treatment.
FDR < 0.05.
- https://cdn.elifesciences.org/articles/55692/elife-55692-fig5-data3-v1.xlsx
-
Figure 5—source data 4
Differentially expressed genes in hk-MTB stimulated macrophages upon PZA treatment.
FDR < 0.05.
- https://cdn.elifesciences.org/articles/55692/elife-55692-fig5-data4-v1.xlsx
-
Figure 5—source data 5
Regulated genes naive macrophages upon PZA treatment.
FDR < 0.05.
- https://cdn.elifesciences.org/articles/55692/elife-55692-fig5-data5-v1.xlsx
Figure 5—figure supplement 1
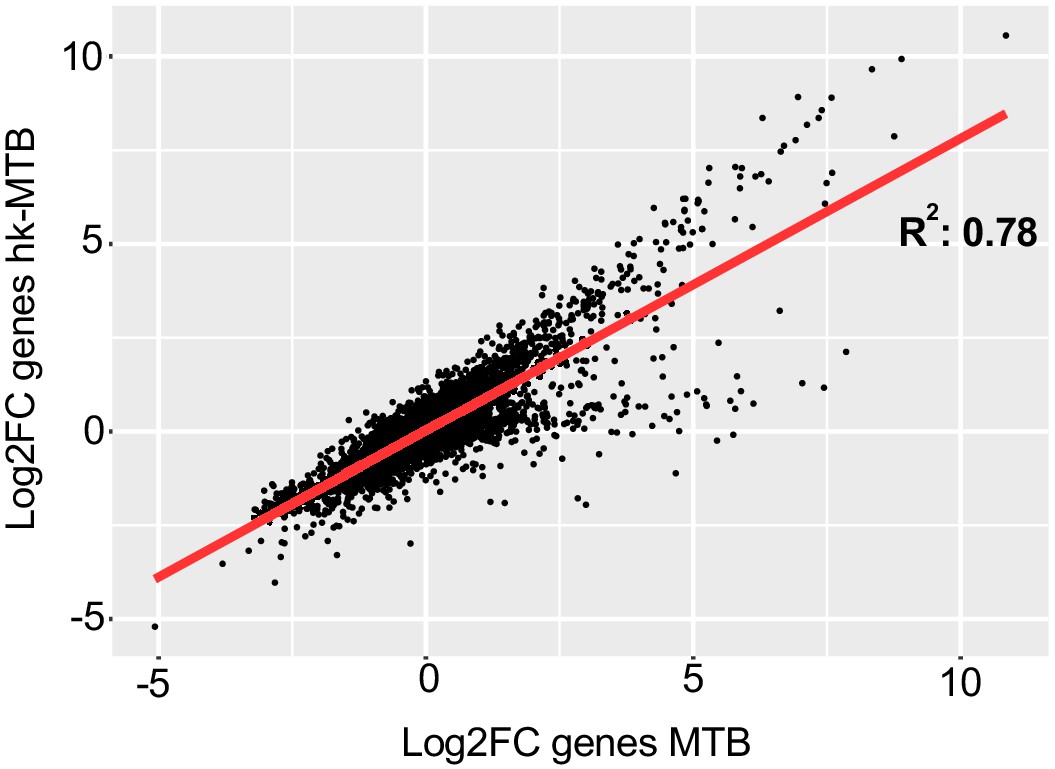
Scatterplot depicting the correlation between the log2 fold changes (log2FC) in gene expression levels using live MTB and heat-killed bacteria.
Figure 6
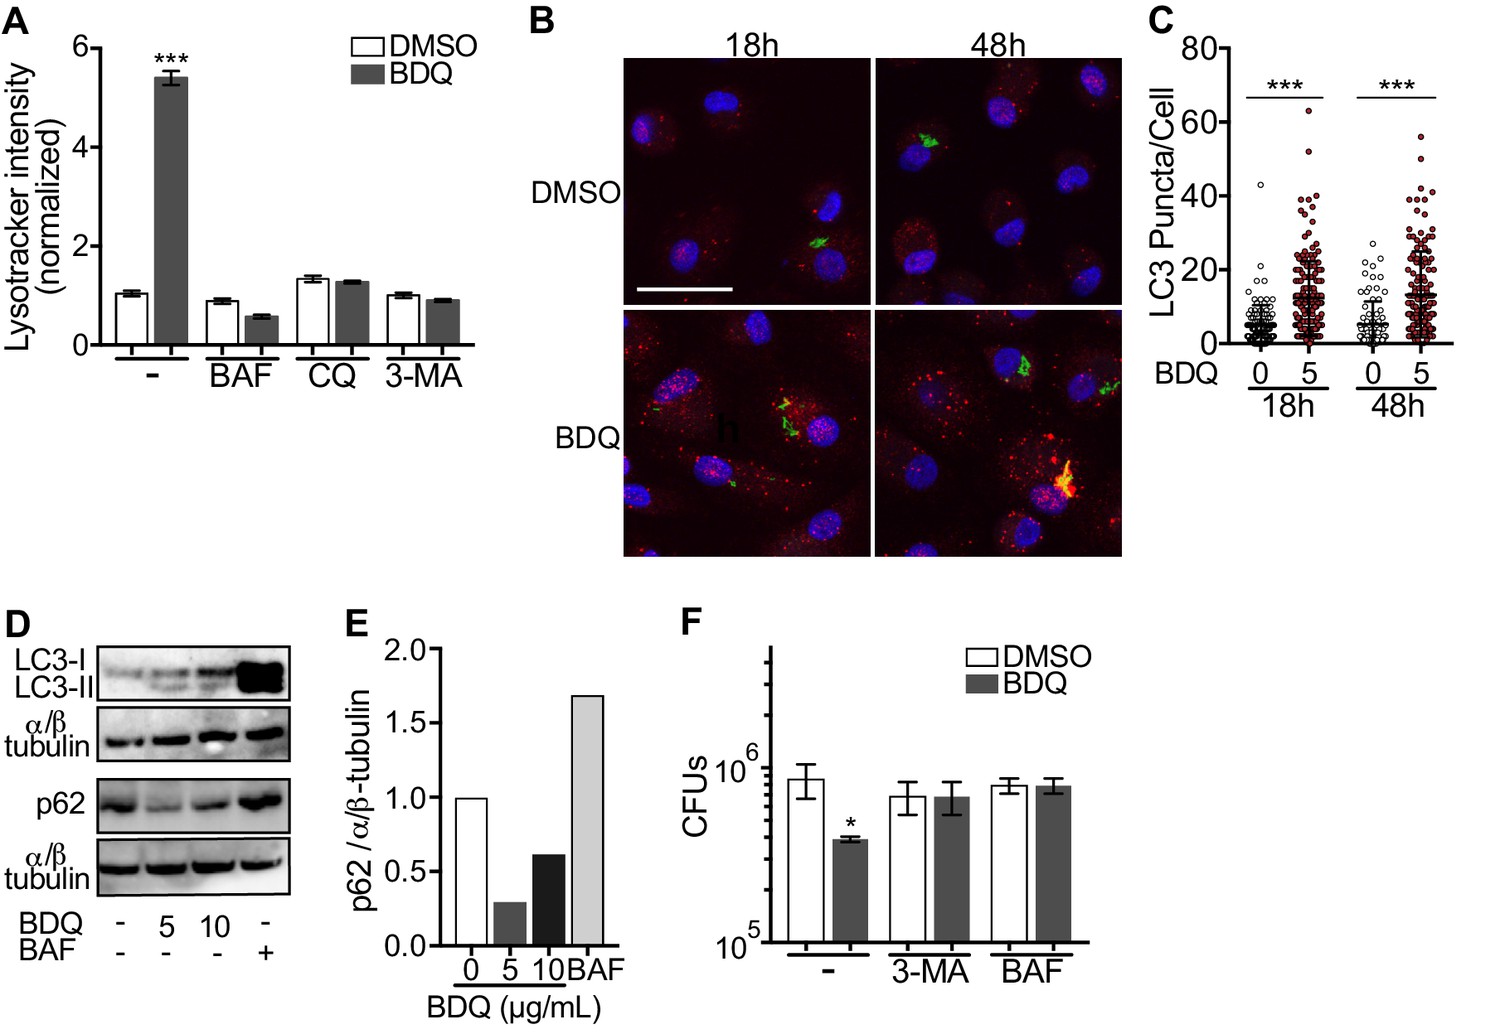
BDQ induced autophagy in MTB-infected macrophages.
(A) BDQr-MTB-infected macrophages were incubated with BDQ (5 μg/mL) and different inhibitors of autophagy; bafilomycin (BAF, 100 nM), chloroquine (CQ, 40 μM) and 3-methyladenine (3-MA, 5 mM). After 48 hr, acidic compartments were stained with LysoTracker and fluorescence quantified by flow cytometry. (B) Detection by indirect immunofluorescence of LC3 (red) in BDQr-MTB (green) infected macrophages, treated with BDQ for 18 hr and 48 hr (scale bar: 10 μm). DAPI (blue) was used to visualize nuclei. (C) Determination of the number of LC3-positive puncta per cell (one-way ANOVA test). (D) Western blot analysis of LC3, p62, and α/ß-tubulin in MTB-infected cells treated with BDQ and BAF. (E) Densitometric quantification of p62 staining. (F) BDQr-MTB-infected macrophages were left untreated or incubated with BDQ, 3-methyladenine (3-MA) and/or bafilomycin (BAF). After 48 hr, the number of intracellular bacteria was enumerated. One representative experiment (of three) is shown. Error bars represent the mean ± SD. *p<0.05, **p<0.01, ***p<0.001.
Figure 7
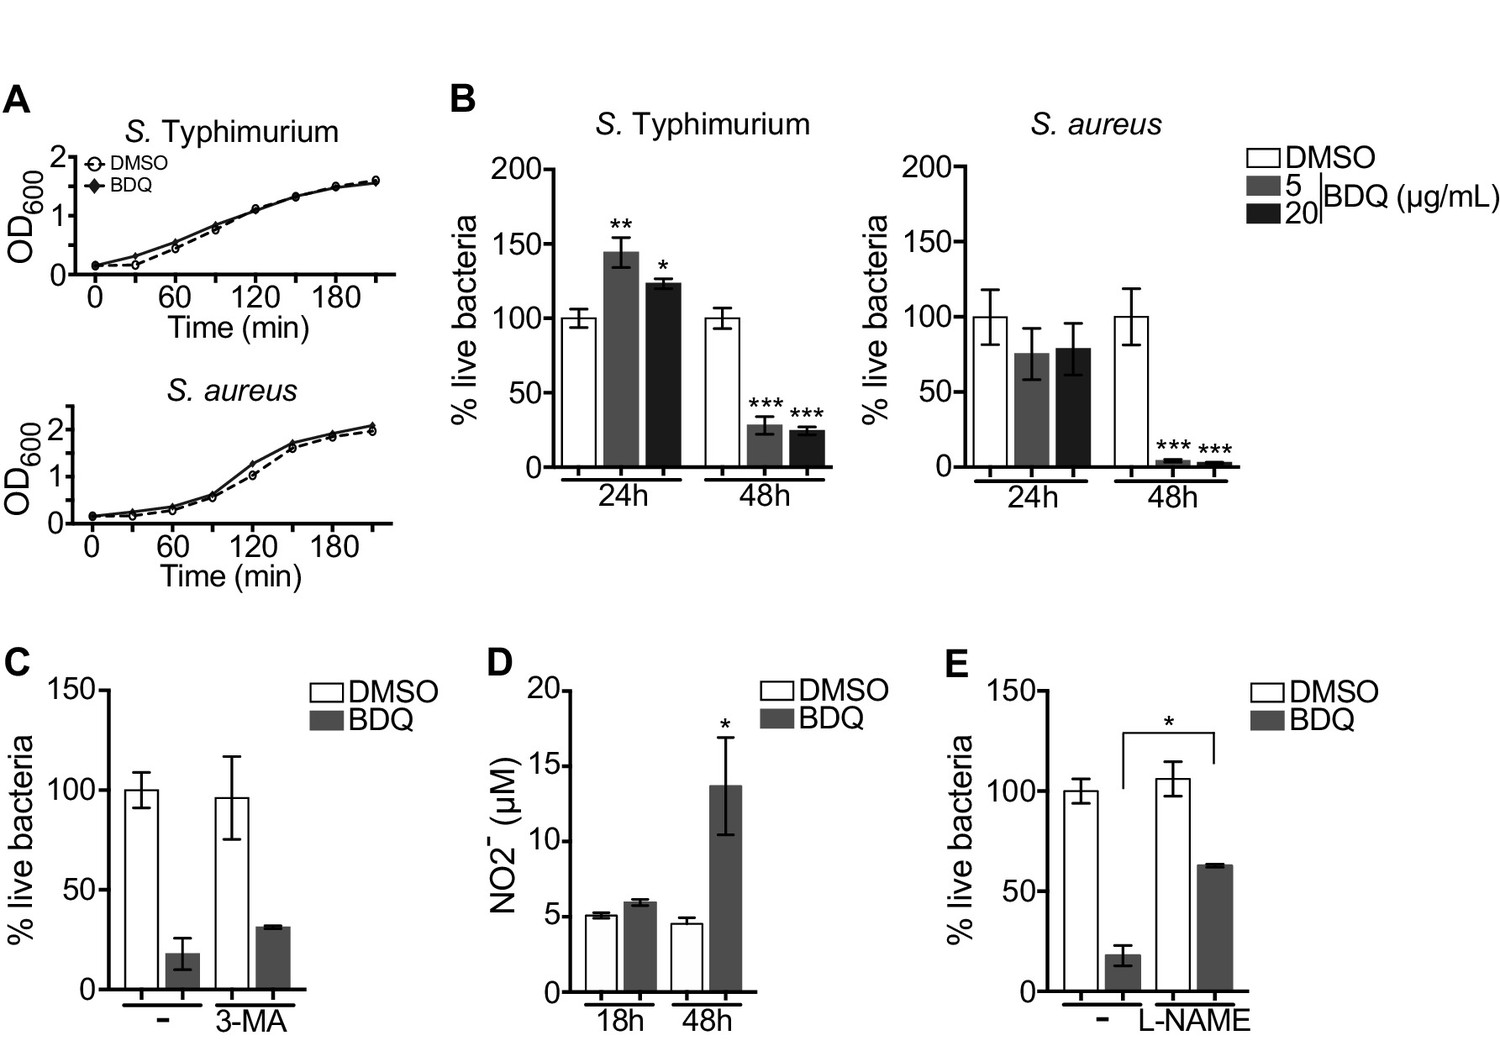
BDQ increases macrophage bactericidal functions.
(A) Growth of S. Typhimurium and S. aureus in liquid medium in the presence of BDQ (20 μg/mL). (B) Macrophages were incubated with BDQ and then infected with S. Typhimurium or S. aureus. The number of intracellular bacteria was enumerated at 24 hr post-infection. (C) BDQ-treated macrophages were incubated with 3-MA and then infected with S. aureus. The number of bacteria was counted as previously. (D) Quantification of NO2- in the supernatant of macrophages incubated with BDQ for 18 hr and 48 hr. (E) Cells were treated as in (C), 3-MA was replaced by L-NAME (0.1 mM), an inhibitor of nitric oxide (NO) synthesis. One representative experiment (of three) is shown. Error bars represent the mean ± SD. Unpaired two-tailed Student’s t test was used. *p<0.05, **p<0.01, ***p<0.001.
Figure 8 with 2 supplements
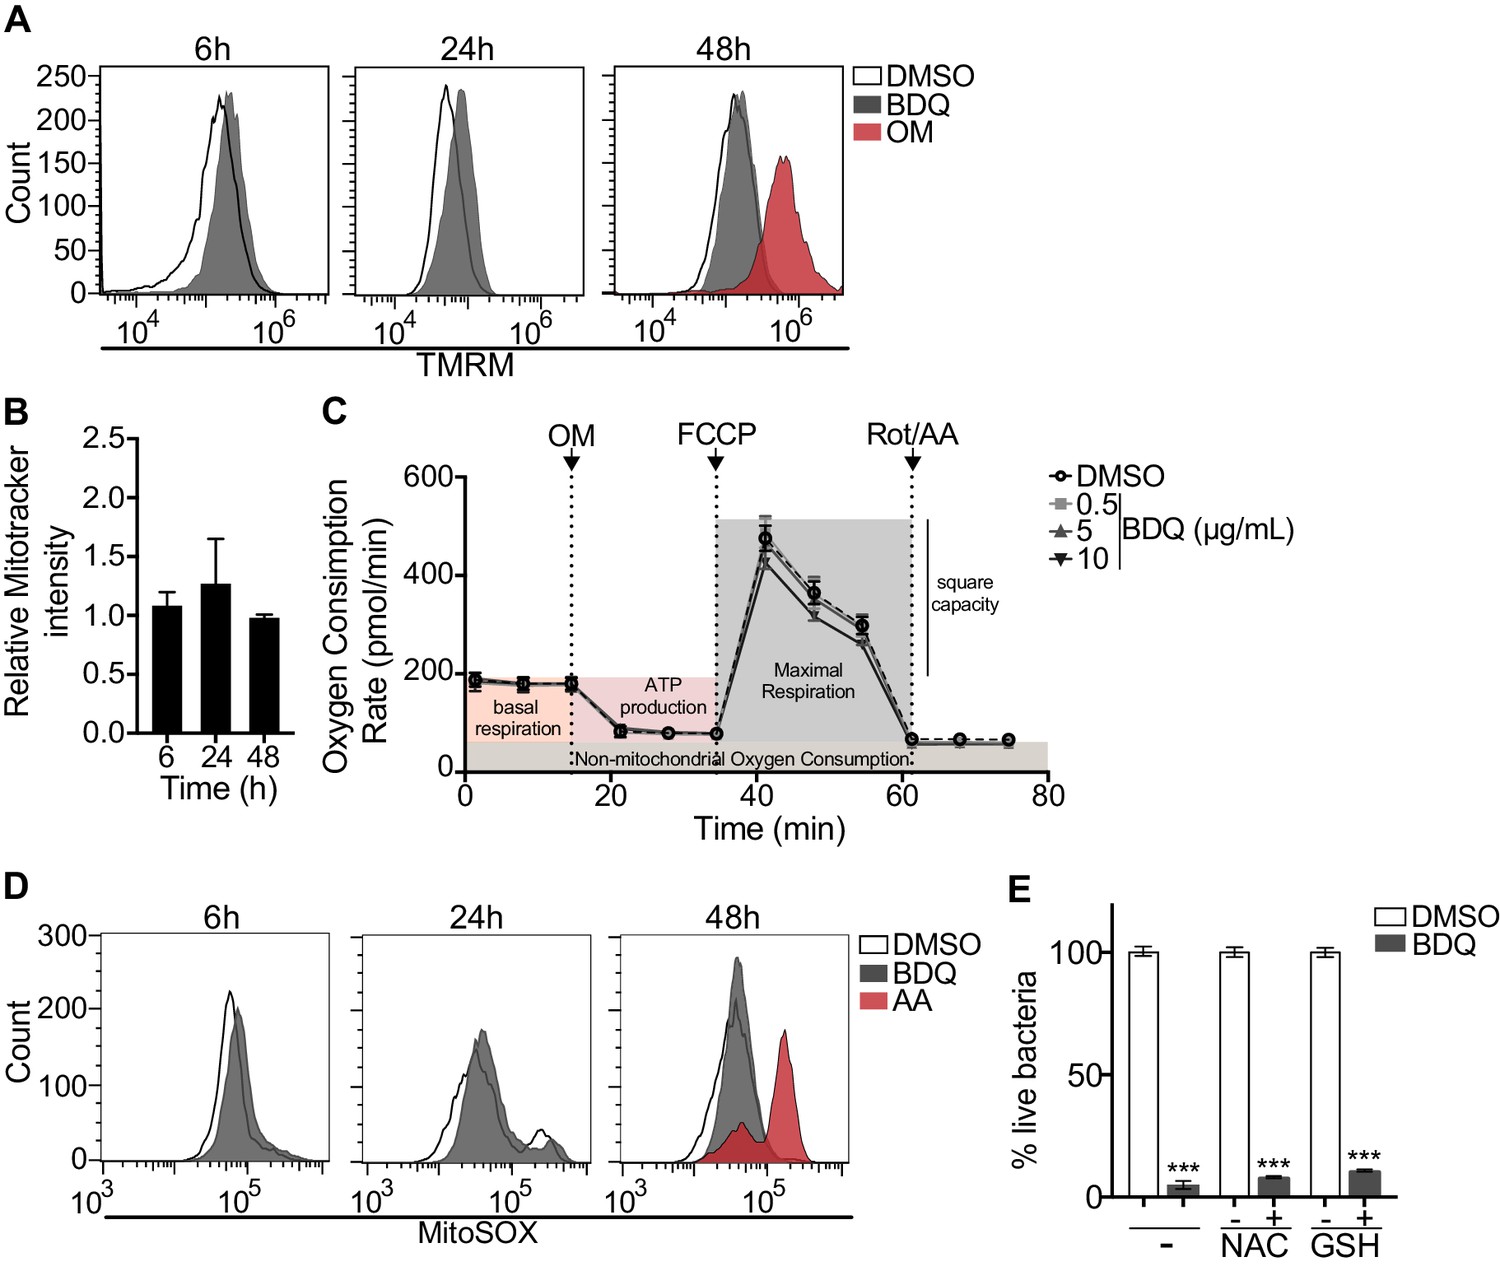
BDQ does not affect mitochondrial functions.
(A) Macrophages were treated with BDQ for 6, 24 and 48 hr and incubated with TMRM. Fluorescence was quantified by flow cytometry. Oligomycin (OM) is a positive control. (B) Cells were treated as in (A), and mitochondria were stained with MitoTracker Red FM. The graph represents the ratio between the mean fluorescence intensity of BDQ-treated cells and DMSO-treated cells. (C) Oxygen consumption rate (OCR) measured by Seahorse extracellular flux assay of cells incubated with BDQ for 24 hr. Basal respiration, ATP production, maximal respiration, respiratory reserve, and nonmitochondrial respiration were followed by sequential additions of oligomycin (OM, an inhibitor of the ATPase), the mitochondrial oxidative phosphorylation uncoupler FCCP, and the inhibitors of electron transport rotenone/antimycin A (Rot/AA). Error bars represent the mean ± SD of three technical replicates. One representative experiment (of two) is shown. (D) At each indicated time points, mitochondrial superoxide (mROS) were stained using the MitoSOX dye in BDQ-treated cells. Antimycin A (AA) is used as a positive control. (E) Cells were incubated with BDQ in the presence or not of two antioxidants, glutathione (GSH) and its precursor N-Acetyl-L-cysteine (NAC). After 24 hr, the cells were infected with S. aureus for an additional 24 hr. Macrophages were lysed and the number of intracellular bacteria enumerated. One representative experiment (of three) is shown. Error bars represent the mean ± SD. was used. ***p<0.001.
Figure 8—figure supplement 1
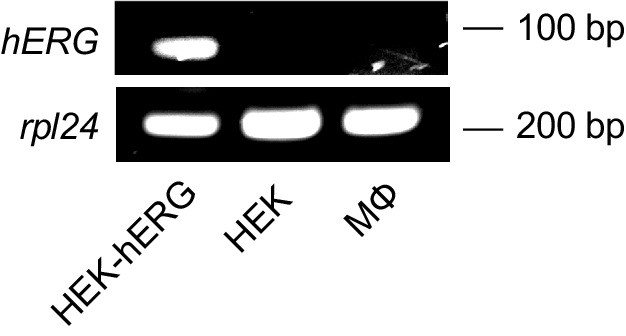
The hERG gene is not expressed in human monocyte-derived macrophages.
RT-qPCR was performed in order to detect hERG mRNA expression in macrophages, in hERG-transfected and non-transfected HEK293 cells (kind gift from Craig T. January, University of Wisconsin–Madison). rpl24 was used as control gene.
Figure 8—figure supplement 2

Oxygen consumption rate (OCR) measured by Seahorse extracellular flux assay of cells incubated with BDQ for 48 hr.
Basal respiration, ATP production, maximal respiration, respiratory reserve and nonmitochondrial respiration were followed by sequential additions of oligomycin (OM), FCCP, and the inhibitors of electron transport antimycin A/rotenone (Rot/AA). Error bars represent the mean ± SD of three technical replicates. One representative experiment (out of two) is shown.
Figure 9 with 1 supplement
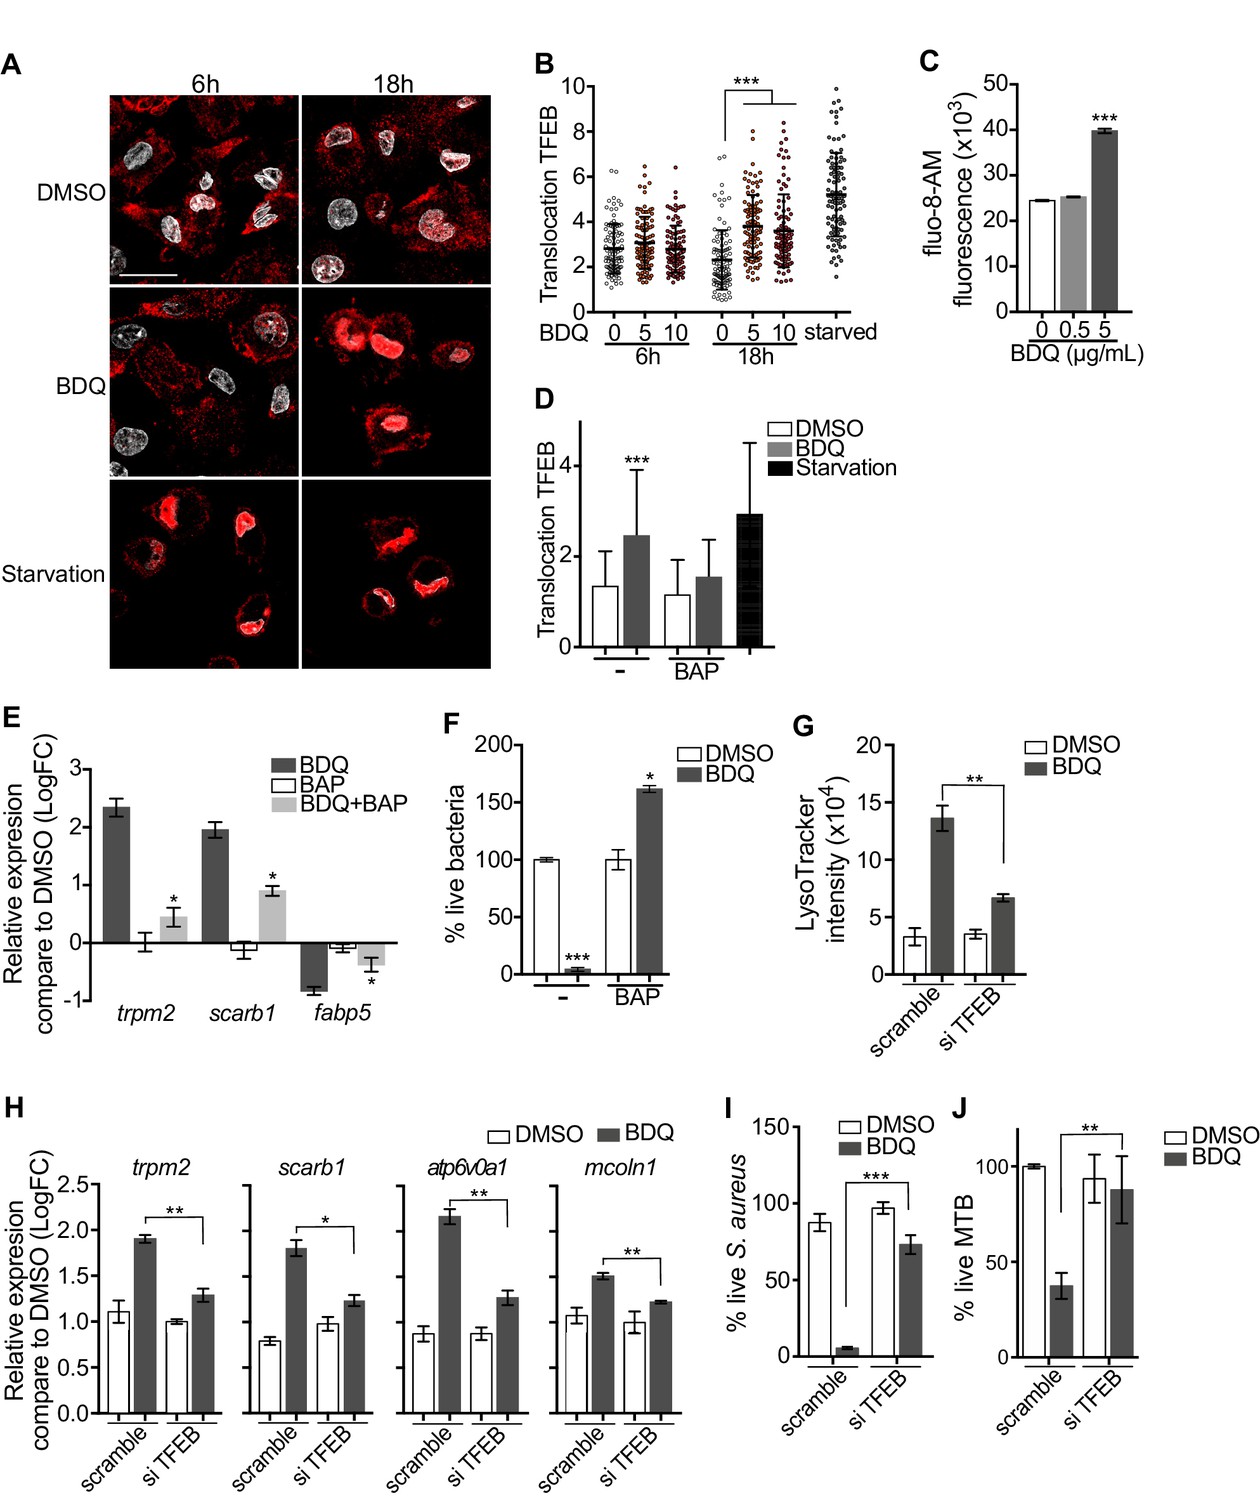
Activation of TFEB by BDQ.
(A) Representative fluorescence microscopy images of macrophages treated with BDQ for 6 hr and 18 hr, or incubated in HBSS for 1 hr (starvation). Cells were stained with antibody against TFEB (red). DAPI (white) was used to visualize nuclei. Scale bar: 10 μm. (B) Ratio between nuclear and cytosolic TFEB fluorescence intensity (n > 100 cells per condition, two-way ANOVA test). (C) Macrophages were treated with BDQ for 18 hr and loaded with the fluorescent calcium binding dye Fluo-8 AM. After 1 hr of incubation, Ca2+ concentration was monitored by FLUOstar Omega. (D) Ratio between nuclear and cytosolic TFEB fluorescence intensity in starved cells and in cells treated with BDQ and/or with the intracellular calcium chelator BAPTA-AM (n > 100 cells per condition, two-way ANOVA test). (E) Relative gene expression measured by RT-qPCR for a panel of differentially expressed lysosomal genes. BDQ-treated macrophages were either left untreated or incubated with BAPTA-AM. Relative expression levels were normalized to the rpl24 gene. (F) Macrophages were treated with BDQ with or without BAPTA-AM, and then infected with S. aureus. After 1 day, cells were lysed and the number of intracellular bacterial colonies was counted (unpaired two tailed Student’s t test). (G) TFEB expression was inhibited in macrophages using siRNA-mediated gene silencing. Cells were then treated with BDQ. After 48 hr of treatment, Lysotracker staining was quantified by flow cytometry. (H) Relative gene expression measured by RT-qPCR for a panel of lysosomal genes in TFEB-silenced cells. Relative expression levels were normalized to the rpl24 gene. (I) TFEB-silenced macrophages were treated with BDQ and infected with S. aureus. After 1 day, the cells were lysed and the number of intracellular bacterial colonies was counted. (J) TFEB-silenced macrophages were treated with BDQ and infected with BDQr-MTB. After 48 hr, the number of bacteria was counted. Error bars represent the mean ± SD. was used. *p<0.05, **p<0.01, ***p<0.001.
Figure 9—figure supplement 1
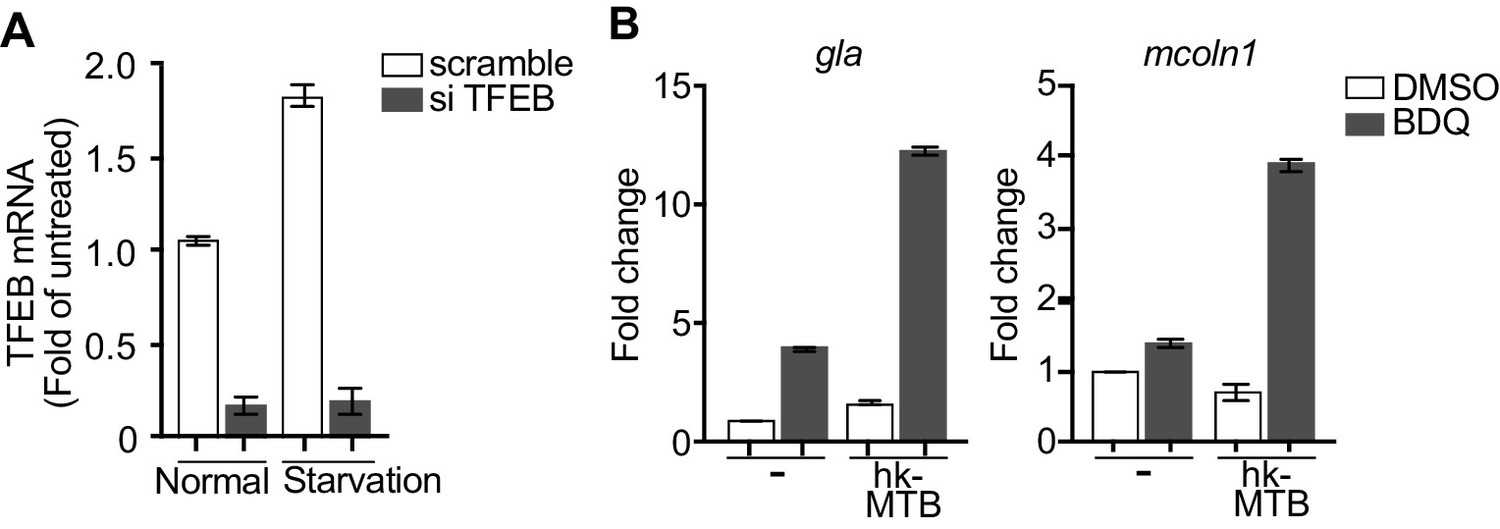
BDQ-induced lysosome activation is dependent on TFEB.
(A) TFEB expression was inhibited in macrophages using siRNA-mediated gene silencing. After 48 hr, relative gene expression of TFEB was measured by RT-qPCR. Relative expression levels were normalized to the rpl24 gene. Starved cells were used as control. (B) The recruitment of TFEB to the gla and mcoln1 promoters was evaluated. Briefly, naive- and heat-killed-stimulated cells treated with BDQ were lysed, and chromatin was harvested and fragmented using sonication. The chromatin was then subjected to immunoprecipitation using an anti-TFEB antibody. The isolated DNA was analyzed by RT-qPCR with primers specific for gla and mcoln1 promoters.
Tables
Table 1
Gene Ontology (GO) functional annotation of genes differentially expressed by BDQ only in naïve- and BDQr-MTB-infected macrophages.
| Specific NAIVE BDQ genes | ||||||
|---|---|---|---|---|---|---|
| GO category | avg. LogFC | p-value | ||||
| Cell division | -0.51 | 8.34E-05 | ||||
| Sphingolipid metabolic process | 0.33 | 1.42E-04 | ||||
| Angiogenesis | 0.67 | 5.16E-04 | ||||
| Spindle | -0.63 | 5.46E-04 | ||||
| Lysosomal lumen | 0.35 | 1.21E-04 | ||||
| Glycosphingolipid metabolic process | 0.35 | 1.21E-03 | ||||
| Response to oxidative stress | 0.49 | 1.26E-03 | ||||
| Mitotic cell cycle | -0.58 | 1.29E-03 | ||||
| Specific INFECTED BDQ genes | ||||||
| GO category | avg. LogFC | p-value | ||||
| Endoplasmatic reticulum-Golgi intermediate compartment | -0.38 | 2.90E-07 | ||||
| Membrane raft | -0.34 | 4.93E-05 | ||||
| Cellular protein metabolic process | -0.35 | 3.32E-04 | ||||
| Lipid binding | -0.36 | 4.88E-04 | ||||
| Ribonucleoprotein complex binding | -0.37 | 5.17E-04 | ||||
| Protein dephosphorylation | -0.34 | 5.43E-04 | ||||
| Lysosomal membrane | -0.34 | 6.31E-04 | ||||
| Ubiquitin-dependent protein catabolic process | 0.74 | 6.48E-04 | ||||
Table 2
Gene Ontology (GO) functional annotation of differentially expressed genes in naïve- or hk-MTB-stimulated cells treated with PZA or RIF.
| hk-MTB + PZA | ||||||
|---|---|---|---|---|---|---|
| GO category | avg. LogFC | p-value | ||||
| Integral to lumenal side of endoplasmic reticulum membrane | 0.16 | 2.79E-04 | ||||
| Cytokine-mediated signaling pathway | 0.27 | 3.28E-04 | ||||
| Interferon-gamma-mediated signaling pathway | 0.21 | 3.56E-04 | ||||
| MHC class I receptor activity | 0.16 | 7.82E-04 | ||||
| Cytosolic small ribosomal subunit | 0.26 | 7.98E-03 | ||||
| MHC class I protein complex | 0.16 | 1.04E-03 | ||||
| Regulation of immune response | 0.22 | 1.33E-03 | ||||
| Negative regulation of MAPK cascade | 0.20 | 1.34E-03 | ||||
| Naïve + RIF | ||||||
| GO category | avg. LogFC | p-value | ||||
| Mitotic cell cycle | -0.37 | 1.53E-17 | ||||
| DNA replication | -0.34 | 2.59E-13 | ||||
| Cell cycle checkpoint | -0.36 | 4.98E-10 | ||||
| S phase of mitotic cell cycle | -0.32 | 6.29E-10 | ||||
| DNA strand elongation involved in DNA replication | -0.33 | 1.88E-09 | ||||
| G1/S transition of mitotic cell cycle | -0.36 | 2.02E-09 | ||||
| Cell division | -0.34 | 3.96E-09 | ||||
| Cell cycle | -0.32 | 2.26E-07 | ||||
| hk-MTB + RIF | ||||||
| GO category | avg. LogFC | p-value | ||||
| Melanosome | 0.26 | 4.09E-07 | ||||
| Endoplasmic reticulum unfolded protein response | 0.29 | 7.95E-07 | ||||
| Electron carrier activity | 0.23 | 9.11E-07 | ||||
| Tissue regeneration | -0.23 | 1.63E-05 | ||||
| Response to drug | -0.29 | 2.32E-05 | ||||
| NADP binding | 0.22 | 3.07E-05 | ||||
| Cellular lipid metabolic process | -0.19 | 4.05E-05 | ||||
| Lipid metabolic process | -0.23 | 4.98E-05 | ||||
Key resources table
| Reagent type (species) or resource | Designation | Source or reference | Identifiers | Additional information |
|---|---|---|---|---|
| Buffy coats (Homo sapiens) | PBMC | Etablissement Français du sang (EFS) | ||
| Cell line (Homo sapiens) | HEK 293 cell line | Obtained from Dr. Craig T. January, University of Wisconsin–Madison | ||
| Cell line (Homo sapiens) | HEK 293 cell line stably expressing hERG | Obtained from Dr. Craig T. January, University of Wisconsin–Madison | ||
| Strain, strain background (Mycobacterium tuberculosis) | H37Rv | PMID:12574362 | ||
| Strain, strain background (Salmonella Typhimurium) | S. Typhimurium | PMID:25793259 | ||
| Strain, strain background (Staphylococcus aureus) | S. aureus | PMID:25793259 | ||
| Antibody | Donkey anti- Rabbit Secondary Antibody, Alexa Fluor 555 | Thermo Fisher | Cat. #: A-31572 RRID:AB_162543 | IF (1:500) |
| Antibody | Goat anti-Mouse Secondary Antibody, Alexa Fluor 555 | Thermo Fisher | Cat. #: A-21424 RRID:AB_141780 | IF (1:500) |
| Antibody | Mouse monoclonal anti-LC3 | MBL | Cat. #: M152-3 RRID:AB_1953013 | IF (1:100) |
| Antibody | Rabbit IgG HRP Linked Whole Ab | GE Healthcare | Cat. #: NA934 RRID:AB_2722659 | WB (1:1000) |
| Antibody | Rabbit polyclonal anti- α/β-Tubulin | Cell Signaling Technology | Cat. #: 2148S RRID:AB_2288042 | WB (1:1000) |
| Antibody | Rabbit polyclonal anti-LC3B | Abcam | Cat. #: Ab48394 RRID:AB_881433 | WB (1:1000) |
| Antibody | Rabbit polyclonal anti-SQSTM1/p62 | Cell Signaling Technology | Cat. #: 5114S RRID:AB_10624872 | WB (1:1000) |
| Antibody | Rabbit polyclonal anti-TFEB | Thermo Fisher | Cat. #: PA5-65566 RRID:AB_2662642 | IF (1:100) |
| Commercial assay or kit | Griess Reaction Assay | Promega | Cat. #: G2930 RRID:SCR_006724 | |
| Commercial assay or kit | Illumina TruSeq RNA Sample Preparation kit v2 | Illumina | Cat. #: RS-122-2001/2002 RRID:SCR_010233 | |
| Commercial assay or kit | MTT Cell Proliferation Assay kit | Trevigen | Cat. #: 4890–25K RRID:SCR_012449 | |
| Commercial assay or kit | PierceTM BCA Protein Assay kit | Thermo Fisher | Cat. #: 23227 | |
| Commercial assay or kit | RNeasy Mini kit | Qiagen | Cat. #: 74104 RRID:SCR_008539 | |
| Commercial assay or kit | Seahorse XF Cell Mito Stress Test Kit | Agilent Technologies | Cat. #: 103708–100 | |
| Commercial assay or kit | Seahorse XF Glycolytic rate Assay kit | Agilent Technologies | Cat. #: 103710–100 | |
| Chemical compound, drug | Bedaquiline | Combi-Blocks | Cat. #: QV-7478 | |
| Chemical compound, drug | BAPTA-AM | Sigma-Aldrich | Cat. #: A1076 | |
| Commercial assay or kit | Image-IT TMRM | Thermo Fisher | Cat. #: I34361 | |
| Commercial assay or kit | LysoTracker DND-99 | Thermo Fisher | Cat. #: L7528 | |
| Commercial assay or kit | MitoSOX Red | Thermo Fisher | Cat. #: M36008 | |
| Commercial assay or kit | MitoTrackerTM Deep Red FM | Thermo Fisher | Cat. #: M22426 | |
| Commercial assay or kit | Fluo-8 AM | Abcam | Cat. #: Ab142773 | |
| Commercial assay or kit | DQ Green BSA | Thermo Fisher | Cat. #: D12050 | |
| Commercial assay or kit | SuperScript III Reverse Transcriptase | Thermo Fisher | Cat. #: 18080093 | |
| Commercial assay or kit | Power SYBR Green PCR Master Mix | Thermo Fisher | Cat. #: 4367659 | |
| Sequenced-based reagent | RT-qPCR primers | This paper | See Supplementary file 1 | |
| Sequenced- based reagent | siRNA: nontargeting control | Dharmacon | Cat. #: D-001810–10- 05 | |
| Sequenced-based reagent | siRNA: ON-TARGETplus Human TFEB (7942) siRNA - SMARTpool | Dharmacon | Cat. #: L-009798–00- 0005 | |
| Software, algorithm | GraphPad Prism | GraphPad Prism (https://graphpad.com) | RRID:SCR_002798 | Version 7 |
| Software, algorithm | ClueGO (Cytospace plug-in) | http://apps.cytoscape.org/apps/cluego | RRID:SCR_005748 | |
| Software, algorithm | DESeq2 | https://bioconductor.org/packages/release/ bioc/html/DESeq2.html | RRID:SCR_015687 | Version 1.18.1 |
| Software, algorithm | Icy | http://icy.bioimageanalysis.org/download/ | RRID:SCR_010587 | Version 1.0 |
| Software, algorithm | Seahorse Wave | http://www.agilent.com/en-us/products/ cell-analysis-(seahorse)/software-download-for- wave-desktop | RRID:SCR_014526 | |
| Software, algorithm | ImageJ | http://imagej.nih.gov/ij | RRID:SCR_003070 |
Additional files
-
Supplementary file 1
Supplementary materials and methods.
- https://cdn.elifesciences.org/articles/55692/elife-55692-supp1-v1.docx
-
Supplementary file 2
Oligonucleotide sequences.
- https://cdn.elifesciences.org/articles/55692/elife-55692-supp2-v1.docx
-
Transparent reporting form
- https://cdn.elifesciences.org/articles/55692/elife-55692-transrepform-v1.pdf
Download links
A two-part list of links to download the article, or parts of the article, in various formats.
Downloads (link to download the article as PDF)
Open citations (links to open the citations from this article in various online reference manager services)
Cite this article (links to download the citations from this article in formats compatible with various reference manager tools)
The antibiotic bedaquiline activates host macrophage innate immune resistance to bacterial infection
eLife 9:e55692.
https://doi.org/10.7554/eLife.55692


