Host-induced spermidine production in motile Pseudomonas aeruginosa triggers phagocytic uptake
- Department of Molecular Bacteriology, Helmholtz Centre for Infection Research, Germany
- Department of Chemical Biology, Helmholtz Centre for Infection Research, Germany
- Department of Cell Biology, Helmholtz Centre for Infection Research, Germany
- Central Facility for Microscopy, Helmholtz Centre for Infection Research, Germany
- Department of Molecular Bacteriology, Twincore, Germany
- Department of Clinical Microbiology, Rigshospitalet, Denmark
- Cluster of Excellence RESIST (EXC 2155), Hannover Medical School, Germany
Figures
Figure 1
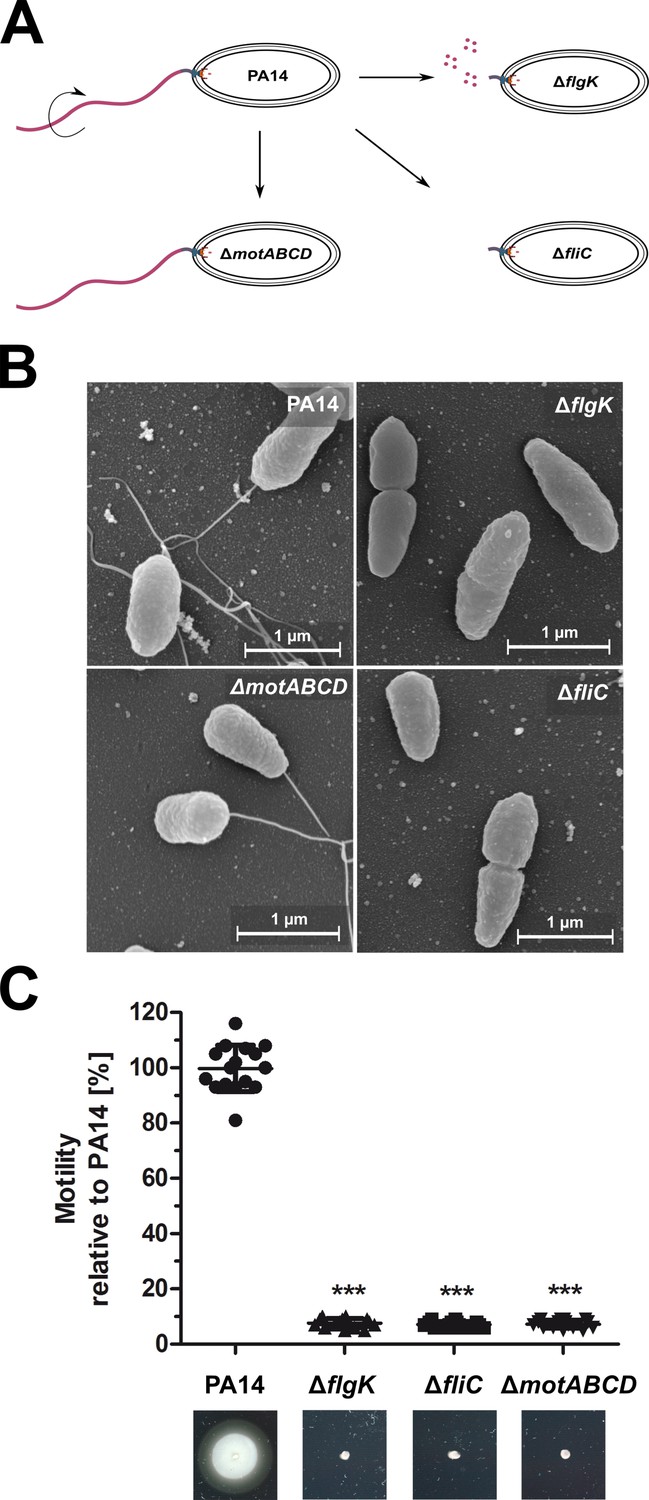
Phenotypic characterization of the P. aeruginosa strains.
(A) Schematic depiction of the mono-flagellated, fully motile PA14 wild-type phenotype and three isogenic mutants which are non-motile due to the lack of flagella (ΔfliC), non-assembled flagellin (ΔflgK), or the lack of flagellar rotation (ΔmotABCD). (B) Representative pictures of the individual P. aeruginosa motility variants analyzed by scanning electron microscopy. (C) Swimming motility assessed on semisolid agar after 16 hr. Mean ± standard deviation is displayed of 16 biological replicates from two independent experiments. ***p<0.001, one-way analysis of variance (ANOVA) (post-hoc test: Dunnett). See also: Figure 1—source data 1.
-
Figure 1—source data 1
Bacterial strains and plasmids used in this study.
- https://cdn.elifesciences.org/articles/55744/elife-55744-fig1-data1-v2.xlsx
-
Figure 1—source data 2
Scanning Electron microscopy.
- https://cdn.elifesciences.org/articles/55744/elife-55744-fig1-data2-v2.pdf
-
Figure 1—source data 3
Motility Plates.
- https://cdn.elifesciences.org/articles/55744/elife-55744-fig1-data3-v2.pdf
Figure 2 with 2 supplements
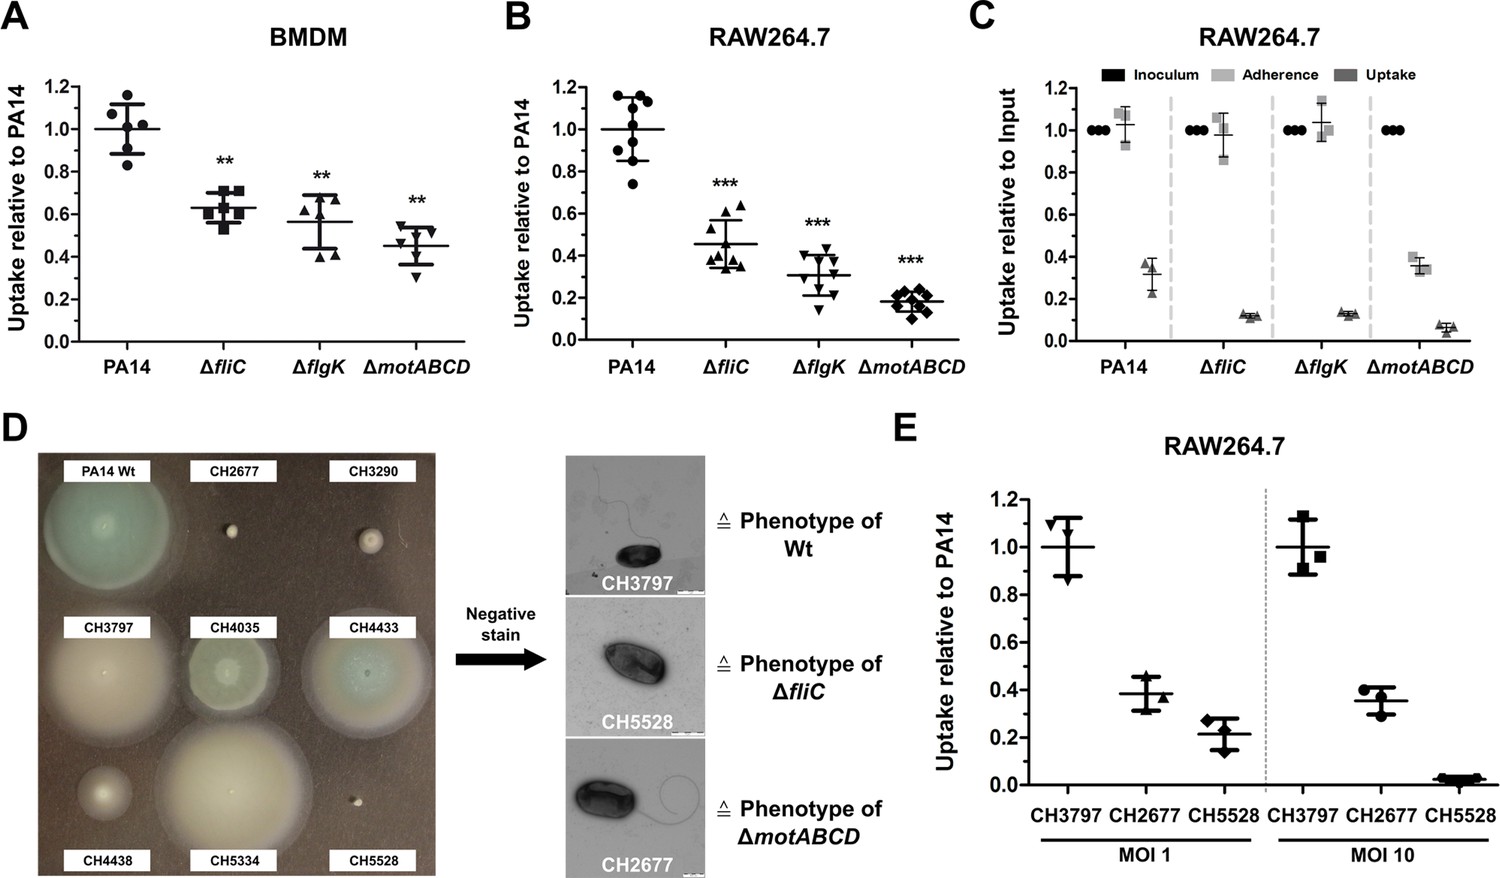
Reduced macrophage uptake of non-flagellated and non-motile P. aeruginosa strains.
Phagocytic uptake 1 hr post infection of PA14 and the three motility variants into bone-marrow-derived macrophages (BMDMs) (A) and RAW264.7 cells (B) using a multiplicity of infection (MOI) of 1. The results of at least two independent experiments with three biological replicates are depicted. (C) Adherence of bacterial cells to RAW264.7 macrophages following treatment with 10 µM cytochalasin D to inhibit phagocytic uptake. The initial bacterial load was set to 100% (black, technical replicates) while the bacterial uptake without cytochalasin D is shown as a control. The data of three biological replicates is shown. (D) Left: Representative screen of clinical P. aeruginosa isolates for swimming motility on semi solid agar plates. Right: Analysis of clinical isolates using a negative-staining to identify the presence of flagella. (E) Phagocytic uptake of clinical isolates of P. aeruginosa in RAW264.7 cells 1 hr post infection using an MOI 1 and 10. Mean ± standard deviation of three biological replicates is displayed. **p<0.01; ***p<0.001 in one-way analysis of variance (ANOVA) (post-hoc test: Dunnett).
-
Figure 2—source data 1
Negative Stain.
- https://cdn.elifesciences.org/articles/55744/elife-55744-fig2-data1-v2.pdf
Figure 2—figure supplement 1

Phagocytosis and adherence of P. aeruginosa motility variants.
(A) Influence of a centrifugation step on the bacterial uptake of non-motile ΔflgK by J774 macrophages. Mean ± standard deviation of three biological replicates is displayed (B) Phagocytic uptake of PA14 and its flagella variants 1 hr post infection in J774 cells using an MOI of 1. Mean ± standard deviation of six biological replicates of two independent experiments is displayed (C) Determination of cells that adhere to J774 macrophages. 10 µM cytochalasin D was used to stop phagocytosis. Mean ± standard deviation of three biological replicates is displayed. The inoculated bacteria (black, technical replicates) were set as 100% and the uptake without cytochalasin D served as control. ***p<0.001, one-way analysis of variance (ANOVA) (post-hoc test: Dunnett). (D) Effect of different cytochalasin D concentrations on the adherence of PA14 on RAW264.7 macrophages 1 hr post infection using an MOI of 1. (E) Effect of different cytochalasin D concentrations on the phagocytic uptake of PA14 into RAW264.7 macrophages 1 hr post infection using an MOI of 1. (F) Determination of internalized bacteria in RAW264.7 macrophages upon treatment with 10 µM cytochalasin. Mean ± standard deviation of three biological replicates is displayed.
Figure 2—figure supplement 2

FliC complementation restores the wild-type phenotype.
(A) Representative pictures of the individual P. aeruginosa variants analyzed by scanning electron microscopy. (B) Swimming motility assessed on semisolid agar containing 500 µg/ml kanamycin after 16 hr. Mean ± standard deviation of nine biological replicates from two independent experiments is displayed. (C) Phagocytic uptake 1 hr post infection of PA14, ΔfliC and its complemented strain into bone-marrow derived macrophages (BMDMs). Mean ± standard deviation of five biological replicates is displayed. ***p<0.001; **p<0.01 (one-way analysis of variance (ANOVA), Dunnett’s post-hoc test).
Figure 3 with 4 supplements
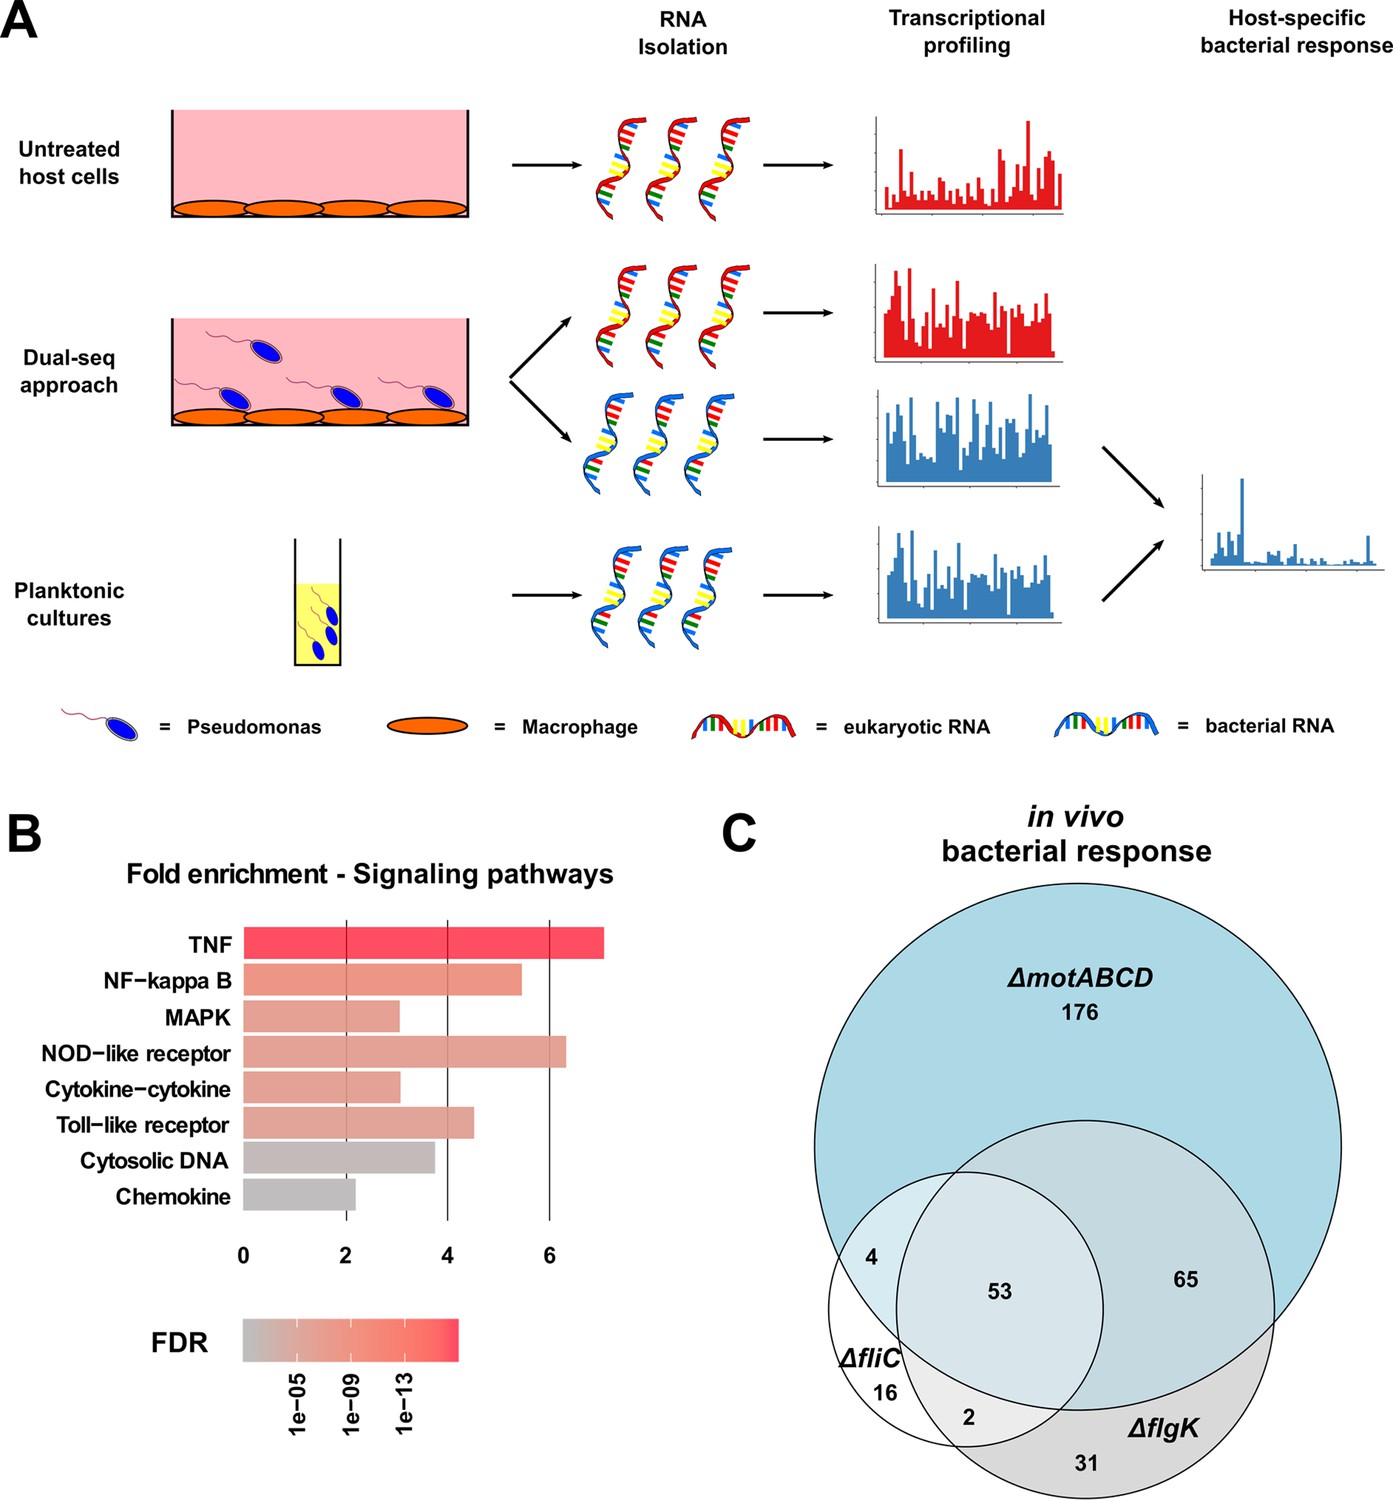
Dual-sequencing approach.
(A) Experimental set-up to record the transcriptional profiles of infected RAW264.7 macrophages, P. aeruginosa upon host-cell contact, and P. aeruginosa grown in rich medium as a planktonic culture. (B) RAW264.7 pathways that are activated upon infection with PA14. (C) Venn diagram of the differentially expressed genes in the three motility mutants (relative to PA14) upon contact with the RAW264.7 macrophages as compared to planktonic conditions (FDR ≤ 0.05).
-
Figure 3—source data 1
Summary of the 20 differentially expressed genes that are shared by the motility mutants in comparison to PA14 Wt.
- https://cdn.elifesciences.org/articles/55744/elife-55744-fig3-data1-v2.xlsx
-
Figure 3—source data 2
Significantly enriched host pathways.
- https://cdn.elifesciences.org/articles/55744/elife-55744-fig3-data2-v2.csv
Figure 3—figure supplement 1

Venn Diagrams to visualize the dual-seq transcriptional responses.
(A) Genes that were differentially expressed under LB growth conditions in the three motility mutants as compared to PA14. (B) Visualization of differentially regulated host genes in RAW264.7 macrophages upon bacterial infection in comparison to PBS-treated cells. Orange: Host genes induced by all P. aeruginosa strains. Cyan: Host genes only induced by non-motile variants. (C) Genes that were differentially regulated in the three motility mutants and PA14, when grown in the presence of host cells as compared to rich medium planktonic conditions. Orange: Bacterial genes regulated in all strains. Cyan: Bacterial genes only regulated in non-motile variants. All shown genes have a FDR ≤ 0.05.
Figure 3—figure supplement 2
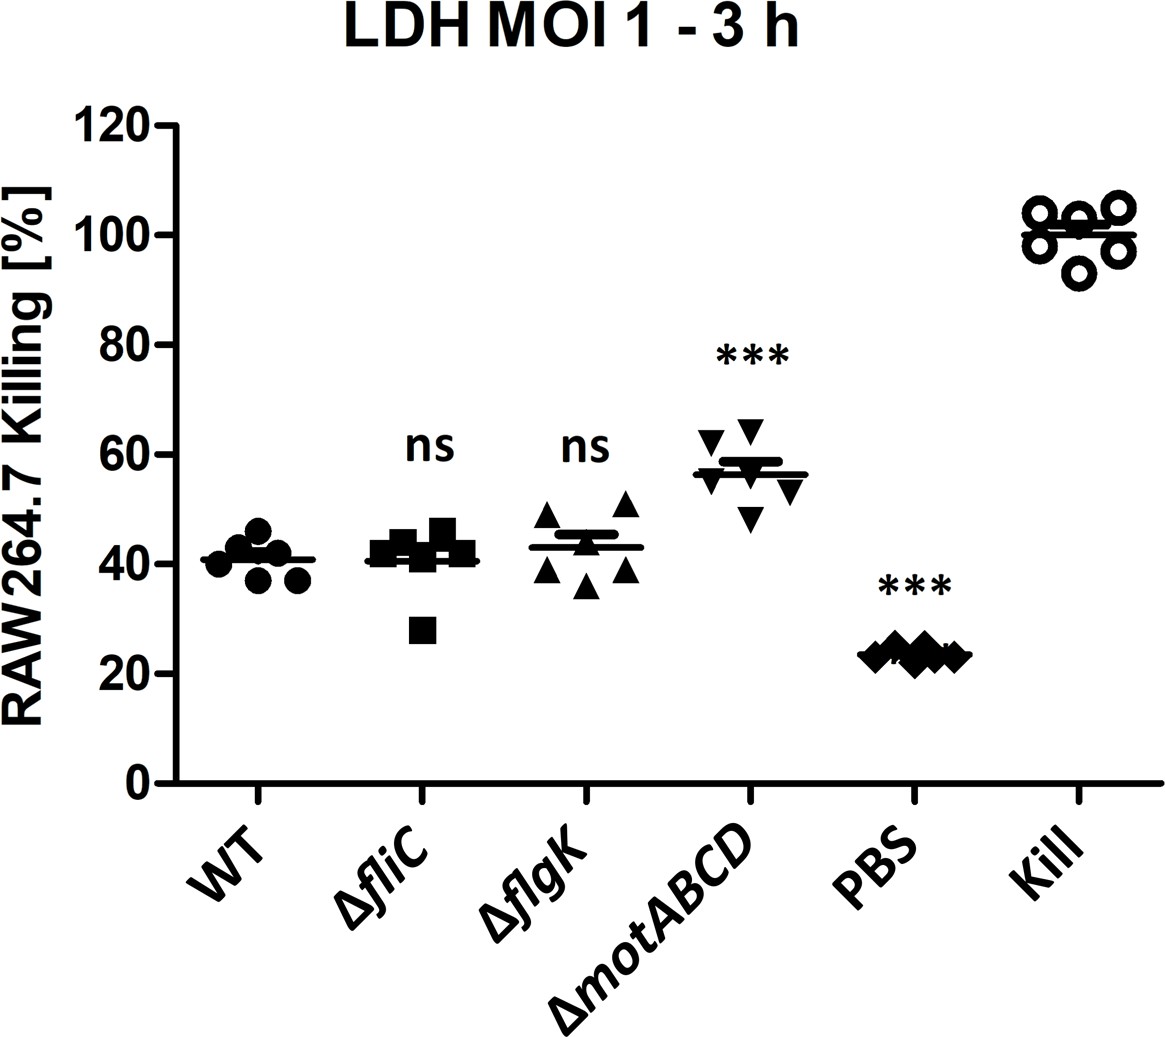
Lactate Dehydrogenase (LDH) assay of infected RAW264.7 macrophages.
RAW macrophages were infected with 5 × 10⁵ – MOI 1 for 3 hr without gentamycin treatment to simulate the dual-sequencing experiment. PBS served as the negative and 10% (v/v) Triton-X100 as killing control. Mean ± standard deviation of six biological replicates from two independent experiments is shown. **p<0.01; ***p<0.001 (one-Way ANOVA, Dunnett’s post-hoc test).
Figure 3—figure supplement 3
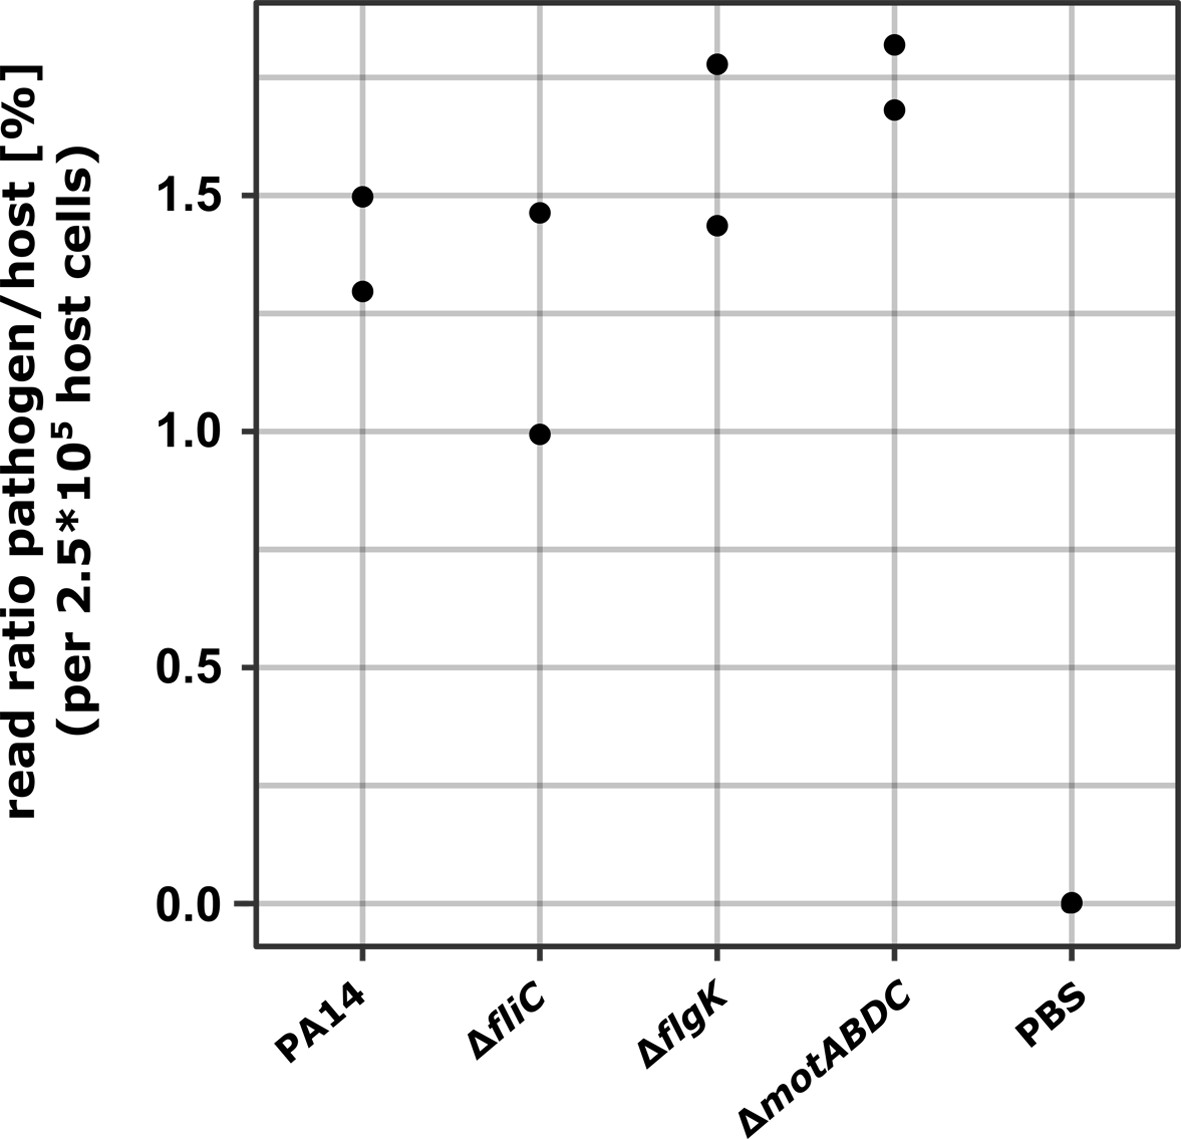
Pathogen-to-host read ratio.
The read ratio between read counts of bacteria and host cells was analyzed. Mapped paired end reads of P. aeruginosa strains were normalized according their exact infection dose (approximately MOI 1) and divided by reads that mapped concordantly to the mouse genome. Data are shown in percentage.
Figure 3—figure supplement 4
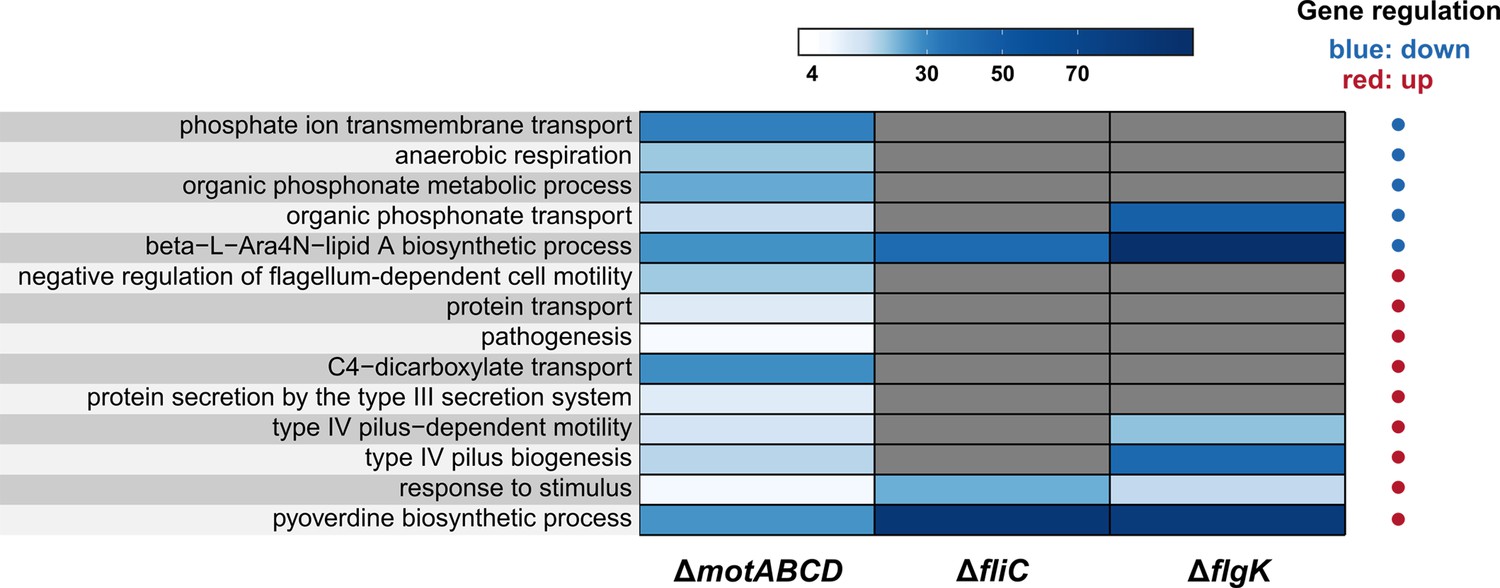
Functional GO term enrichment.
Enriched gene functions (GO biological process) of the individual mutant strains in comparison to PA14 under infection conditions (see Figure 3C). Functional enrichment of genes that were significantly (FDR ≤ 0.05) higher/lower expressed between in vivo and in vitro condition in at least one mutant in comparison to PA14 is shown (abs. log2FC ≥ 1 and FDR ≤ 0.05, hypergeometric test). Grey bars indicate no functional enrichment, colors from white to dark blue indicate the fold change enrichment. The direction of gene regulation for each function is indicated by blue (downregulated) and red (upregulated) dots.
-
Figure 3—figure supplement 4—source data 1
Enriched functions in the Pseudomonas variants.
- https://cdn.elifesciences.org/articles/55744/elife-55744-fig3-figsupp4-data1-v2.csv
Figure 4 with 1 supplement
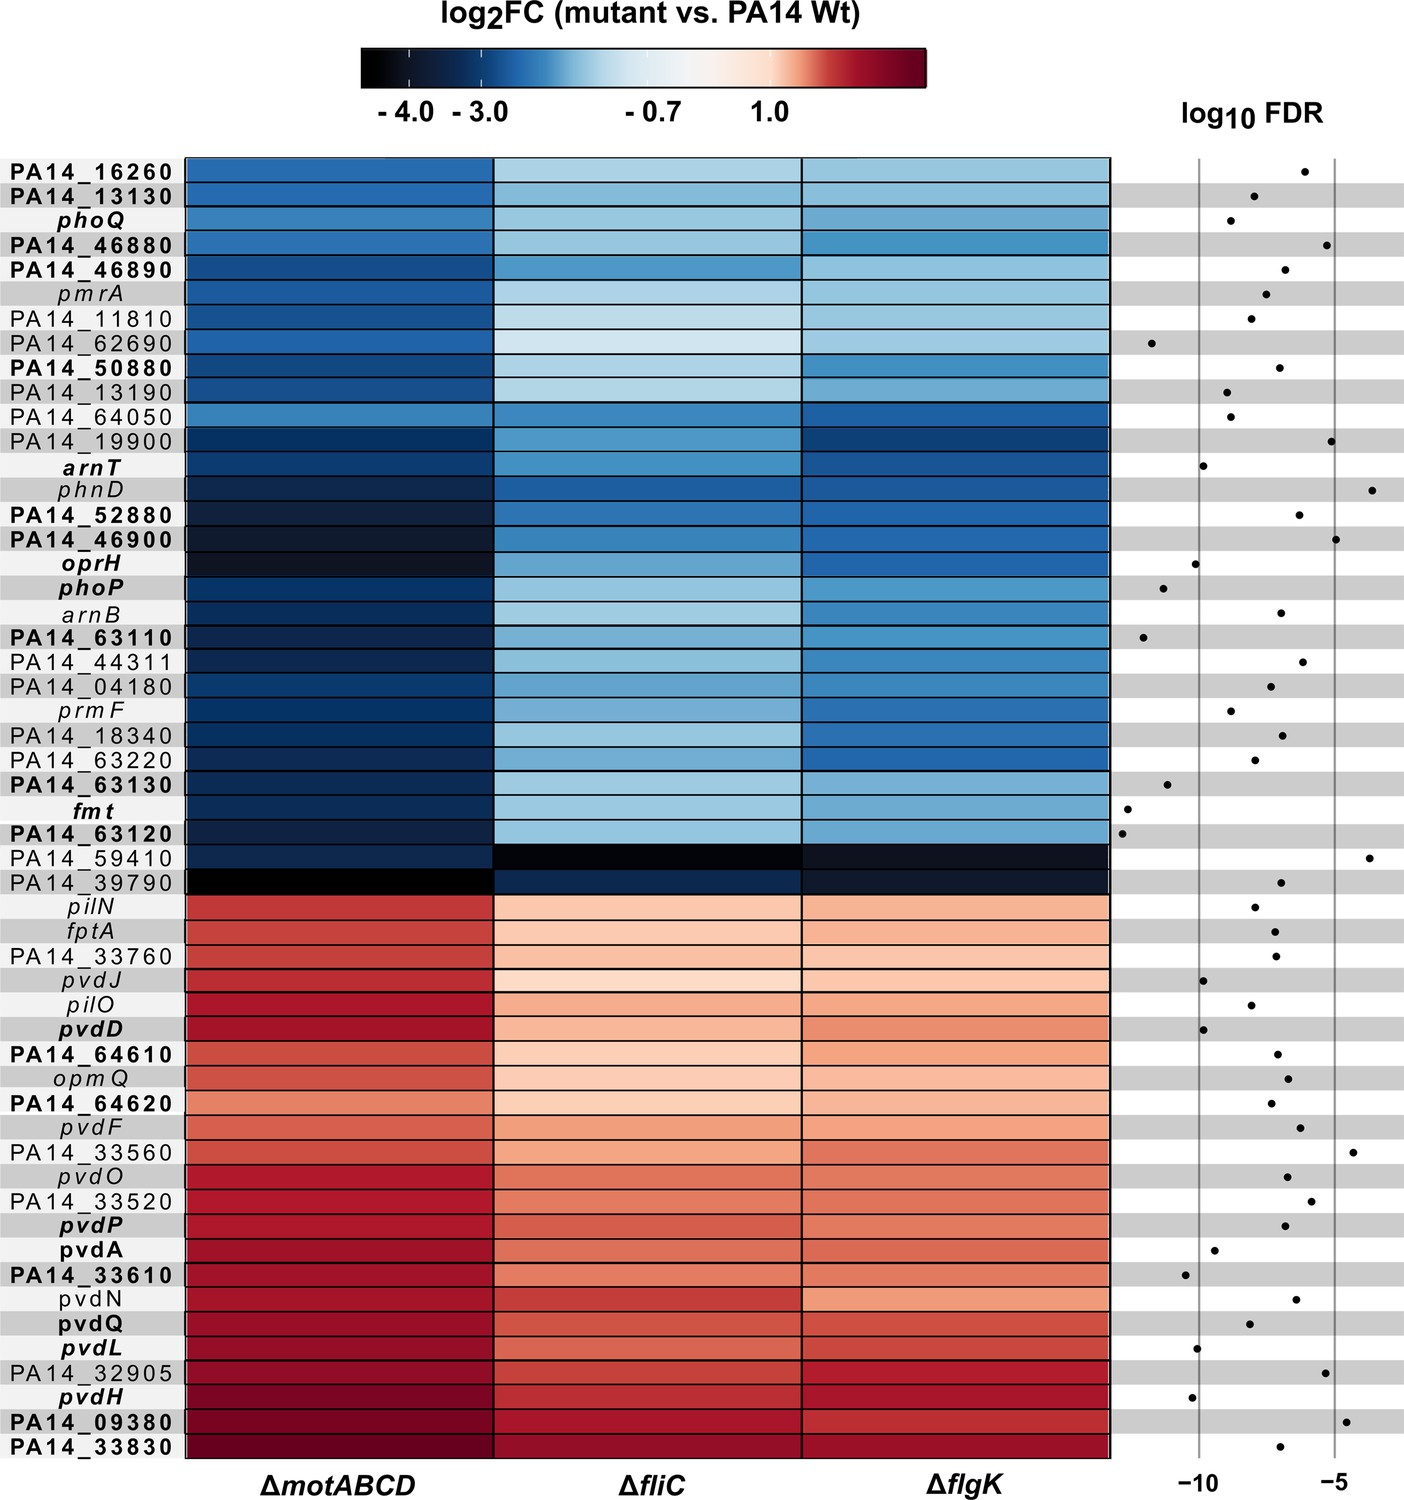
Motility mutant specific transcriptional responses in the presence of macrophages.
Genes that were differentially expressed (log2FC, glmTreat function, R package edgeR) in all three flagella mutants as compared to PA14 (n = 53 genes) are listed. The color code depicts the log2FC expression from negative (blue) via 0 (white) to positive (red). Genes that are additionally differentially expressed between host-cell contact and LB growth conditions are shown in bold (FDR ≤ 0.05, 26 genes; additional FDR ≤ 0.0001 for analysis of variance (ANOVA)-like test using the function glmQLFTest of the edgeR package).
-
Figure 4—source data 1
Bacterial gene regulation.
- https://cdn.elifesciences.org/articles/55744/elife-55744-fig4-data1-v2.csv
-
Figure 4—source data 2
Positive interspecies correlation of 53 PA14 genes and their association with 74 host PIP3 genes.
- https://cdn.elifesciences.org/articles/55744/elife-55744-fig4-data2-v2.xlsx
-
Figure 4—source data 3
Negative interspecies correlation of 53 PA14 genes and their association with 74 host PIP3 genes.
- https://cdn.elifesciences.org/articles/55744/elife-55744-fig4-data3-v2.xlsx
-
Figure 4—source data 4
Differentially expressed genes between the fliC mutant and PA14 wild type after a medium switch from LB to DMEM medium containing FCS.
- https://cdn.elifesciences.org/articles/55744/elife-55744-fig4-data4-v2.xlsx
Figure 4—figure supplement 1

Cytokine measurement in the supernatant of infected macrophages using ELISA.
TNF-α measurements of RAW264.7 (A) and BMDM cells (B) after 6 hr infection with P. aeruginosa at an MOI of 1. IL-6 measurements of RAW264.7 (C) and BMDM cells (D) after 6 hr infection with P. aeruginosa with an MOI of 1. Mean ± standard deviation of three representative biological replicates is displayed. *p<0.05; **p<0.01; ***p<0.001 (one-way analysis of variance (ANOVA), Dunnett’s post-hoc test).
Figure 5
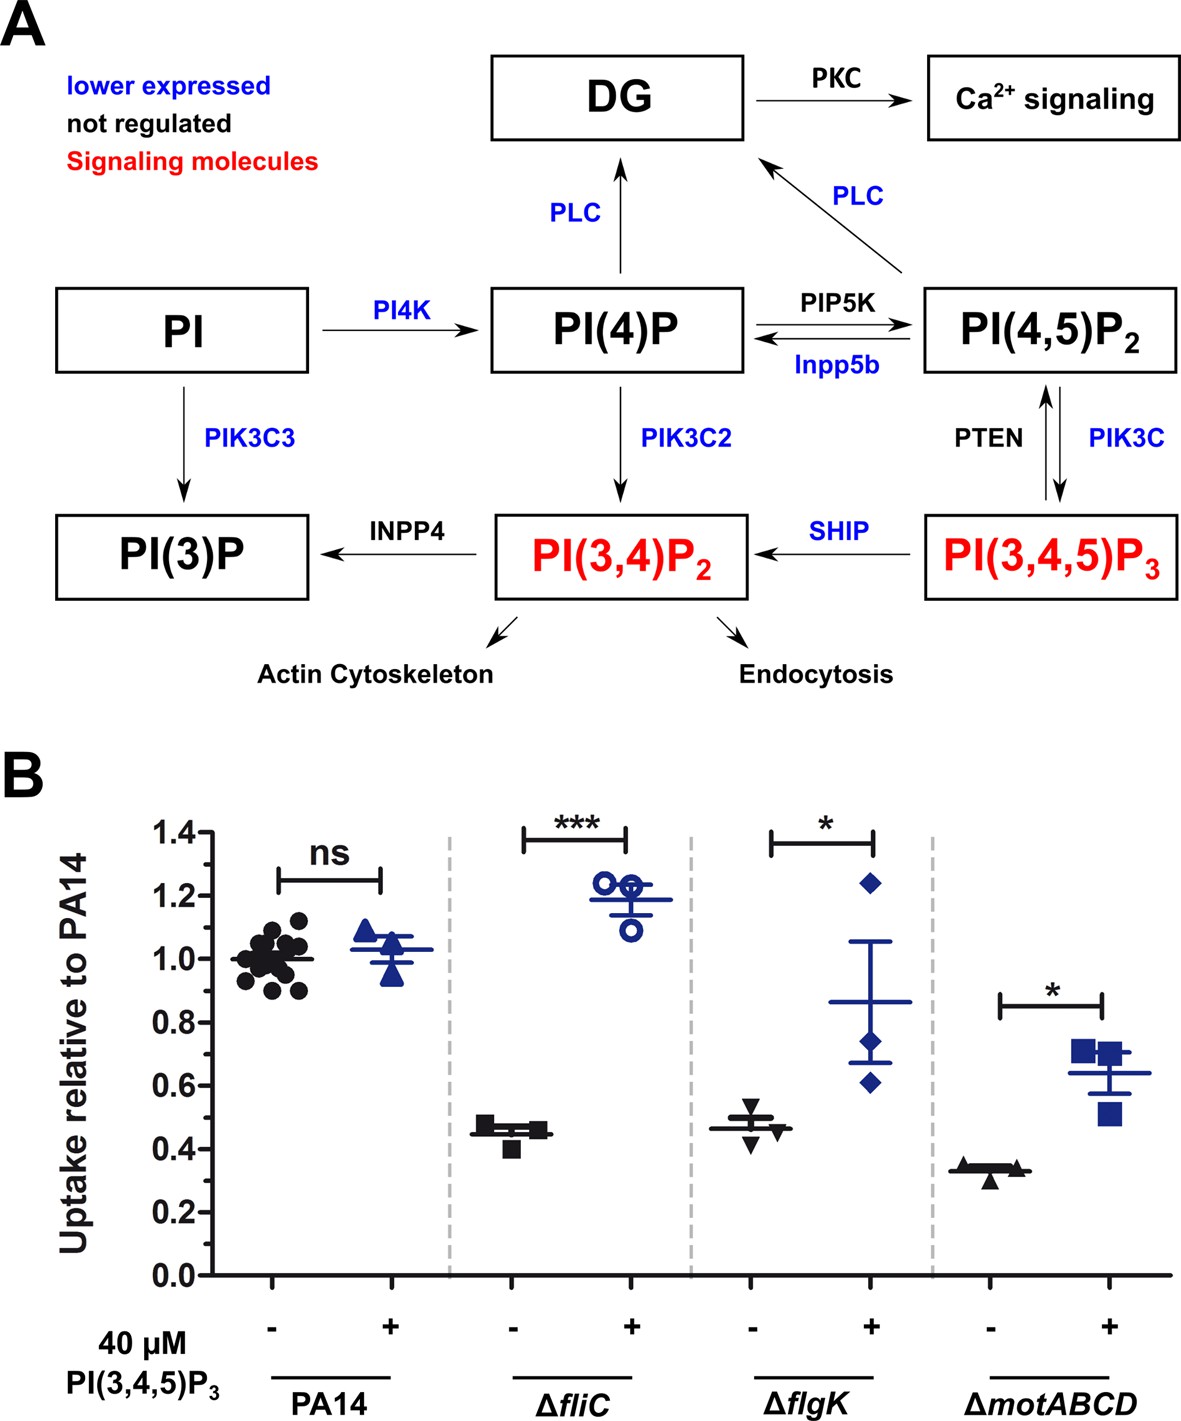
Non-motile variants of P. aeruginosa elicit a reduced activation of the PIP3 pathway in macrophages.
(A) Dual-seq analysis revealed that the pathways leading to the signaling molecules PI(3,4)P2 and PI(3,4,5)P3 (in red), and the activation of the calcium-dependent cell rearrangements are expressed at lower levels in RAW264.7 cells infected with the flagellar mutants in comparison to PA14. The figure is based on annotations of the KEKK pathway mmu04070. The intersection of three pathways with each top 1000 genes of the motility mutants is shown. (B) Phagocytic uptake of PA14 and its motility variants in RAW264.7 cells 1 hr post infection using an MOI of 1 in the presence (blue, +) or absence (black, −) of 40 µM PI(3,4,5)P3. Mean ± standard deviation of three individual experiments is displayed. *p<0.05; ***p<0.001 (one-way analysis of variance (ANOVA), Dunnett’s post-hoc test).
-
Figure 5—source data 1
Enrichment of calcium and PIP3-related functions of a downregulated (log2FC < 0) subset of Top 1000 genes from ΔfliC, ΔflgK and ΔmotABCD mutants.
- https://cdn.elifesciences.org/articles/55744/elife-55744-fig5-data1-v2.xlsx
Figure 6 with 1 supplement
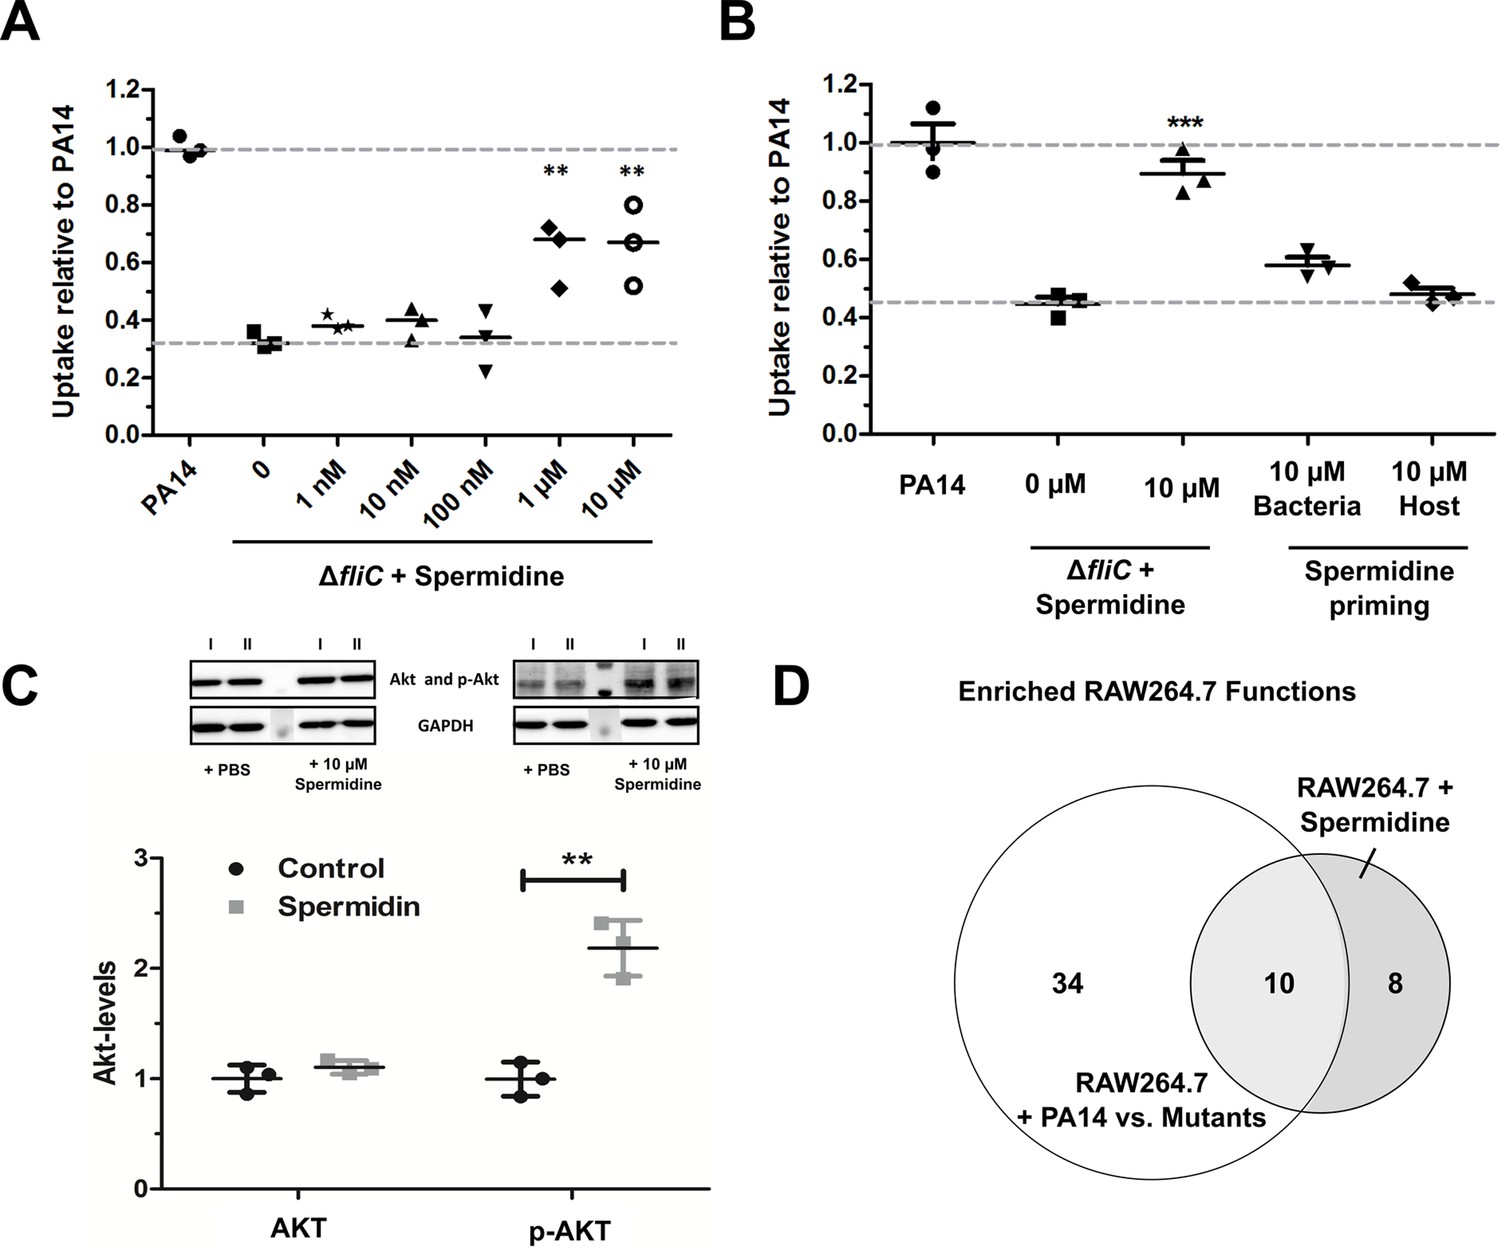
Spermidine enhances phagocytic uptake.
(A) Spermidine was externally added at the indicated concentrations to the ΔfliC mutant. Using MOI of 1, the phagocytic uptake in RAW264.7 macrophages was examined 1 hr post infection. Mean ± standard deviation of three independent experiments are displayed. (B) Determination of phagocytic uptake after priming bacteria or RAW264.7 macrophages with 10 µM spermidine. Mean ± standard deviation of three representative biological replicates is displayed. ***p<0.001, two-way analysis of variance (ANOVA) (C) AKT phosphorylation was assessed and quantified by western blot following incubation of RAW264.7 macrophages for 1 hr with 10 µM spermidine. PBS treated cells served as control. N = 3. **p<0.01, two-way ANOVA (D) The transcriptional profile of spermidine-treated RAW264.7 macrophages was accessed and functional enrichment (of top 100 genes) was compared to the PA14-specific response (intersection of enriched functions from top 1000 genes of ΔflgK, ΔmotABCD, and ΔfliC versus PA14 genes) of the macrophages. Venn diagram to illustrate the overlap of enriched (FDR ≤ 0.1) functions among genes that were differentially regulated following spermidine treatment and infection with PA14. The Venn diagram contains functional categories as a result of the functional enrichment using the DAVID tool with default categories (e.g. GO terms, COG ontology, and KEGG pathways).
-
Figure 6—source data 1
Spermidine induced gene induction.
- https://cdn.elifesciences.org/articles/55744/elife-55744-fig6-data1-v2.csv
-
Figure 6—source data 2
Shared enriched functions of spermidine-treated and PA14-infected macrophages.
- https://cdn.elifesciences.org/articles/55744/elife-55744-fig6-data2-v2.xlsx
Figure 6—figure supplement 1
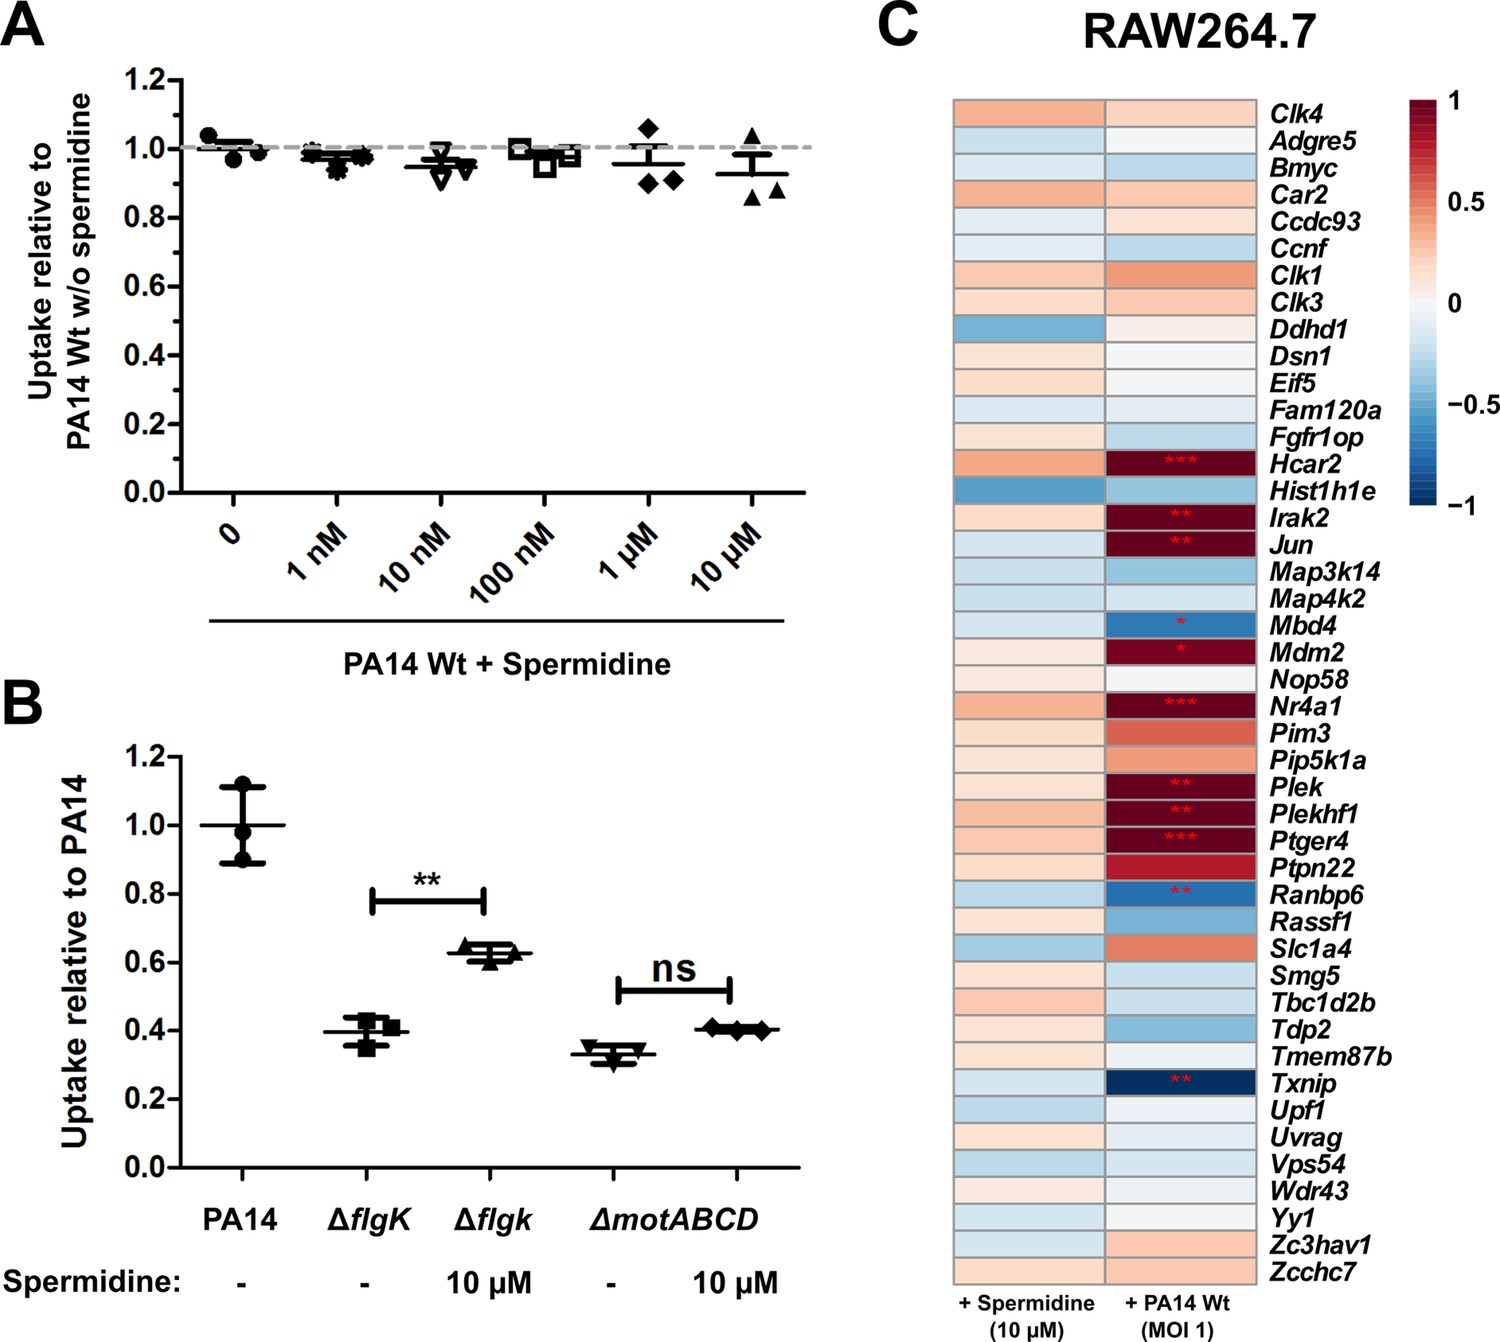
Effect of spermidine on phagocytic uptake.
(A) Effect of spermidine on the phagocytic uptake of PA14 in RAW264.7 macrophages using an MOI of 1. Mean ± standard deviation of three biological replicates is displayed. (B) Effect of 10 µM spermidine on the phagocytic uptake of the ΔflgK and ΔmotABCD mutants in RAW264.7 macrophages using an MOI of 1. Mean ± standard deviation of three biological replicates is displayed. **p<0.01 (one-way analysis of variance (ANOVA), Dunnett’s post-hoc test). (C) Transcriptional regulation of kinases in RAW264.7 cells. RAW264.7 macrophages that were either treated with 10 µM spermidine or infected with P. aeruginosa PA14 (MOI 1). Colors indicate log2FC (limited to −1/1). ***FDR < 0.001; **FDR < 0.01; *FDR < 0.05.
Figure 7 with 2 supplements
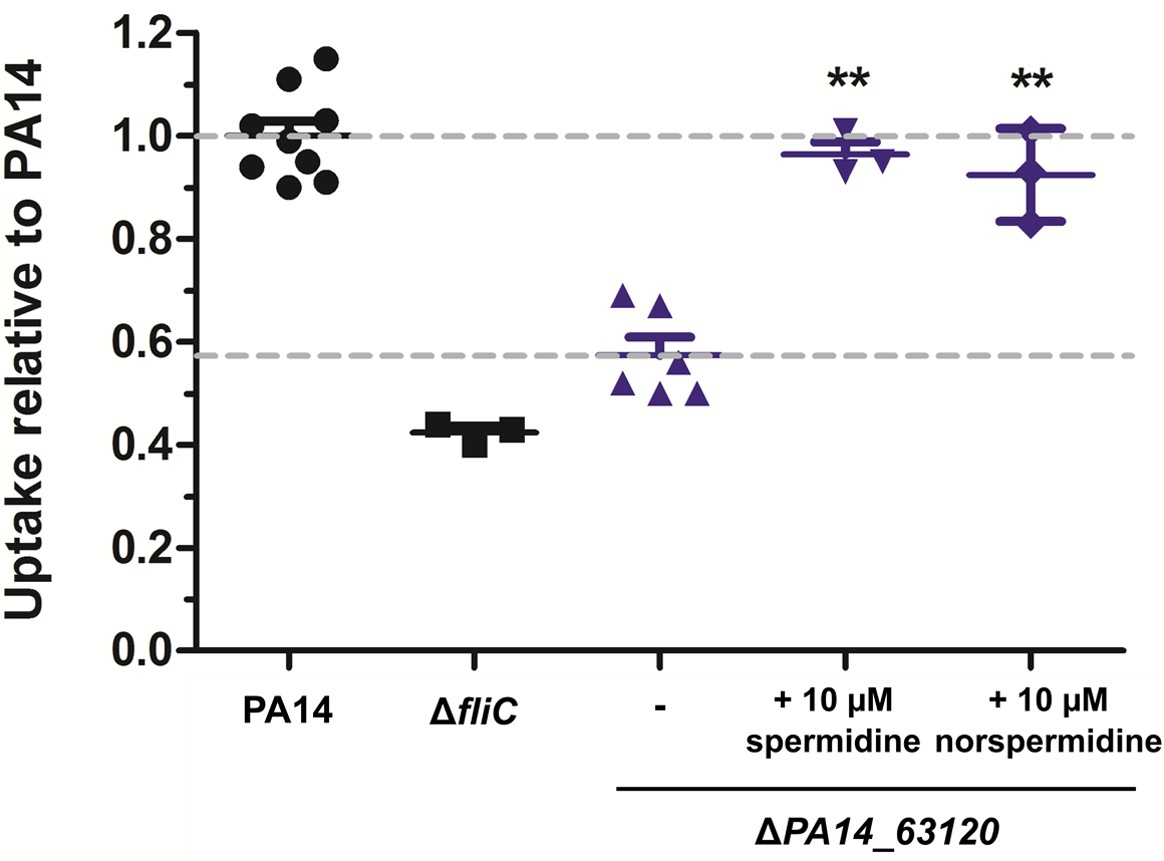
Spermidine and norspermidine restore phagocytic uptake of a spermidine knock-out mutant.
Spermidine was externally added at the indicated concentrations to the ΔPA14_63120 mutant (blue). Using an MOI 1, the phagocytic uptake into RAW264.7 macrophages 1 hr post infection was examined and compared to PA14 and the ΔfliC control. Mean ± standard deviation is displayed. **p<0.01 (one-way analysis of variance (ANOVA), Dunnett’s post-hoc test).
Figure 7—figure supplement 1
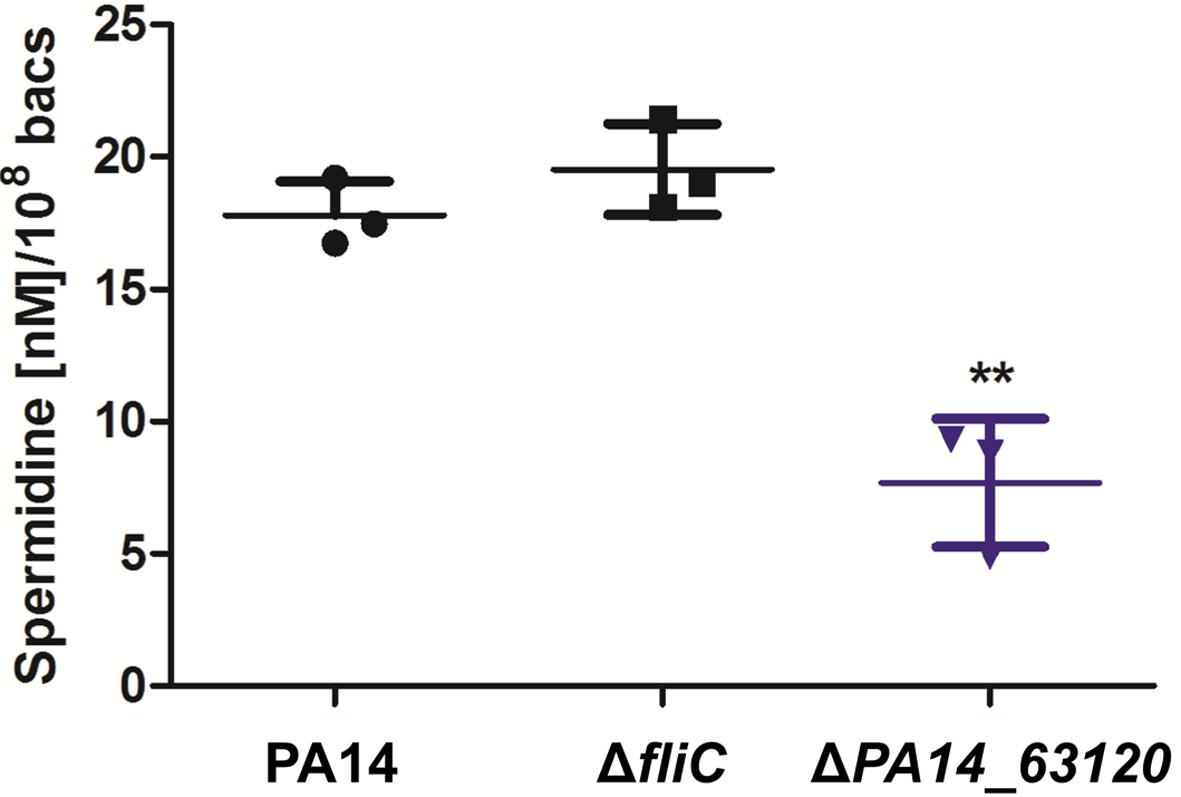
Quantification of spermidine using LC-MS.
All strains were grown in BM2 media containing glucose as carbon source. Membrane-bound spermidine was extracted from PA14 and its motility variants, derivatized with phenylisothiocyanate and quantified using LC-MS. The amount of spermidine was determined using a calibration curve of adjusted spermidine concentrations and normalized to the bacterial count determined by plating. Mean ± standard deviation of three biological replicates is displayed. **p<0.01 (one-way analysis of variance (ANOVA), Dunnett’s post-hoc test).
Figure 7—figure supplement 2
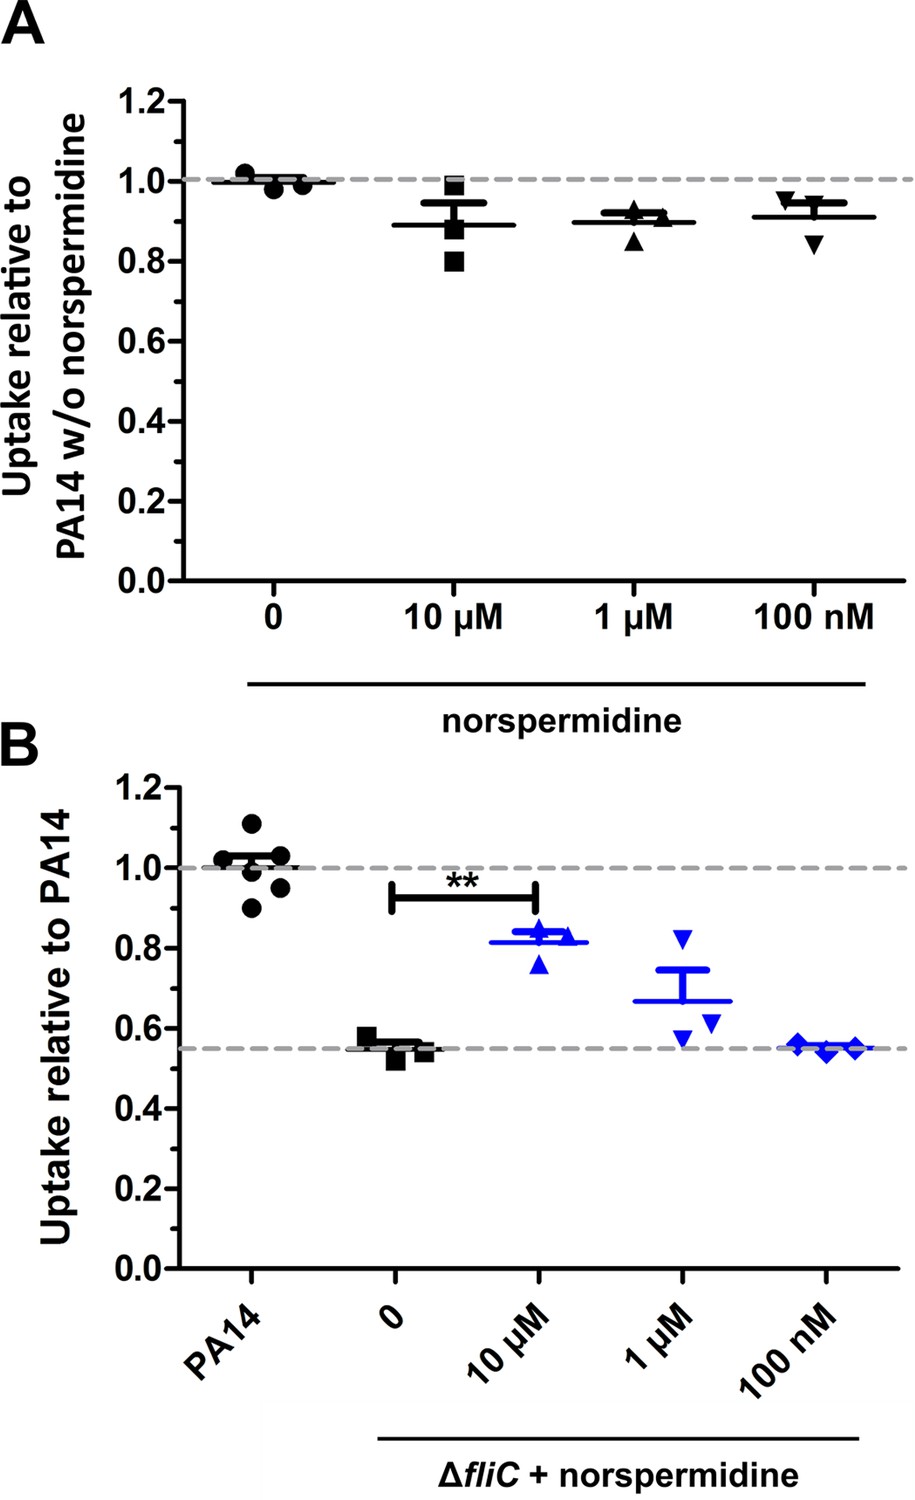
Effect of norspermidine on phagocytic uptake.
(A) Effect of norspermidine on the phagocytic uptake of PA14 in RAW264.7 macrophages using an MOI of 1. Mean ± standard deviation of three biological replicates is displayed. (B) Effect of 10 µM norspermidine on the phagocytic uptake of ΔfliC on RAW264.7 macrophages using an MOI of 1. Mean ± standard deviation of biological replicates is displayed. **p<0.01 (one-way analysis of variance (ANOVA), Dunnett’s post-hoc test).
Figure 8
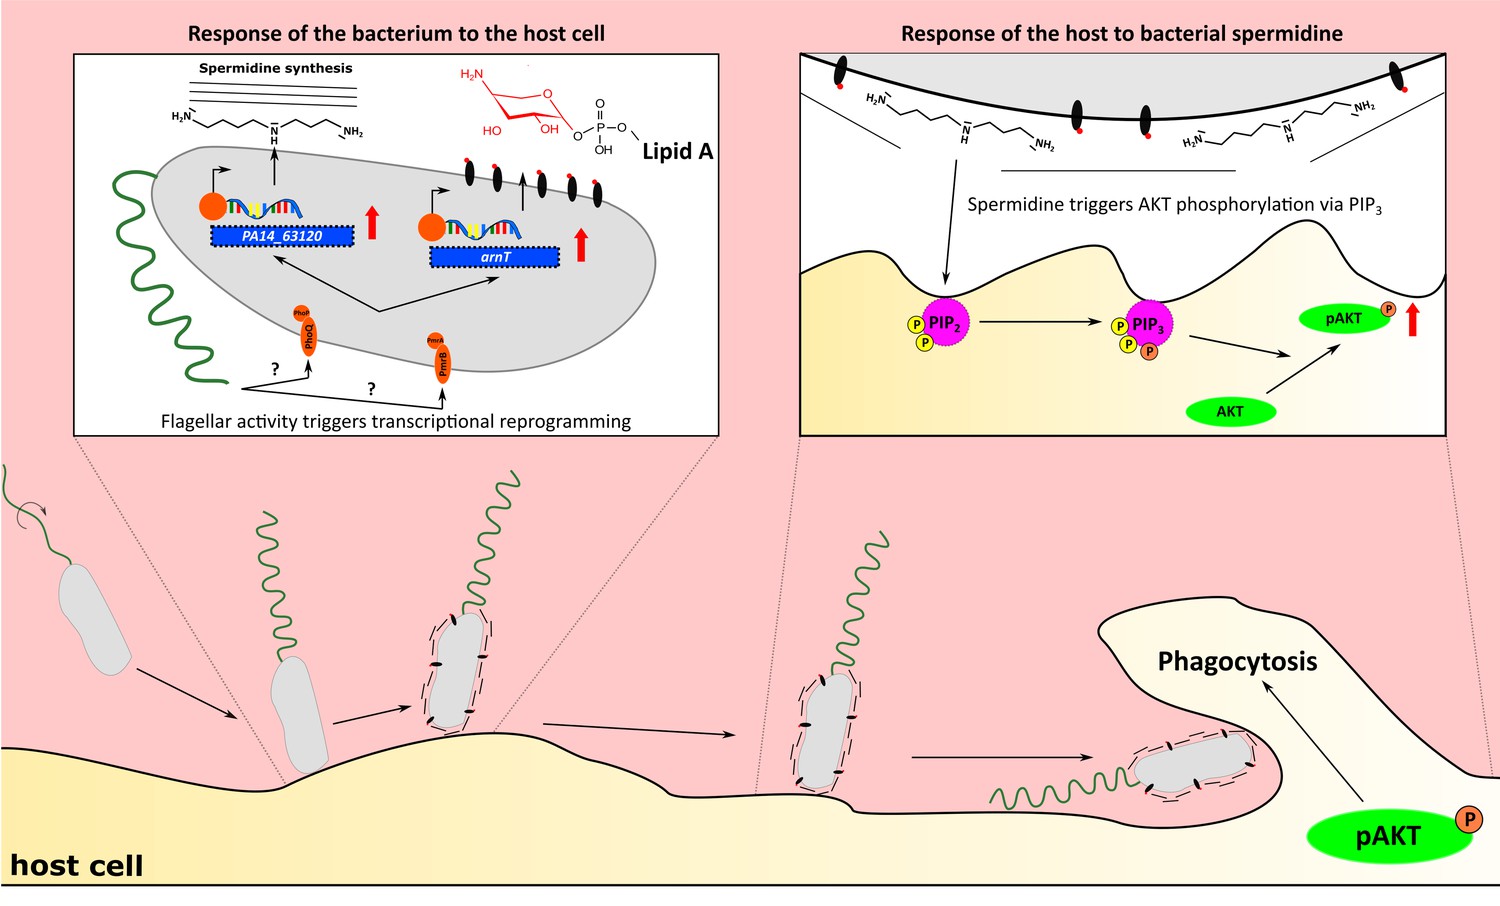
Flagellum-dependent Pseudomonas–macrophage interaction.
Upon host contact, changes in flagellar activity (possibly sensed by PmrAB and PhoPQ) trigger a transcriptional program, which results in the synthesis of membrane-associated spermidine and the masking of the Lipid A. In the host, AKT phosphorylation through PIP3 is stimulated by spermidine to increase phagocytosis.
Tables
Key resources table
| Reagent type (species) or resource | Designation | Source or reference | Identifiers | Additional information |
|---|---|---|---|---|
| Chemical compound, drug | Bacto-Agar | BD | 214010 | - |
| Chemical compound, drug | Gentamycin | Sigma | G1397-10ml | - |
| Chemical compound, drug | PtdIns(3,4,5)P3 | Echelon | P-3916 | - |
| Chemical compound, drug | Shuttle PIPTM Carrier 2 | Echelon | P-9C2 | - |
| Chemical compound, drug | DMEM | Gibco | 31885–023 | - |
| Chemical compound, drug | RPMI | Gibco | 21875–034 | - |
| Chemical compound, drug | FCS | Biowest | S1810-500 | - |
| Chemical compound, drug | BSA | Sigma | A9418-50 | - |
| Chemical compound, drug | HEPES | Gibco | 15630–056 | - |
| Chemical compound, drug | Cytochalasin D | Sigma | C2618-200UL | - |
| Chemical compound, drug | Spermidine | Sigma | S0266-25G | - |
| Chemical compound, drug | Norspermidine | Sigma | I1006A-100G-A | - |
| Chemical compound, drug | TritonX-100 | BioRad | #161–0407 | - |
| Chemical compound, drug | RNAprotect Bacteria Reagent | Qiagen | #76506 | - |
| Chemical compound, drug | Pyridine, HPLC Grade, 99.5+% | Alfa Aesar | 110-86-1 | - |
| Chemical compound, drug | Phenylisothiocyanate (PITC) | Sigma | 78780 | - |
| Antibody | Rabbit anti- AKT | Cell Signaling Technology | #9272 | 1:1000 |
| Antibody | Rabbit anti-p-AKT (Ser473) | Cell Signaling Technology | #9271 | 1:1000 |
| Antibody | Mouse anti-GAPDH | Calbiochem | CB1001 | 1:10000 |
| Antibody | Goat anti-mouse IgG+IgM (H+L) | Dianova | 115-035-068 | 1:10000 |
| Antibody | Goat anti-rabbit IgG (H+L) | Dianova | 111-035-045 | 1:10000 |
| Commercial assay, kit | NEBNext Single Cell/low input Input RNA Kit | NEB | E6240S | - |
| Commercial assay, kit | Ribo-Zero rRNA removal Kit | Illumina | - | - |
| Commercial assay, kit | NEBNext Ultra II Directional RNA Library Prep Kit | NEB | E7760L | - |
| Commercial assay, kit | ELISA MAX Standard Set Mouse TNF-α | BioLegend | #430901 | - |
| Commercial assay, kit | ELISA MAX Standard Set Mouse IL-6 ELISA MAX Standard Set Mouse IL-6 ELISA MAX Standard Set Mouse IL-6 | BioLegend | #431301 | - |
| Cell line (M. musculus) | RAW264.7 macrophages | - | RRID:CVCL_0493 | - |
| Cell line (M. musculus) | J774 cells | - | RRID:CVCL_0358 | |
| Cell line (M. musculus) | BMDMs C57BL/6 | Own breeding | N/A | - |
| Cell line (M. musculus) | L929 | - | RRID:CVCL_0462 | - |
| Strain, strain background (P. aeruginosa) | PA14 wild-type | Amiel et al., 2010 | N/A | - |
| Strain, strain background (P. aeruginosa) | ΔfliC | Amiel et al., 2010 | N/A | - |
| Strain, strain background (P. aeruginosa) | ΔflgK | Amiel et al., 2010 | N/A | - |
| Strain, strain background (P. aeruginosa) | ΔmotABCD | Amiel et al., 2010 | N/A | - |
| Strain, strain background (P. aeruginosa) | ΔPA14_63120 | This study | N/A | - |
| Strain, strain background (P. aeruginosa) wild-type | CH2677 | Hornischer et al., 2019 | N/A | Clinical Isolate |
| Strain, strain background (P. aeruginosa) wild-type | CH3290 | Hornischer et al., 2019 | N/A | Clinical Isolate |
| Strain, strain background (P. aeruginosa) | CH3797 | Hornischer et al., 2019 | N/A | Clinical Isolate |
| Strain, strain background (P. aeruginosa) | CH4035 | Hornischer et al., 2019 | N/A | Clinical Isolate |
| Strain, strain background (P. aeruginosa) | CH4433 | Hornischer et al., 2019 | N/A | Clinical Isolate |
| Strain, strain background (P. aeruginosa) | CH4438 | Hornischer et al., 2019 | N/A | Clinical Isolate |
| Strain, strain background (P. aeruginosa) | CH5334 | Hornischer et al., 2019 | N/A | Clinical Isolate |
| Strain, strain background (P. aeruginosa) | CH5528 | Hornischer et al., 2019 | N/A | Clinical Isolate |
| Strain, strain background (M. musculus) | C57BL/6 | Own Breeding | N/A | - |
| Recombinant DNA reagent | pEX18-Gm | Lab stock | N/A | Suicide vector |
| Software, algorithm | ImageJ | - | RRID:SCR_003070 | v1.52p |
| Software, algorithm | Prism | Graphpad | N/A | v5.01 |
| Software, algorithm | Zeiss SEM Smart | Zeiss | N/A | v5.05 |
| Software, algorithm | ITEM Build 1210 | Olympus Soft Imaging | N/A | - |
| Software, algorithm | Skyline | MacCoss Laboratory | N/A | v18.305 |
| Software, algorithm | R Project | - | RRID:SCR_001905 | v3.6.1 |
| Software, algorithm | Analyst | ABSciex | N/A | v1.6.2 |
| Software, algorithm | Fastqc | N/A | RRID:SCR_014583 | v0.11.4 |
| Software, algorithm | tophat2 | N/A | RRID:SCR_013035 | v2.0.12 |
| Software, algorithm | Bowtie2 | N/A | RRID:SCR_005476 | v2.3.4.1 |
| Software, algorithm | Samtools | N/A | RRID:SCR_002105 | v0.1.19.0 |
| Software, algorithm | bedtools | N/A | RRID:SCR_006646 | v2.29.0 |
| Software, algorithm | DAVID (https://david.ncifcrf.gov/) | N/A | RRID:SCR_001881 | v6.7 |
| Software, algorithm | R library Rsubread | N/A | RRID:SCR_016945 | v1.34.7 |
| Software, algorithm | R library edgeR | N/A | RRID:SCR_012802 | v3.24.3 |
| Software, algorithm | R library eulerr | Larsson, 2018 | N/A | v6.0.0 |
| Software, algorithm | R library superheat | Barter and Yu, 2018 | N/A | v0.1.0 |
| Software, algorithm | R library pheatmap | N/A | RRID:SCR_016418 | v1.0.12 |
| Software, algorithm | R library ggplot2 | N/A | RRID:SCR_014601 | v3.1.1 |
| Software, algorithm | R library RColorBrewer | N/A | RRID:SCR_016697 | v1.1–2 |
| Other | Reference genome M. musculus | GRCm38/mm10 | N/A | - |
| Other | Reference genome P. aeruginosa UCBPP-PA14 | NC_008463.1 | N/A | - |
Additional files
Download links
A two-part list of links to download the article, or parts of the article, in various formats.
Downloads (link to download the article as PDF)
Open citations (links to open the citations from this article in various online reference manager services)
Cite this article (links to download the citations from this article in formats compatible with various reference manager tools)
Host-induced spermidine production in motile Pseudomonas aeruginosa triggers phagocytic uptake
eLife 9:e55744.
https://doi.org/10.7554/eLife.55744


