A genome engineering resource to uncover principles of cellular organization and tissue architecture by lipid signaling
- National Centre for Biological Sciences-TIFR, GKVK Campus, India
Figures
Figure 1
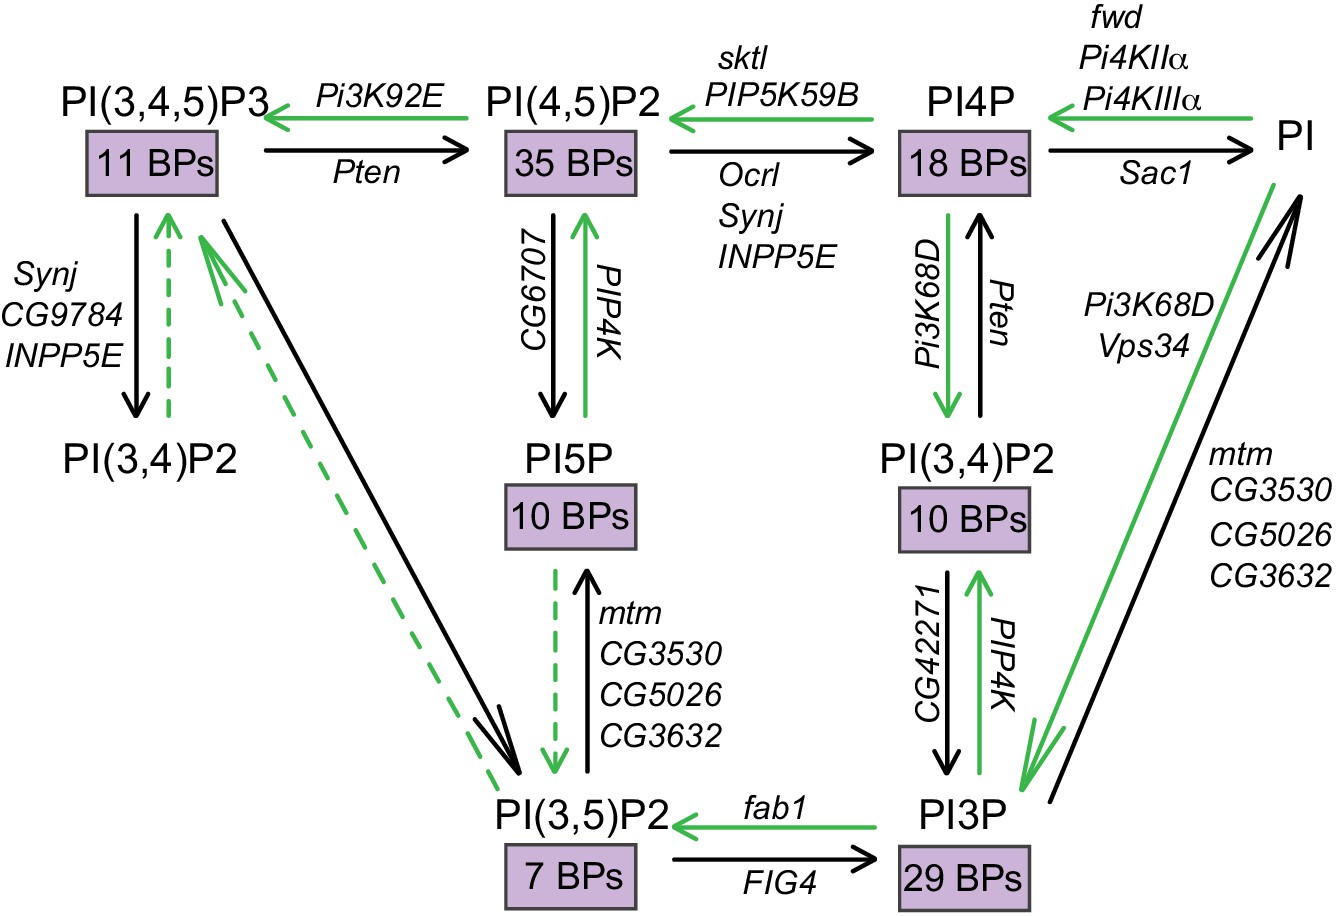
Interconversion of phosphoinositides in eukaryotic cells.
The metabolic pathway by which the different phosphorylated forms of phosphatidylinositol are interconverted is represented. The kinase and phosphatase reactions are indicated by green and black arrows, respectively. The Drosophila gene encoding each of the enzymes responsible for these reactions are also indicated. Dotted lines indicate reactions that are yet to be established. The number of binding proteins (BPs) capable of binding each of the phosphoinositides are indicated in purple boxes.
Figure 2
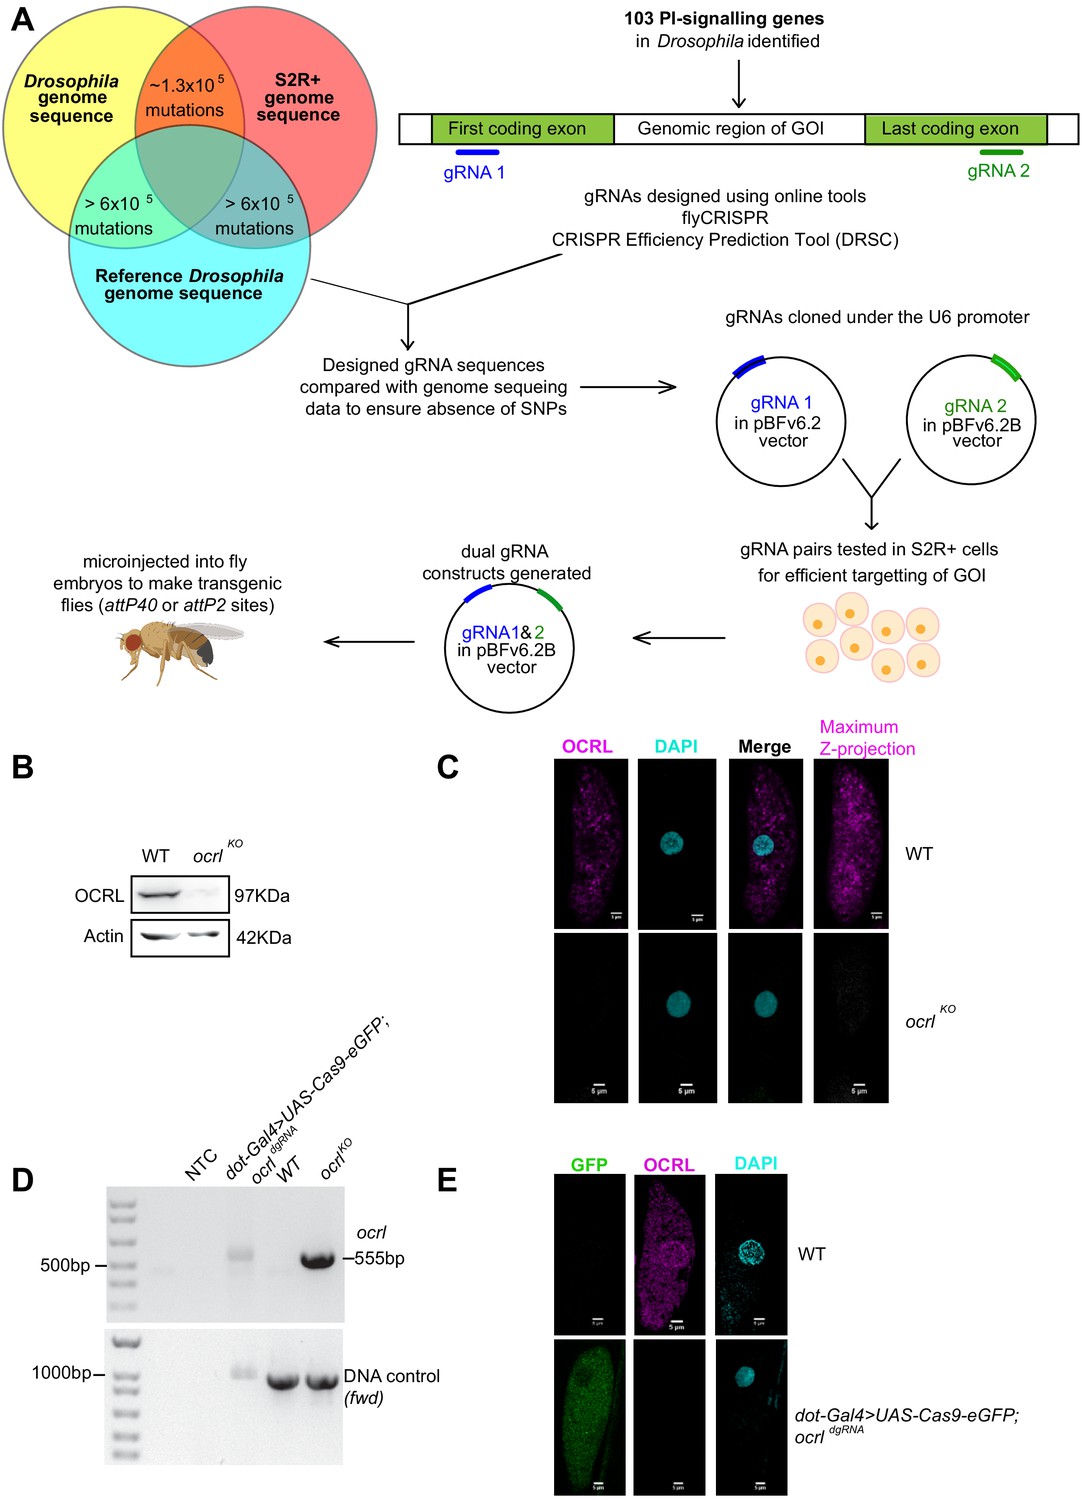
Generation of dgRNA targeting PI signaling genes.
(A) Workflow for the generation of dgRNA transgenic flies. For each of the 103 PI signaling genes in the Drosophila genome, two gRNAs were designed using flyCRISPR and verified using the CRISPR Efficiency Prediction Tool (DRSC). The first gRNA (gRNA 1; indicated in blue) was designed to target the first coding exon and the second gRNA (gRNA 2; indicated in green) was designed to target the last coding exon. It was ensured that these designed gRNAs did not have any mismatches when compared against any of the three genomes (the genomes of Drosophila BL25709 line used for microinjection, S2R+ cells and the reference genome). The two gRNAs (gRNA one and gRNA 2) for each gene were cloned into pBFv6.2 and pBFv6.2B, respectively, and tested in S2R+ cells for their ability to delete the target genes in the presence of Cas9. Following this, both the gRNAs for each gene were cloned into a single plasmid to generate the dgRNA constructs. These were microinjected into Drosophila embryos to generate dgRNA transgenic flies against each of the PI-signaling genes. (B) Western blot from protein lysates of 3rd instar larvae from wild type and ocrlKO. The OCRL polypeptide of the expected Mr of ca. 100 kDa is completely absent in ocrlKO lysates. Protein levels of Actin are used as the loading control. OCRL antibody used here has been described in Del Signore et al., 2017. (C) Immunolabeling of pericardial nephrocytes from 3rd instar larvae to examine the distribution of the OCRL protein. As expected, the OCRL protein (magenta) is seen in punctate structures throughout the cell body. This staining is completely absent in ocrlKO animals. The experiment was repeated three times and multiple animals examined in each case. A single nephrocyte is shown for illustrative purposes. (D) PCR analysis demonstrating the 555 bp band detected when ocrl is edited by these dgRNAs is shown. For nephrocyte-specific deletion, third instar larvae were dissected and the body wall (including heart tube and nephrocytes) was used for the DNA preparation. As a positive control, the germ line ocrlKO larval lysates were used. CG7004(fwd) is used as a control gene for the quality and quantity of the DNA prep. The 555 bp diagnostic band is seen in the ocrl KO and nephrocyte-specific knockout DNA but not in wild-type flies and in NTC (no template control). (E) Immunostaining of nephrocytes in nephrocyte-specific knockout of ocrl. A single nephrocyte is shown. Green channel shows the GFP generated from the Cas9-eGFP transgene. Magneta channel shows immunolabeling with the OCRL antibody. Nucleus is stained with DAPI. There is no detectable signal for OCRL in the nephrocytes of nephrocyte specific knockout animals; the experiment was repeated twice and 24 individual nephrocytes images from multiple animals.
Figure 3
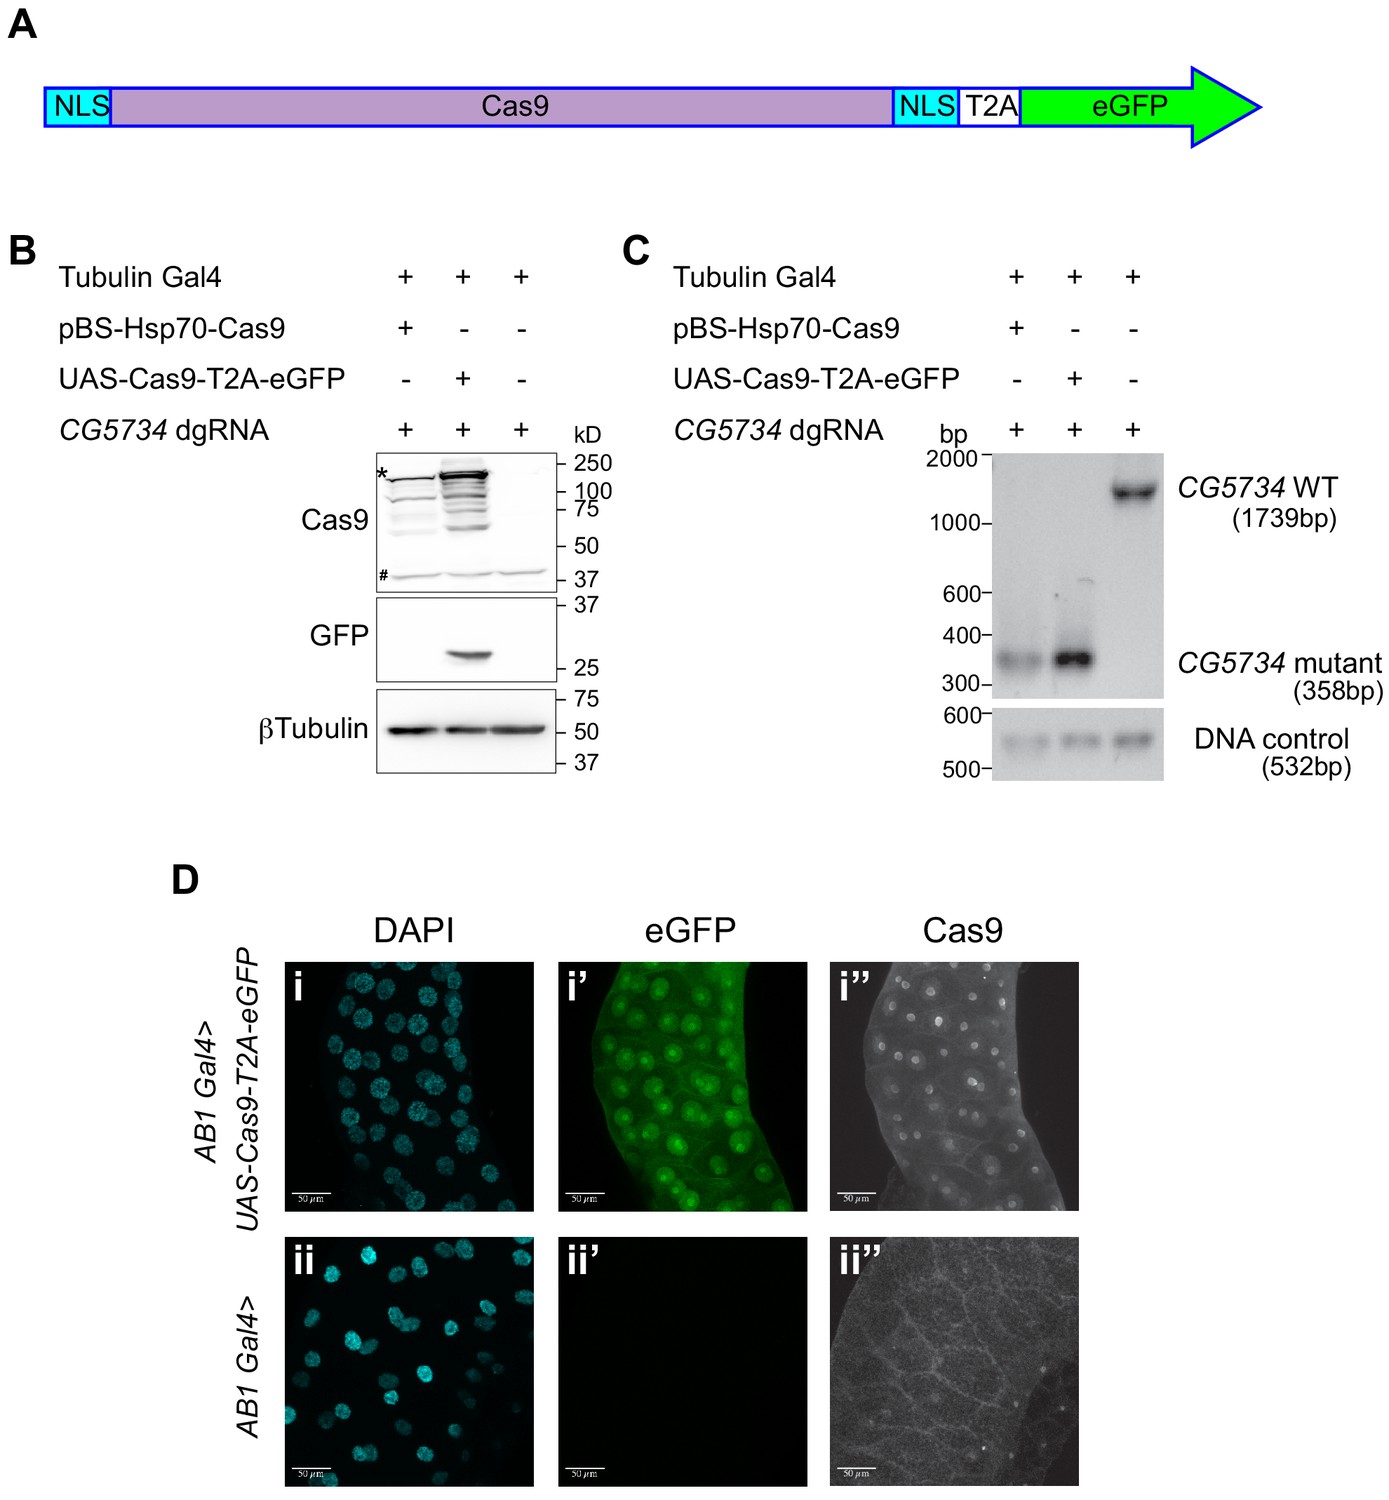
Design and validation of UAS-Cas9-T2A-eGFP.
(A) A schematic of the Cas9-T2A-eGFP transgene indicating the presence of a nuclear localization signal (NLS-blue box) at the N and C termini of Cas9; Cas9 is shaded in pink. An eGFP sequence (green) is present downstream of the Cas9 sequence and these two are separated by the T2A sequence (T2A white box). (B) Western blot of S2R+ cells expressing Cas9-T2A-eGFP. S2R+ cells constitutively expressing Tubulin Gal4 were transiently transfected with the indicated plasmids. Cells were harvested 48 hr after transfection and one half of the cells were subjected to western blot analysis to verify that the T2A sequence was efficient and therefore resulted in expression of Cas9 and eGFP as independent proteins. The expected molecular size of Cas9 is 158 kD (the band of highest intensity indicated with a ‘*’). Note that the Cas9 antibody cross-reacts with a protein from S2R+ cells (‘#’) thereby precluding immunocytochemical detection of Cas9 in S2R+ cells. (C) Genomic PCR was performed on the other half of the cells to test for the ability of Cas9 to target CG5734. The presence of a 358 bp band in cells expressing Cas9 compared to the 1739 bp band in untransfected cells suggests the successful deletion of CG5734. (D) UAS-Cas9-T2A-eGFP transgenic flies generated were crossed to AB1-Gal4 flies and the salivary glands of the progeny dissected and stained using Cas9 antibody (1:200). Cas9 (grayscale) was predominantly localized in the nucleus suggesting efficient nuclear localization by the NLS. Cells expressing Cas9 were marked by eGFP. Scale bar is 50 μm.
Figure 4 with 2 supplements

A genetic screen employing the dgRNA transgenic fly library to identify PI signaling genes in eye development.
(A) Genomic PCR of CG5734 as a representative example to show that tissue specific gene deletion can be obtained by driving UAS-Cas9-T2A-eGFP specifically in the eyes using eyGal4 in the presence of ubiquitously expressing dgRNAs. An amplicon corresponding to CG5734 deletion (See Supplementary file 1) was obtained in DNA extracted from fly heads (‘H’) of the appropriate genotype indicated but not in DNA extracted from the bodies (‘B’) of the fly. (B) Representative images of phenotypes observed upon eye specific CRISPR mediated deletion of a few PI kinases – Dp110, Vps34 and sktl. (C) Representative images of phenotypes observed upon eye-specific CRISPR-mediated deletion of two PI phosphatases – Pten and Sac1. (D) Representative images of phenotypes observed upon eye-specific CRISPR-mediated deletion of PI binding proteins Abl and Clc. (E) Nub-Gal4;UAS-Cas9 flies (BDSC 67086: w*; P{GawB}nubbin-AC-62; P{UAS-Cas9.P2}attP2) were crossed to different genotypes and clipped wings of the progeny were imaged. Number of flies inspected per genotype is given in parenthesis: Nub-Gal4/+;UAS-Cas9/+ (17), PtendgRNA/Nub-Gal4;UAS-Cas9/+ (15), Dp110dgRNA/Nub-Gal4;UAS-Cas9/+ (6) and aktdgRNA/Nub-Gal4;UAS-Cas9/+ (12).
Figure 4—figure supplement 1

Genomic deletion using Gal4/UAS system.
(A) Genomic PCR of Pi3K92E (Dp110) as an example to show that when comparatively larger genomic regions are deleted (in this case ~4 Kb- See Supplementary file 1), only the mutant band is amplified by the genomic PCR. Position of the expected wild-type band shown in green and mutant band in magenta. (B) When a similar experiment is done for clc gene, where the expected WT PCR product is smaller (~1 kb- see Supplementary file 1), it is amplified by PCR along with the deletion product. Position of the expected wild type band shown in green and mutant band in magenta. In both the cases, deletion was obtained by crossing Act5c-Cas9 with transgenic lines ubiquitously expressing dgRNAs.
Figure 4—figure supplement 2
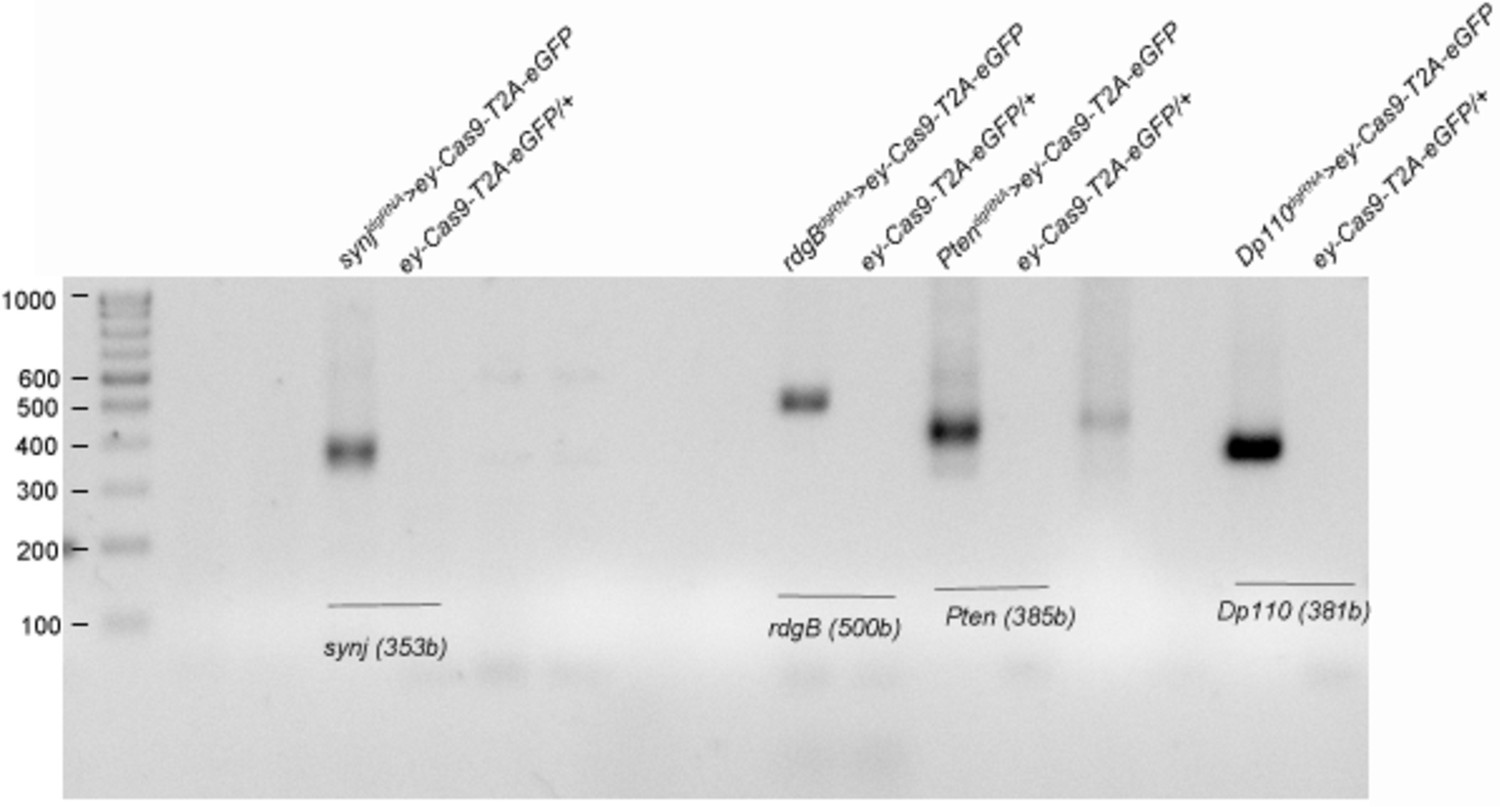
Genomic deletion obtained in CRISPR tissue-specific KOs is comparable irrespective of the presence or absence of phenotype.
Genomic PCR is done using heads of the flies from appropriate genotypes as indicated. dgRNA targeting synj and rdgB were chosen as examples of genes that did not show expected phenotypes, while dgRNA targeting Pten and Pi3K92E (Dp110) were chosen as examples of genes that showed phenotypes when expressed in tissue-specific manner using ey-Gal4;UAS-Cas9-T2A-eGFP. Expected deletion band size are seen in heads of deletion genotype as indicated in parenthesis. Expected larger sized wild-type bands are missing in controls because of large size of the genomic region (Primers used are listed in Supplementary file 2).
Figure 5
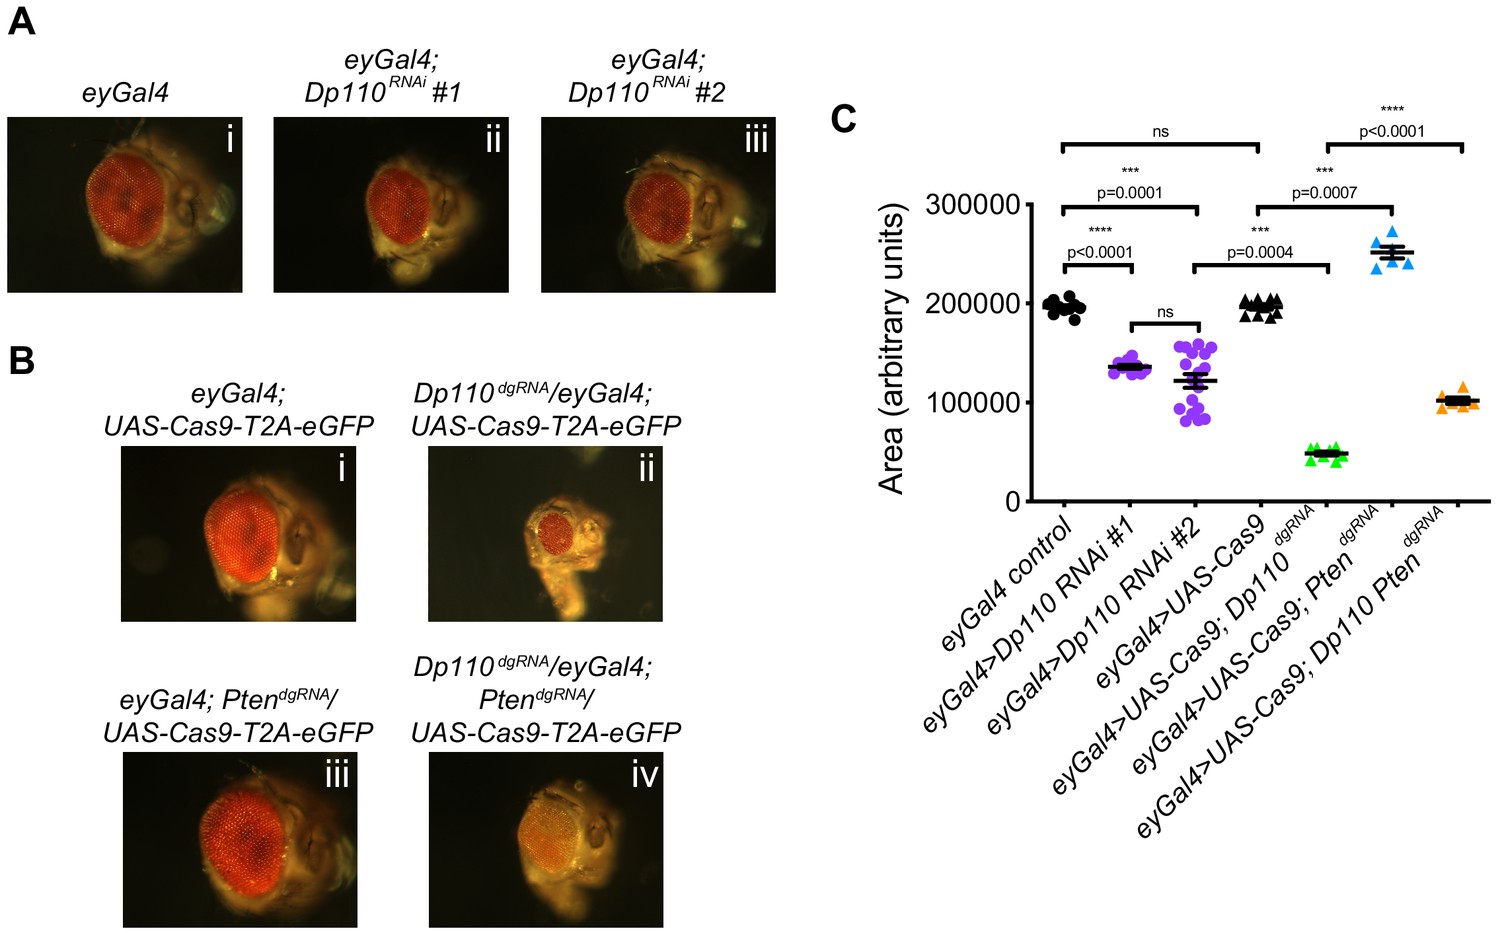
Combinatorial use of dgRNAs to study genetic interactions regulating developmental processes.
(A) Knockdown of Dp110 results in smaller eyes compared to control eyes as seen with two different RNAi lines (Dp110RNAi #1: BDSC 61182 and Dp110RNAi #2: BDSC 27690). (B) CRISPR mediated Dp110 knockout phenocopies RNAi mediated Dp110 knockdown and results in smaller eyes compared to control eyes. However, the phenotype observed with the use of CRISPR to target Dp110 is more severe compared to the phenotype seen with either of the RNAi lines. CRISPR-mediated Pten deletion results in eyes larger than control eyes. When both Dp110 and Pten are targeted simultaneously, the size of the eyes are intermediate between the small eyes seen with Dp110 deletion and the large eyes seen with Pten deletion. (C) Quantifications of the phenotypes shown in A and B. Each data point is an individual eye. Each point on Y-axis represents area of eye ± s.e.m. (p values are indicated on the graph, ns = not significant; one-way ANOVA with Tukey’s multiple comparison test).
Figure 6
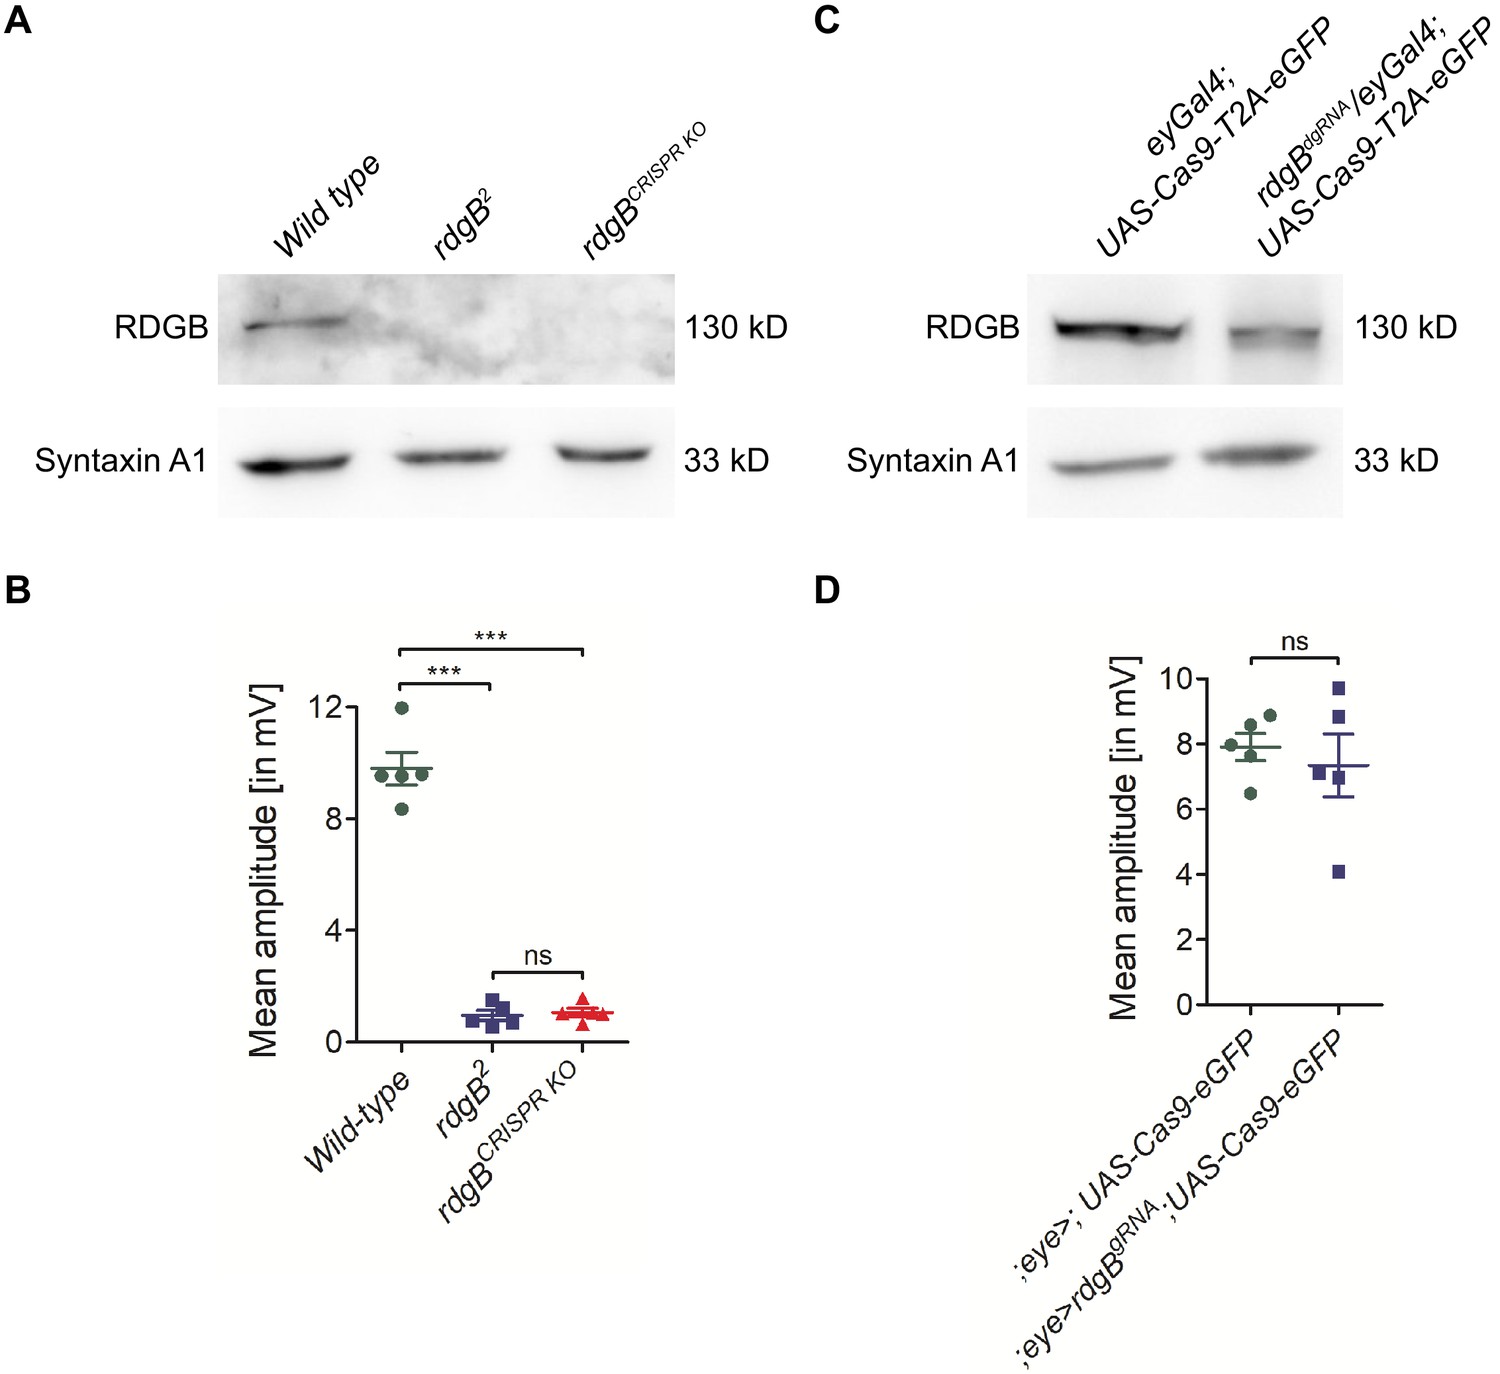
Generating germ line fly knockouts using dgRNA transgenics.
The PI transfer protein RDGB (retinal degeneration B) is a good example to demonstrate the need for whole fly knockouts. (A) Western blot analysis showed that eye-specific Cas9 expression was not sufficient to knockout rdgB and detectable levels of RDGB protein was still present. (B) The mean amplitude from ERG recordings of these flies was the same as control flies. Each data point on the graph is recording from an individual eye. Each point on Y-axis represents mean amplitude ± s.e.m. (*** - p<0.001, ns = not significant; two tailed unpaired t-test). (C) The same dgRNA flies were used to generate a whole fly rdgB deletion (rdgBCRISPR KO) and western blot analysis showed a complete loss of RDGB similar to the rdgB2 null mutant flies. (D) Both rdgB2 and rdgBCRISPR KO flies showed complete loss of ERG amplitudes as expected. Each point on Y-axis represents mean amplitude ± s.e.m. (*** - p<0.001, ns = not significant; two tailed unpaired t-test).
Author response image 1
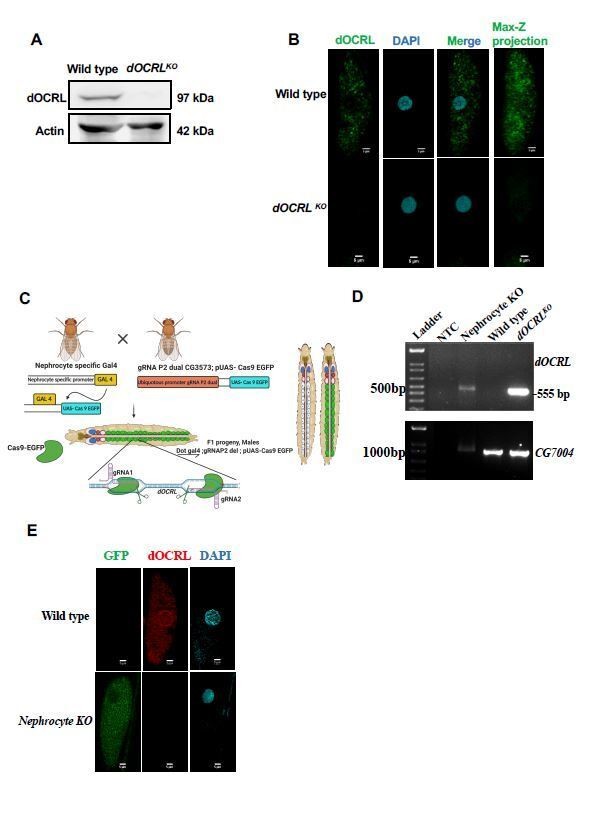
Verification of OCRL protein depletion when using CRISPR/Cas9 genome engineering reagents.
(A) Western blot from protein lysates of 3rd instar larvae from wild type and dOCRLKO. The dOCRL polypeptide of the expected Mr of ca. 100 kDa is completely absent in dOCRLKO lysates. Protein levels of actin are used as the loading control. dOCRL antibody used here has been described in (Del Signore et al., 2017)(B) Immunolabelling of pericardial nephrocytes from 3rd instar larvae to examine the distribution of the dOCRL protein. As expected, the dOCRL protein is seen in punctate structures throughout the cell body but excluded from the nucleus. This staining is completely absent in dOCRLKO animals. The experiment was repeated three times and multiple animals examined in each case. A single nephrocyte is shown for illustrative purposes. (C) Schematic depicting the generation of nephrocyte specific knock out (NephroctyeKO) of dOCRL. A nephrocyte specific Gal4-Dot-Gal4 is used and combined with the dgRNA for dOCRL and UAS-Cas9-eGFP. Animals of the test and control genotype are identified on the basis of eGFP expression. (D) PCR analysis demonstrating the 555 bp band detected when dOCRL is edited by these dgRNAs is shown. For nephrocyteKO animals larvae were dissected and the body wall (including heart tube and nephrocytes) was sued for the DNA prep. As a positive control the germ line dOCRLKO larval lysates were used. CG7004 is used as a control gene for the quality and quantity of the DNA prep. The 555bp diagnostic band is seen in the dOCRLKO and nephrocyteKO lysates but not in wild type flies and in NTC (no template control). (E) Immunostaining of nephrocytes in dOCRL-NephrocyteKO animals. A single nephrocyte is shown. Green channel shows the GFP generated from the Cas9-EGFP transgene. Red channel shows immunolabelling with the dOCRL antibody. Nucleus is stained with DAPI. There is no detectable signal for dOCRL in the nephrocytes of NephrocyteKO animals; experiment repeated twice and 24 individual nephrocytes images from multiple animals. Although the immunostaining for dOCRL has been repeated twice, NephrocyteKO animals have been generated many times for physiological and cell biological characterization which is described in that manuscript.
Tables
Key resources table
| Reagent type (species) or resource | Designation | Source or reference | Identifiers | Additional information |
|---|---|---|---|---|
| Genetic reagent (D. melanogaster) | w1118 | Bloomington Drosophila Stock Center | BDSC 3605 | |
| Genetic reagent (D. melanogaster) | AB1-Gal4 | Bloomington Drosophila Stock Center | BDSC 1824 | y1 w*; P{GawB}AB1 |
| Genetic reagent (D. melanogaster) | UAS-Cas9 | Bloomington Drosophila Stock Center | BDSC 54592 | P{hsFLP}1, y1 w1118; P{UAS-Cas9.P}attP2/TM6B, Tb1 |
| Genetic reagent (D. melanogaster) | attP40 | Bloomington Drosophila Stock Center | BDSC 25709 | y1 v1 P{nos-phiC31\int.NLS}X; P{CaryP}attP40 |
| Genetic reagent (D. melanogaster) | attP2 | Bloomington Drosophila Stock Center | BDSC 25710 | P{nos-phiC31\int.NLS}X, y1 sc1 v1 sev21; P{CaryP}attP2 |
| Genetic reagent (D. melanogaster) | ey-Gal4 | Bloomington Drosophila Stock Center | BDSC 5534 | w*; P{GAL4-ey.H}3–8 |
| Genetic reagent (D. melanogaster) | rdgB9 | Bloomington Drosophila Stock Center | BDSC 27337 | |
| Genetic reagent (D. melanogaster) | nos-Cas9 | Bloomington Drosophila Stock Center | BDSC 54591 | y1 M{nos-Cas9.P}ZH-2A w* |
| Genetic reagent (D. melanogaster) | vasa-Cas9 (3) | Bloomington Drosophila Stock Center | BDSC 51324 | w1118; PBac{vas-Cas9}VK00027 |
| Genetic reagent (D. melanogaster) | vasa-Cas9 (1) | Bloomington Drosophila Stock Center | BDSC 51323 | y1 M{vas-Cas9}ZH-2A w1118/FM7c |
| Genetic reagent (D. melanogaster) | Act5c-Cas9 | Bloomington Drosophila Stock Center | BDSC 54590 | y1 M{Act5C-Cas9.P}ZH-2A w* |
| Genetic reagent (D. melanogaster) | nub-Gal4;UAS-Cas9 | Bloomington Drosophila Stock Center | BDSC 67086 | w*; P{GawB}nubbin-AC-62; P{UAS-Cas9.P2}attP2 |
| Genetic reagent (D. melanogaster) | PI3K RNAi #1 | Bloomington Drosophila Stock Center | BDSC 61182 | y1 sc* v1 sev21; P{TRiP.HMC05152}attP40 |
| Genetic reagent (D. melanogaster) | PI3K RNAi #2 | Bloomington Drosophila Stock Center | BDSC 27690 | y1 v1; P{TRiP.JF02770}attP2/TM3, Sb1 |
| Cell line (D. melanogaster) | S2 R+ | Drosophila Genomics Resource Center | Stock number 150 | |
| Antibody | Anti-Cas9 (Mouse monoclonal) | Takara | Cat#632628 (CloneTG8C1) | IF(1:200), WB (1:2000) |
| Antibody | Anti-OCRL (Rabbit polyclonal) | Gift from Avital Rodal | IF(1:50) | |
| Antibody | Anti-GFP (Rabbit polyclonal) | Abcam | Cat#: ab13970 | IF (1:5000) |
| Antibody | Anti-rdgB (Rat polyclonal) | Yadav et al., 2015 | WB (1:4000) | |
| Antibody | Anti-GFP (Mouse monoclonal) | Santacruz | Cat # SC 9996 | WB (1:2000) |
| Antibody | Anti-Syntaxin A1 (Mouse monoclonal) | DHSB | Cat # 8C3 | WB (1:1000) |
| Antibody | Anti-beta tubulin | DHSB | Cat # E7C | WB (1:4000) |
| Recombinant DNA reagent | pBS-hsp70-Cas9 (plasmid) | Addgene | Cat# 46294 | |
| Recombinant DNA reagent | pAC-Cas9-sgRNA (plasmid) | Addgene | Cat# 49330 | |
| Recombinant DNA reagent | pBFvU6.2 (plasmid) | NIG (Japan) | https://shigen.nig.ac.jp/fly/nigfly/cas9PlasmidsListAction.do | |
| Recombinant DNA reagent | pBFvU6.2B (plasmid) | NIG (Japan) | https://shigen.nig.ac.jp/fly/nigfly/cas9PlasmidsListAction.do | |
| Recombinant DNA reagent | pUASt (plasmid) | Brand and Perrimon, 1993 | ||
| Commercial assay or kit | Whole Genome DNA library prep kit | Illumina | FC-121–4002 | |
| Commercial assay or kit | Agilent high sensitivity DNA kit | Agilent | 5067–4626 | |
| Commercial assay or kit | Hiseq 2500 | Illumina | SY-401–2501 | |
| Software, algorithm | gRNA target finder | http://targetfinder.flycrispr.neuro.brown.edu/ | ||
| Software, algorithm | gRNA efficiency tool | https://www.flyrnai.org/evaluateCrispr/ | ||
| Other | DAPI stain | Invitrogen | D1306 | (1 µg/mL) |
Additional files
-
Supplementary file 1
List of all 103 Drosophila PI-signaling genes against which dgRNAs have been generated.
The table indicates the CG numbers, gene names and what chromosome each of the genes are located on. For the phosphoinositide binding proteins, the various phosphoinositides either established or predicted to bind each protein have been listed. The table also has the closest human orthologs and associated human diseases from the Online Mendelian Inheritance in Man (OMIM) database indicated. The sequences of gRNA one and gRNA two for each gene are listed along with the size of the genomic deletion expected from these gRNA combinations, and the actual size of genomic deletion obtained in flies when crossed to Act5c-Cas9. The phenotypes obtained when these genes were deleted specifically in the eye and the efficiency (in terms of absolute numbers of flies with deletion as compared to total number of F2 flies) of whole fly gene knockout generation using either Vasa-Cas9, Act5c-Cas9 or Nos-Cas9 has been mentioned.
- https://cdn.elifesciences.org/articles/55793/elife-55793-supp1-v2.xlsx
-
Supplementary file 2
List of all oligonucleotides used in this study is provided.
The sequence of each oligonucleotide is provided.
- https://cdn.elifesciences.org/articles/55793/elife-55793-supp2-v2.docx
-
Supplementary file 3
Isogenized attP40 fly stock genomic sequence variants comparison with the reference genome.
The table shows chromosome location wise comparison between the isogenized attP40 stock with the reference genome. Average coverage for each sequence suggests the number of times each region has been sequenced. The frequency at which the variation is observed has been mentioned. A sequence quality of >Q30 score, which corresponds to >99.9% accuracy has been obtained. Each variation has been mapped based on genomic annotation of coding vs non-coding region. If variation in the coding region leads to amino-acid changes, it has been tabulated.
- https://cdn.elifesciences.org/articles/55793/elife-55793-supp3-v2.xlsx
-
Supplementary file 4
S2R+ cell lines genomic sequence variants comparison with the reference genome.
The table shows chromosome location wise comparison between the S2R+ cells with the reference genome. Average coverage for each sequence suggests the number of times each region has been sequenced. The frequency at which the variation is observed has been mentioned. A sequence quality of >Q30 score, which corresponds to >99.9% accuracy has been obtained. Each variation has been mapped based on genomic annotation of coding vs non-coding region. If variation in the coding region leads to amino-acid changes, it has been tabulated.
- https://cdn.elifesciences.org/articles/55793/elife-55793-supp4-v2.xlsx
-
Transparent reporting form
- https://cdn.elifesciences.org/articles/55793/elife-55793-transrepform-v2.pdf
Download links
A two-part list of links to download the article, or parts of the article, in various formats.
Downloads (link to download the article as PDF)
Open citations (links to open the citations from this article in various online reference manager services)
Cite this article (links to download the citations from this article in formats compatible with various reference manager tools)
A genome engineering resource to uncover principles of cellular organization and tissue architecture by lipid signaling
eLife 9:e55793.
https://doi.org/10.7554/eLife.55793


