Intra-species differences in population size shape life history and genome evolution
- Max Planck Institute for Biology of Ageing, Germany
- Czech Academy of Sciences, Institute of Vertebrate Biology, Czech Republic
- Department of Botany and Zoology, Faculty of Science, Masaryk University, Czech Republic
- CECAD, University of Cologne, Germany
Figures
Figure 1 with 2 supplements
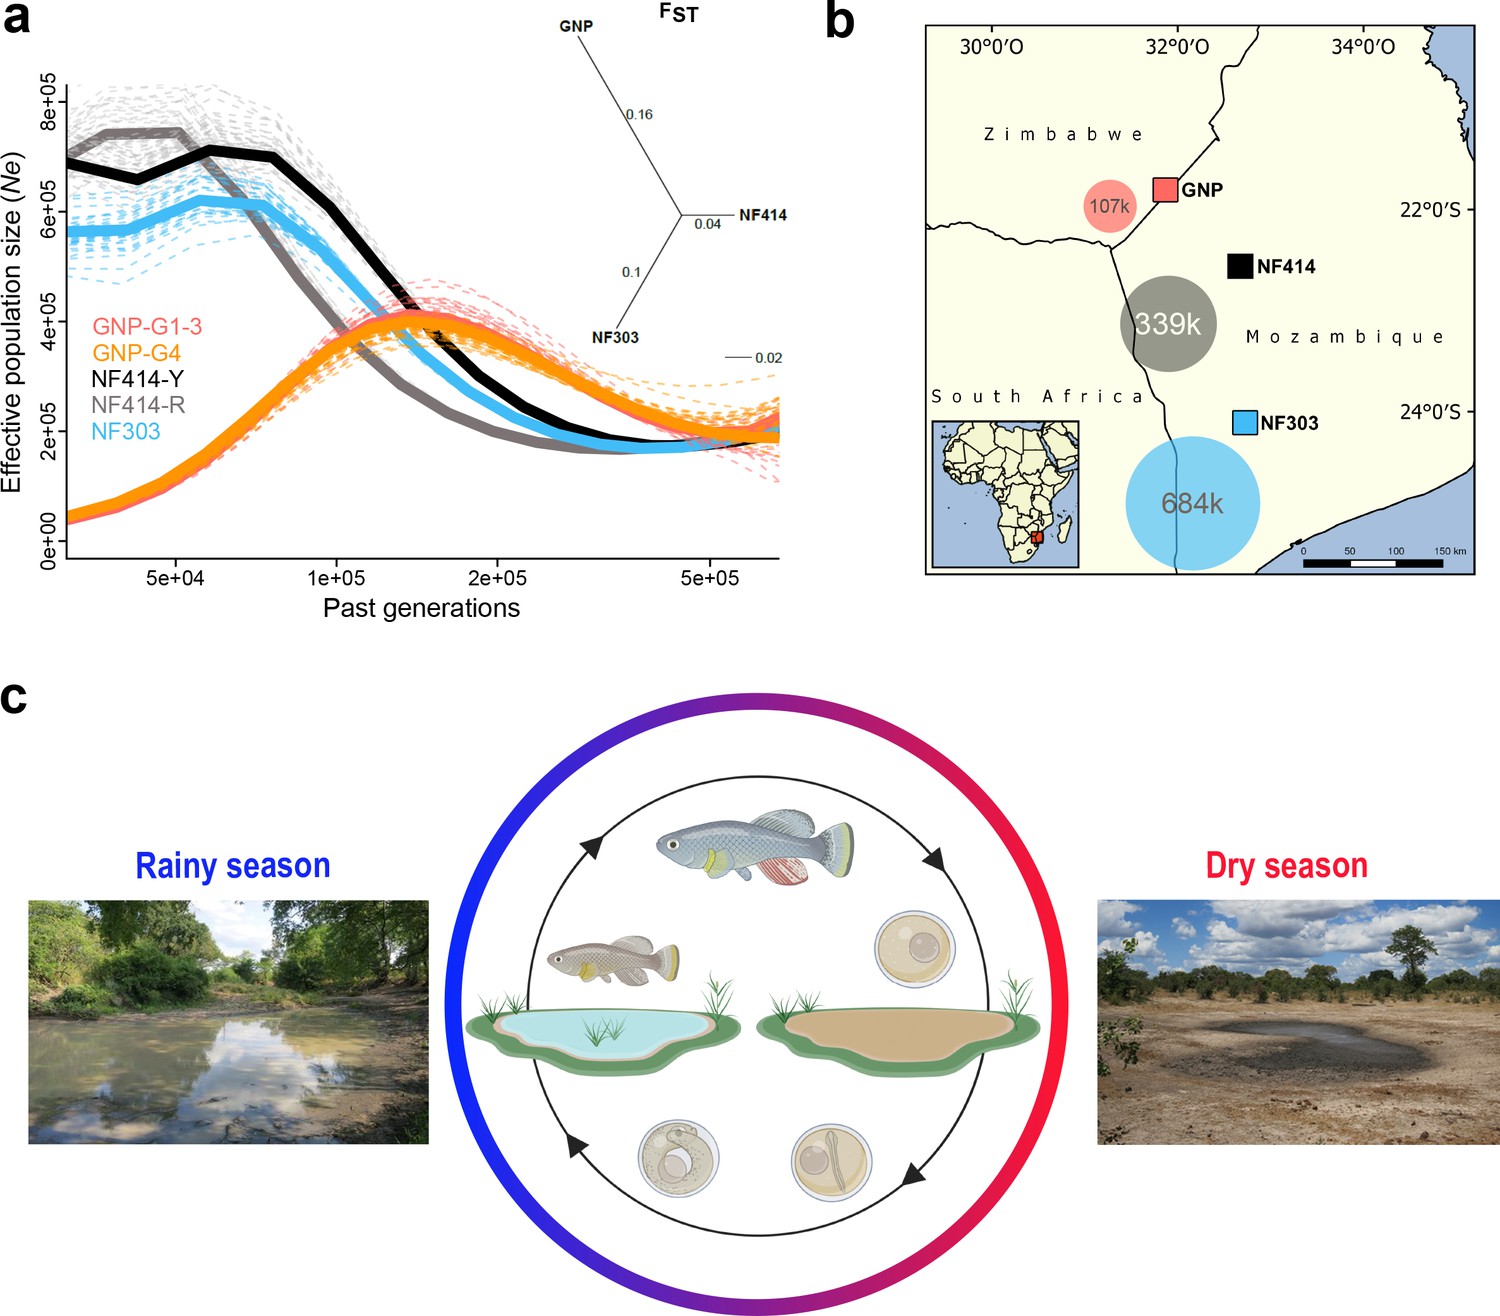
Demography and natural occurrence of turquoise killifish populations.
(a) Inferred ancestral effective population size (Ne) (using PSMC’) on y-axis and past generations on x-axis in GNP (red, orange), NF414 (black, grey) and NF303 (blue). Inset: unrooted neighbor joining tree based on pairwise genetic differentiation (FST) values. (b) Geographical locations of sampled natural population of turquoise killifish (Nothobranchius furzeri). The area of the colored circles represents the estimated effective population size (Ne) based on θWatterson. (c) Natural environment of turquoise killifish and schematic of the annual life cycle. Figure 1 was partly made with Biorender.
Figure 1—figure supplement 1
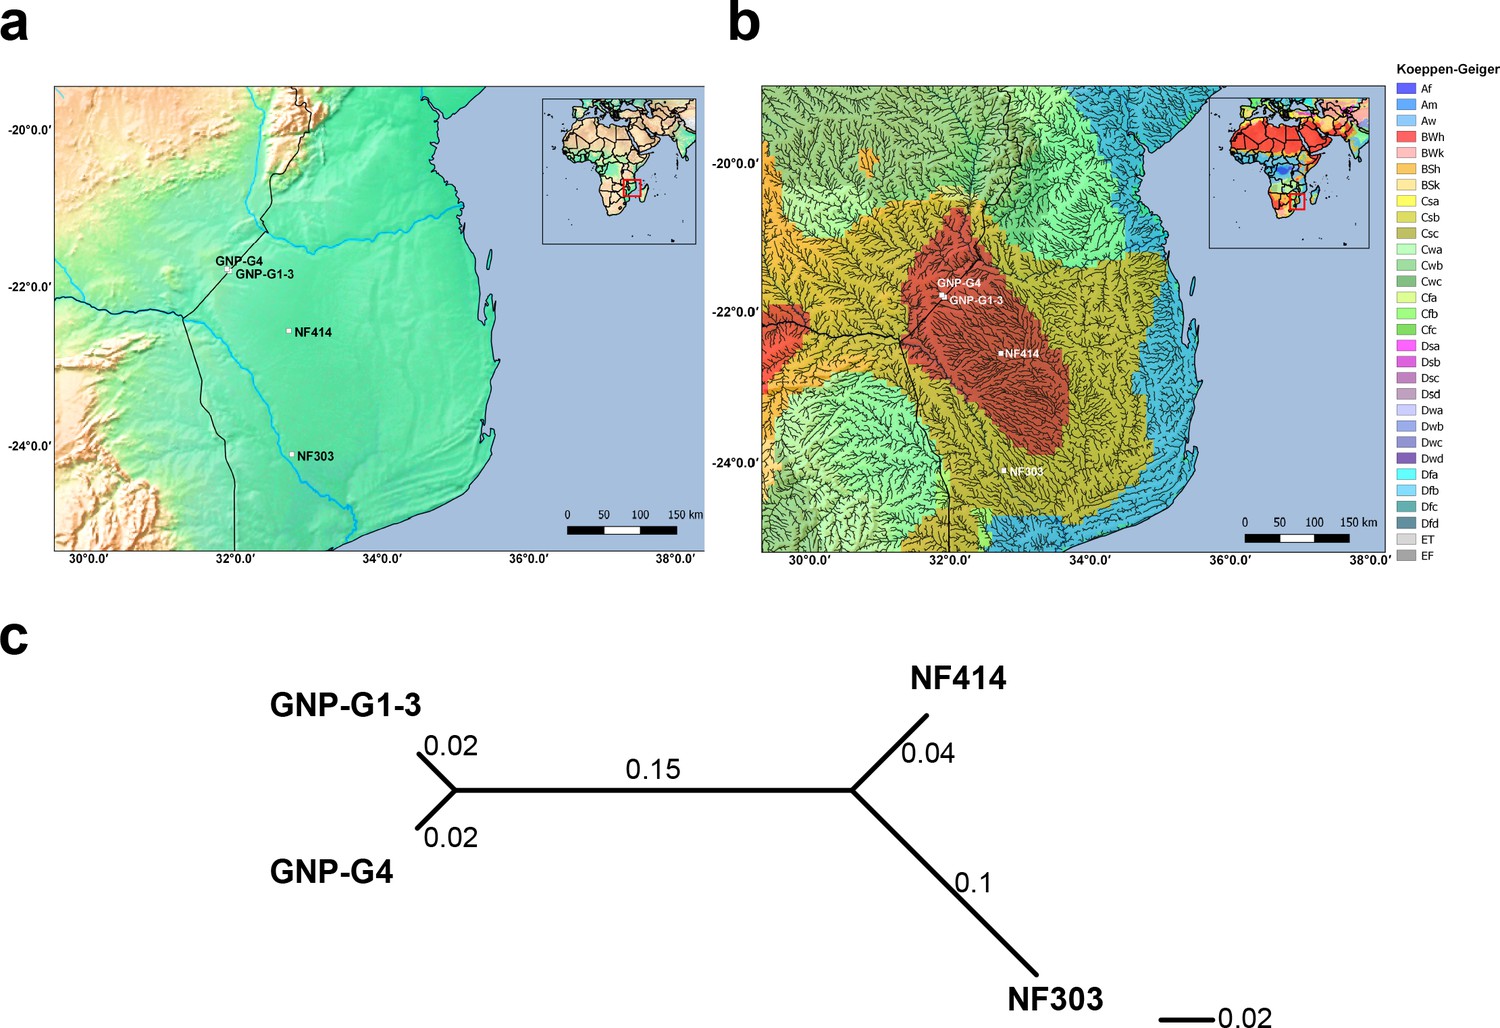
Altitude, climate classification and genetic differentiation of studied samples.
(a) Altitude elevation map with studied samples. (b) Climate classification based on Koeppen-Geiger index combined with a high-resolution river map. (c) Unrooted neighbor joining tree based on pairwise genetic differentiation (FST) between all sampled sites.
Figure 1—figure supplement 2
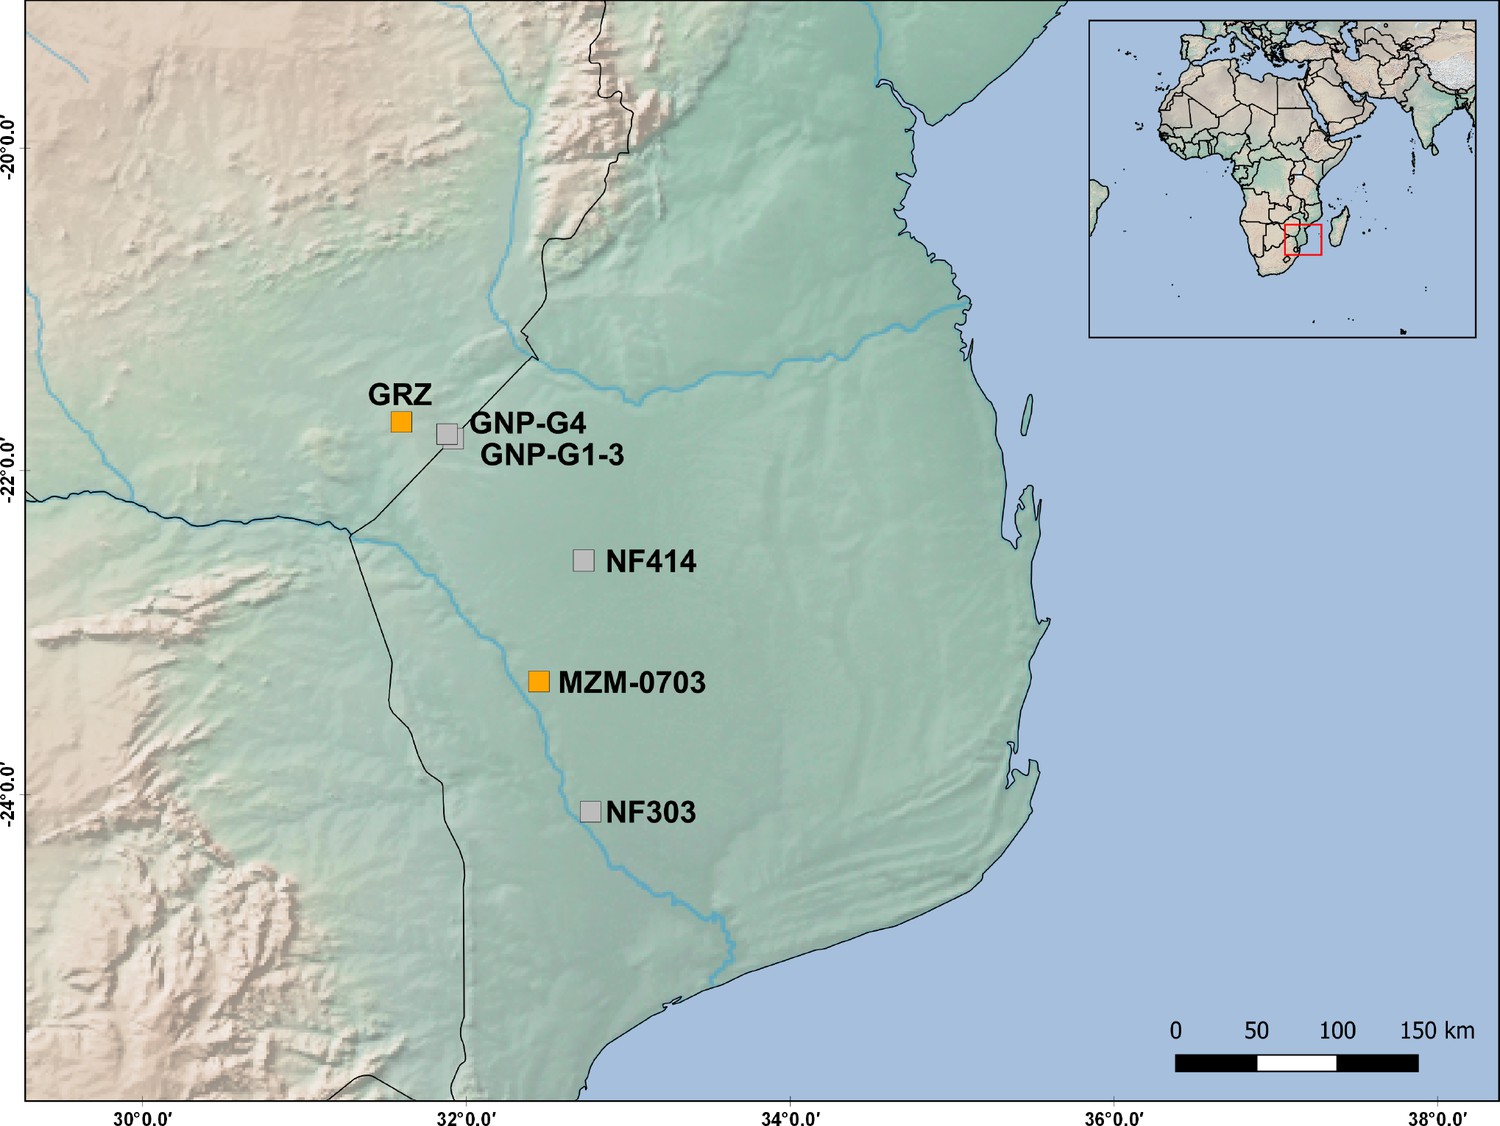
Map positions of the populations used in this study and of those used in the QTL study (Valenzano et al., 2015).
The distance between population ‘GRZ’ (from QTL study) and population ‘GNP’ is <30 Km, while the distance between population ‘MZM-0703’ (from QTL study) and population ‘NF414’ is 70 Km.
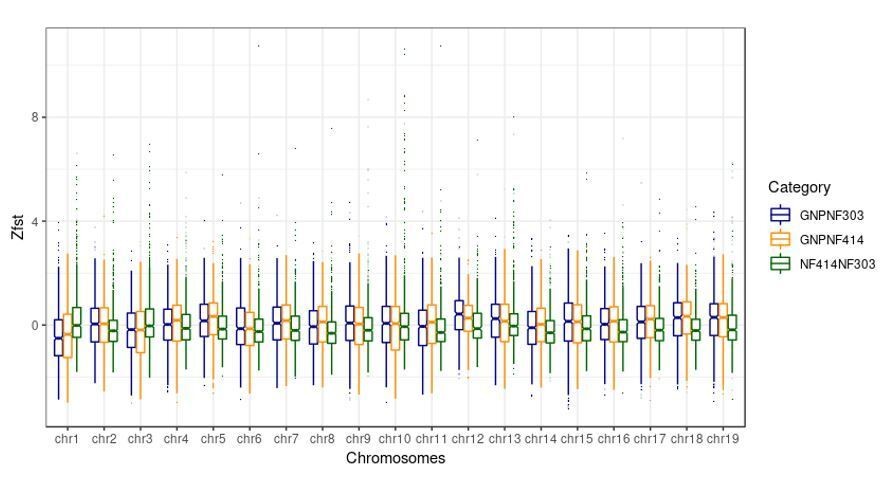
Figure 2
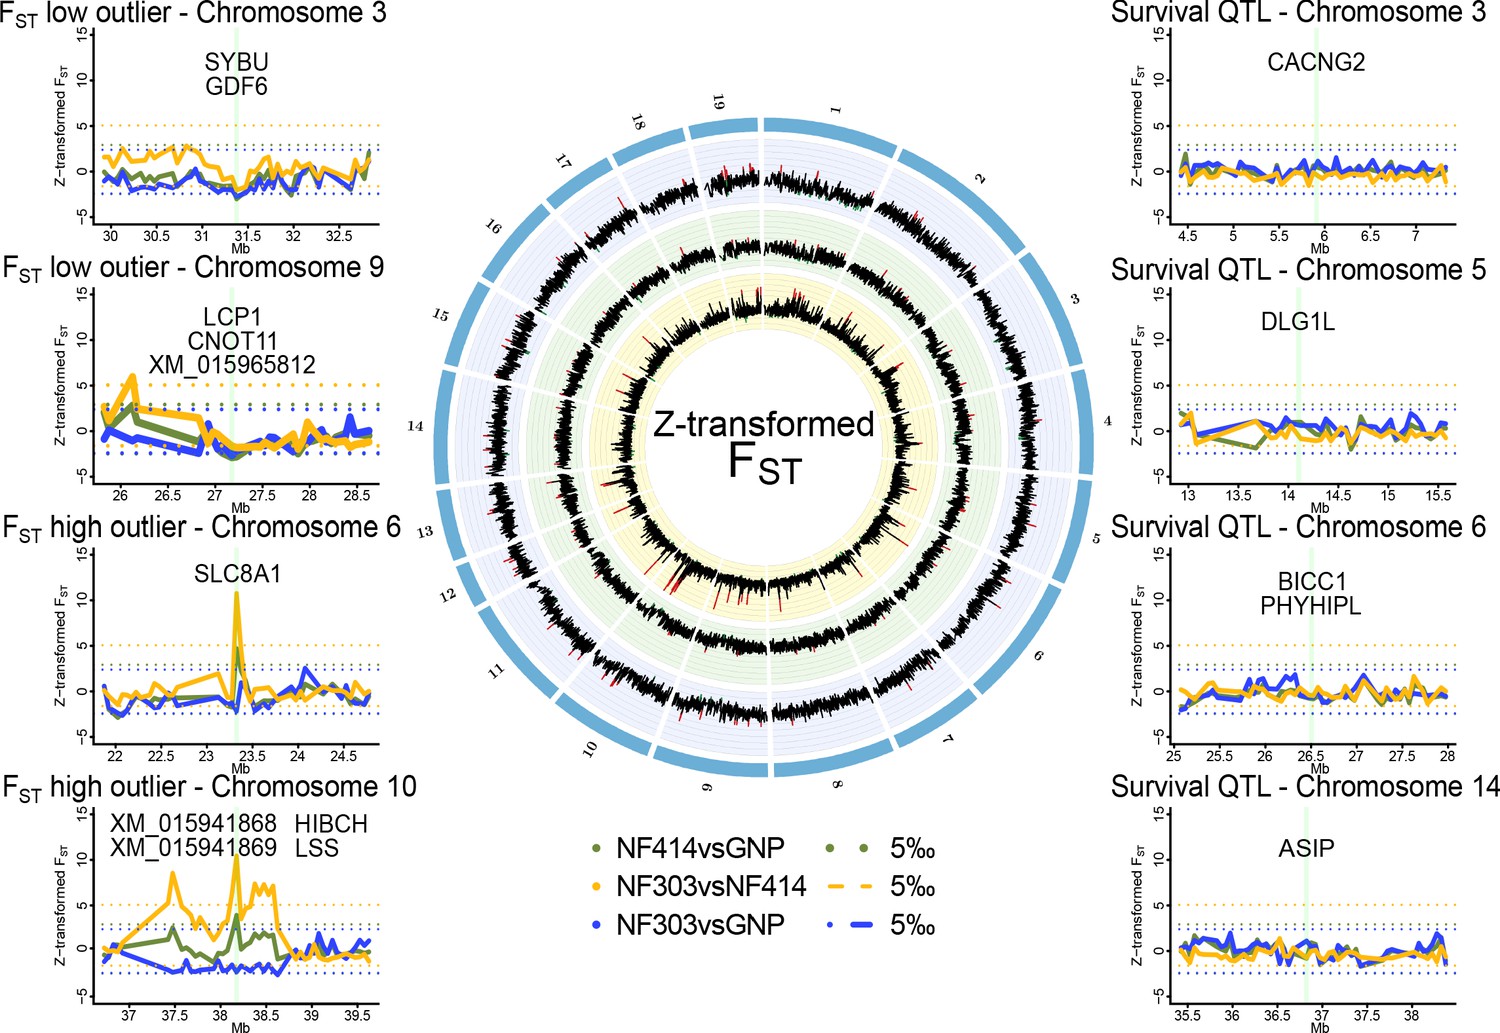
Genomic regions of high and low genetic divergence between pairs of turquoise killifish populations.
Left) Genomic regions with high or low genetic differentiation between turquoise killifish populations identified with an FST outlier approach. Z-transformed FST values of all pairwise comparisons in solid lines, with ‘NF303vsNF414’ in yellow, ‘NF303vsGNP’ in blue, and ‘NF414vsGNP’ in green. The significance thresholds of upper and lower 5‰ are shown as dotted lines with same color coding. Center) Circos plot of Z-transformed FST values between all pairwise comparisons with ‘NF303vsNF414’ in the inner circle (yellow), ‘NF414vsGNP’ in the middle circle (green), and ‘NF303vsGNP’ in the outer circle (blue). Right) Pairwise genetic differentiation based on FST in the four main clusters associated with lifespan (QTL from Valenzano et al., 2015).
Figure 3
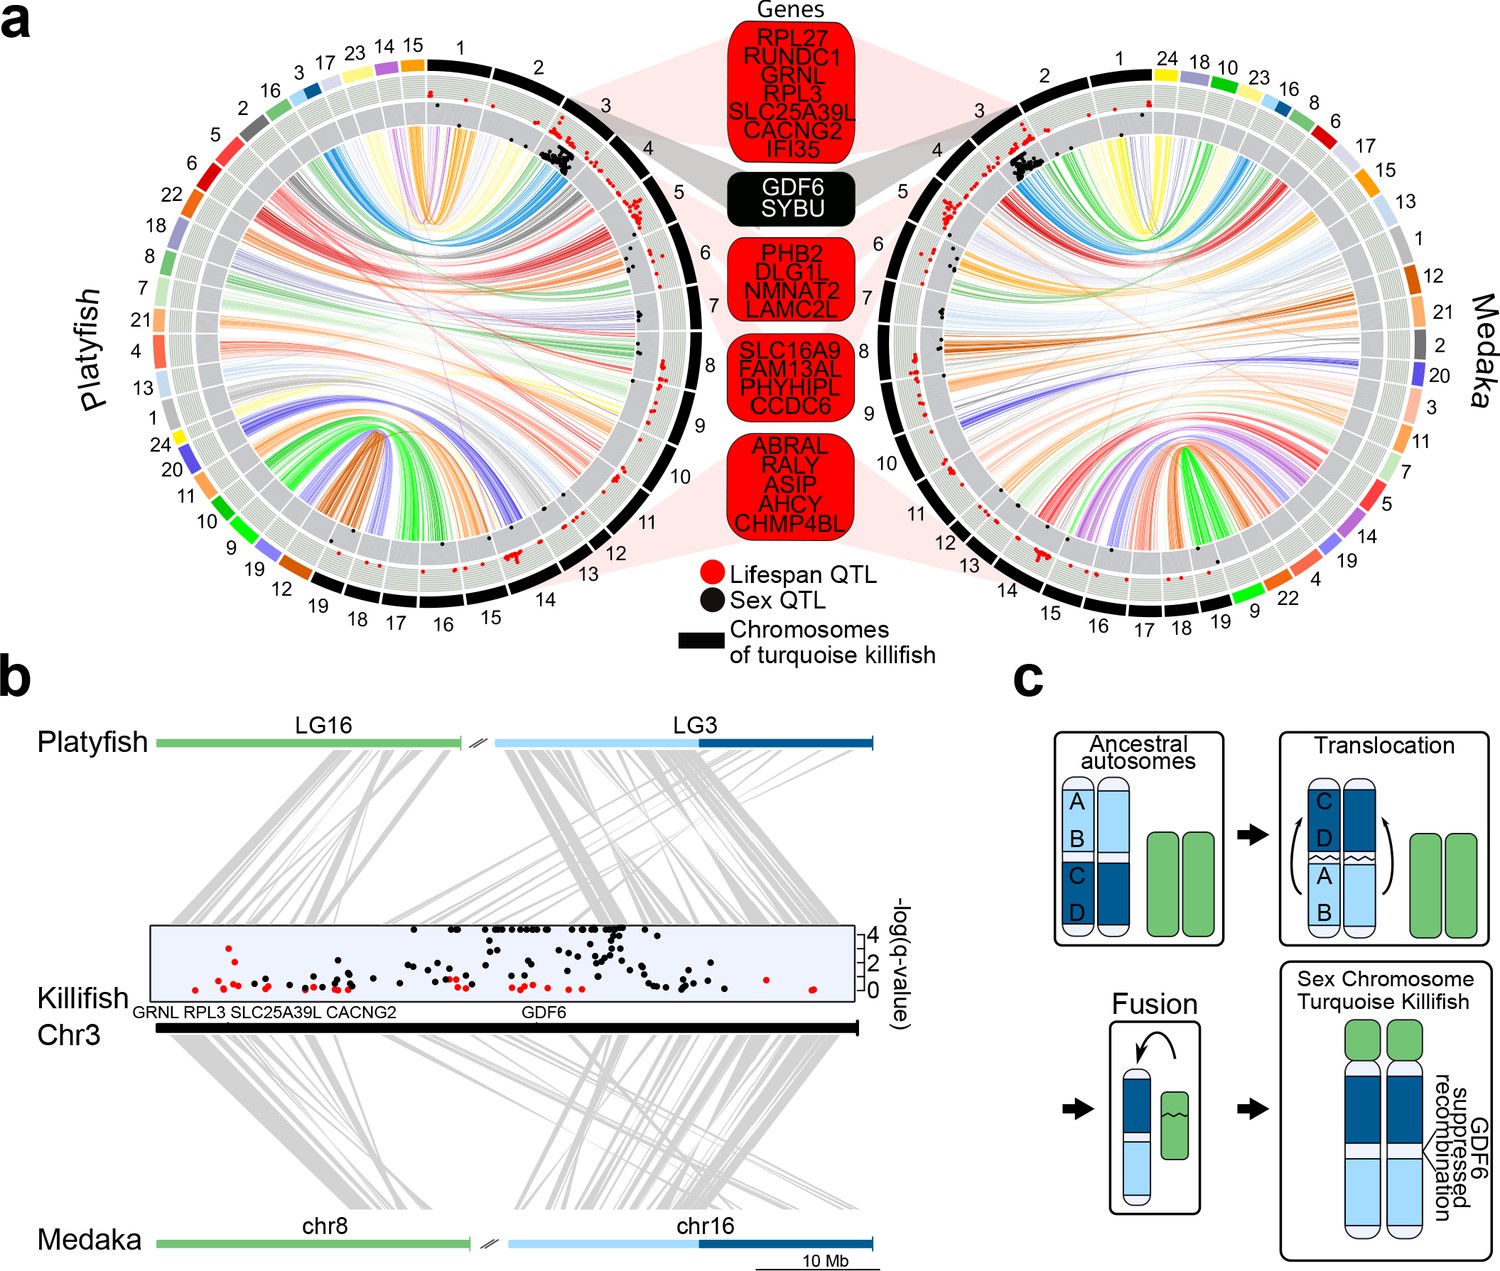
Synteny and sex chromosome evolution in turquoise killifish.
(a) Synteny circos plots based on 1-to-1 orthologous gene location between the new turquoise killifish assembly (black chromosomes) and platyfish (Xiphophorus maculatus, colored chromosomes, left circos plot) and between the new turquoise killifish assembly (black chromosomes) and medaka (Oryzias latipes, colored chromosomes, right circos plot). Orthologous genes in concordant order are visualized as one syntenic block. Synteny regions are connected via color-coded ribbons, based on their chromosomal location in platyfish or medaka. If the direction of the syntenic sequence is inverted compared to the compared species, the ribbon is twisted. Outer data plot shows –log(q-value) of survival quantitative trait loci (QTL, ordinate value between 0 and 3.5, every value above 3.5 is visualized at 3.5 [Valenzano et al., 2015]) and the inner data plot shows –log(q-value) of the sex QTL (ordinate value between 0 and 3.5, every value above 3.5 is visualized at 3.5). Boxes between the two circos plots show genes within the peak regions of the four highest –log(q-value) of survival QTL on independent chromosomes (red box) and the highest association to sex (black box). (b) High resolution synteny map between the sex-chromosome of the turquoise killifish (Chr3) with platyfish chromosome 16 and 3 in the upper plot, and between the turquoise killifish and medaka chromosome 8 and 16 (lower plot). The middle plot shows the QTLs for survival and sex along the turquoise killifish sex chromosome. (c) Model of sex chromosome evolution in the turquoise killifish. A translocation event within one ancestral autosome led to the emergence of a chromosomal region harboring a new sex-determining-gene (SDG). The fusion of a second autosome led to the formation of the current structure of the turquoise killifish sex chromosome.
Figure 4 with 2 supplements
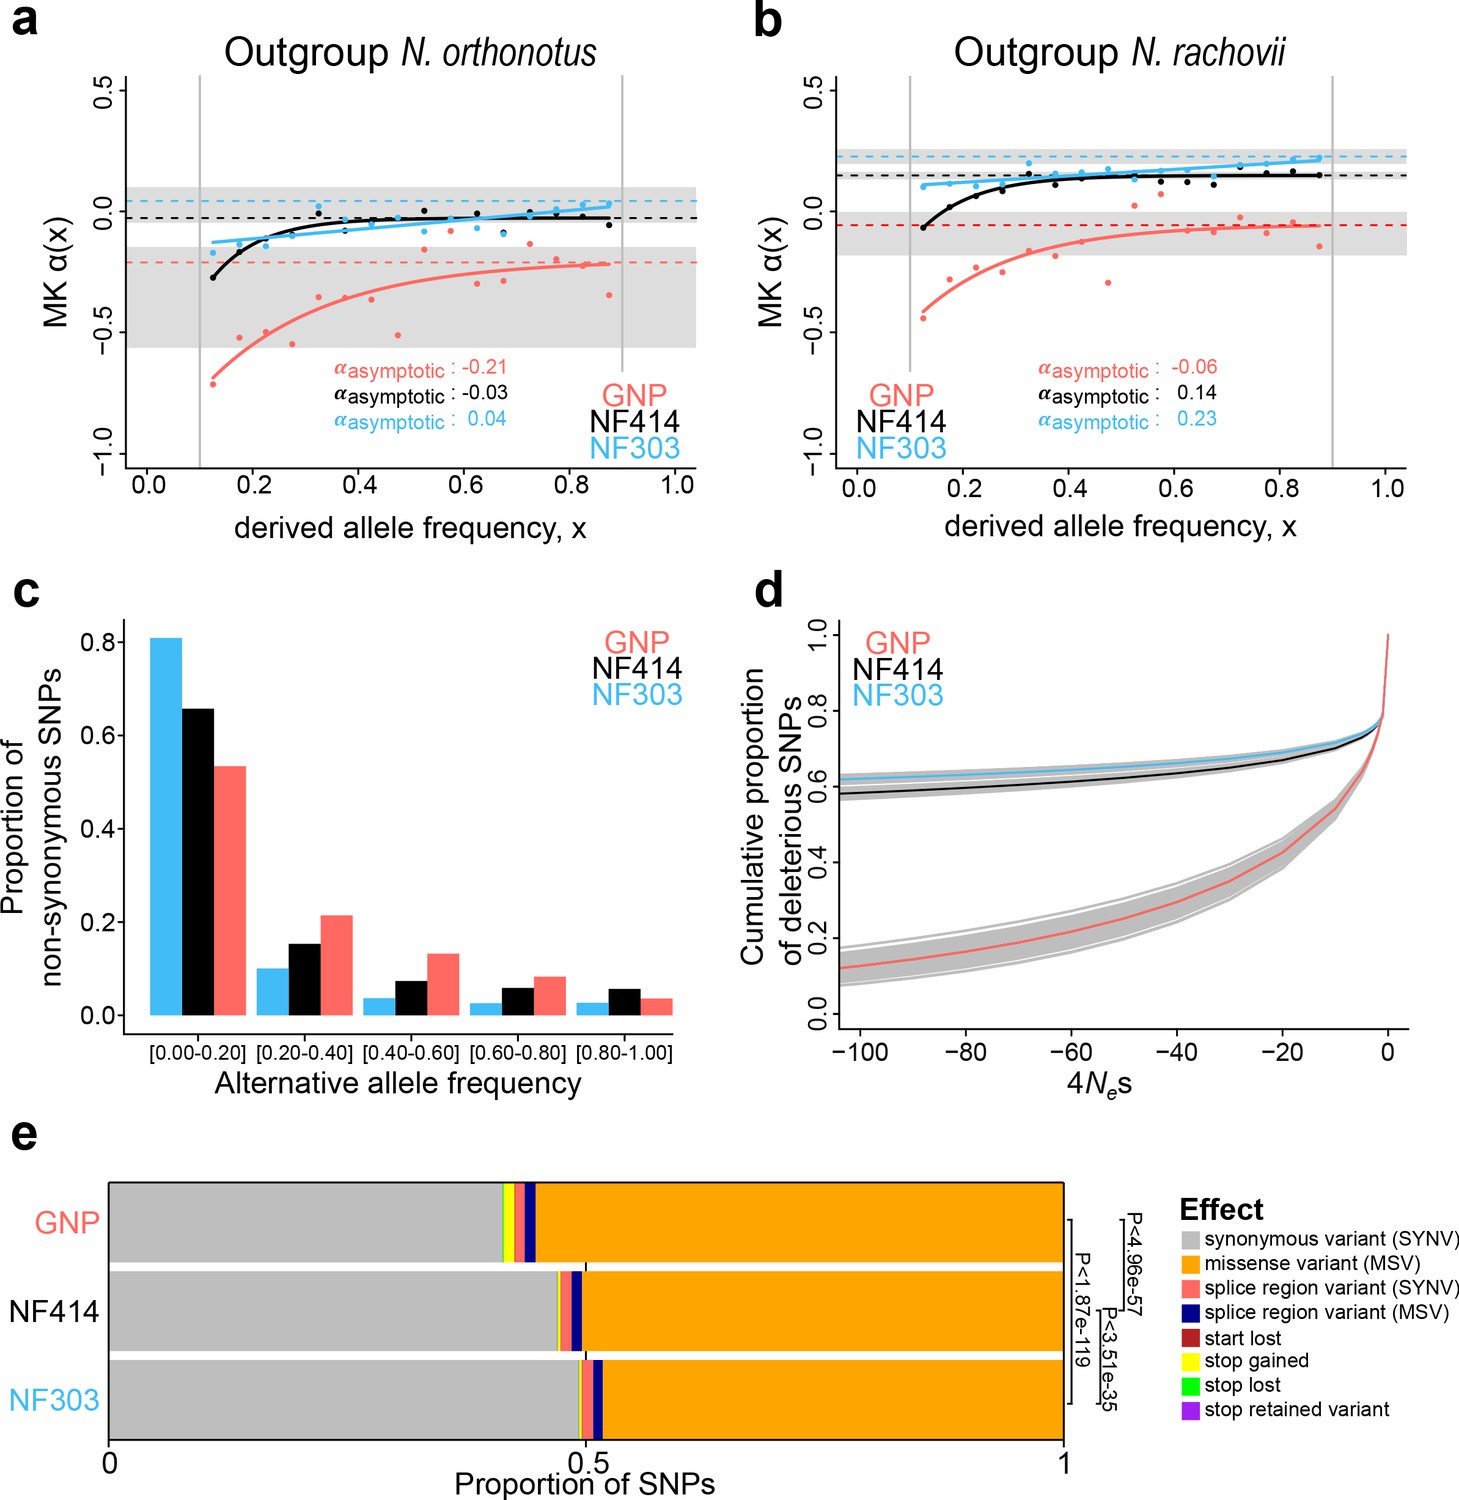
Genome-wide signatures of natural and relaxed selection in turquoise killifish populations.
Asymptotic McDonald-Kreitman alpha (MK α) analysis based on derived frequency bins using as outgroups (a) Nothobranchius orthonotus and (b) Nothobranchius rachovii. Population GNP is shown in red, NF414 in black, and NF303 in blue. (c) Proportion of non-synonymous SNPs binned in allele frequencies of non-reference (alternative) alleles for GNP (red), NF414 (black) and NF303 (blue). (d) Negative distribution of fitness effects of populations GNP (red), NF414 (black) and NF303 (blue) with cumulative proportion of deleterious SNPs on y-axis and the compound measure of 4Nes on x-axis. (e) Proportion of different effect types of SNPs in coding sequences of all populations. The effect on amino acid sequence for each genetic variant is represented by colors (legend). Significance is based on ratio between synonymous effects to non-synonymous effects (significance based on Chi-square test).
Figure 4—figure supplement 1
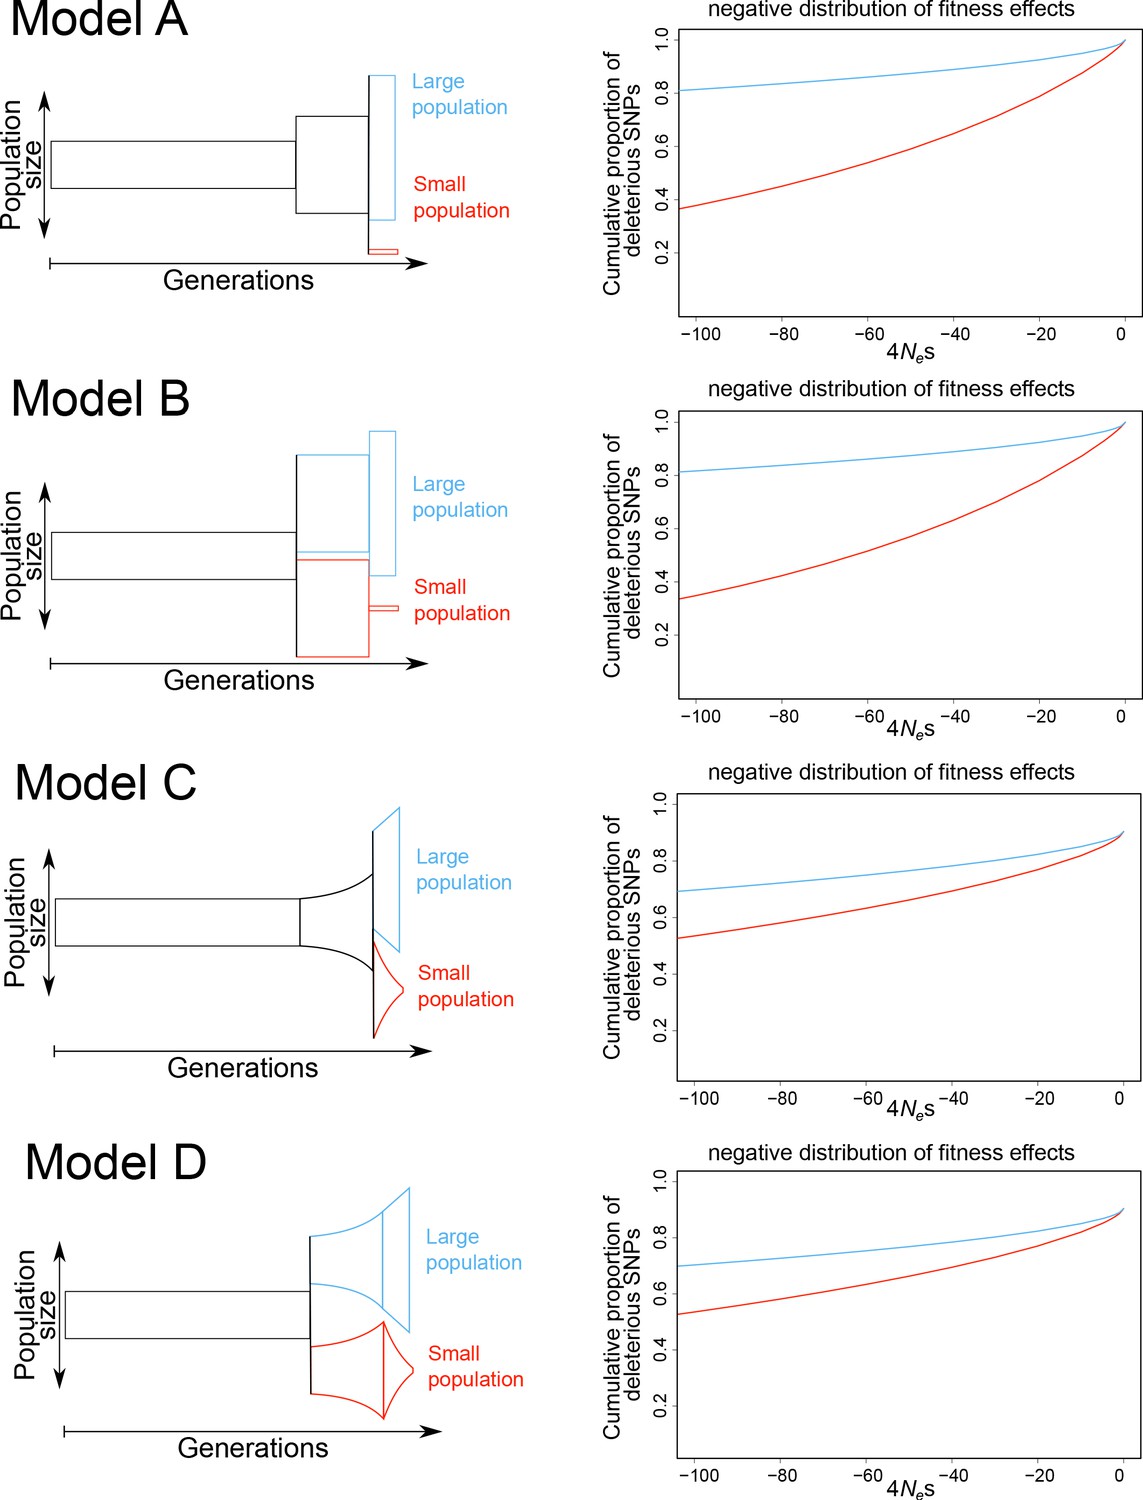
Simulated models with the inferred negative distribution of fitness effects.
Simulated demographic models are shown on the left and the inferred negative distribution of fitness effects are shown on the right (large population in blue, small population in red). Models differ after the burn-in phase with either constant population sizes (models A, B) or exponential population de-/increase (models C, D). Models A and C include a shared ancestral population after burn-in phase and models B and D directly split after the burn-in phase. Population size is shown on y-axis and generations are shown on the x-axis. The negative distribution of fitness effects is shown with the cumulative proportion of deleterious SNPs on the y-axis and the compound measure of 4Nes on x-axis.
Figure 4—figure supplement 2
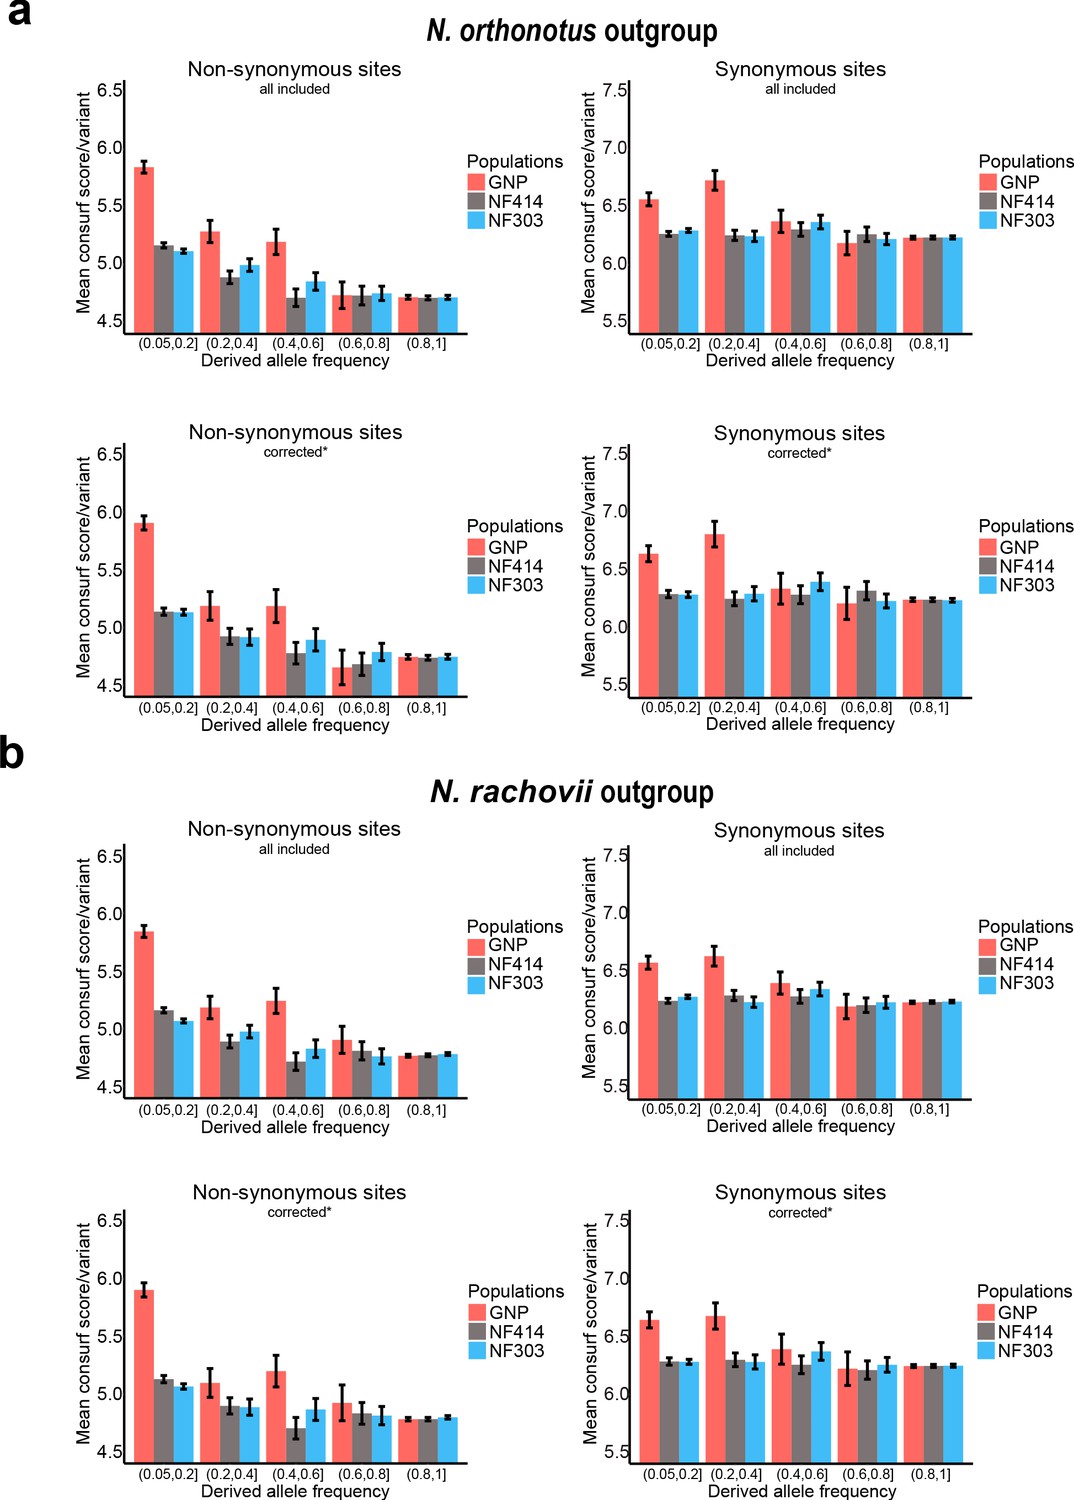
Mean Consurf score per variant based on derived frequency bins.
(a) Mean Consurf score based on derived frequency bins in non-synonymous (left) and synonymous (right) sites using Nothobranchius orthonotus as outgroup, including all available sites (upper panel) or only sites corrected for CMD, CpG hypermutation and highly detrimental effect based on SnpEFF analysis (lower panel). (b) Mean Consurf score based on derived frequency bins in non-synonymous (left) and synonymous (right) sites using Nothobranchius rachovii as outgroup, including all available sites (upper panel) or only sites corrected for CMD, CpG hypermutation and highly detrimental effect based on SnpEFF analysis (lower panel). Mean Consurf scores per variant are shown with SEM.
Figure 5
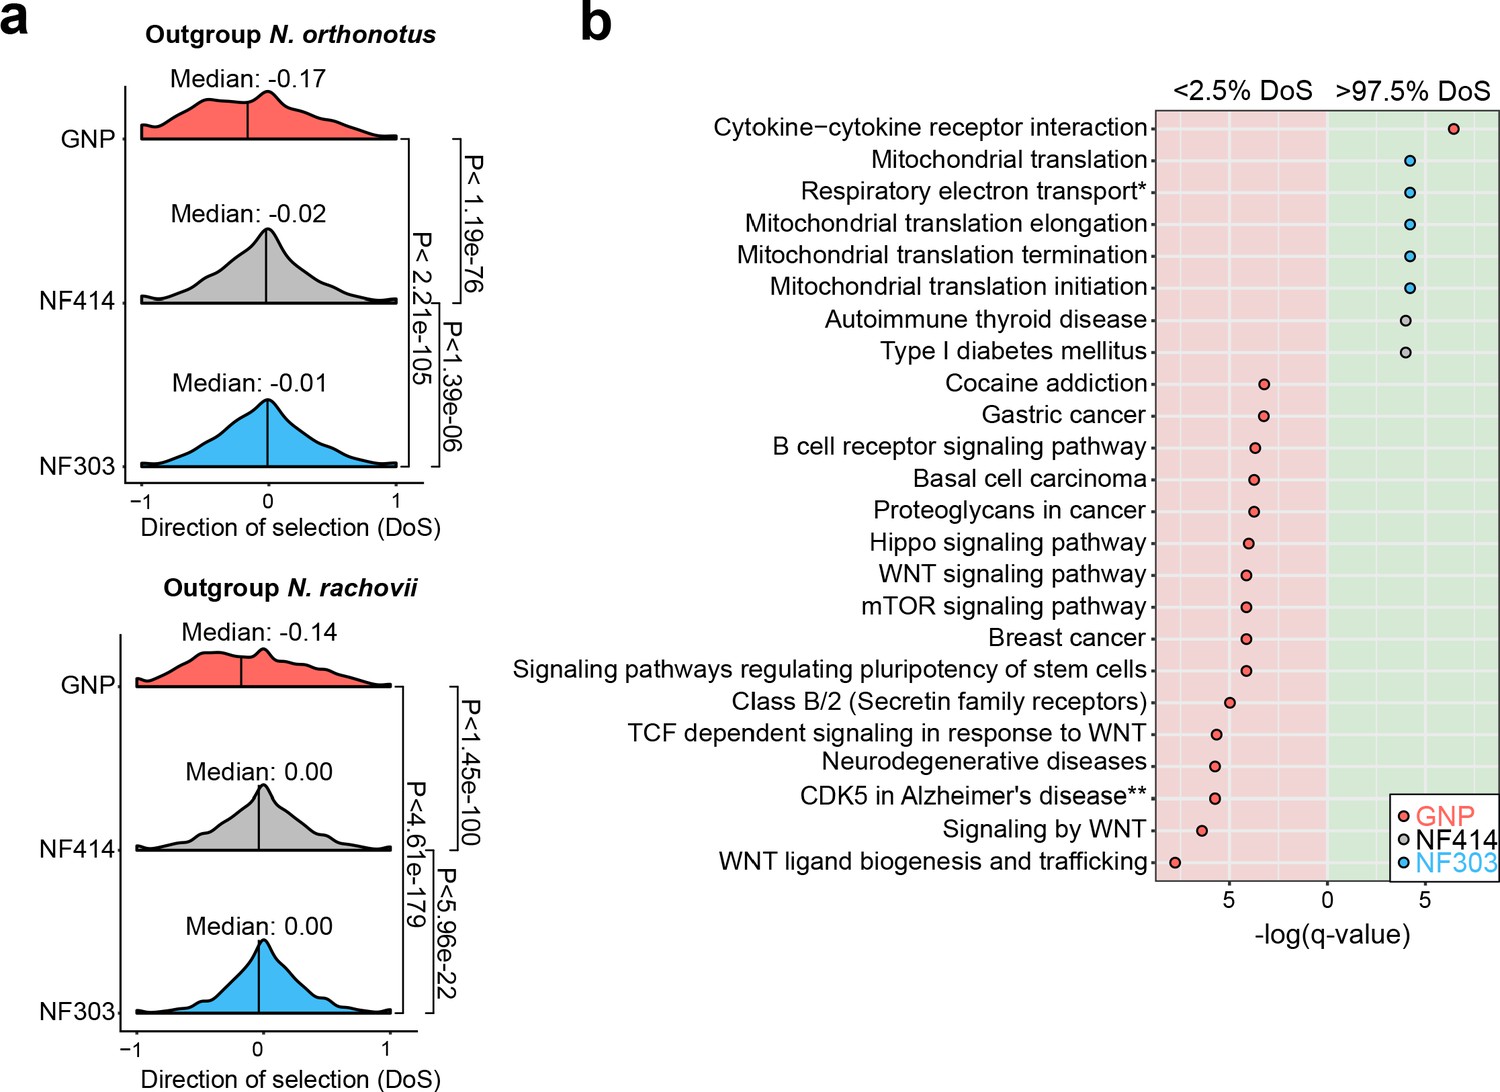
Pathway enrichment in genes under adaptive and neutral evolution in turquoise killifish populations.
(a) Distribution of direction of selection (DoS) represented with median of distribution for population GNP (red), NF414 (grey) and NF303 (blue). Left panel shows DoS distribution computed using Nothobranchius orthonotus as outgroup and right panel shows DoS distribution computed using Nothobranchius rachovii as outgroup. Significance based on Wilcoxon-Rank-Sum test. (b) Pathway over-representation analysis of genes below the 2.5% level of gene-wise DoS values are shown with red background and above the 97.5% level of gene-wise DoS values are shown with green background. Only pathway terms with significance level of FDR corrected q-value <0.05 are shown (in -log(q-value)). Terms enriched in population GNP have red dots, enriched in population NF414 have black dots, and enriched in population NF303 have blue dots, respectively.
Author response image 1
Additional files
-
Supplementary file 1
file 1A.
Geographical and environmental statistics file 1B. Sequencing and mapping statistics file 1C. Genome-wide genetic differentiation file 1D. FST outlier high genetic differentiation NF414 vs. NF303 file 1E. FST outlier high genetic differentiation NF303 vs. GNP file 1F. FST outlier high genetic differentiation NF414 vs. GNP file 1G. FST outlier low genetic differentiation file 1H. Distribution of fitness effects file 1I. Pathway overrepresentation DoS file 1J. FST outlier genes differentially expressed with age file 1K. Pairwise Wilcoxon rank sum test P values for Consurf score with N. orthonotus as outgroup file 1L. Pairwise Wilcoxon rank sum test P values for Consurf score with N. rachovii as outgroup
- https://cdn.elifesciences.org/articles/55794/elife-55794-supp1-v2.xlsx
-
Transparent reporting form
- https://cdn.elifesciences.org/articles/55794/elife-55794-transrepform-v2.pdf
Download links
A two-part list of links to download the article, or parts of the article, in various formats.
Downloads (link to download the article as PDF)
Open citations (links to open the citations from this article in various online reference manager services)
Cite this article (links to download the citations from this article in formats compatible with various reference manager tools)
Intra-species differences in population size shape life history and genome evolution
eLife 9:e55794.
https://doi.org/10.7554/eLife.55794


