Ecdysone steroid hormone remote controls intestinal stem cell fate decisions via the PPARγ-homolog Eip75B in Drosophila
- Institute of Genetics, Heinrich-Heine-University, Germany
Figures
Figure 1 with 1 supplement

The Ecdysone receptor in intestinal progenitors controls tissue homeostasis.
(A) Scheme of the adult Drosophila melanogaster gastrointestinal tract with cartoon depicting the midgut epithelial monolayer composed of intestinal stem cells (ISC), enteroblasts (EB), enterocytes (EC) and enteroendocrine cells (EE) colored according to the lineage tracing system ReDDM with esg-Gal4 (Antonello et al., 2015a). (B) Schematic of esgReDDM tracing including full genotype. ReDDM differentially marks cells having active or inactive Gal4 expression. Combined with esg-Gal4, active in ISC and EB, esgReDDM double marks ISC and EB driving the expression of UAS-CD8::GFP (membrane CD8::GFP, green), UAS-H2B::RFP (nuclear H2B::RFP, red) and further UAS-driven transgenes (UAS abbreviated as >hereafter in Figure panels). Newly differentiated EC and EE with inactive esg-Gal4 are RFP+-only owing to protein stability of H2B::RFP. Flies are grown at permissive 18°C in which transgene expression is repressed by ubiquitous tubulin-driven Gal80ts. By shifting adult females to the restrictive temperature of 29°C, Gal80ts is destabilized, in turn enabling ReDDM-tracing marking progeny (EE and EC with H2B::RFP nuclear stain) and in parallel manipulation by allowing transactivation of UAS-sequences through esg-driven Gal4-expression (Antonello et al., 2015a). Posterior midguts (PMG) after seven days of esgReDDM tracing of control (crossed with w1118) adult MF (D) show mating dependent addition of new EC compared to control VF (C) (Reiff et al., 2015). (E) Knockdown of EcR using UAS-driven RNAi abolishes mating induced new EC generation in MF. (F+G) Overexpression of >EcR.B2 in VF (F) and >EcRFlyORFFlyORF840 (G) does not induce proliferation or differentiation of progenitors (ISC+EB). (H–I) Quantification of progenitor numbers (H) and traced progeny encompassing EC and EE (I) in R5 PMG (n = 24,17,17,17, 8). Error bars are Standard Error of the Mean (SEM) and asterisks denote significances from one-way ANOVA with Bonferroni's Multiple Comparison Test (*p<0.05, **p<0.01; ***p<0,001; ****p<0.0001). (J) Cartoon depicting experimental manipulations on EcR signaling pathway investigated with esgReDDM. Scale bars = 100 µm.
-
Figure 1—source data 1
Data from Figure 1.
Panel G,H experimental data.
- https://cdn.elifesciences.org/articles/55795/elife-55795-fig1-data1-v3.xlsx
Figure 1—figure supplement 1
The EcR is expressed in the adult Drosophila midgut.
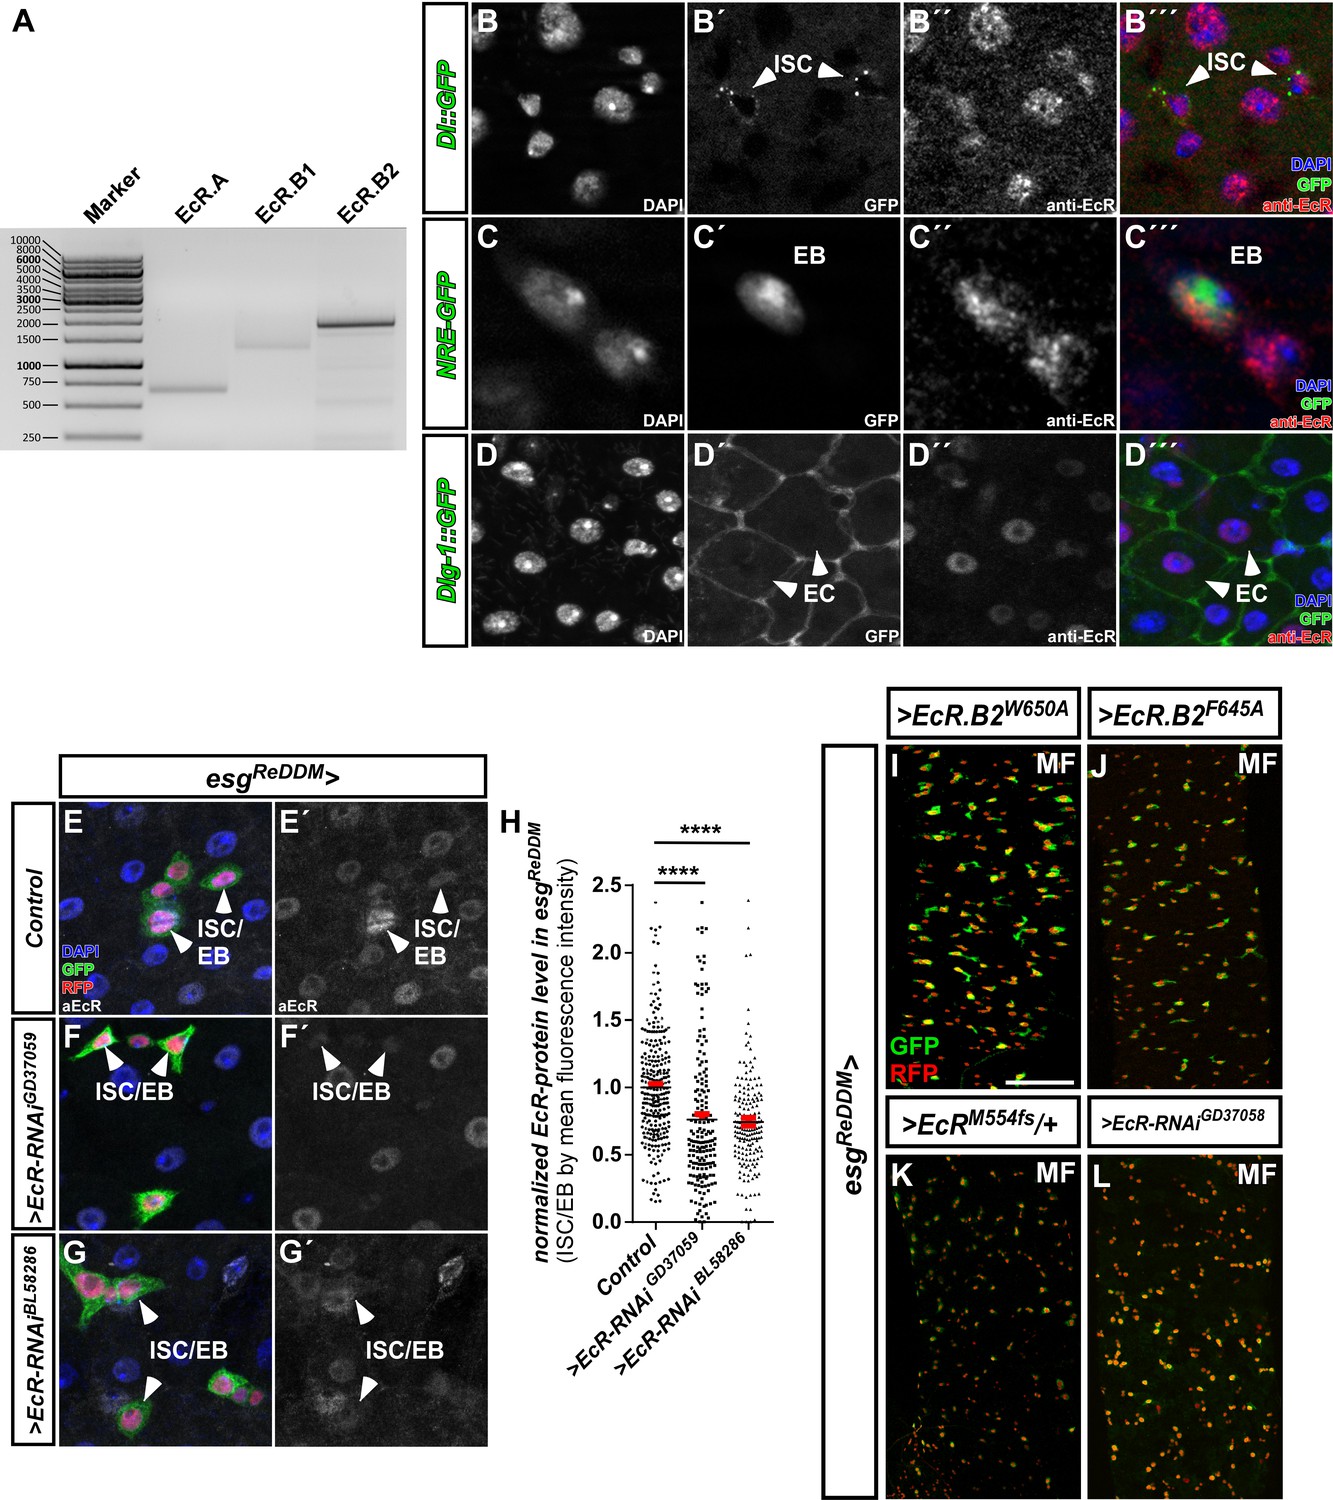
(A) Expression analysis of Ecdysone-receptor splice variants with specific primer sets performed on cDNA transcribed from mRNA isolations of whole midgut dissections of adult MF. (B–D) Antibody staining against all EcR variants in PMG of adult MF using transgenic lines for the ISC-specific Notch-ligand Delta tagged with GFP (Dl::GFP, B-B’’’ inset magnification) and Notch responsive element marking EB (NRE-GFP, C-C’’’ inset magnification). Absorptive differentiated EC were identified using the GFP-tagged septate junction marker Dlg-1 (D–D’’’). Shown are single fluorescence channels including DAPI and merge (B’’’–D’’’). (E–H) Representative images of esgReDDM driving EcR-RNAis showing reduction of EcR immunoreactivity (F–G’). (H) in situ quantification of EcR levels by fluorescence intensity measurements in esgReDDM after seven days of tracing. Confocal images were taken at identical excitation and emission settings. Single GFP+/RFP+ progenitor cell nuclei were measured using Fiji and statistically analyzed (n = 272,179,179) using one-way ANOVA with Bonferroni's Multiple Comparison Test (*p<0.05, **p<0.01; ***p<0,001; ****p<0.0001). (I–L) Forced expression of dominant-negative EcR.B2-variants (I+J), heterozygosity with the EcRM554fs-allele (K) and a second EcR-RNAi (L) after seven days of esgReDDM-tracing in adult PMG of MF. Scale bars = 100 µm.
-
Figure 1—figure supplement 1—source data 1
Data from Figure 1—figure supplement 1.
Panel H experimental data.
- https://cdn.elifesciences.org/articles/55795/elife-55795-fig1-figsupp1-data1-v3.xlsx
Figure 2 with 1 supplement
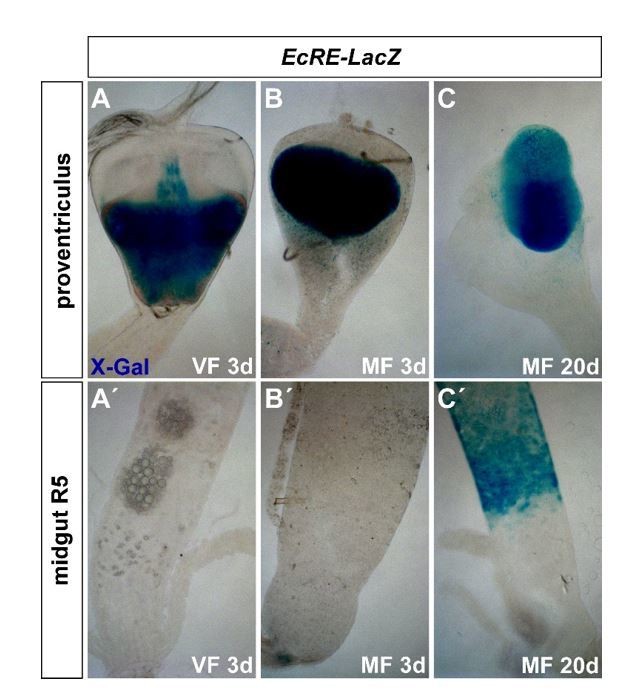
Intracellular 20-Hydroxy-ecdysone levels control ecdysone response through the ecdysone importer.
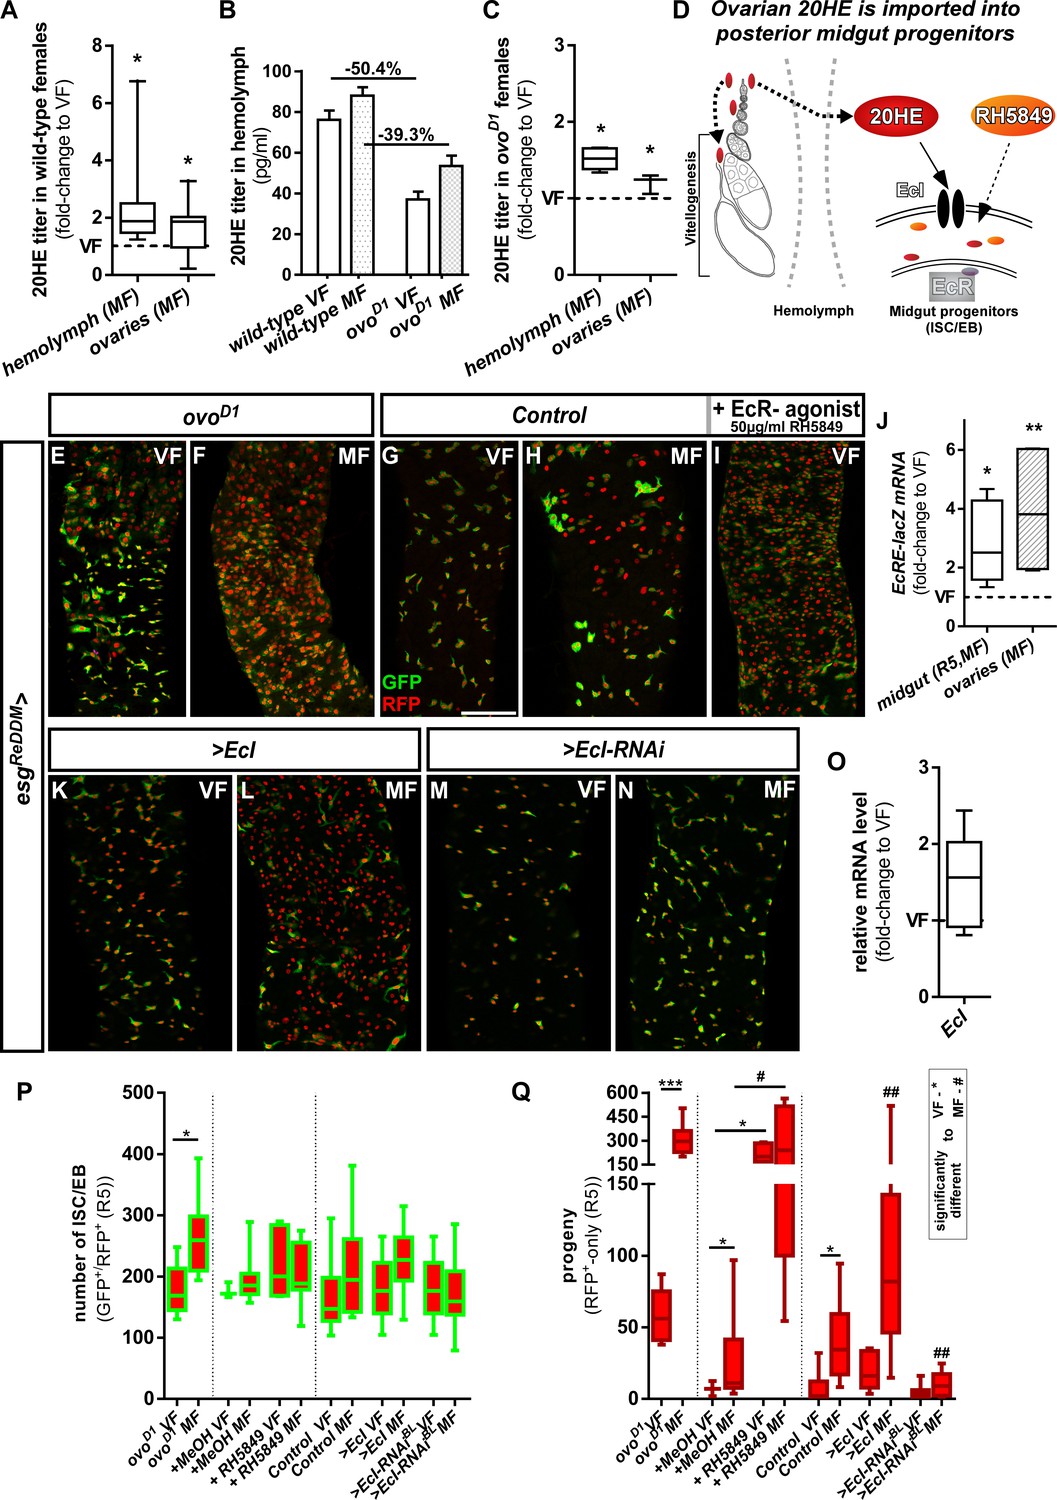
(A–C) Determination of 20HE titers in ovaries and hemolymph of wild-type (A,B) and ovoD1 (B,C) adult VF and MF 48 hr after mating. (A,C) show fold-change increases over VF titer (dotted line at y = 1). (D) Cartoon depicting ovarian 20HE release to ISC/EB in the adjacent PMG. Please note that in wild-type females, 20HE is incorporated into developing eggs during vitellogenesis, whereas in ovoD1 vitellogenesis is absent and might lead to higher (proportional) release into the hemolymph. 20HE from the hemolymph is absorbed by ISC/EB in the PMG, where the cartoon illustrates specific genetical and pharmacological manipulations on the EcR-signaling pathway. (E–I) Representative images of adult PMG after seven days of esgReDDM tracing of ovoD1 VF (E), ovoD1 MF (F) and control VF (G) and MF (H). (I) Control VF PMG after oral administration of RH5849 (50 µg/ml). (J) Quantitative RT-PCR on EcRE (Ecdysone responsive elements, [Schwedes et al., 2011]) driving lacZ expression on intestinal cDNA from VF and MF control flies. Values are normalized to VF levels (dotted line at y = 1) and statistically analysed using student´s t-test (*p<0.05, **p<0.01; ***p<0,001;). (K–N) Up- and downregulation of EcI in VF (K,M) and MF (L,N) using UAS driven transgenes after seven days of tracing with esgReDDM. (O) Quantitative RT-PCR of EcI on intestinal cDNA from VF and MF control flies. Values are normalized to VF levels (dotted line at y = 1) and statistically analysed using student´s t-test (*p<0.05, **p<0.01; ***p<0,001;). (P,Q) Quantification of progenitor numbers (P) and traced progeny encompassing EC and EE (Q) in R5 PMG (n = 7,9/3,9,5,13/16,13,8,10,10,19). Error bars are Standard Error of the Mean (SEM) and asterisks denote significances from one-way ANOVA with Bonferroni's Multiple Comparison Test (*p<0.05, **p<0.01; ***p<0,001; ****p<0.0001). Scale bars = 100 µm.
-
Figure 2—source data 1
Data from Figure 2.
Panel A,B,C,J,O,P,Q experimental data.
- https://cdn.elifesciences.org/articles/55795/elife-55795-fig2-data1-v3.xlsx
Figure 2—figure supplement 1

20HE regulates physiological adaptations of fatty acid metabolism.
(A) Drosophila food tubes of w1118 control egg layings to determine concentrations of RH5849. Please note that there is no crawling L3-larvae and puparium formation in both RH5849 concentrations. MeOH is the carrier solution and serves as control in all performed pharmacological experiments using RH5849. (B–B’’’) Forced expression of >EcI::HA using esgReDDM with subsequent immunohistochemistry using HA-antibodies reveals correct membrane localization of tagged EcI::HA (B’) in ISC/EB (B) (Okamoto et al., 2018). (C–G) Srebp-Gal4 > CD8::GFP carrying VF and MF were crossed with w1118 (C+D),>EcR RNAi (E+F) or treated with RH5849 (G) for three days. The Srebp-Gal4 line used is subjected to the same proteolytic processing as wild-type Srebp, thus reflecting upregulation of lipid uptake gene expression (Athippozhy et al., 2011; Reiff et al., 2015). (H) Mean GFP-fluorescence intensities in R5 PMG of according genotypes in (C–G) were measured using Fiji imaging software and statistically analyzed (n = 12, 15, 13, 18, 9) using one-way ANOVA with Bonferroni's Multiple Comparison Test (*p<0.05, **p<0.01; ***p<0,001; ****p<0.0001). Scale bars = 100 µm. (I–N) Representative images of direct assessment of lipid content in PMG with OilRedO-staining of the indicated genotypes. Mex-Gal4, tub-Gal80ts was used to temporally control EC manipulation of indicated genes. (I–N) Control flies (I+J), fed with RH5849 (K), >EcI (L), >EcI RNAi (M) and >EcR RNAi (N) were kept for seven days at 29°C to allow transgene activation. (O) Quantification of OilRedO intensity and statistical analysed (n = 11,17,12,16,8,9) using student’s t-test. Unluckily, we were unable to combine these fly stocks with ovoD1 to reveal whether egg production obscures a reduction of EcI-RNAi and EcR-RNAi in EC lipid uptake as shown in Reiff et al., 2015.
-
Figure 2—figure supplement 1—source data 1
Data from Figure 2—figure supplement 1.
Panel H,O experimental data.
- https://cdn.elifesciences.org/articles/55795/elife-55795-fig2-figsupp1-data1-v3.xlsx
Figure 3 with 2 supplements
Ecdysone induced protein 75B is upregulated upon mating and controls progenitor differentiation.
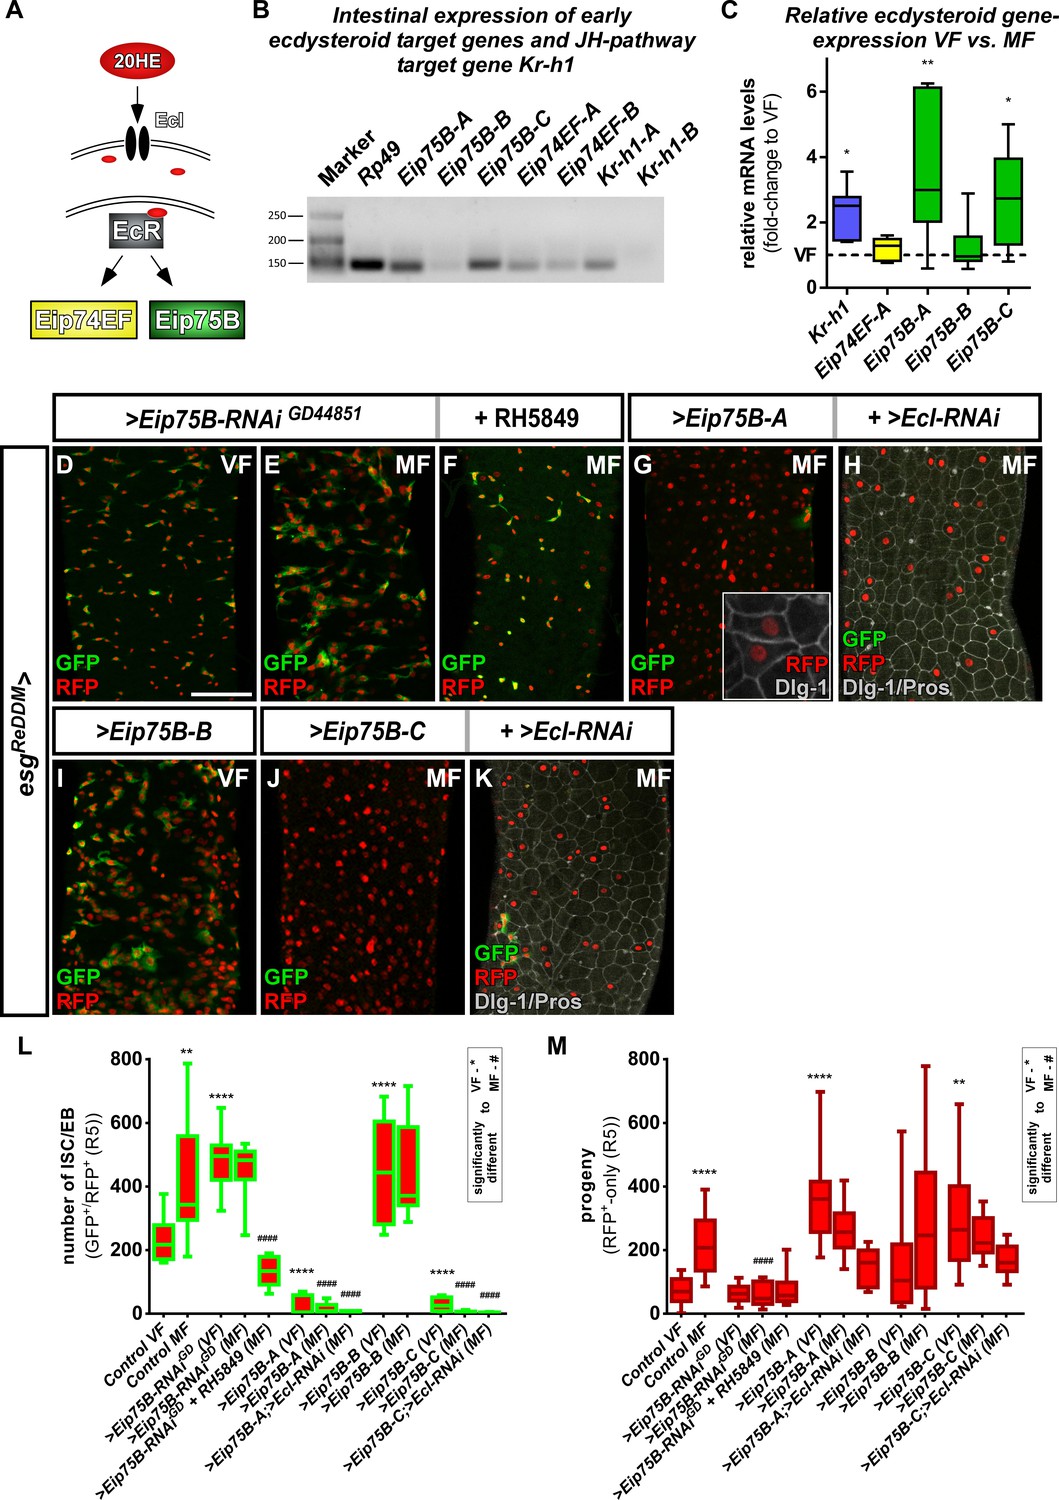
(A) Cartoon depicting EcR signaling cascade activating early ecdysteroid target genes. (B) Expression analysis of Ecdysone- and JH-signaling target genes including protein isoforms on cDNA transcribed from mRNA isolations from whole midgut dissections of MF. (C) Quantitative RT-PCR on early ecdysteroid genes on intestinal cDNA from VF and MF control flies. Values are normalized to VF levels (horizontal line = 1) and statistically analyzed using student´s t-test (n = 6; *p<0.05, **p<0.01;). (D–E) RNAi-mediated downregulation of Eip75B in VF (D), MF (E) and MF fed with RH5849 (F) after seven days of tracing with esgReDDM. (G–K) Representative images of adult PMG with forced expression of Eip75B isoforms Eip75B-A (G), Eip75B-A and EcI-RNAi (H), Eip75B-B (I), Eip75B-C (J), Eip75B-C and EcI-RNAi (K) after seven days of tracing with esgReDDM. Inset in (F) depicts epithelial integration of newly generated Dlg-1+/RFP+-EC. (I–J) Quantification of progenitor numbers (I) and traced progeny encompassing EC and EE (J) in R5 PMG (n = 12,13,10,12,11,11,14,8,10,10,10,5,11). Error bars are Standard Error of the Mean (SEM) and asterisks denote significances from one-way ANOVA with Bonferroni's Multiple Comparison Test (*p<0.05, **p<0.01; ***p<0,001; ****p<0.0001, identical p-values are marked by # when compared to MF). Scale bars = 100 µm.
-
Figure 3—source data 1
Data from Figure 3.
Panel C,L,M experimental data.
- https://cdn.elifesciences.org/articles/55795/elife-55795-fig3-data1-v3.xlsx
Figure 3—figure supplement 1
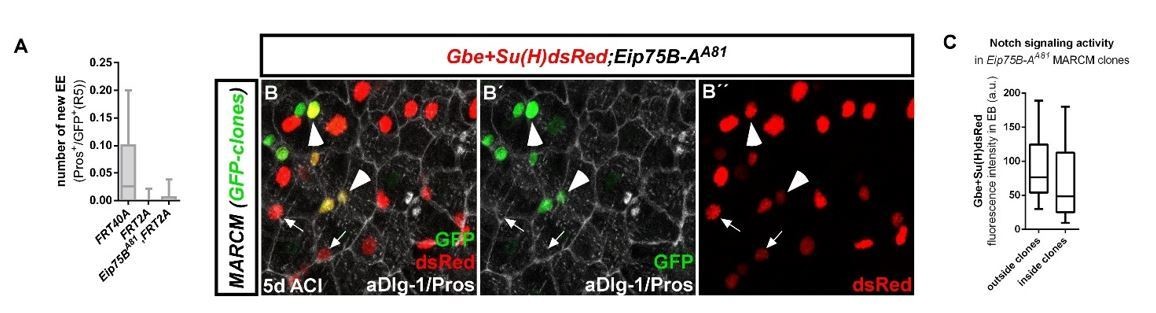
Analysis of Eip75B-A MARCM clones.
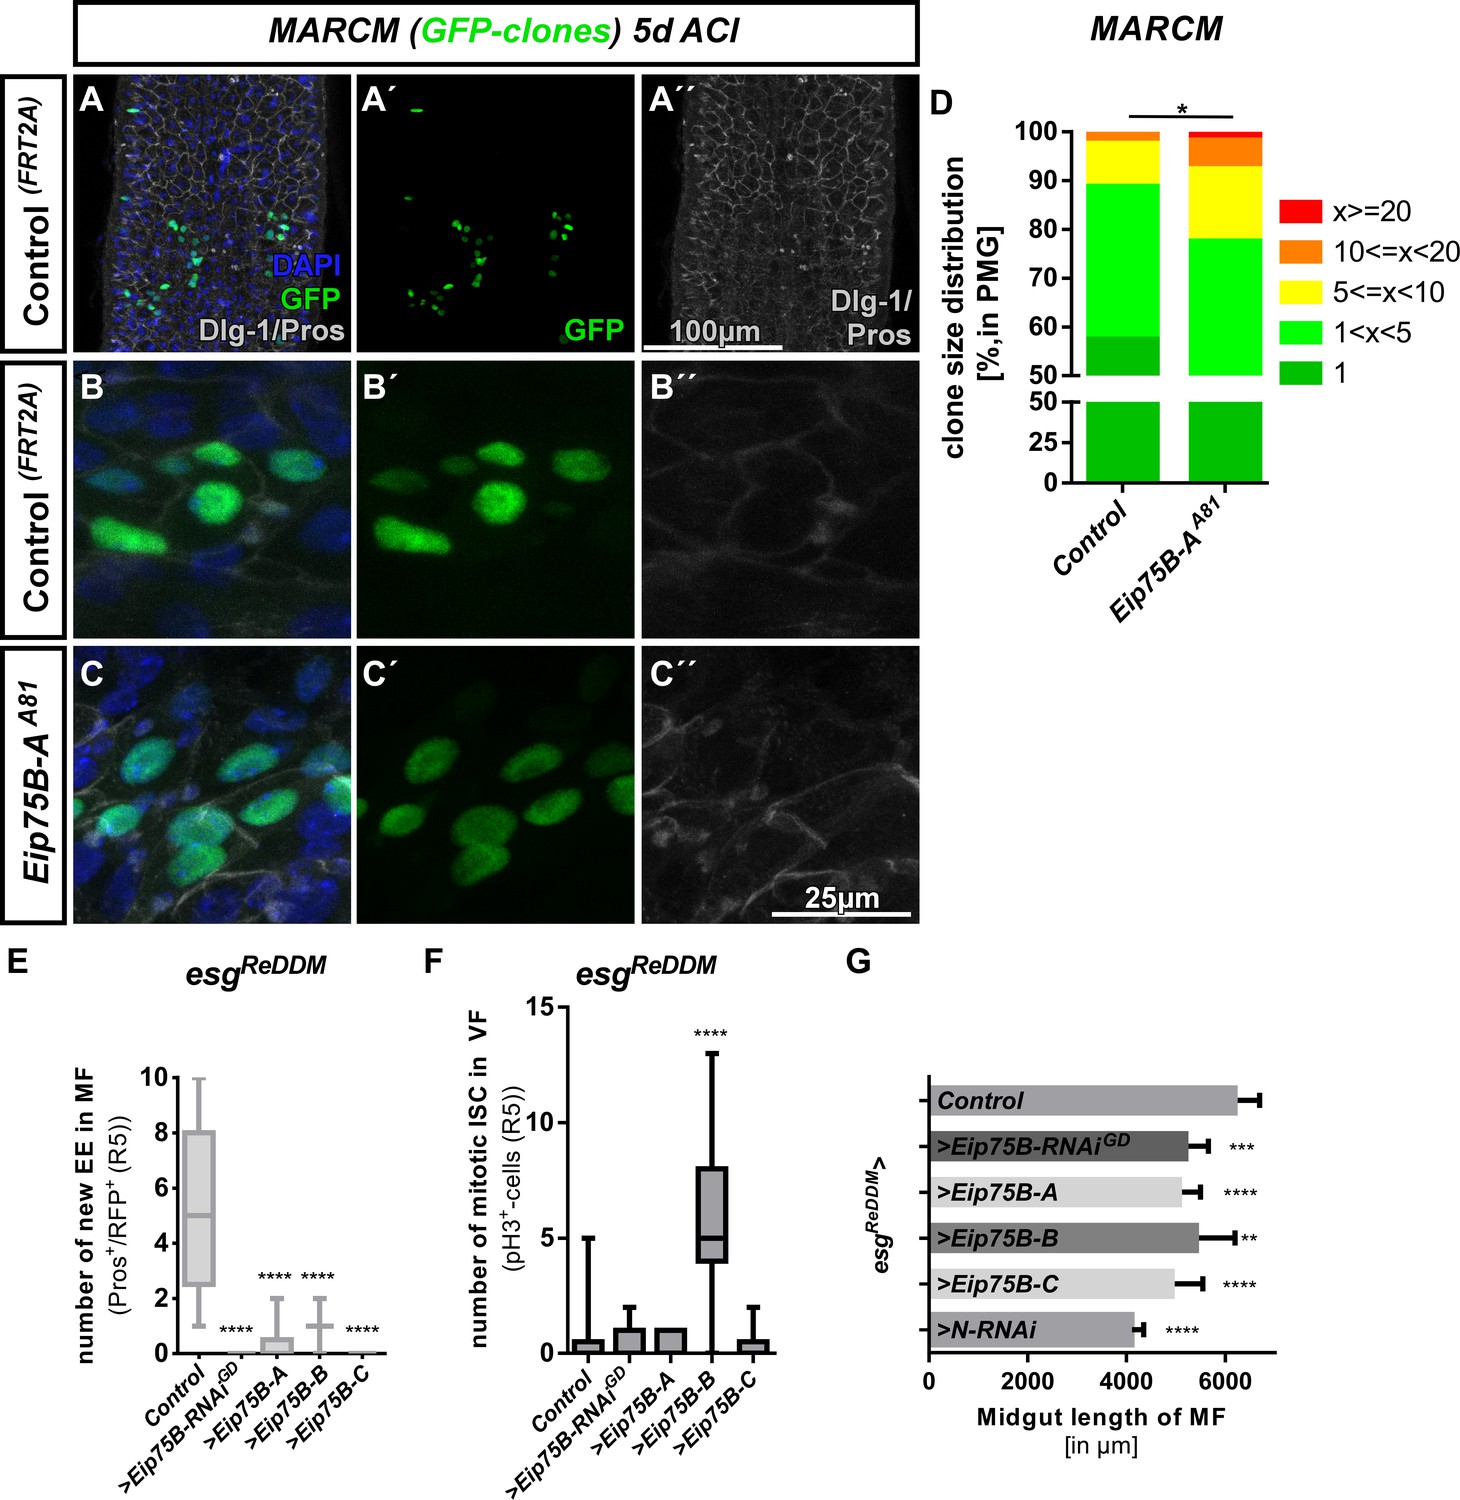
(A–E’’) Representative images of MARCM clones of the indicated allele five days after clone induction (ACI) counterstained with Dlg-1 and Pros immunohistochemistry. Control clones lead to proper EC formation (big GFP+-nuclei/Dlg-1+) and EE (small GFP+ diploid nuclei/Pros+, arrowheads in B). Eip75B-A null mutant clones (C–C’’) do not contain properly differentiated EC (big GFP+ nuclei without Dlg-1). Scale bars indicated in the images (A,B–C). (D) Quantification of GFP-MARCM clone size in R5 PMG (n = 294,252 clones analyzed). Error bars are Standard Error of the Mean (SEM) and asterisks denote significances from unpaired Student´s t-test (*p<0.05). (E) Quantification of EE (n = 12,13,10,12,11) and (F) pH3 (n = 9,11,7,10,10) in R5 PMG. Error bars are Standard Error of the Mean (SEM) and asterisks denote significances from one-way ANOVA with Bonferroni's Multiple Comparison Test (*p<0.05, **p<0.01; ***p<0,001; ****p<0.0001). (G) Overall length in µm of midguts from proventriculus to mid-/hindgut boundary of indicated genotypes. > N RNAi is a genetic condition in which no new EC are generated (Figure 5), thus reflecting the maximum midgut length reduction when no new EC are added.
-
Figure 3—figure supplement 1—source data 1
Data from Figure 3—figure supplement 1.
Panel D,E,F,G experimental data.
- https://cdn.elifesciences.org/articles/55795/elife-55795-fig3-figsupp1-data1-v3.xlsx
Figure 3—figure supplement 2
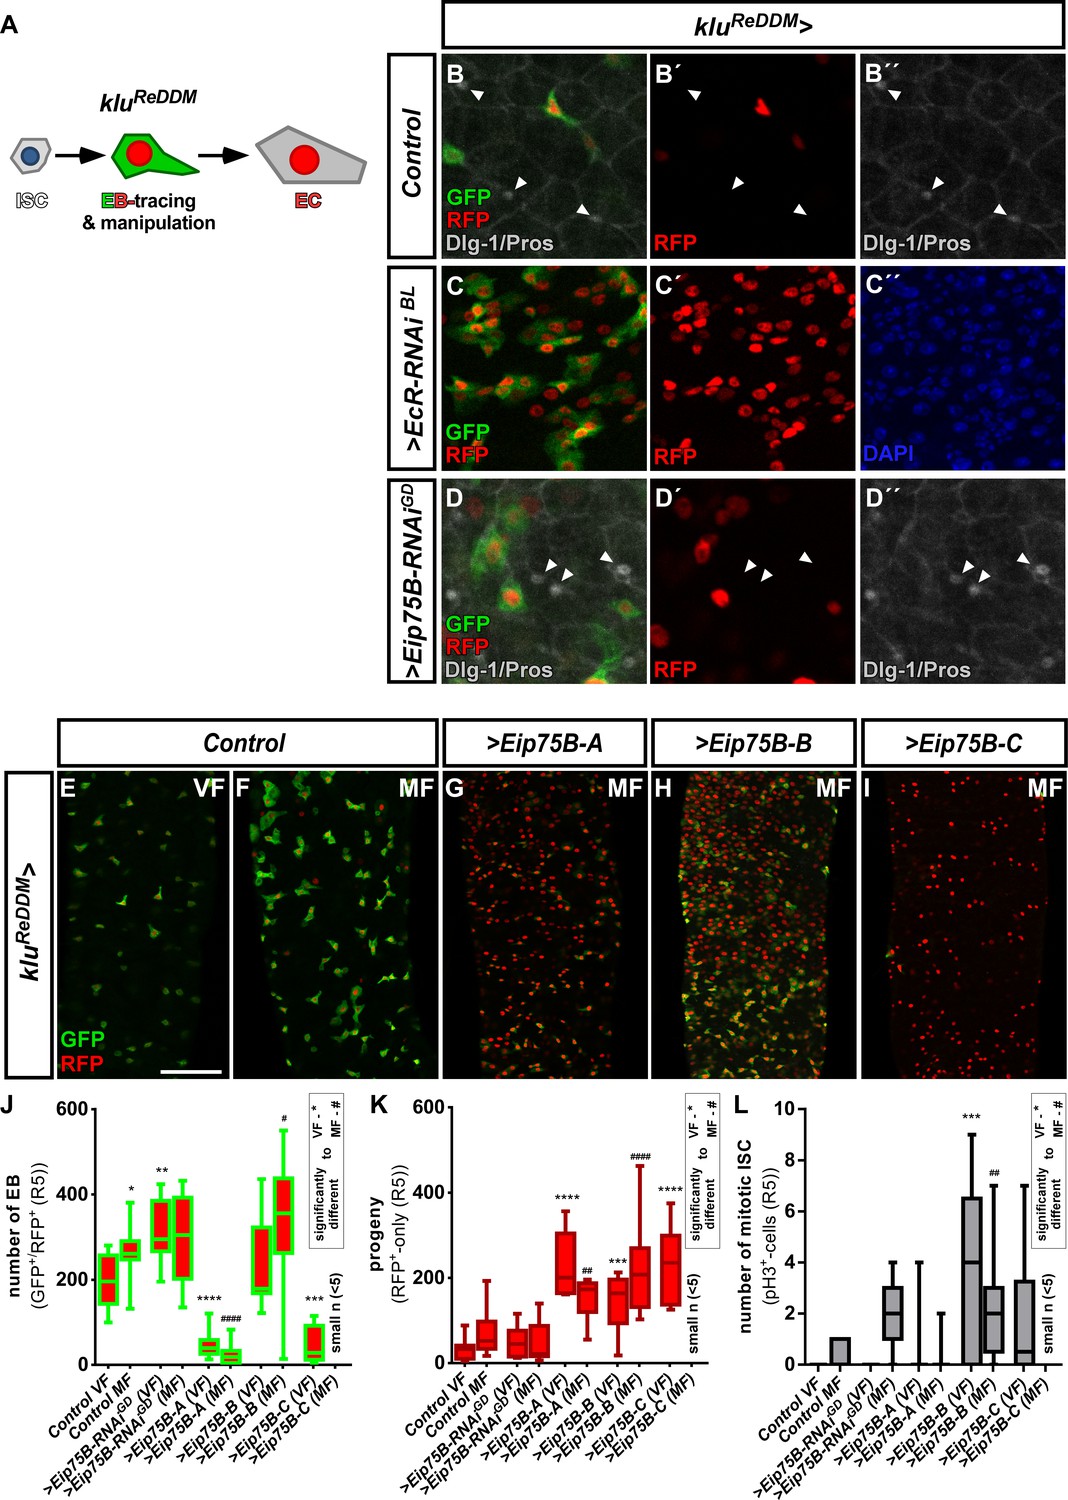
EB specific genetic manipulation of Eip75B using kluReDDM.
(A) Cartoon depicting kluReDDM-tracing. klu-Gal4 is active in EC-committed EB only and EC progeny is labelled with nuclear H2B::RFP (Reiff et al., 2019). (B–D’’) Representative images of MF controls (B–B’’) and EB-specific knockdown of EcR (C-C´´) and Eip75B (D–D’’) using kluReDDM after seven days of tracing. Differentiated progeny was identified in (B+D) with Dlg-1 and Pros immunohistochemistry. (E–I) Representative images of adult PMG of control VF (E) and MF (F) and forced expression of Eip75B gene products Eip75B-A (G), Eip75B-B (H) and Eip75B-C (I) after seven days of tracing with kluReDDM. (J–L) Quantification of EB number (J), traced progeny encompassing EC and EE (K) and ISC mitosis (L) in R5 PMG (n = 11,13,10,10,10,10,6,10,10,10). Error bars are Standard Error of the Mean (SEM) and asterisks denote significances from one-way ANOVA with Bonferroni's Multiple Comparison Test (*p<0.05, **p<0.01; ***p<0,001; ****p<0.0001, identical p-values are marked by # when compared to MF). Scale bars = 100 µm.
-
Figure 3—figure supplement 2—source data 1
Data from Figure 3—figure supplement 2.
Panel A,J,K,L experimental data.
- https://cdn.elifesciences.org/articles/55795/elife-55795-fig3-figsupp2-data1-v3.xlsx
Figure 4
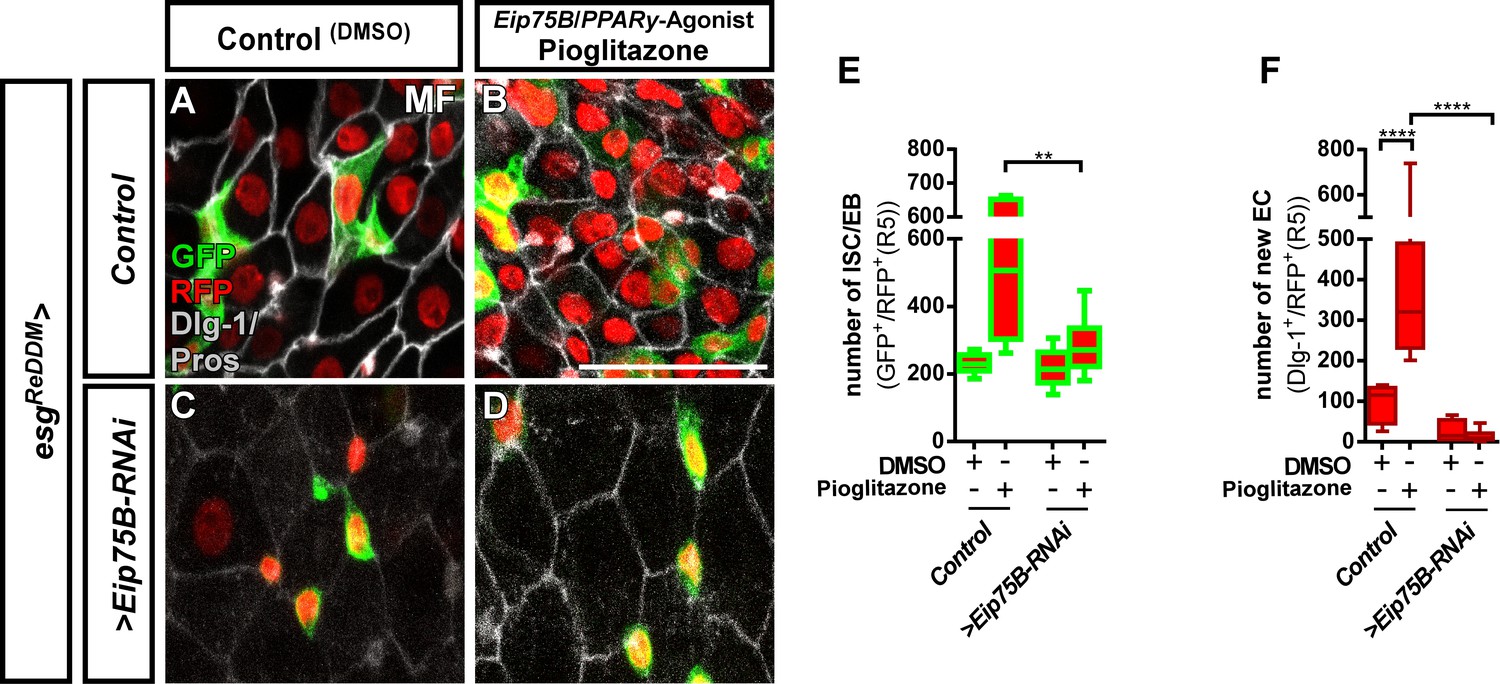
The Eip75B/PPARγ agonist Pioglitazone acts through Eip75B to stimulate progenitor differentiation.
(A–D) Representative images of adult PMG after seven days of esgReDDM tracing of control MF (A,B) and >Eip75 B-RNAi MF (C,D) fed with DMSO as control (A,C, 2.5 µl/ml food) and Pioglitazone (B,D; 0,002 mg in DMSO/ml food). (E+F) Quantification of progenitor numbers (E) and newly generated EC (F) in R5 PMG (n = 7,6,10,11). Error bars are Standard Error of the Mean (SEM) and asterisks denote significances from one-way ANOVA with Bonferroni's Multiple Comparison Test (*p<0.05, **p<0.01; ***p<0,001; ****p<0.0001,. Scale bars = 100 µm.
-
Figure 4—source data 1
Data from Figure 4.
Panel E,F experimental data.
- https://cdn.elifesciences.org/articles/55795/elife-55795-fig4-data1-v3.xlsx
Figure 5
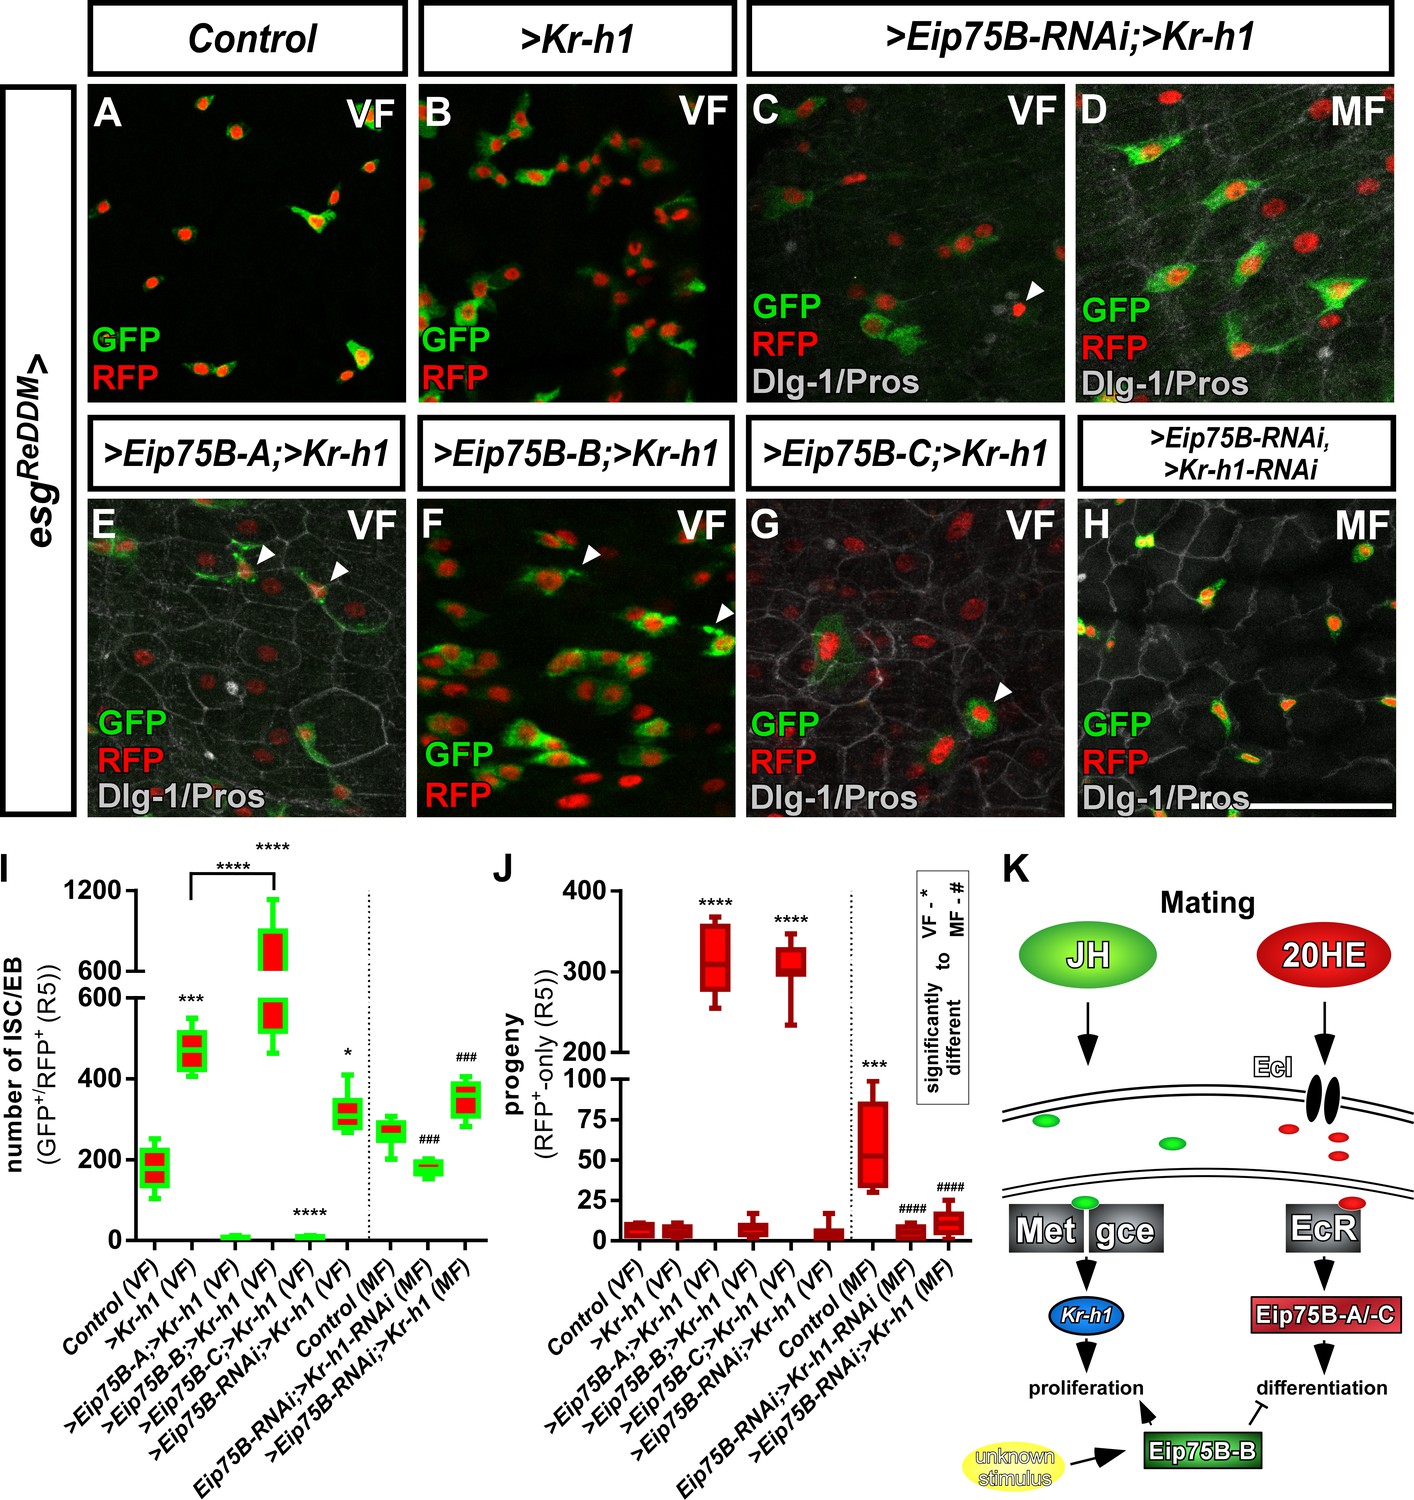
Crosstalk between JH- and Ecdysone-signaling pathways controlling intestinal progenitor proliferation and differentiation.
(A–B) Images of adult PMG of control VF (A) and forced expression of > Kr h1 (B) traced for seven days with esgReDDM. (C–H) Images of adult PMG with forced expression of > Kr h1 with > Eip75 B-RNAi in VF and MF (C,D) and expression of Eip75B isoforms > Eip75 B-A (E),>Eip75 B-B (F),>Eip75 B-C (G) and double > Eip75B-RNAi/>Kr-h1-RNAi (H) after seven days of tracing with esgReDDM. Please note that genotypes of (C–G) were accompanied with semi-lethality even at permissive 18°C, suggesting for example background transgene expression or position effects most probably caused by the total number of six transgenes including esgReDDM. PMG of > Kr h1 combinations also showed some progenitor lethality indicated by membrane-blebbing and irregularities (arrowheads, (E–G) as described in Reiff et al., 2019. (J) Quantification of progenitor numbers (I) and traced progeny encompassing EC and EE (J) in R5 PMG (n = 12,5,9,8,7,13,8,8,13). Error bars are Standard Error of the Mean (SEM) and asterisks denote significances from one-way ANOVA with Bonferroni's Multiple Comparison Test (*p<0.05, **p<0.01; ***p<0,001; ****p<0.0001, identical p-values are marked by # when compared to MF). Scale bars = 50 µm (K) Cartoon depicting transcriptional effectors of JH- and Ecdysone signaling pathways. The JH receptor is formed by a heterodimer of Methoprene tolerant (Met) and germ cells expressed (gce). Ligand bound receptor activates the transcription of krüppel homolog 1 (Kr-h1) mediating mating effects in the adult intestine (Reiff et al., 2015) Forced expression of Eip75B-B affects proliferation and differentiation through an yet unknown stimulus.
-
Figure 5—source data 1
Data from Figure 5.
Panel I,J experimental data.
- https://cdn.elifesciences.org/articles/55795/elife-55795-fig5-data1-v3.xlsx
Figure 6 with 1 supplement
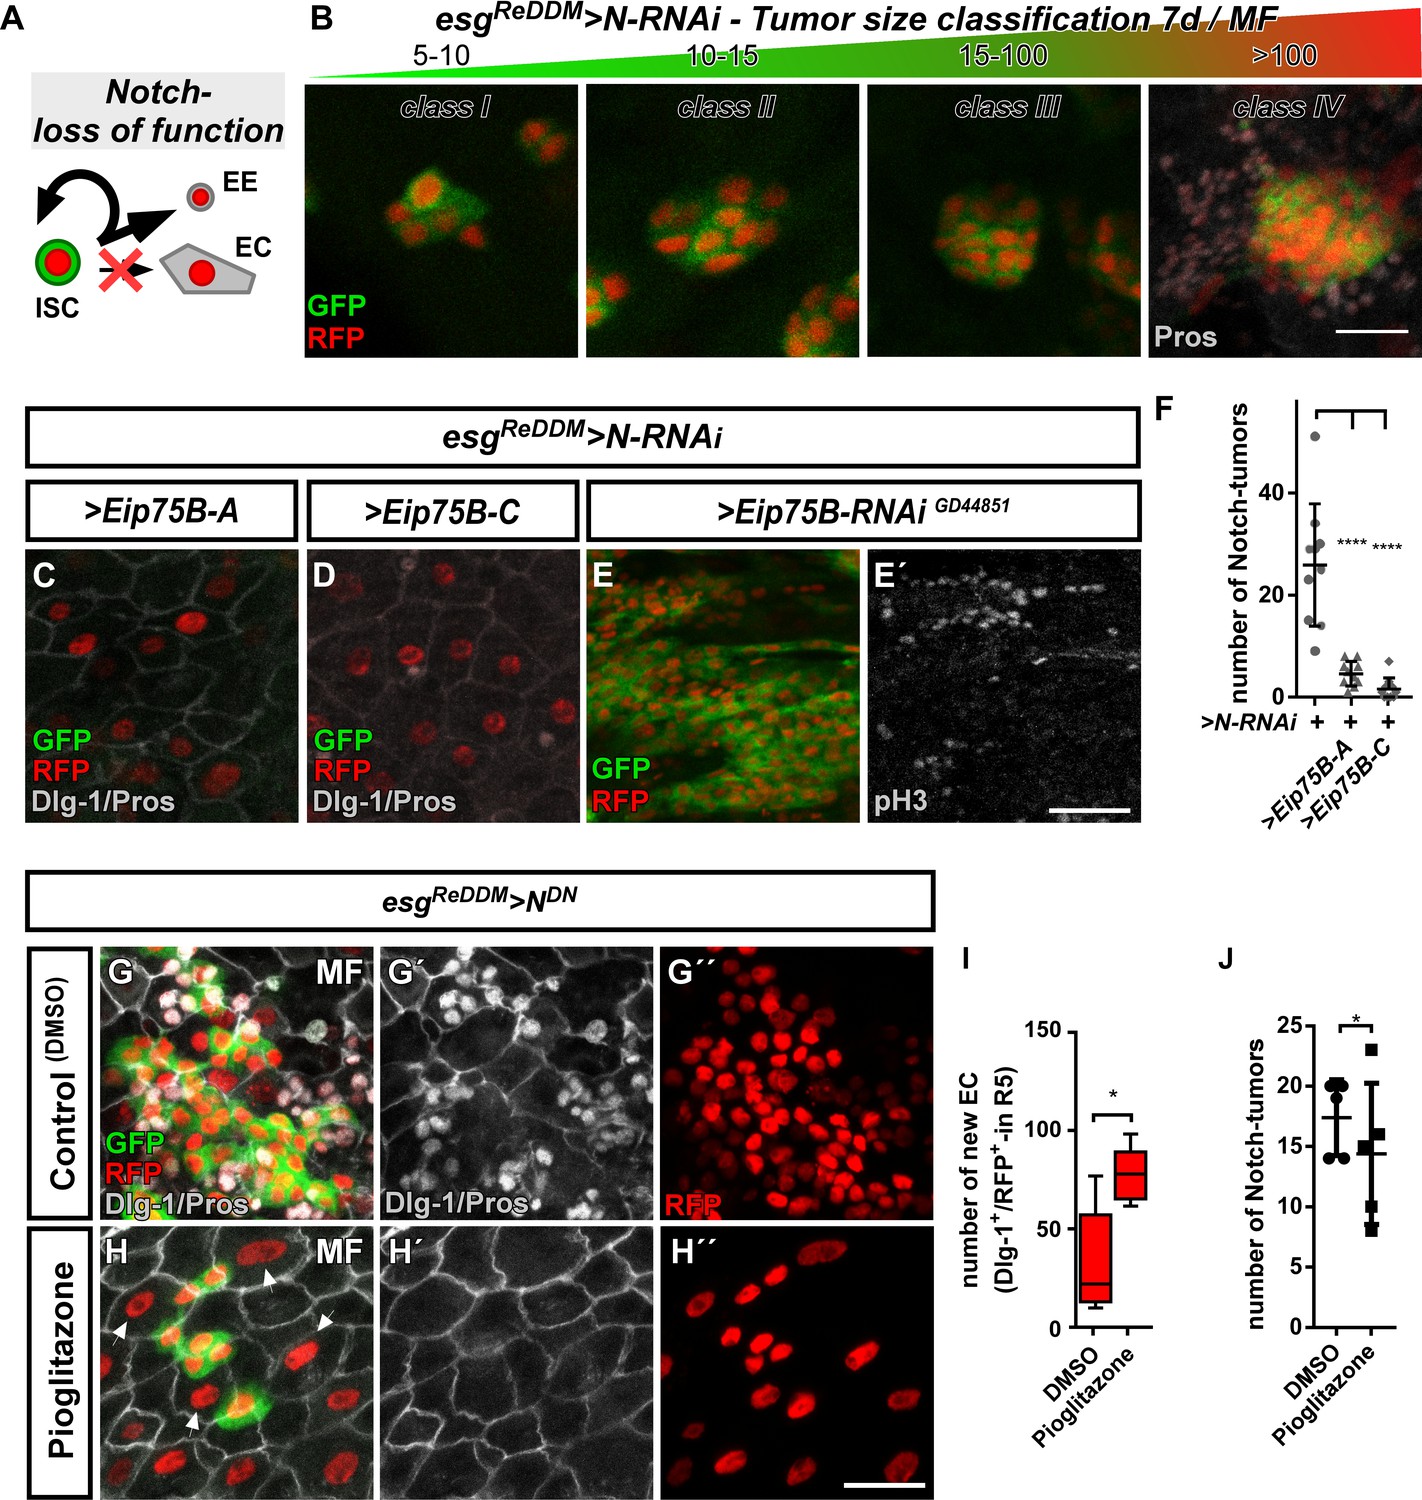
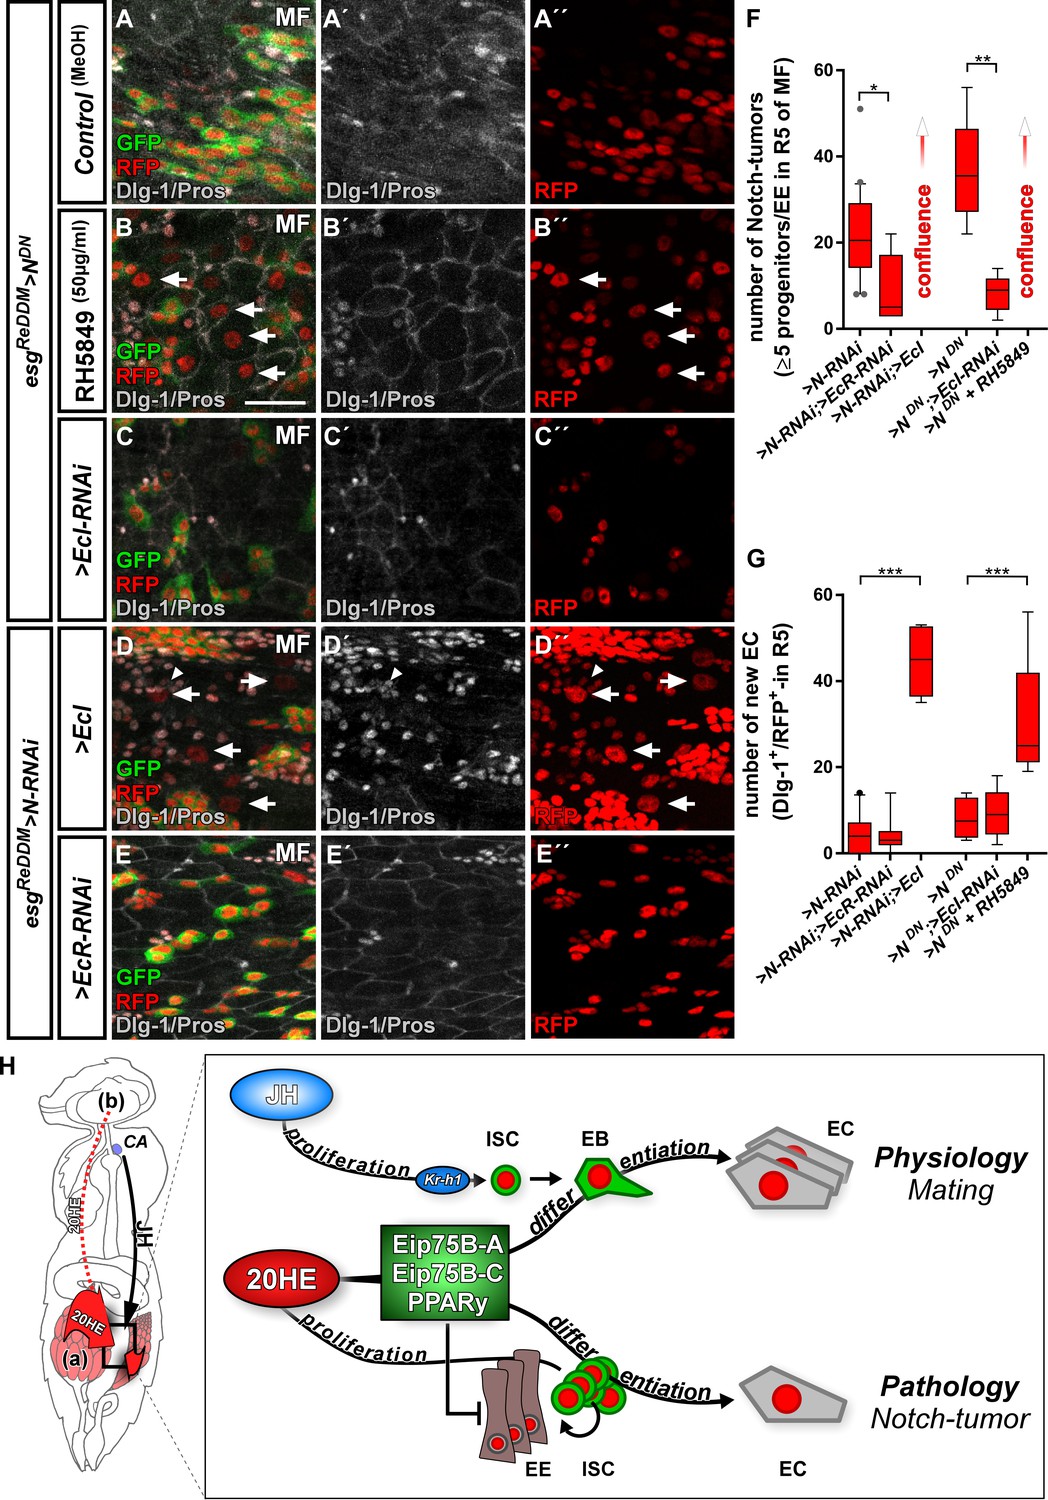
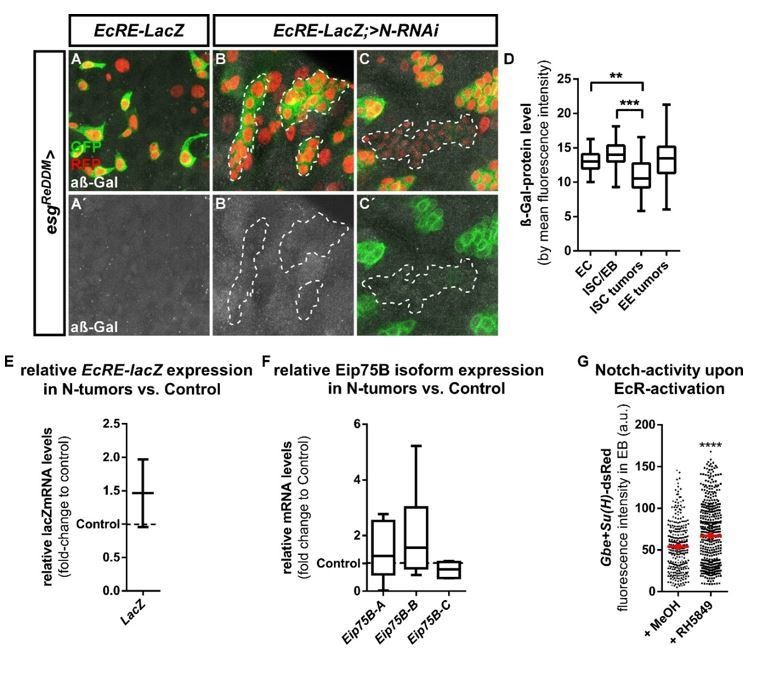
Ecdysone induced protein 75B promotes EB differentiation in a Notch tumor paradigm.
(A) Cartoon depicting cell fate changes upon N-LOF combined with esgReDDM coloring (Ohlstein and Spradling, 2006; Ohlstein and Spradling, 2007). (B) > N RNAi driven by esgReDDM leads to different tumor sizes after seven days of tracing that were classified in four classes according to size. Note, ISC-like/EE clusters up to four cells are not quantified as they occasionally occur in controls too. Progenitors are double labelled (GFP+/RFP+), where newly generated EE are identified by immunostaining for Prospero (Pros) and H2B::RFP trace from esgReDDM. (C–D) Co- expression of Eip75B isoforms > Eip75 B-A (C) and > Eip75 B-C (D) after seven days of tracing with esgReDDM > N RNAi in MF. Note additional Dlg-1+-immunoreactivity in (grey,C+D) demonstrating epithelial integration of newly generated cells as EC (Dlg-1+/RFP+). (E+E’) RNAi-mediated downregulation of Eip75B in MF shows confluent N-tumors (E) accompanied by increased mitosis (E’). (F) Quantification of ISC progeny encompassing ISC-like and EE total N-tumor number in R5 PMG (n = 10,10,10). (G–J) Feeding of the Eip75B/PPARy agonist Pioglitazone to esgReDDM > NDN flies leads to the generation of newly generated EC ((H,I), Dlg-1+/RFP+) after seven days of tracing compared to DMSO controls (G,I). (I–J) Quantification of ISC progeny encompassing ISC-like and EE total N-tumor number in R5 PMG (n = 5,5). Error bars are Standard Error of the Mean (SEM) and asterisks denote significances from one-way ANOVA with Bonferroni's Multiple Comparison Test (*p<0.05, **p<0.01; *** p$$BOX_TXT_END$$. <0,001; ****p<0.0001). Scale bars = 25 µm.
-
Figure 6—source data 1
Data from Figure 6.
Panel F,I,J experimental data.
- https://cdn.elifesciences.org/articles/55795/elife-55795-fig6-data1-v3.xlsx
Figure 6—figure supplement 1

Size distribution of different Notch-tumor classes.
(A) Quantification of ISC progeny encompassing ISC-like, EC and EE classified after tumor size (classes I to IV) in R5 PMG of esgReDDM > N RNAi (n = 10,10,10). Error bars are Standard Error of the Mean (SEM) and asterisks denote significances from one-way ANOVA with Bonferroni's Multiple Comparison Test (*p<0.05, **p<0.01; ***p<0,001; ****p<0.0001).
-
Figure 6—figure supplement 1—source data 1
Data from Figure 6—figure supplement 1.
Panel A experimental data.
- https://cdn.elifesciences.org/articles/55795/elife-55795-fig6-figsupp1-data1-v3.xlsx
Figure 7 with 1 supplement
Ecdysone signaling promotes EC-fate in a Notch tumor paradigm.
(A–E’’) Pharmacological and genetic manipulation of Ecdysone signaling. Adult PMG of MF with N-LOF (>N RNAi or > NDN) treated with MeOH as control (A–A’’) or RH5849 (B–B’’) to activate Ecdysone signaling. Arrowheads highlight newly generated Dlg-1+/RFP+-EC (B+B’’) after seven days of esgReDDM > NDN. (C–C’’) RNAi-mediated downregulation of EcI in esgReDDM > NDN, forced expression of >EcI (D–D’’) and >EcR RNAi (E–E’’) in esgReDDM > N RNAi MF after seven days of tracing. Arrowheads highlight newly generated Dlg-1+-EC (D+D’’), scale bars = 25 µm. (F) Quantification of ISC progeny encompassing ISC-like, EC and EE classified after tumor size in R5 PMG (n = 13,5,7,4,6,9). Error bars are Standard Error of the Mean (SEM) and asterisks denote significances from one-way ANOVA with Bonferroni's Multiple Comparison Test (*p<0.05, **p<0.01; ***p<0,001; ****p<0.0001). (G) Quantification of newly generated EC (Dlg-1+/RFP+) in R5 PMG (n = 13,5,7,4,6,9). Error bars are Standard Error of the Mean (SEM) and asterisks denote significances from one-way ANOVA with Bonferroni's Multiple Comparison Test (*p<0.05, **p<0.01; ***p<0,001; ****p<0.0001). (H) Model of 20HE and JH hormonal pathways influencing physiological and pathological turnover in the intestine. Upon mating, JH from the neuroendocrine CA (corpora allata, [Reiff et al., 2015]) as well as ovarian 20HE (a) synergize on progenitor cells in the posterior midgut of adult female flies. The source of 20HE could not be definitely determined in this current study and 20HE might as well stem from the brain (b). JH induces ISC proliferation through Kr-h1, whereas 20HE signaling transduced by Eip75B-A /- C/PPARγ, ensures that newly produced EB differentiate into EC. New EC lead to a net increase in absorptive epithelium and thus ensures physiological adaptation of intestinal size to the new metabolic energy requirements of pregnancy. In the adult intestine, early steps of tumor-pathology are recapitulated when EC fate is inhibited by the lack of Notch signaling in progenitors (Patel et al., 2015). Notch mutant ISC divisions only produces ISC-like progenitors and EE. We show in this study that 20HE signaling, through Eip75B-A /- C/PPARγ, is capable to alleviate Notch tumor growth by driving intestinal progenitors into post-mitotic absorptive EC fate.
-
Figure 7—source data 1
Data from Figure 7.
Panel F,G experimental data.
- https://cdn.elifesciences.org/articles/55795/elife-55795-fig7-data1-v3.xlsx
Figure 7—figure supplement 1
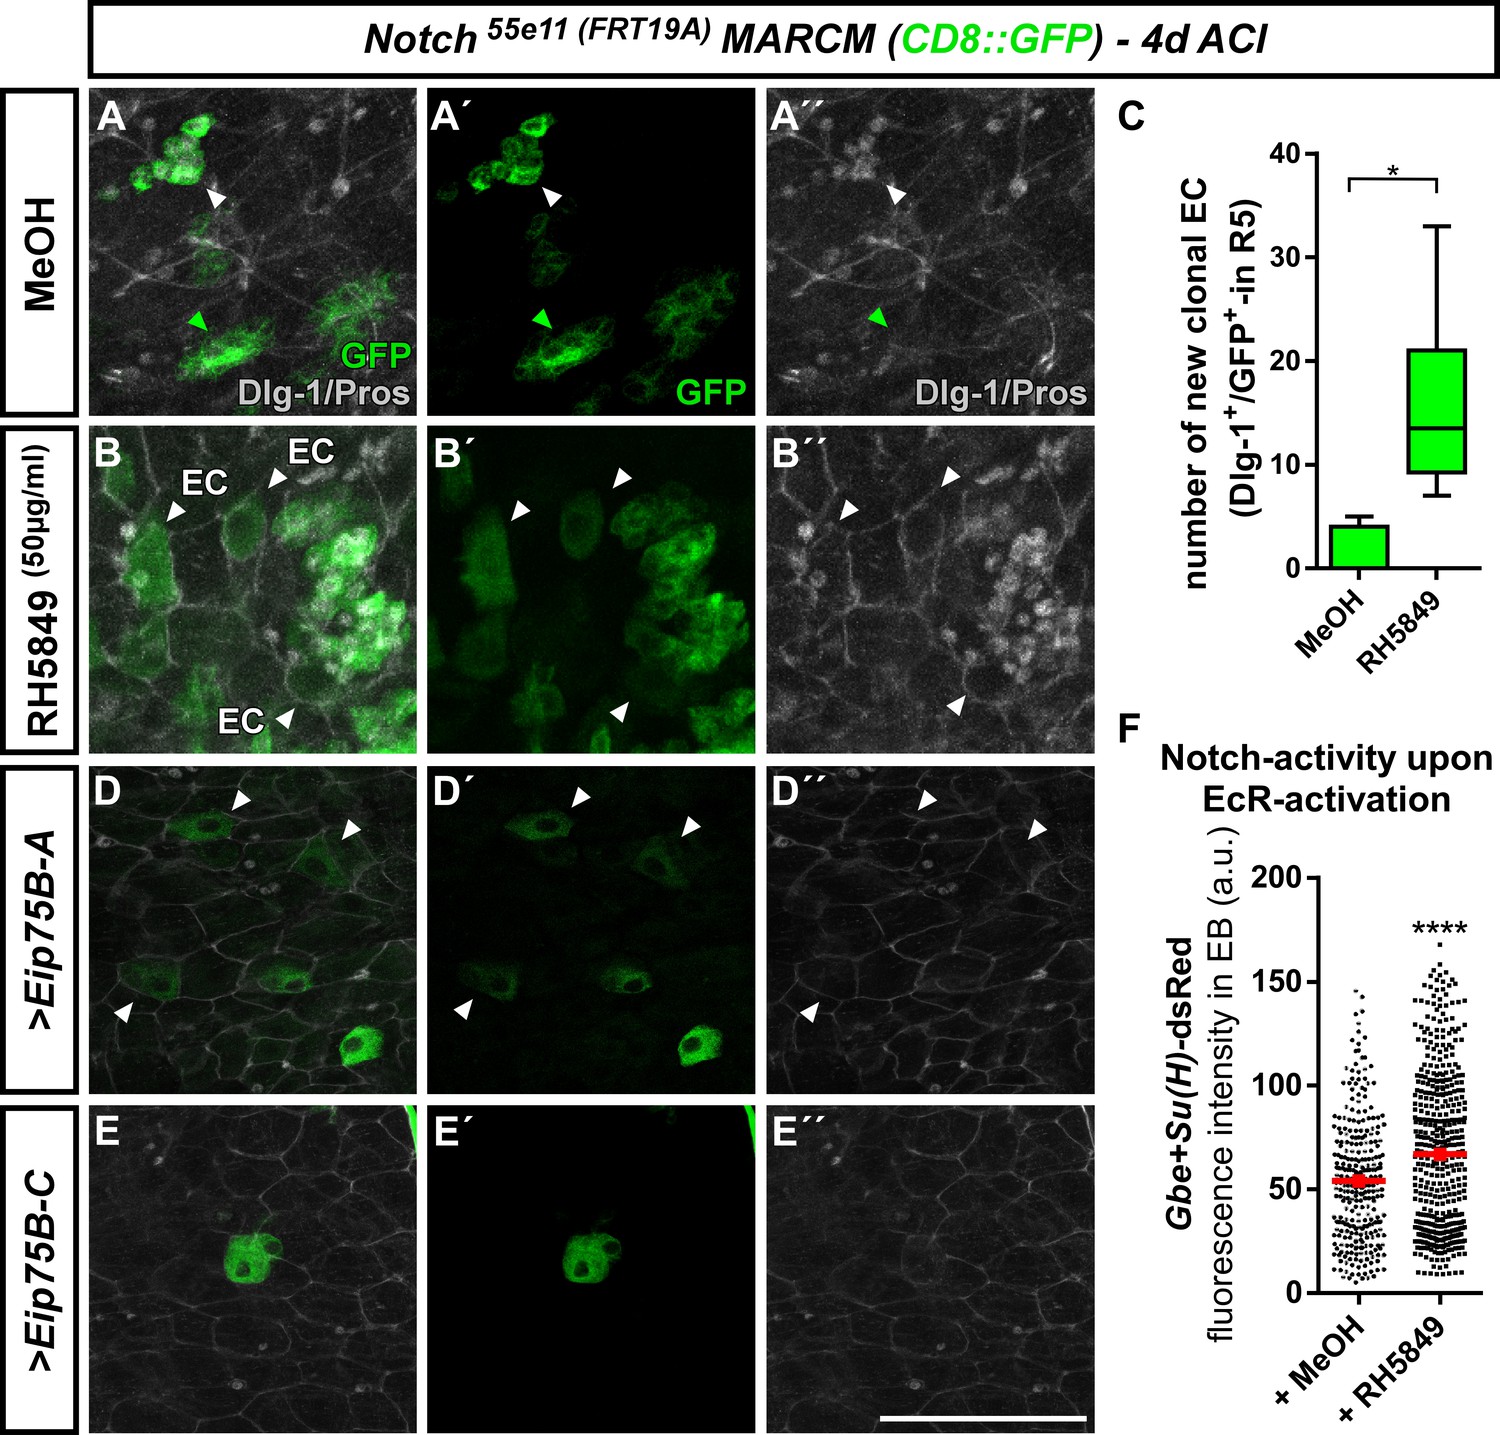
Analysis of Notch mutant MARCM clones and consequences of clonal EcR-activation.
(A–E’’) Representative images of MARCM clones for the Notch receptor (N55e11) in MF PMG four days after clone induction (ACI) counterstained with Dlg-1 and Pros antibodies. Control Notch clones (MeOH) contain GFP-labelled clones containing ISC-like cells (GFP-only, green arrowheads) or EE (small GFP+ diploid nuclei/Pros+, white arrowheads). Notch null mutant clones (B–B’’) treated with RH5849 contain differentiated EC in adjacent to Notch tumors (Dlg1+/GFP+) arrowheads). (C) Quantification of GFP-labelled EC in Notch MARCM clones in R5 PMG (n = 7,6). Error bars are Standard Error of the Mean (SEM) and asterisks denote significances from unpaired Student´s t-test (*p<0.05, p=0,0129). (D+E) Forced expression of > Eip75 B-A (D) and > Eip75 B-C (E) leads to the immediate formation of single cell clones that immediately differentiated into EC (arrowheads). (F) Notch activity addressed by Gbe-SuH activity fluorescence activity in RH5849 fed flies vs. control flies (>250 EB in n > 3 midguts, Error bars are Standard Error of the Mean (SEM) and asterisks denote significances from unpaired Student´s t-test (****p<0.001). Scale bars = 100 µm.
-
Figure 7—figure supplement 1—source data 1
Data from Figure 7—figure supplement 1.
Panel C,G experimental data.
- https://cdn.elifesciences.org/articles/55795/elife-55795-fig7-figsupp1-data1-v3.xlsx
Author response image 1
Author response image 2
Author response image 3
Tables
Key resources table
| Reagent type (species) or resource | Designation | Source or reference | Identifiers | Additional information |
|---|---|---|---|---|
| Genetic reagent (Drosophila melanogaster) | esgReDDM | Antonello et al., 2015a DOI: 10.15252/embj.201591517 | Figures 1–7; Figure 1—figure supplement 1; Figure 3—figure supplement 1 | |
| Genetic reagent (D. melanogaster) | esgReDDM > Eip75B-A | Rabinovich et al., 2016 DOI: 10.1016/j.cell.2015.11.047 | Figure 3; Figure 3—figure supplement 1 | |
| Genetic reagent (D. melanogaster) | esgReDDM > Eip75B-B | Rabinovich et al., 2016 DOI: 10.1016/j.cell.2015.11.047 | Figure 3; Figure 3—figure supplement 1 | |
| Genetic reagent (D. melanogaster) | esgReDDM > Eip75B-C | Rabinovich et al., 2016 DOI: 10.1016/j.cell.2015.11.047 | Figure 3; Figure 3—figure supplement 1 | |
| Genetic reagent (D. melanogaster) | Srebp > CD8::GFP | Reiff et al., 2015 DOI: 10.7554/eLife.06930 | Figure 2—figure supplement 1 | |
| Genetic reagent (D. melanogaster) | Mex > ts | Phillips and Thomas, 2006 DOI: 10.1242/jcs.02839 | Figure 2—figure supplement 1 | |
| Genetic reagent (D. melanogaster) | MARCM (FRT2A) | Lee and Luo, 1999 DOI: 10.1016/S0896-6273 (00)80701–1 | Figure 3—figure supplement 1 | |
| Genetic reagent (D. melanogaster) | Eip75A81-MARCM (FRT2A) | Rabinovich et al., 2016 DOI: 10.1016/j.cell.2015.11.047 | Figure 3—figure supplement 1 | |
| Genetic reagent (D. melanogaster) | kluReDDM | Reiff et al., 2019 DOI: 10.15252/embj.2018101346 | Figure 3—figure supplement 2 | |
| Genetic reagent (D. melanogaster) | N55e11-MARCM (FRT19A) | Guo and Ohlstein, 2015 DOI: 10.1126/science.aab0988 | Figure 7—figure supplement 1 | |
| Chemical compund, drug | RH5849 | DrEhrenstorfer | DRE-C16813000 | 340 µM final concentration |
| Chemical compund, drug | Pioglitazone | Sigma-Aldrich | Sigma-Aldrich 112529-15-4 | 14 µM final concentration |
Additional files
Download links
A two-part list of links to download the article, or parts of the article, in various formats.
Downloads (link to download the article as PDF)
Open citations (links to open the citations from this article in various online reference manager services)
Cite this article (links to download the citations from this article in formats compatible with various reference manager tools)
Ecdysone steroid hormone remote controls intestinal stem cell fate decisions via the PPARγ-homolog Eip75B in Drosophila
eLife 9:e55795.
https://doi.org/10.7554/eLife.55795


