Sepsis impedes EAE disease development and diminishes autoantigen-specific naive CD4 T cells
- Interdisciplinary Graduate Program in Immunology, University of Iowa, United States
- Microbiology, Immunology, and Cancer Biology PhD Program, University of Minnesota, United States
- Department of Pathology, University of Iowa, Holden Comprehensive Cancer Center, University of Iowa Hospitals and Clinics, United States
- Department of Microbiology and Immunology, University of Minnesota, Center for Immunology, United States
- Microbiology, Immunology, and Cancer Biology PhD Program, Department of Urology, Center for Immunology, Minneapolis VA Health Care System, University of Minnesota, United States
- Interdisciplinary Graduate Program in Immunology, Department of Pathology, University of Iowa, United States
- Interdisciplinary Graduate Program in Immunology, Department of Pathology, Department of Microbiology and Immunology, University of Iowa, United States
Figures
Figure 1 with 3 supplements
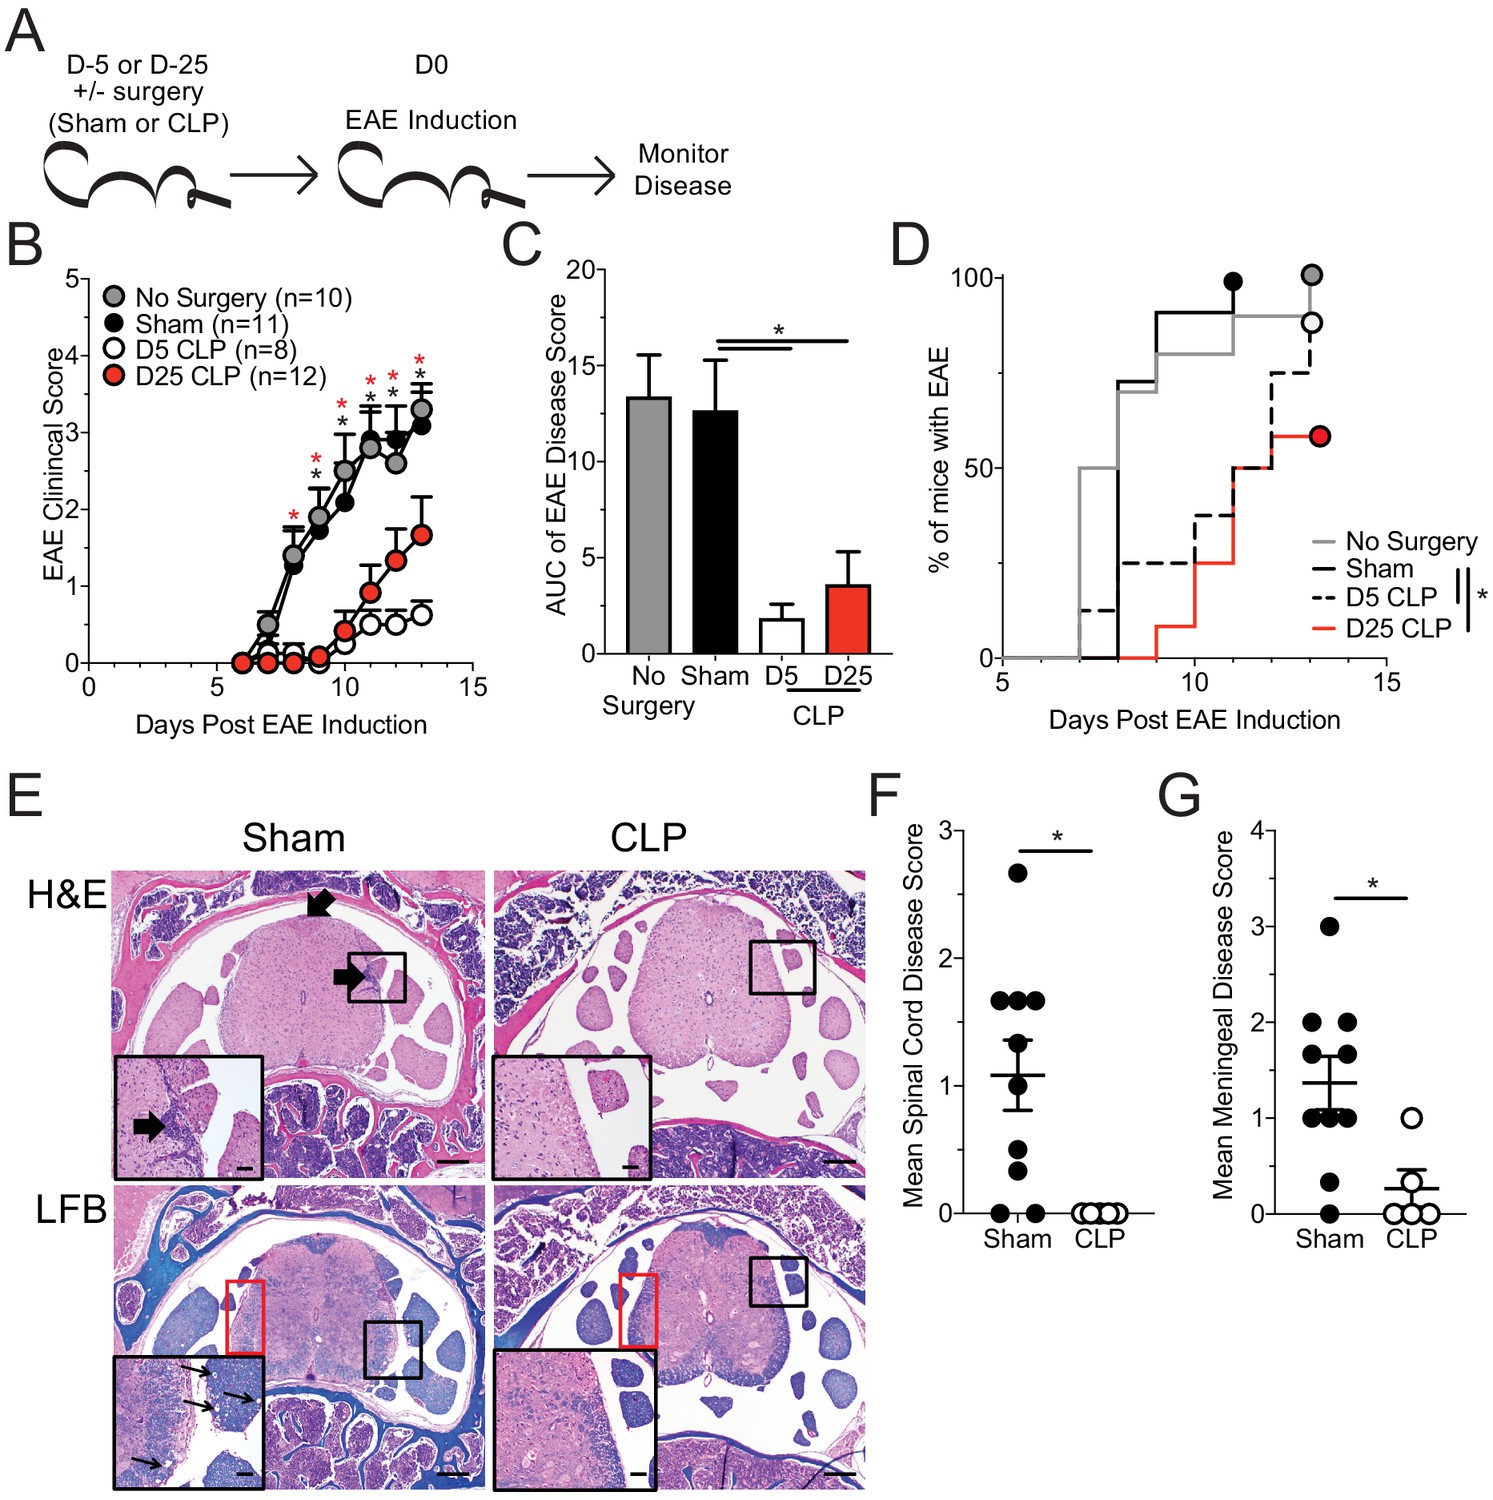
Sepsis ablates EAE disease and reduces CNS pathology.
(A) Experimental design: C57Bl/6 mice were either left naive or underwent sham or CLP surgery. All groups were immunized s.c. with MOG35-55 emulsified in complete Freunds adjuvant (CFA) on both flanks 5 days after surgery and given pertussis toxin (PTX) i.p. on the day of immunization as well as 2 days later to induce EAE. An additional group of mice that underwent CLP 25 days prior were also immunized on the same day. Disease onset and severity were monitored over the subsequent 14 days. (B) Average EAE disease score following EAE induction for mice that had either no surgery (gray), Sham surgery (black), D5 CLP surgery (white), or D25 CLP surgery (red). (C) Area under the curve (AUC) of disease scores in panel B following EAE induction. (D) Time to onset of first EAE symptoms following EAE induction in no surgery (gray), Sham surgery (black), D5 CLP surgery (dashed), and D25 CLP (red) mouse groups. (E) Representative photomicrographs of the lumbar spine from mice with EAE that underwent either sham or D5 CLP surgery. Thick arrows indicate areas of inflammation that was scored on H and E stained slides. Luxol fast blue (LFB) stains were also performed and showed subtle demyelination and axonal sheath swelling in sham mice (red box). Vacuolation is indicated in the inserts by the thin arrows. Bars = 200 µm (inset bars = 50 µm). Mean H and E inflammation score of the (F) spinal cord and (G) meninges of mice 15 days-post EAE induction. Data are representative from three independent experiments with 8–12 mice per group. D25 CLP data are from a single experiment. *p<0.05. Error bars represent the standard error of the mean.
-
Figure 1—source data 1
Source data for Figure 1B–D.
- https://cdn.elifesciences.org/articles/55800/elife-55800-fig1-data1-v2.xlsx
-
Figure 1—source data 2
Source data for Figure 1E.
- https://cdn.elifesciences.org/articles/55800/elife-55800-fig1-data2-v2.pptx
-
Figure 1—source data 3
Source data for Figure 1F,G.
- https://cdn.elifesciences.org/articles/55800/elife-55800-fig1-data3-v2.xlsx
Figure 1—figure supplement 1
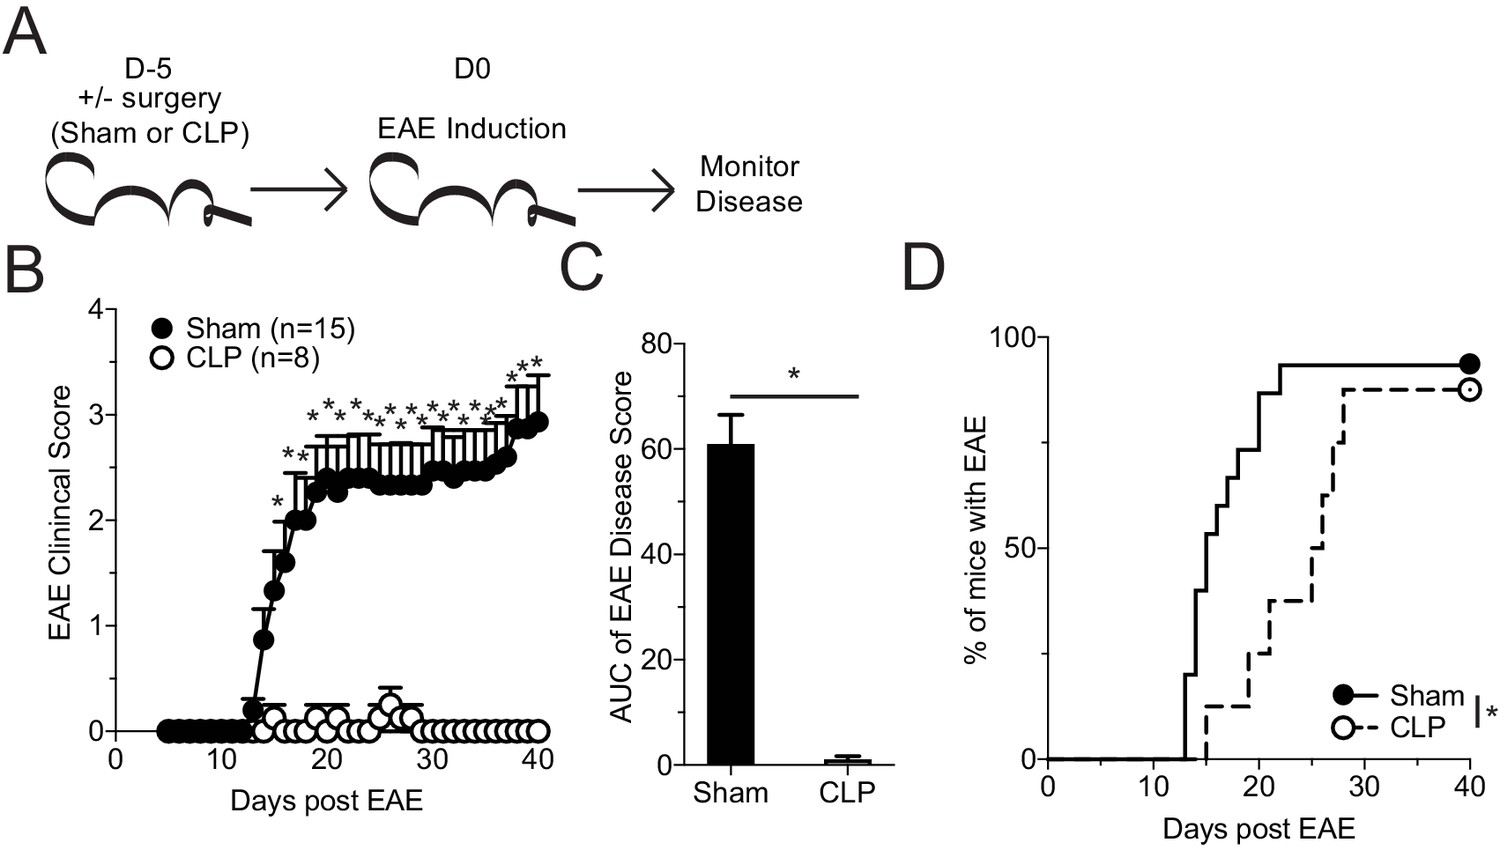
Sepsis ablates EAE disease and reduces CNS pathology.
(A) Experimental design: C57Bl/6 mice were either left naive or underwent sham or CLP surgery. Both groups were immunized s.c. with MOG35-55 emulsified in complete Freunds adjuvant (CFA) on both flanks 5 days after surgery and given pertussis toxin (PTX) i.p. on the day of immunization as well as 2 days later to induce EAE. Disease onset and severity were monitored over the subsequent 40 days. (B) Average EAE disease score following EAE induction for mice that had either Sham surgery (black) or CLP surgery (white). (C) Area under the curve (AUC) of disease scores in panel B following EAE induction. (D) Time to onset of first EAE symptoms following EAE induction in Sham surgery (black) or CLP surgery (dashed) groups. Data are representative from two independent experiments with 8–15 mice per group. *p<0.05. Error bars represent the standard error of the mean.
-
Figure 1—figure supplement 1—source data 1
Source data for Figure 1—figure supplement 1.
- https://cdn.elifesciences.org/articles/55800/elife-55800-fig1-figsupp1-data1-v2.xlsx
Figure 1—figure supplement 2

Altered systemic cytokine response to EAE immunization in septic mice.
Sham and CLP mice were immunized s.c. with MOG35-55 emulsified in complete Freunds adjuvant (CFA) on both flanks 5 days after surgery and given pertussis toxin (PTX) i.p. on the day of immunization as well as 2 days later to induce EAE. Plasma was collected prior to immunization and 15 days post-immunization. Plasma cytokine response was assessed by multiplex cytokine assay. (A) Heatmap comparing day 0 to day 15 post-immunization mean z-scores of plasma cytokines for sham and CLP mice. Plasma (B) IFNγ, (C) IL-17, (D) TNF, (E) IL-10, (F) IL-12p70, (G) IL-12p40, (H) G-CSF, and (I) GM-CSF concentrations for sham and CLP hosts at days 0 and 15 post-immunization. Data are from one experiment with 9–10 mice per group. *p<0.05. Error bars represent the standard error of the mean. Heatmap comparisons are made by multiple t tests.
-
Figure 1—figure supplement 2—source data 1
Source data for Figure 1—figure supplement 2.
- https://cdn.elifesciences.org/articles/55800/elife-55800-fig1-figsupp2-data1-v2.xlsx
Figure 1—figure supplement 3
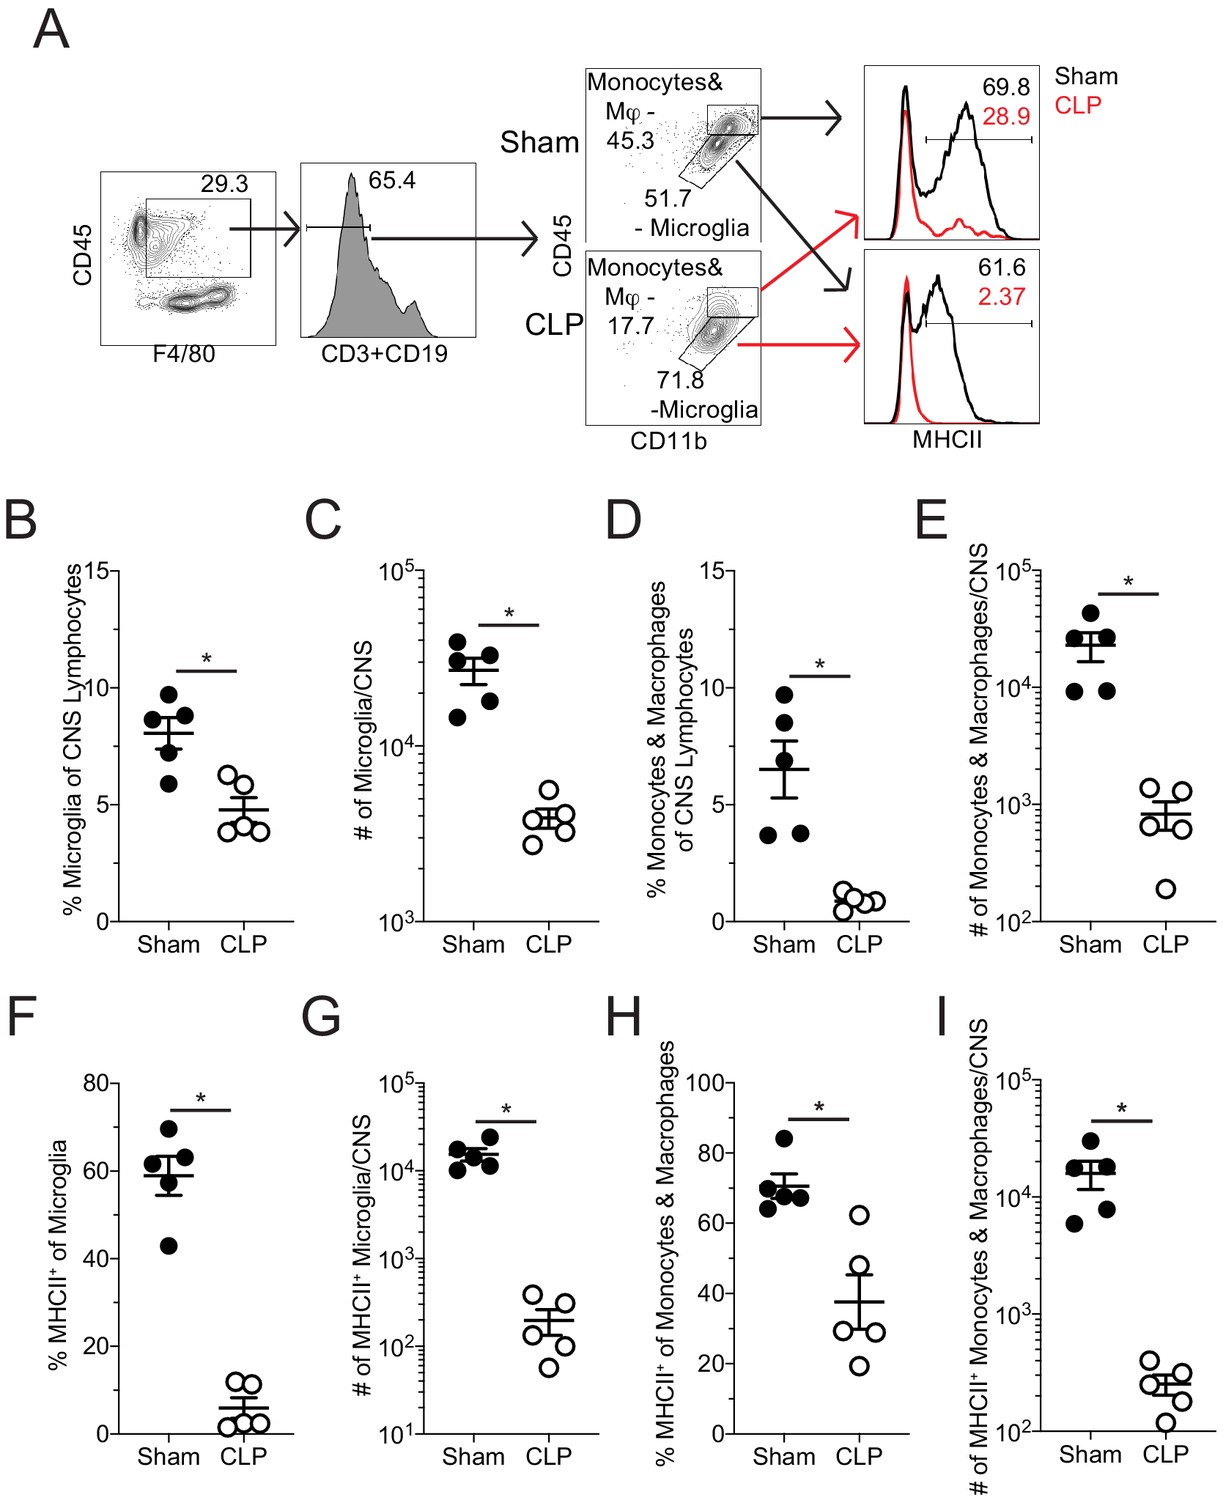
Reduced representation and number of activated microglia, monocytes, and macrophages in the CNS of CLP mice following EAE immunization.
Sham and CLP mice were immunized s.c. with MOG35-55 emulsified in complete Freunds adjuvant (CFA) on both flanks 5 days after surgery and given pertussis toxin (PTX) i.p. on the day of immunization as well as 2 days later to induce EAE. Mice were perfused 15 days post-EAE induction and CNS was harvested. (A) Representative gating of CNS monocytes/macrophages and microglia as well as expression of MHCII by gated cells. Frequency (B) and number (C) of microglia in the CNS. Frequency (D) and number (E) of monocytes and macrophages in the CNS. Frequency (F) and number (G) of MHCII-expressing microglia in the CNS. Frequency (H) and number (I) of MHCII-expressing monocytes and macrophages in the CNS. Data are from one experiment with five mice per group. *p<0.05. Error bars represent the standard error of the mean.
-
Figure 1—figure supplement 3—source data 1
Source data for Figure 1—figure supplement 2.
- https://cdn.elifesciences.org/articles/55800/elife-55800-fig1-figsupp3-data1-v2.xlsx
Figure 2
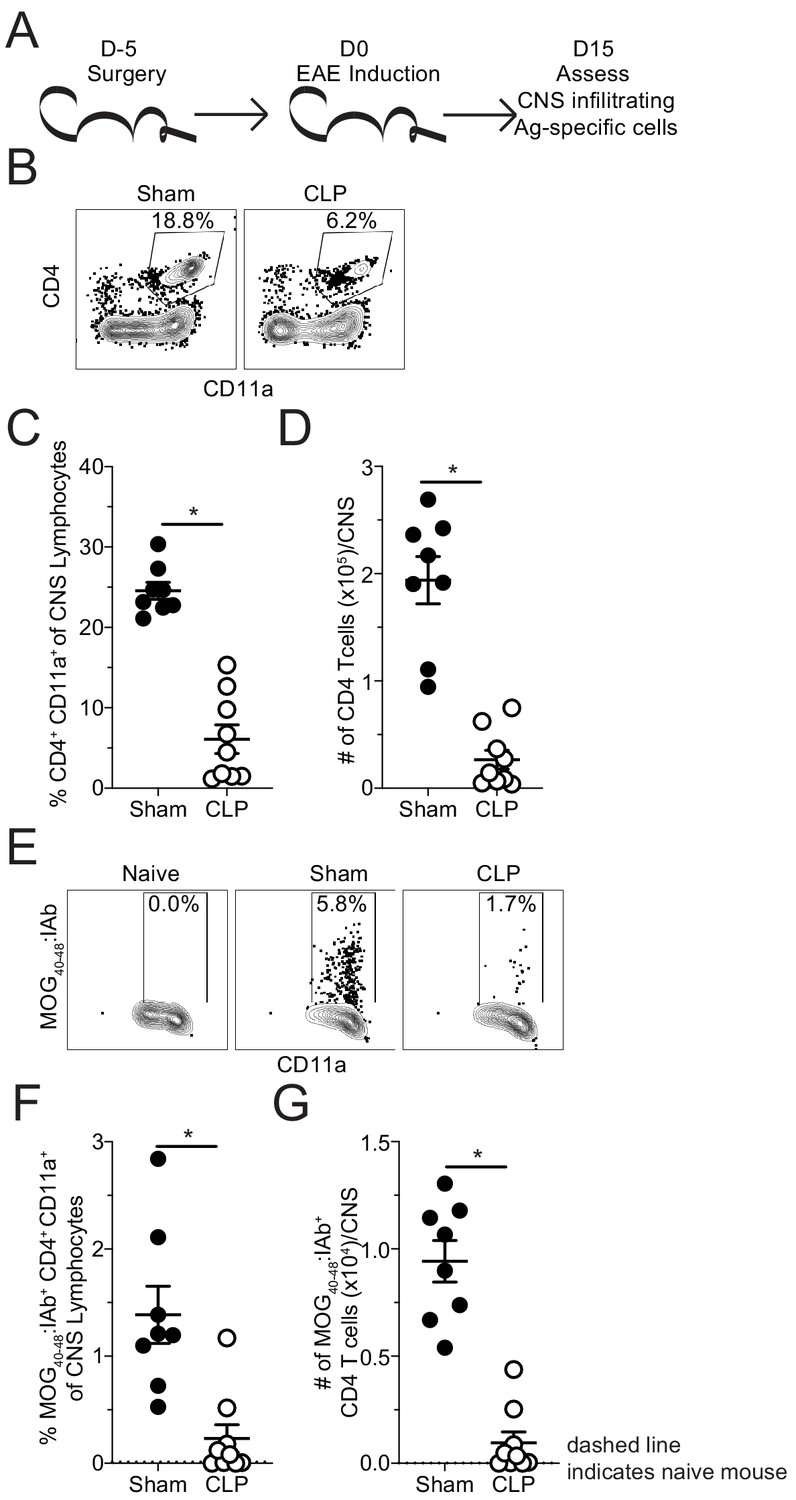
Fewer MOG-specific CD4 T cells are present in the CNS of CLP mice.
(A) Experimental design: C57Bl/6 mice underwent either sham or CLP surgery. EAE induction occurred 5 days after surgery. Mice were perfused 15 days post-EAE induction and CNS was harvested. (B) Representative flow plots for CNS CD4 T cells, gated on lymphocytes, from sham and CLP mice. (C) Frequency and (D) number of CNS CD4 T cells in sham and CLP mice. (E) Representative flow plots for CNS MOG-specific CD4 T cells, gated on total CD4 T cells, from Naive (staining control), sham, and CLP mice. (F) Frequency and (G) number of CNS MOG-specific CD4 T cells in sham and CLP mice. Dashed line indicates staining and number from naive control mouse. Data are representative from two independent experiments with 8–10 mice per group. *p<0.05. Error bars represent the standard error of the mean.
-
Figure 2—source data 1
Source data for Figure 2.
- https://cdn.elifesciences.org/articles/55800/elife-55800-fig2-data1-v2.xlsx
Figure 3 with 1 supplement
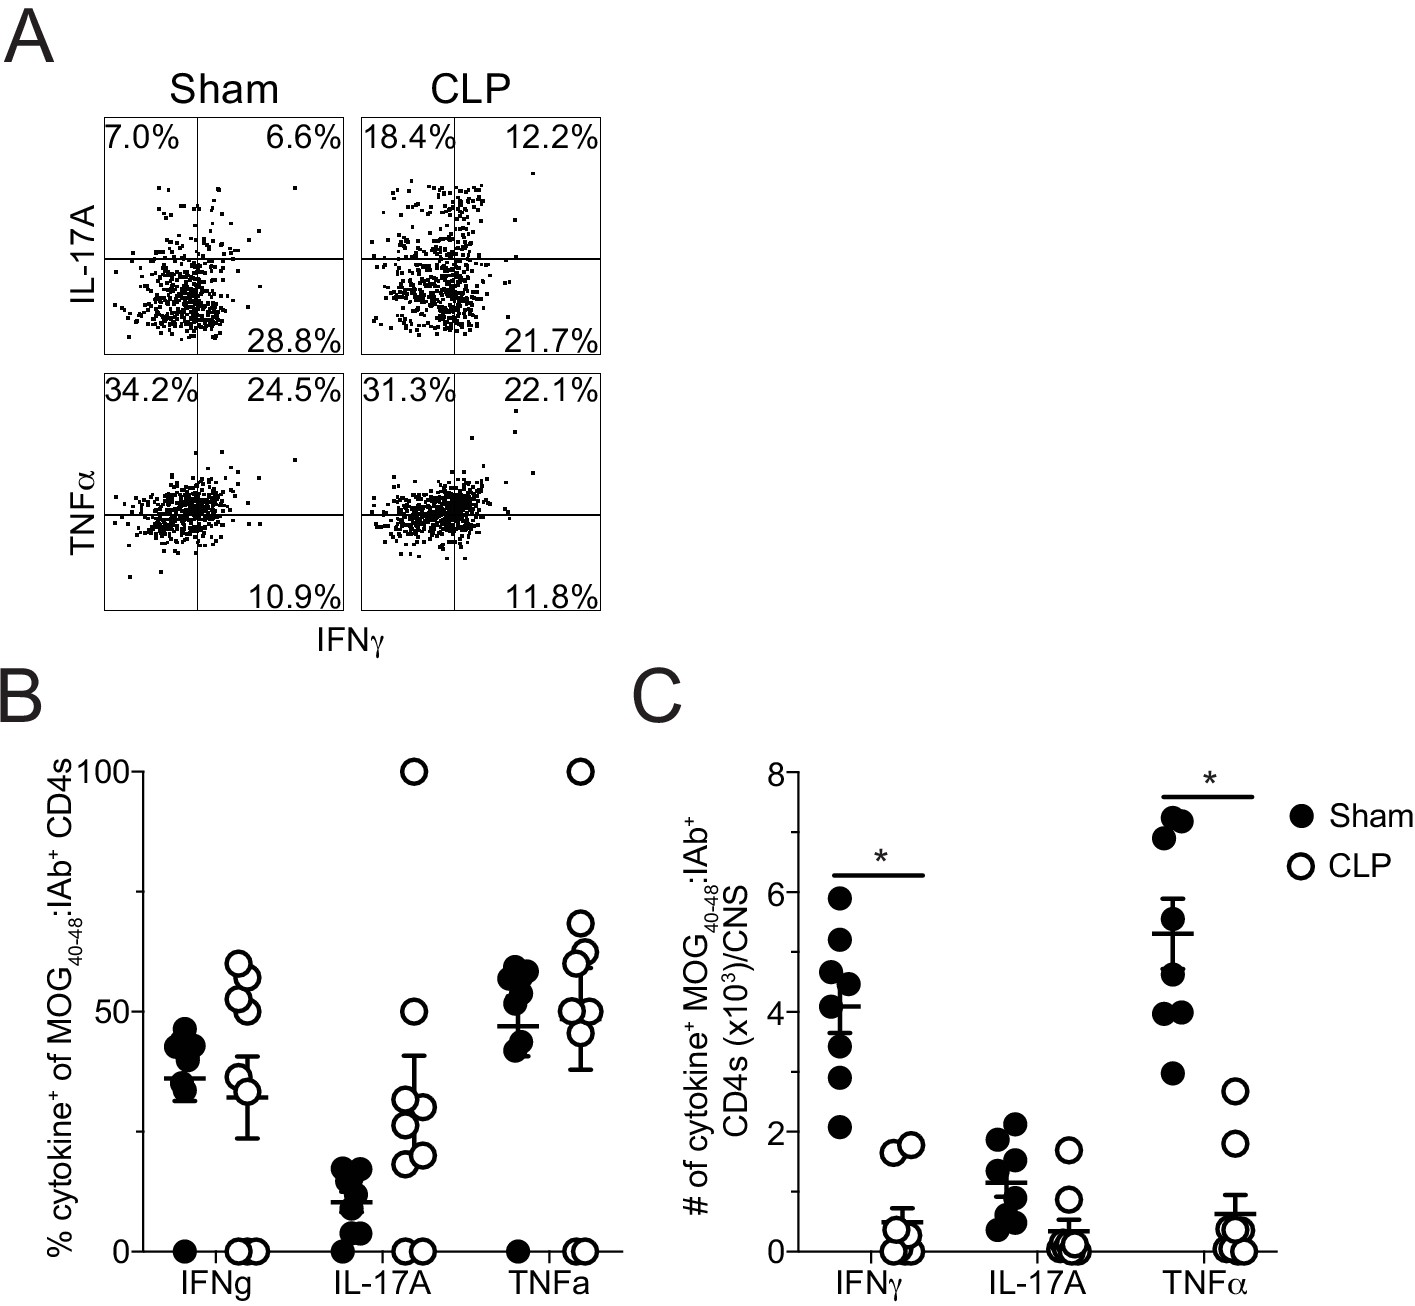
Sepsis reduces the number of cytokine-producing MOG-specific CD4 T cells in the CNS.
(A ) Representative flow plots of direct ex vivo IFNγ, IL-17A, and TNFα producing cells, gated on MOG-specific CD4 T cells, from sham (left) and CLP (right) mice. Numbers indicate frequency of cytokine-positive cells per quadrant. (B) Frequency and (C) number of IFNγ-, IL-17A-, and TNFα-producing MOG-specific CD4 T cells in the CNS of sham and CLP mice. Data are representative from two independent experiments with 8–10 mice per group. *p<0.05. Error bars represent the standard error of the mean.
-
Figure 3—source data 1
Source data for Figure 3.
- https://cdn.elifesciences.org/articles/55800/elife-55800-fig3-data1-v2.xlsx
Figure 3—figure supplement 1
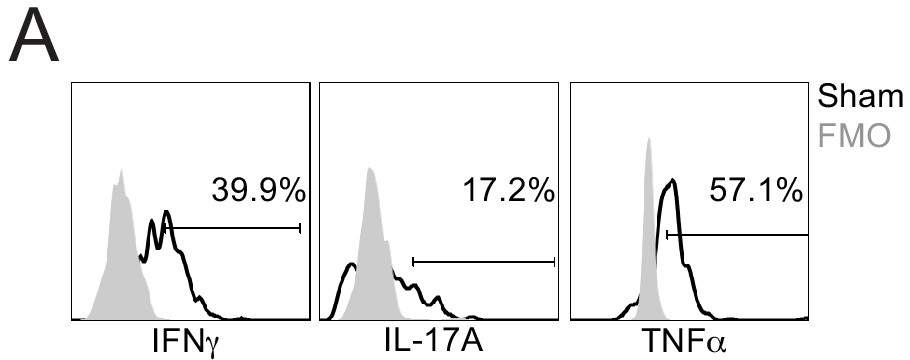
FMO controls for direct ex vivo cytokine staining.
(A) Representative flow plots of direct ex vivo IFNγ, IL-17A, and TNFα producing cells, gated on MOG-specific CD4 T cells, from sham (black) mice. Gray profiles indicate ‘fluorescence minus one’ (FMO) controls for each respective cytokine. Numbers indicate frequency of cytokine-positive cells for sham cells.
Figure 4
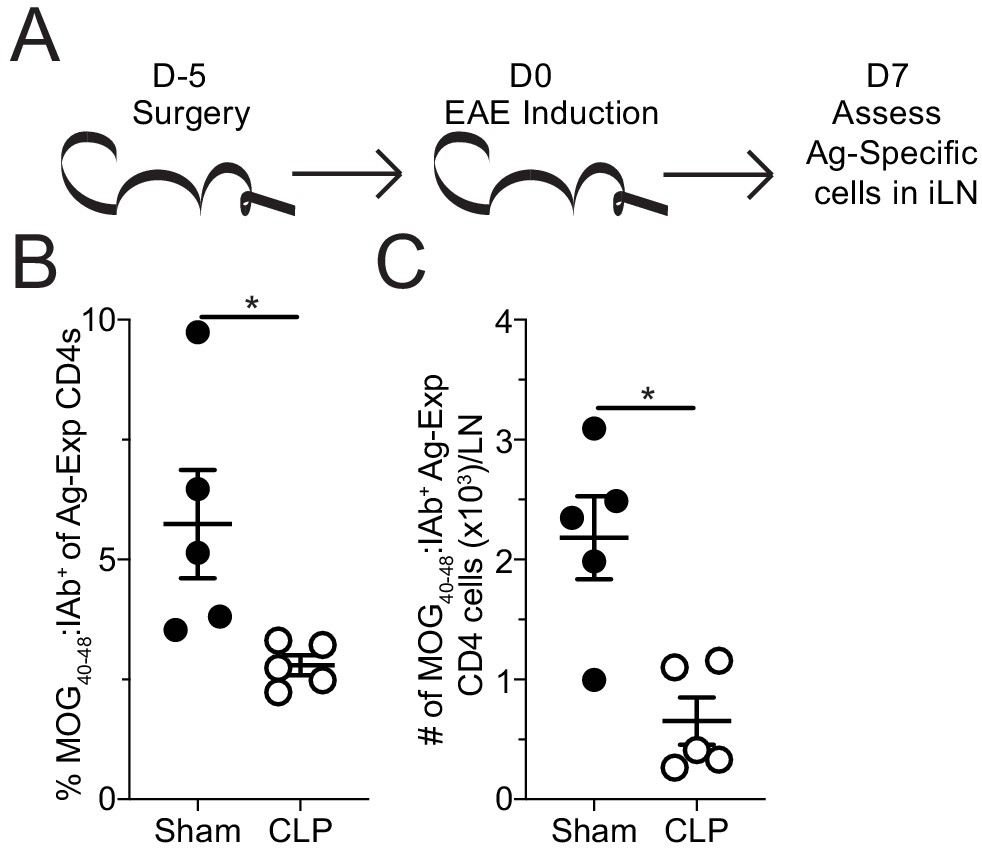
Sepsis reduces the number MOG-specific CD4 T cells present in sites of T cell priming following EAE induction.
(A) Experimental design: C57Bl/6 mice underwent sham or CLP surgery. EAE induction occurred 5 days after surgery. Draining inguinal lymph nodes (iLN) were harvested 7 days after EAE disease induction. (B) Frequency and (C) number of MOG-specific CD4 T cells in the iLN of sham and CLP mice. Data are representative from three independent experiments with five mice per group. *p<0.05. Error bars represent the standard error of the mean.
-
Figure 4—source data 1
Source data for Figure 4.
- https://cdn.elifesciences.org/articles/55800/elife-55800-fig4-data1-v2.xlsx
Figure 5

Sepsis reduces the number of naive MOG-specific CD4 T cell precursors.
(A) Experimental design: C57Bl/6 mice underwent sham or CLP surgery. MOG-specific CD4 T cell precursors were enriched from the spleen 5 days after surgery via tetramer pulldown and enumerated. (B) Representative gating strategy for identifying MOG-specific CD4 T cell precursors from sham and CLP mice. Number of splenic MOG-specific CD4 T cell precursors in sham and CLP mice (B) 5 and (C) 25 days post-surgery. Frequency of antigen-experienced (CD44hi) (E) total and (F) MOG-specific CD4 T cells. Data are combined from two independent experiments with 8–13 mice per group. *p<0.05. Error bars represent the standard error of the mean.
-
Figure 5—source data 1
Source data for Figure 5.
- https://cdn.elifesciences.org/articles/55800/elife-55800-fig5-data1-v2.xlsx
Figure 6 with 2 supplements
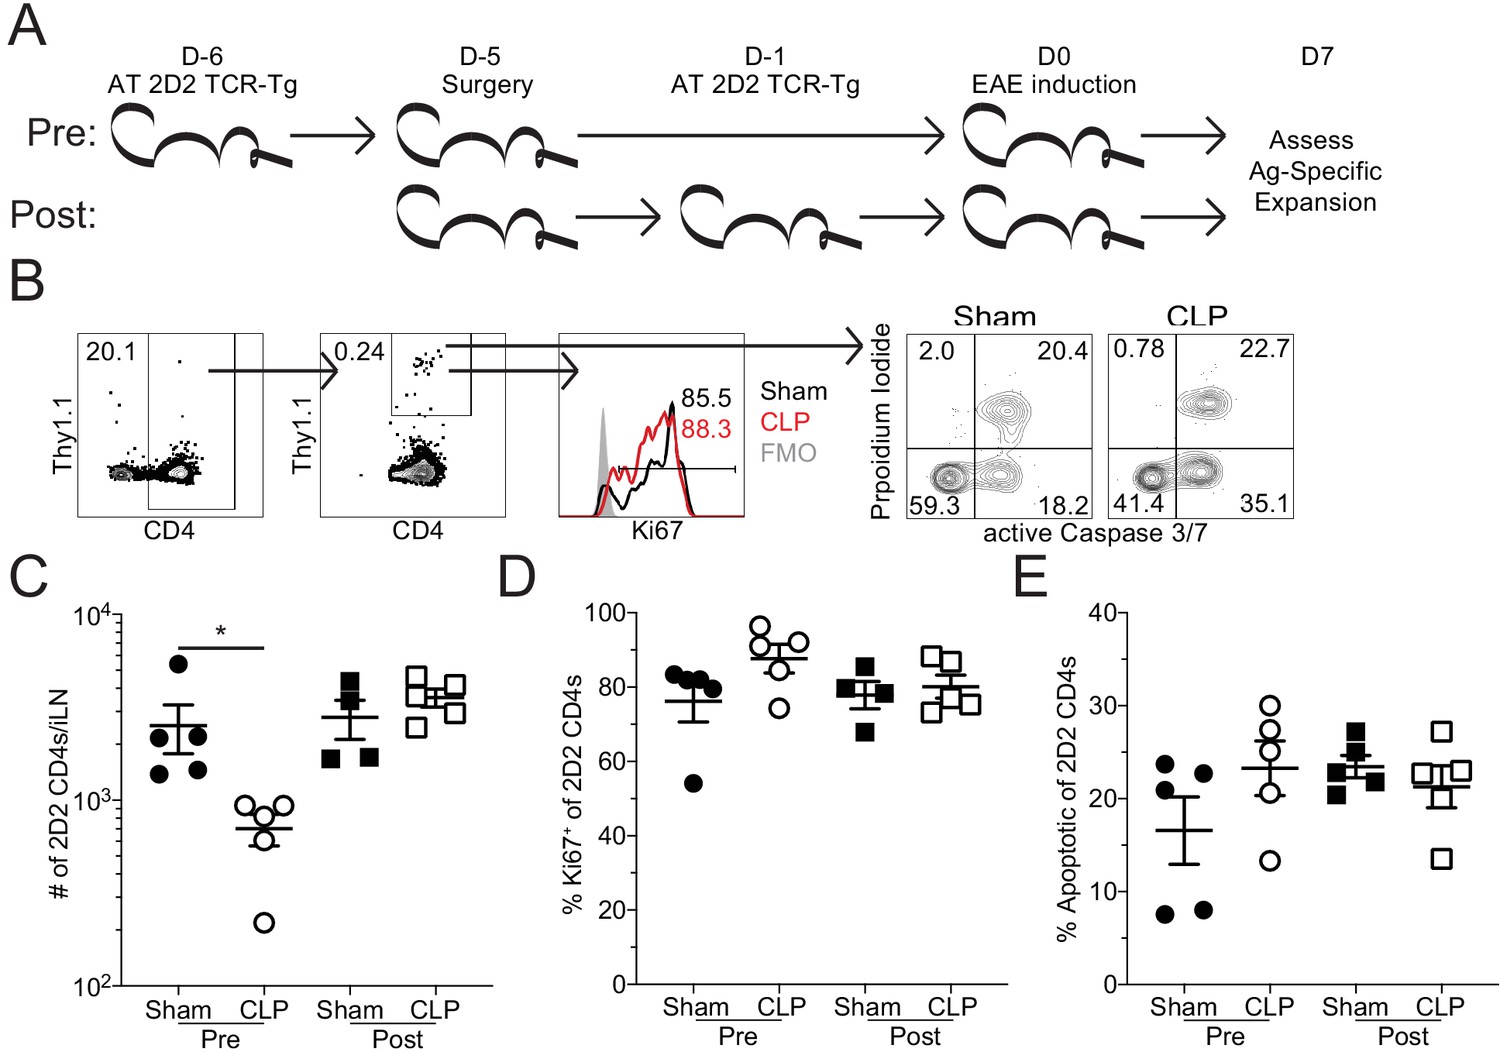
Sepsis reduces the number of MOG-specific CD4 T cells but not their capacity to proliferate.
(A) Experimental design: Thy1.2 C57Bl/6 mice were separated into Pre- and Post-transfer groups. The Pre-transfer group received 5 × 10³ naive Thy1.1 2D2 TCR-Tg CD4 T cells 1 day before sham or CLP surgery. The Post-transfer group underwent sham or CLP surgery then received 5 × 10³ naive Thy1.1 2D2 TCR-Tg CD4 T cells 4 days later. EAE was induced in both the Pre- and Post-transfer groups 5 days after surgery (Pre: 6 days post 2D2 T cell transfer; Post: 1 day post 2D2 T cell transfer). iLN were harvested 7 days after the transfer. (B) Representative gating strategy for identifying transferred 2D2 TCR-Tg CD4 T cells, their expression of the proliferation marker Ki67, and markers of apoptosis (activated caspase3/7 with propidium iodide) from sham and CLP mice. (C) Number of transferred 2D2 TCR-Tg CD4 T cells in the iLN of sham and CLP mice. (D) Frequency of 2D2 TCR-Tg CD4 T cells expressing Ki67. (D) Frequency of apoptotic (FLICA+ PI+) 2D2 TCR-Tg CD4 T cells. Data are representative from two independent experiments with four to five mice per group. *p<0.05. Error bars represent the standard error of the mean.
-
Figure 6—source data 1
Source data for Figure 6B–D.
- https://cdn.elifesciences.org/articles/55800/elife-55800-fig6-data1-v2.xlsx
-
Figure 6—source data 2
Source data for Figure 6B,E.
- https://cdn.elifesciences.org/articles/55800/elife-55800-fig6-data2-v2.xlsx
Figure 6—figure supplement 1
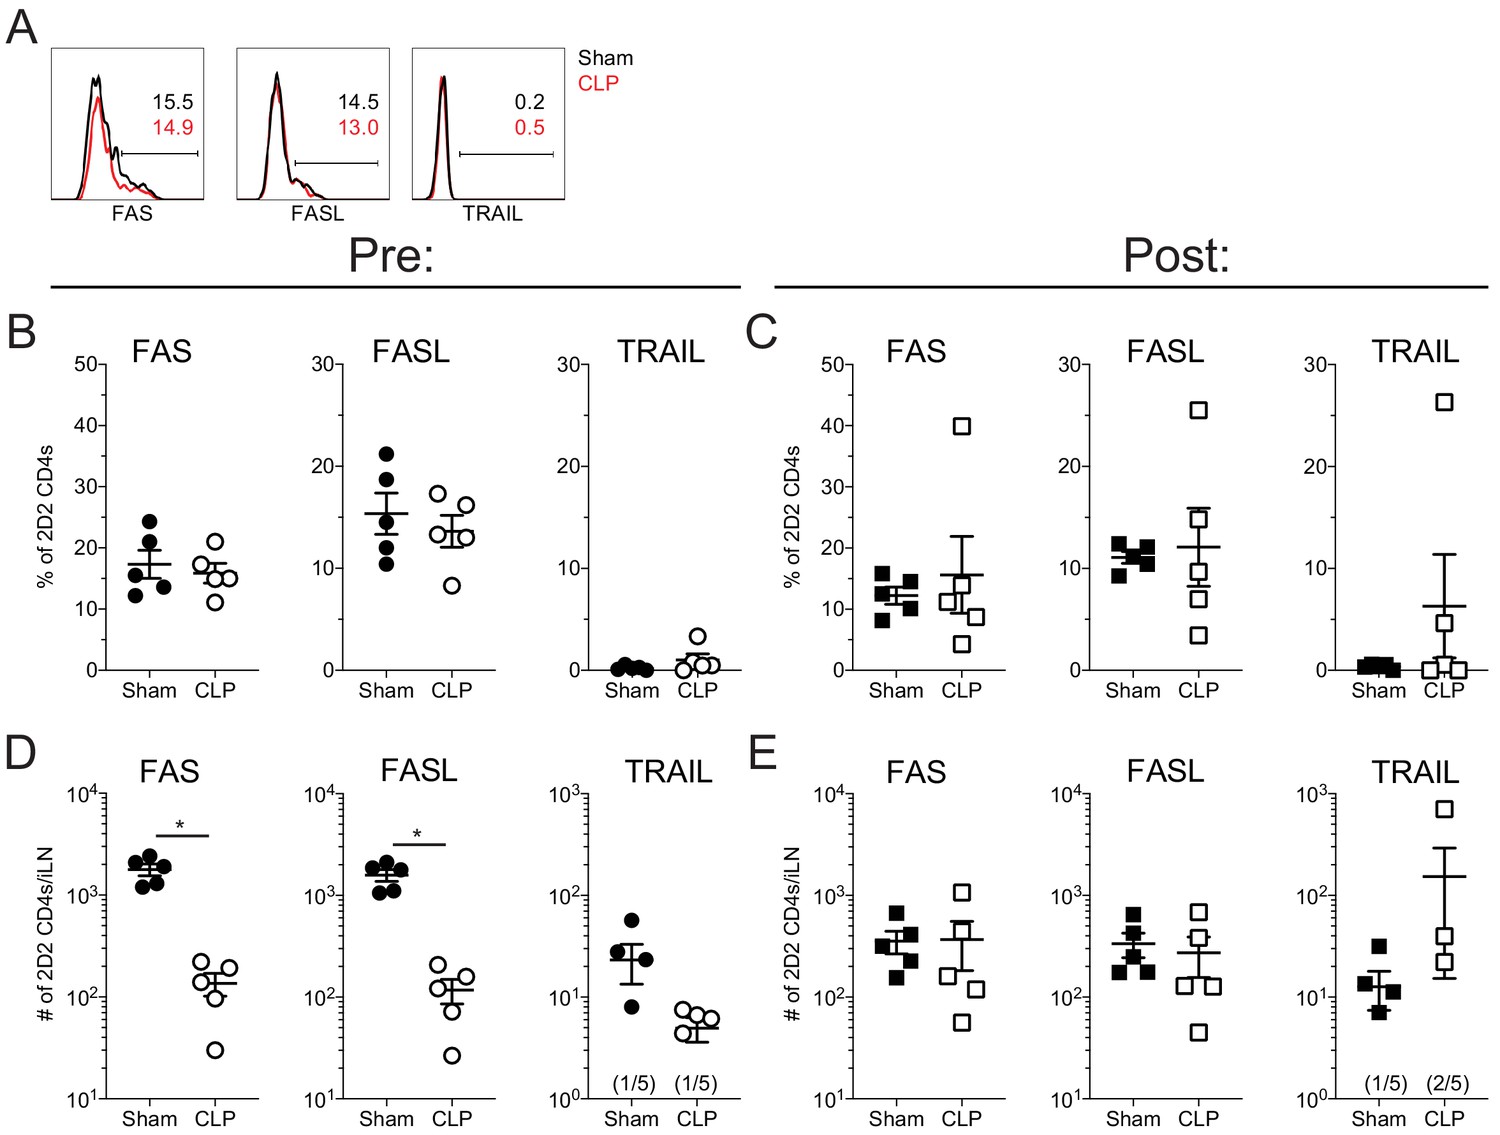
Sepsis does not influence the expression of Fas, FasL, and TRAIL by autoantigen-specific T cells.
Thy1.2 C57Bl/6 mice were separated into Pre- and Post-transfer groups. The Pre-transfer group received 5 × 10³ naive Thy1.1 2D2 TCR-Tg CD4 T cells 1 day before sham or CLP surgery. The Post-transfer group underwent sham or CLP surgery then received 5 × 10³ naive Thy1.1 2D2 TCR-Tg CD4 T cells 4 days later. EAE was induced in both the Pre- and Post-transfer groups 5 days after surgery (Pre: 6 days post 2D2 T cell transfer; Post: 1 day post 2D2 T cell transfer). iLN were harvested 7 days after the transfer. (A) Representative gating of Fas, FasL, and TRAIL expression by 2D2 CD4s. Frequency (B) and number (C) of Fas, FasL, and TRAIL expressing cells in the pre-transfer group. Frequency (D) and number (E) of Fas, FasL, and TRAIL expressing cells in the post-transfer group. Data are from 1 experiment with five mice per group. *p<0.05. Error bars represent the standard error of the mean.
-
Figure 6—figure supplement 1—source data 1
Source data for Figure 6—figure supplement 1.
- https://cdn.elifesciences.org/articles/55800/elife-55800-fig6-figsupp1-data1-v2.xlsx
Figure 6—figure supplement 2
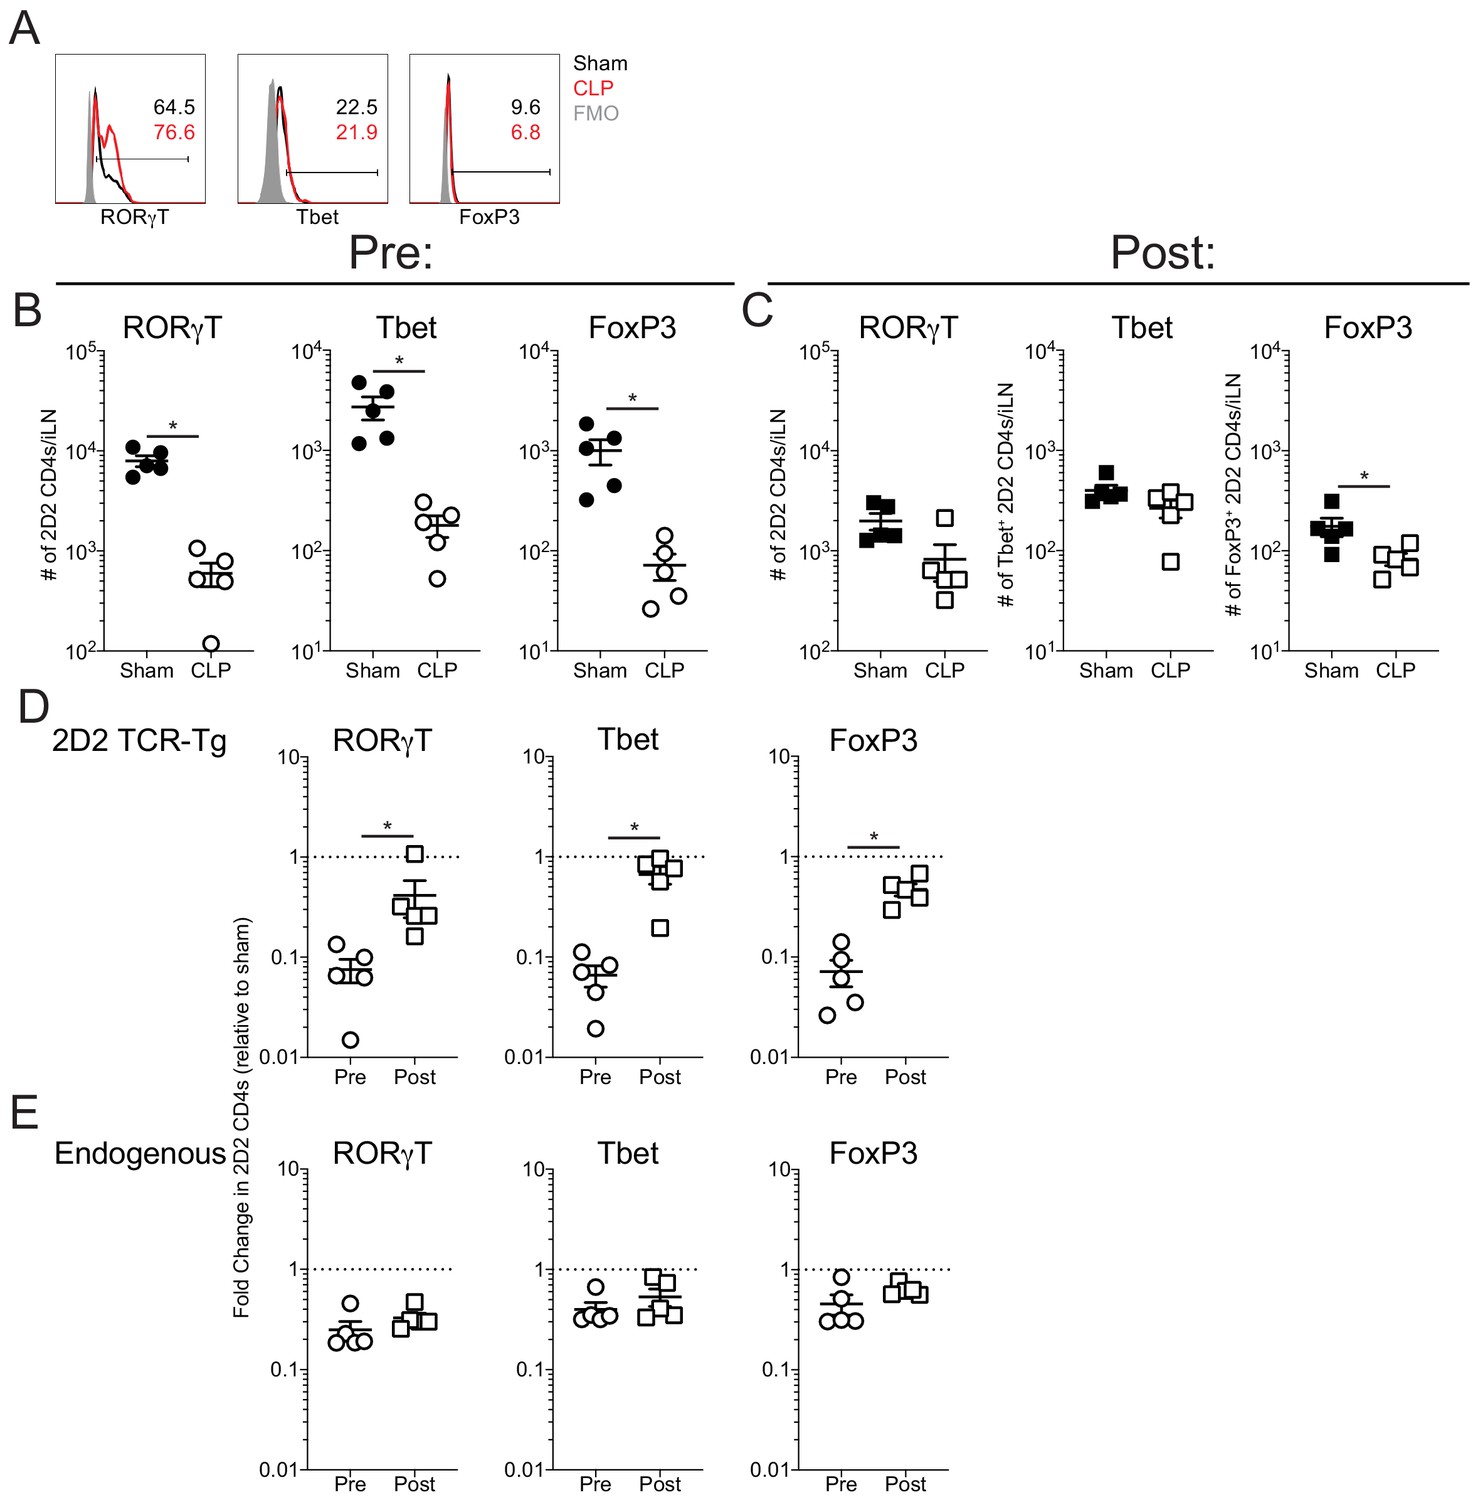
Sepsis does not influence the expression of RORγT, Tbet, and FoxP3 by autoantigen-specific T cells.
Thy1.2 C57Bl/6 mice were separated into Pre- and Post-transfer groups. The Pre-transfer group received 5 × 10³ naive Thy1.1 2D2 TCR-Tg CD4 T cells 1 day before sham or CLP surgery. The Post-transfer group underwent sham or CLP surgery then received 5 × 10³ naive Thy1.1 2D2 TCR-Tg CD4 T cells 4 days later. EAE was induced in both the Pre- and Post-transfer groups 5 days after surgery (Pre: 6 days post 2D2 T cell transfer; Post: 1 day post 2D2 T cell transfer). iLN were harvested 7 days after the transfer. (A) Representative gating of RORγT, Tbet, and FoxP3 expression by 2D2 CD4s. Number of RORγT, Tbet, and FoxP3 2D2 CD4 T cells in pre- (B) and post-transfer (C) groups. Fold change in the number of RORγT, Tbet, and FoxP3 (D) 2D2 CD4 T cells and (E) endogenous CD4 T cells relative to sham controls in the pre- and post-transfer groups. Data are from 1 experiment with five mice per group. *p<0.05. Error bars represent the standard error of the mean.
-
Figure 6—figure supplement 2—source data 1
Source data for Figure 6—figure supplement 2.
- https://cdn.elifesciences.org/articles/55800/elife-55800-fig6-figsupp2-data1-v2.xlsx
Figure 7
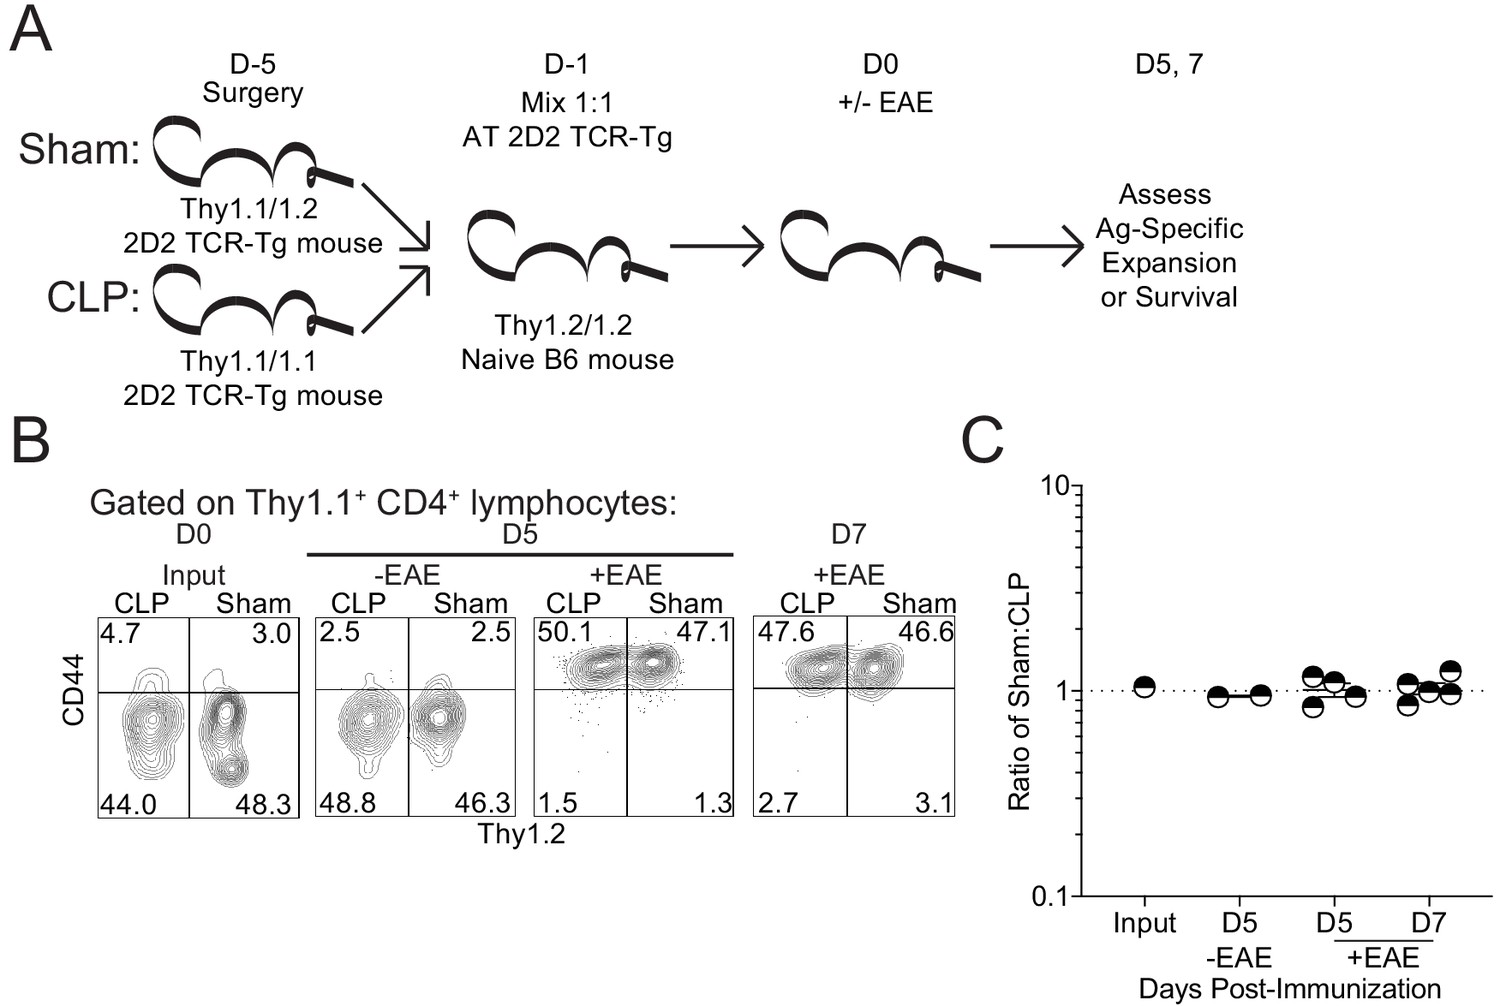
Sepsis does not lead to a cell intrinsic deficit in CD4 T cell expansion.
(A) Experimental design: Thy1.1/1.1 2D2 TCR-Tg mice underwent sham surgery while Thy1.1/1.2 2D2 TCR-Tg mice underwent CLP surgery. 2D2 mice were euthanized 4 days post-surgery and splenic 2D2 cells were mixed at a 1:1 ratio prior to transfer into naive Thy1.2/1.2 B6 mice. Non-EAE mice received 5 × 10⁶ of each 2D2 population, whereas EAE mice received 5 × 10³ of each 2D2 population. A day after transfer, EAE was either induced or not in the respective recipient group. Survival of the transferred 2D2 cells (assessed in non-EAE hosts) was assessed in the iLN 5 days after transfer. Expansion of the transferred 2D2 cells (assessed in EAE hosts) was assessed in the iLN 5 and 7 days after transfer. (B) Representative profiles of the 2D2 input and output on indicated days for both EAE and non-EAE hosts. (C) The ratio of Sham to CLP 2D2 cells in the input and output at indicated days for both EAE and non-EAE hosts. Data are from 1 experiment with two to five mice per group. *p<0.05. Error bars represent the standard error of the mean.
-
Figure 7—source data 1
Source data for Figure 7.
- https://cdn.elifesciences.org/articles/55800/elife-55800-fig7-data1-v2.xlsx
Figure 8
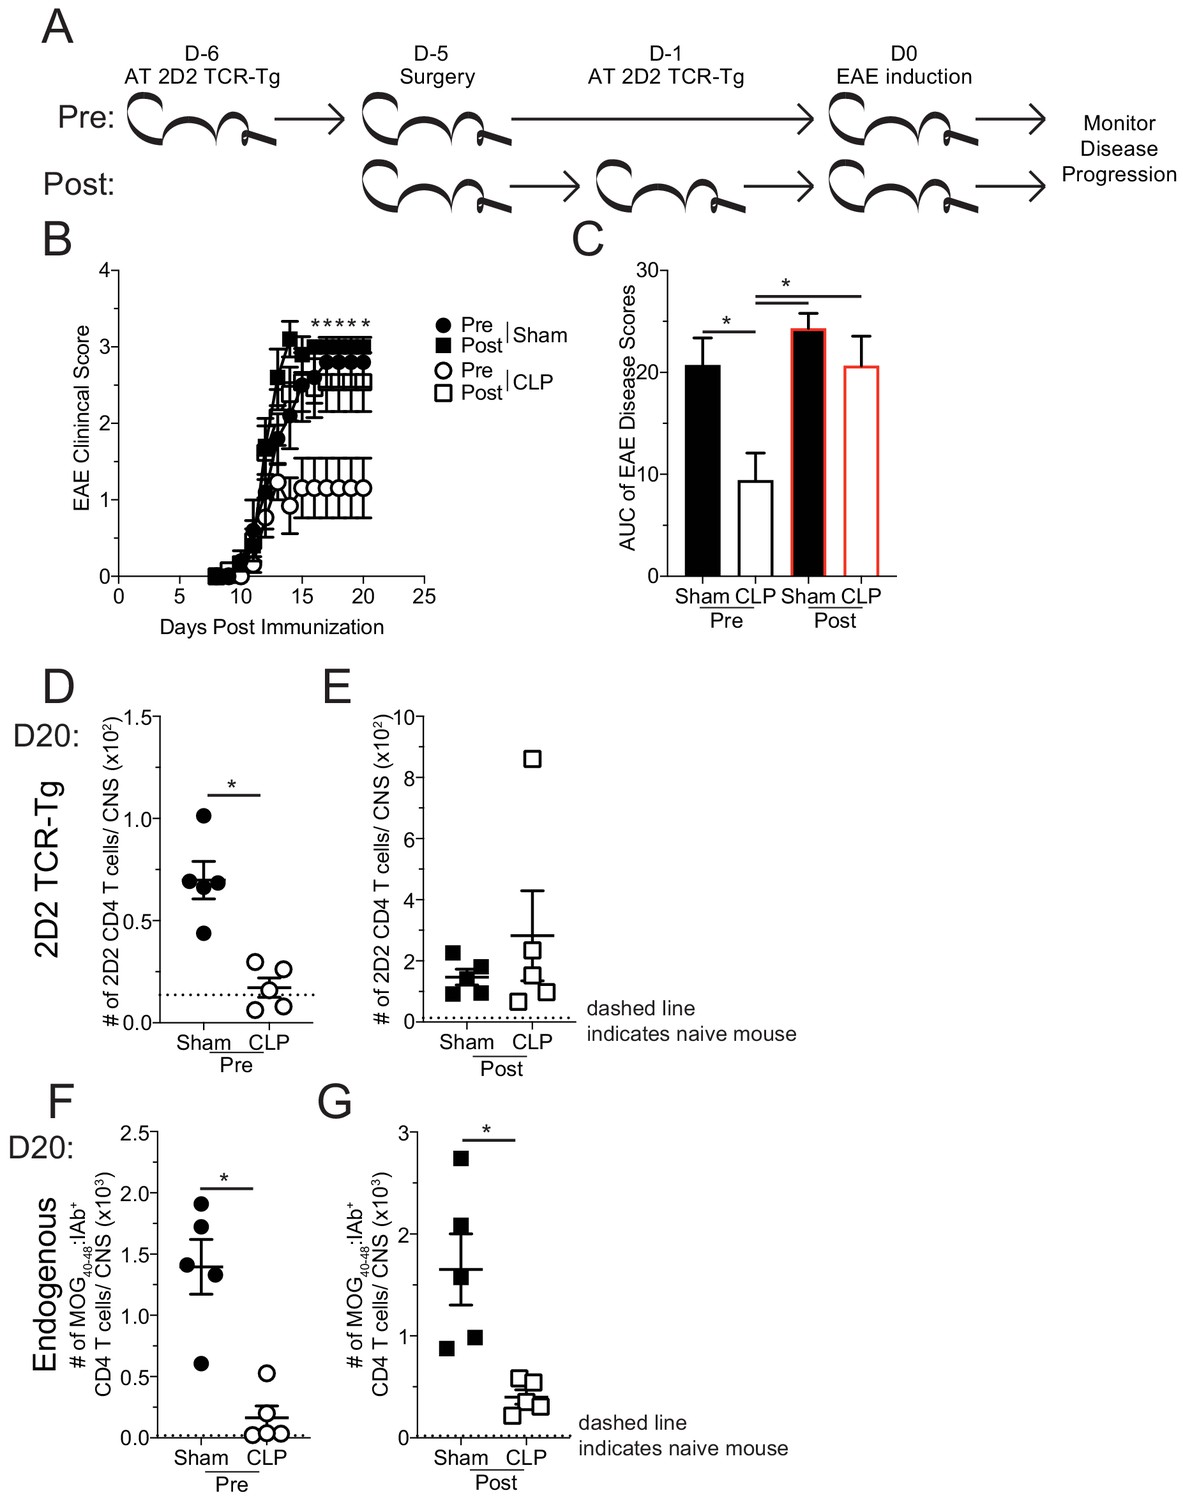
Sepsis-induced numerical loss of MOG-specific naive CD4 T cell precursors diminishes EAE disease development.
(A) Experimental design: Thy1.2 C57Bl/6 mice were separated into Pre- and Post-transfer groups. The Pre-transfer group received 5 × 10³ naive Thy1.1 2D2 TCR-Tg CD4 T cells 1 day before sham or CLP surgery. The Post-transfer group underwent sham or CLP surgery then received 5 × 10³ naive Thy1.1 2D2 TCR-Tg CD4 T cells 4 days later. EAE was induced in both the Pre- and Post-transfer groups 5 days after surgery (Pre: 6 days post 2D2 T cell transfer; Post: 1 day post 2D2 T cell transfer). EAE disease onset and severity were monitored. (B) Average EAE disease score following EAE induction for mice that were Pre-transfer sham (black circle), Post-transfer sham (black square), Pre-transfer CLP (white circle), or Post-transfer CLP (white square). (C) Area under the curve (AUC) of disease scores in panel B following EAE induction. Number of 2D2 TCR-Tg CD4 T cells in the CNS of sham and CLP (D) Pre-transfer and (E) Post-transfer groups as well as endogenous MOG-specific CD4 T cells in the CNS of sham and CLP for (F) Pre-transfer and (G) Post-transfer groups. Data are representative from two independent experiments with 10–14 mice per group for panels B and C, and five mice per group for panels D-G. *p<0.05. Error bars represent the standard error of the mean.
-
Figure 8—source data 1
Source data for Figure 8.
- https://cdn.elifesciences.org/articles/55800/elife-55800-fig8-data1-v2.xlsx
-
Figure 8—source data 2
Source data for Figure 8.
- https://cdn.elifesciences.org/articles/55800/elife-55800-fig8-data2-v2.xlsx
Tables
Key resources table
| Reagent type (species) or resource | Designation | Source or reference | Identifiers | Additional information |
|---|---|---|---|---|
| Strain, strain background (Mus musculus) | C57BL6/J | Jackson Laboratory | Stock No: 000664 (RRID:IMSR_JAX:000664) | |
| Strain, strain background (Mus musculus) | B6.PL(84NS)/Cy | Jackson Laboratory | Stock No: 000983 (RRID:IMSR_JAX:000406) | C57BL6/J Thy1.1 |
| Strain, strain background (Mus musculus) | C57BL/6-Tg(Tcra2D2,Tcrb2D2)1Kuch/J | Jackson Laboratory | Stock No: 006912 (RRID:IMSR_JAX:006912) | |
| Strain, strain background (Mus musculus) | Thy1.1/1.1- C57BL/6-Tg(Tcra2D2,Tcrb2D2)1Kuch/J | This paper | Thy1.1/1.1 2D2 | Can be acquired through lab contact or breeding of above commercially available strains |
| Strain, strain background (Mus musculus) | Thy1.1/1.2- C57BL/6-Tg(Tcra2D2,Tcrb2D2)1Kuch/J | This paper | Thy1.1/1.2 2D2 | Can be acquired through lab contact or breeding of above commercially available strains |
| Peptide, recombinant protein | MOG35-55 | GenScript | SC1208 | |
| Other | CFA containing M. tuberculosis H37Ra | Difco | DF3114-33-8 | |
| Peptide, recombinant protein | Pertussis toxin from Bordetella pertussis | Sigma-Aldrich | P7208 | |
| Antibody | CD4 (Rat monoclonal) | Biolegend | GK1.5 (AB_312689) | FACs (1:400) |
| Antibody | CD11a (Rat monoclonal) | Biolegend | M17/4 (AB_312776) | FACs (1:300) |
| Antibody | IFNγ (Rat monoclonal) | eBioscience | XMG1.2 (AB_465410) | FACs (1:100) |
| Antibody | IL-17A (Rat monoclonal) | eBioscience | eBio17B7 (AB_906240) | FACs (1:100) |
| Antibody | TNFα (Rat monoclonal) | eBioscience | MP6-XT22 (AB_465416) | FACs (1:100) |
| Antibody | CD8a (Rat monoclonal) | Biolegend | 5H10-1 (AB_312762) | FACs (1:400) |
| Antibody | Ki67 (Mouse monoclonal) | BD Pharmingen | B56 (AB_2858243) | FACs (1:100) |
| Antibody | Thy1.1 (Mouse monoclonal) | eBioscience | HIS51 (AB_1257173) | FACs (1:1000) |
| Antibody | Thy1.2 (Rat monoclonal) | eBioscience | 53–2.1 (AB_467378) | FACs (1:1000) |
| Antibody | CD44 (Rat monoclonal) | eBioscience | IM7 (AB_469715) | FACs (1:200) |
| Antibody | CD45 (Mouse monoclonal) | eBioscience | 104 (AB_469724) | FACs (1:100) |
| Antibody | F4/80 (Rat monoclonal) | Biolegend | BM8 (AB_893499) | FACs (1:100) |
| Antibody | CD11b (Rat monoclonal) | eBioscience | M1/70 (AB_468883) | FACs (1:200) |
| Antibody | IA-b (Rat monoclonal) | eBioscience | M5/114.15.2 (AB_529608) | FACs (1:100) |
| Antibody | CD3e (Armenian Hamster monoclonal) | eBioscience | 145–2 C11 (AB_467048) | FACs (1:100) |
| Antibody | CD19 (Mouse monoclonal) | eBioscience | MB19-1 (AB_467145) | FACs (1:100) |
| Antibody | FAS (Mouse monoclonal) | Biolegend | SA367H8 (AB_2629777) | FACs (1:100) |
| Antibody | FASL (Armenian Hamster monoclonal) | Biolegend | MFL3 (AB_313276) | FACs (1:100) |
| Antibody | TRAIL (Rat monoclonal) | Biolegend | N2B2 (AB_345271) | FACs (1:100) |
| Antibody | RORγT (Rat monoclonal) | eBioscience | AFKJS-9 (AB_1834470) | FACs (1:100) |
| Antibody | Tbet (Mouse monoclonal) | eBioscience | eBio4b10 (AB_763636) | FACs (1:100) |
| Antibody | FoxP3 (Rat monoclonal) | Invitrogen | FJK-16S (AB_467576) | FACs (1:100) |
| Antibody | CD11c (Armenian Hamster monoclonal) | Biolegend | N418 (AB_313772) | FACs (1:100) |
| Antibody | B220 (Rat monoclonal) | Biolegend | RA3-6B2 (AB_312989) | FACs (1:100) |
| Peptide, recombinant protein | MOG40-48 I-Ab linked (Drosophila melanogaster S2 cells) | NIH tetramer core | FACs (1:100) | |
| Commercial assay or kit | Foxp3 / Transcription Factor Staining Buffer Set | Invitrogen | 00-5523-00 | |
| Commercial assay or kit | Vybrant FAM Caspase-3 and −7 assay kit | Thermo-Fischer | V35118 | |
| Commercial assay or kit | BioRad Bio-plex Pro Mouse Cytokine 23-plex | Biorad | M60009RDPD | |
| Software, algorithm | GraphPad Prism | GraphPad Prism 8 | Version 8.4.2 (464) (RRID:SCR_002798) |
Additional files
Download links
A two-part list of links to download the article, or parts of the article, in various formats.
Downloads (link to download the article as PDF)
Open citations (links to open the citations from this article in various online reference manager services)
Cite this article (links to download the citations from this article in formats compatible with various reference manager tools)
Sepsis impedes EAE disease development and diminishes autoantigen-specific naive CD4 T cells
eLife 9:e55800.
https://doi.org/10.7554/eLife.55800


