Synergy between SIRT1 and SIRT6 helps recognize DNA breaks and potentiates the DNA damage response and repair in humans and mice
- Shenzhen Key Laboratory for Systemic Aging and Intervention, National Engineering Research Center for Biotechnology (Shenzhen), Shenzhen University Health Science Center, China
- The Key Laboratory of Breast Cancer Prevention and Therapy, Ministry of Education, Tianjin's Clinical Research Center for Cancer, Tianjin Medical University Cancer Institute and Hospital, National Clinical Research Center for Cancer, China
- Guangdong Key Laboratory of Genome Stability and Human Disease Prevention, School of Basic Medical Sciences, Shenzhen University Health Science Center, China
- International Cancer Center, Shenzhen University Health Science Center, China
- Anti-aging & Regenerative Medicine Research Institution, School of Life Sciences, Shandong University of Technology, China
- Key Laboratory of Gene Engineering of the Ministry of Education and State Key Laboratory for Biocontrol, School of Life Sciences, Sun Yat-sen University, China
- Guangdong Provincial Key Laboratory of Regional Immunity and Diseases, School of Basic Medical Sciences, Shenzhen University Health Science Center, China
Figures
Figure 1 with 1 supplement
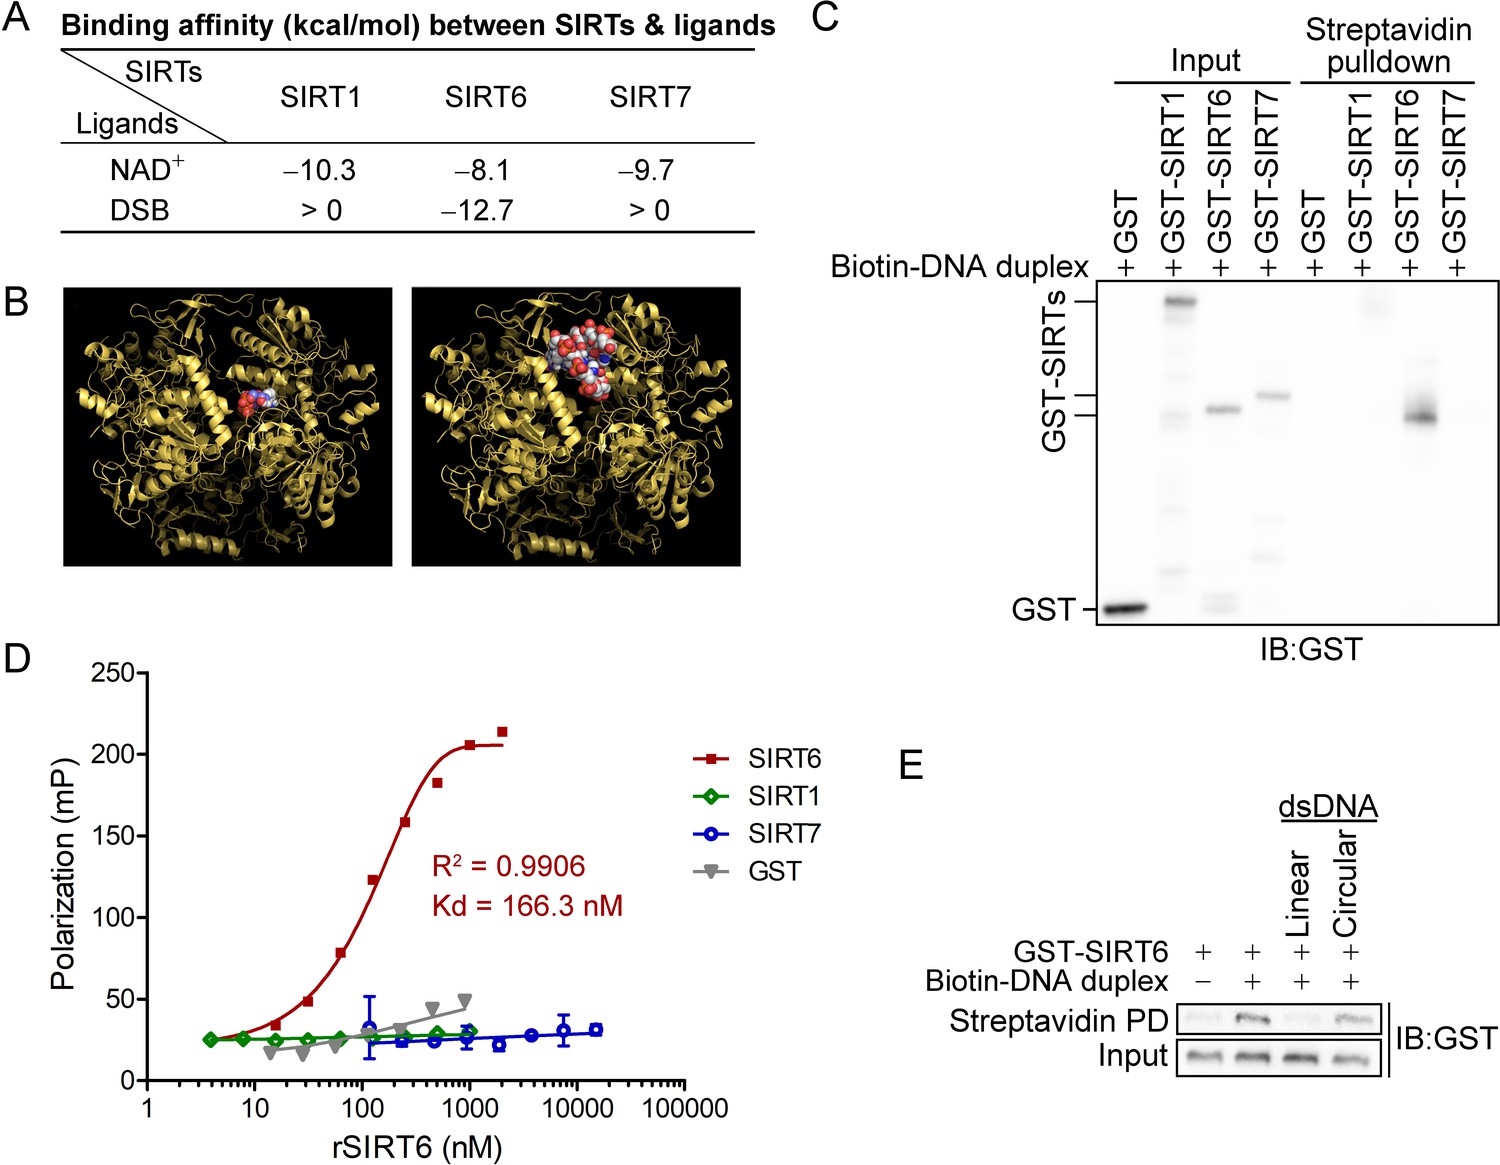
SIRT6 directly recognizes DNA breaks.
(A) The predicted binding affinity (kcal/mol) between sirtuins (SIRTs) and ligands (NAD+ and a DSB) by molecular docking analysis. (B) Molecular docking of SIRT6 with a DSB (right) and NAD+ (left) using AutoDock Vina software. (C) A biotin-labeled DNA duplex was incubated with the indicated recombinant SIRTs. Streptavidin beads were pulled down and blotted with anti-GST antibodies. (D) The fluorescence polarization (FP) of FAM-labeled DNA (20 nM) was detected after incubation with GST-SIRT1, GST-SIRT6, GST-SIRT7 or GST at the indicated concentration. (E) A pulldown assay comprising a biotin-labeled DNA duplex with GST-SIRT6 in the presence of unlabeled linear DNA or circular DNA.
Figure 1—figure supplement 1
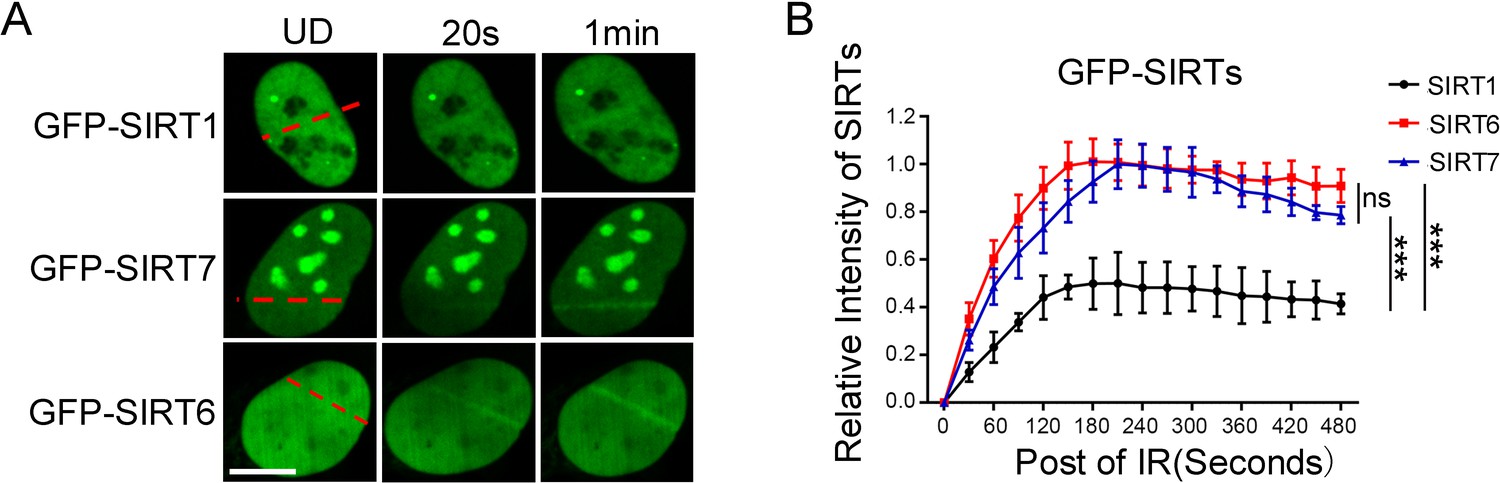
DSB-recruitment kinetics of SIRTs.
(A) GFP-fused SIRT1, SIRT6 and SIRT7 were introduced into mouse embryonic fibroblasts (MEFs). The fluorescence signal was captured at 20 s and 1 min after laser-induced DNA damage. Scale bar, 10 μm. (B) The relative intensity of GFP-SIRTs was calculated in Fiji (Image J). The data represent the means ± s.e.m., *p<0.05, ns: not significant, n = 10.
Figure 2 with 4 supplements
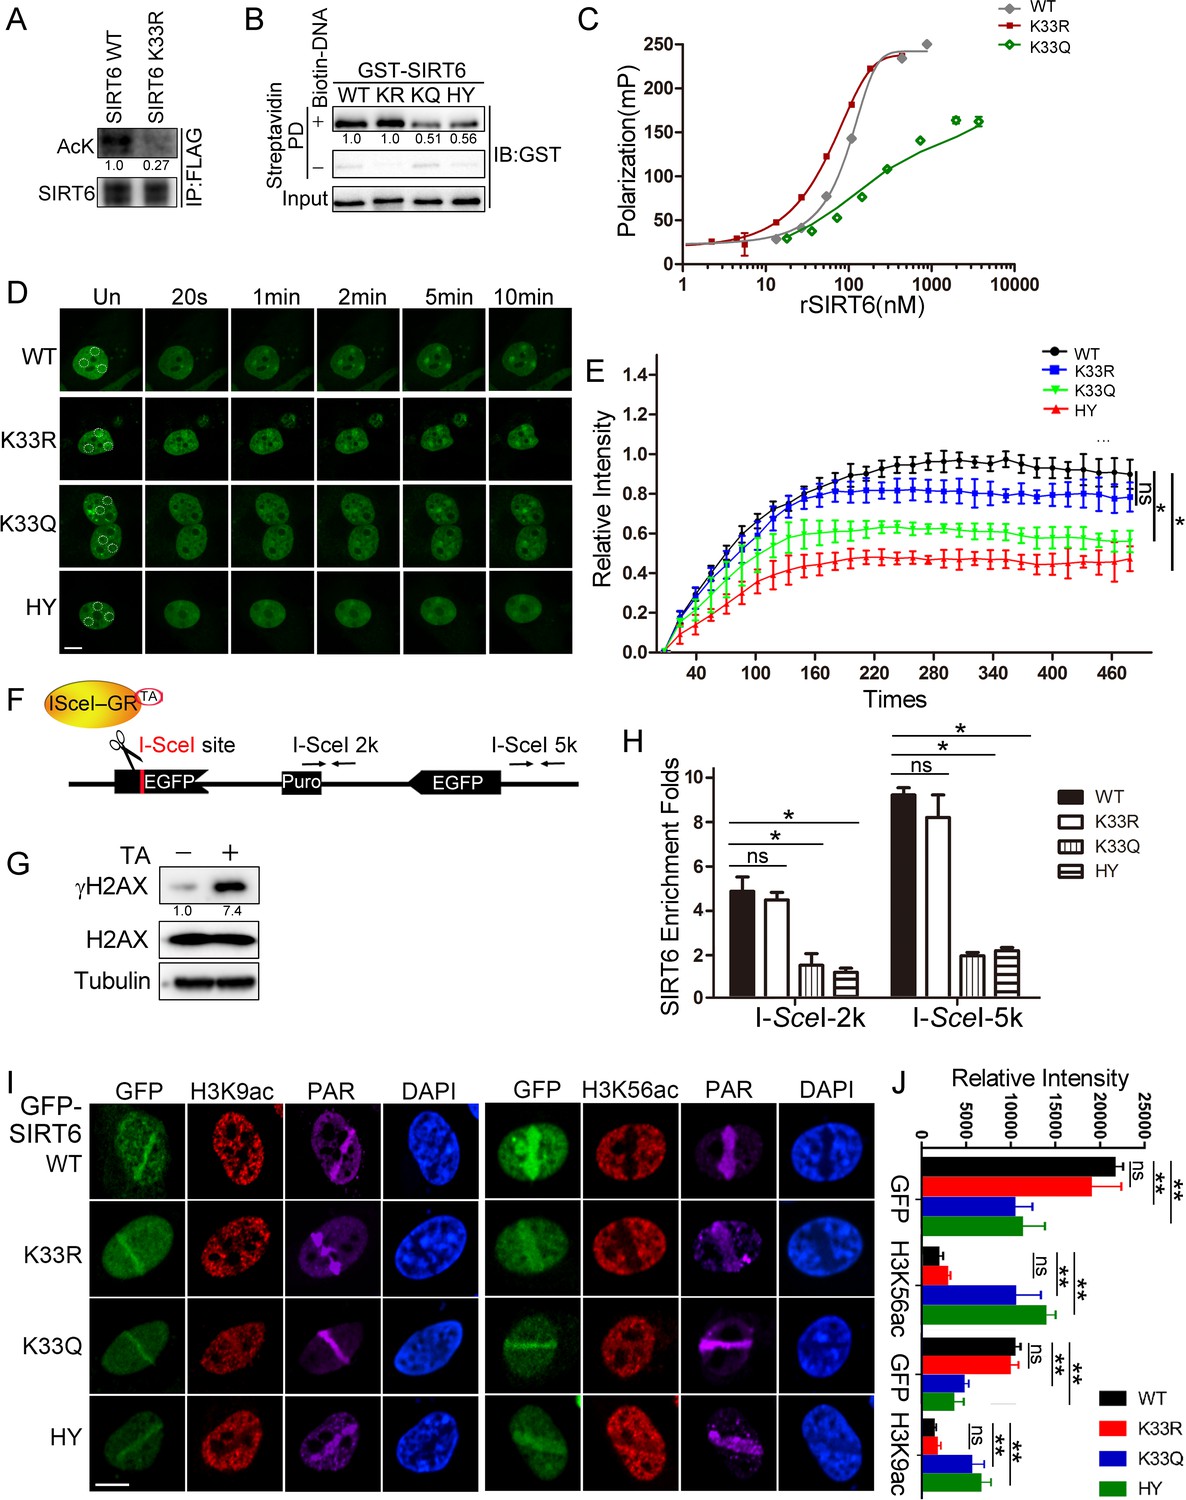
SIRT6 K33 (de)acetylation regulates DSB binding.
(A) The acetylation levels of FLAG-SIRT6 WT and K33R were assessed by western blotting with pan-acetyl antibodies in anti-FLAG immunoprecipitates in HEK293T cells. (B) Streptavidin pulldown assay showing the interactions between a biotin-labeled DNA duplex and the indicated GST-SIRT6 recombinant proteins. (C) Fluorescence polarization (FP) of Fam-labeled DNA was detected after incubating with GST-SIRT6 WT, K133R or K133Q recombinant proteins. (D–E) The dynamic recruitment of GFP-SIRT6, K33R, K33Q and HY (H133Y) to laser-induced DNA breaks was assessed by confocal microscopy. Representative images are shown (D) and the white dot circles indicate the damage sites. Scale bar, 10 μm. The relative intensity was calculated in Fiji (Image J) (E). The data represent the means ± s.e.m., *p<0.05, ns: not significant, n = 30. (F) A schematic of the DR-GFP construct, which contains a single I-SceI site to create DNA break in the presence of triamcinolone acetonide and I-SceI endonuclease. The positions of the amplification primers 2K and 5K downstream I-SceI site used for q-PCR are indicated. (G) DNA breaks were generated in DR-GFP stably transfected HeLa cells after triamcinolone acetonide (TA) treatment for 20 min, as evidenced by elevated γH2AX staining. (H) ChIP-PCR analysis of the enrichment of SIRT6 and various SIRT6 mutants at DNA break sites. The relative SIRT6 expression was confirmed by western blotting. The qPCR data were normalized to the input DNA and a sample not treated with I-SceI endonuclease (no cut). The data represent the means ± s.e.m., *p<0.05, ns: not significant, n = 3. (I–J) Fluorescence imaging of GFP-SIRT6 WT, indicated mutants, immune-stained H3K9ac and H3K56ac in Sirt6–/– MEFs after laser induced DNA damage. PAR immunostaining reveals the damage site. Scale bar, 10 μm. The relative fluorescence intensity was calculated by Fiji (Image J) (J). The data represent the means ± s.e.m., **p<0.01, ns: not significant, n = 30.
Figure 2—figure supplement 1
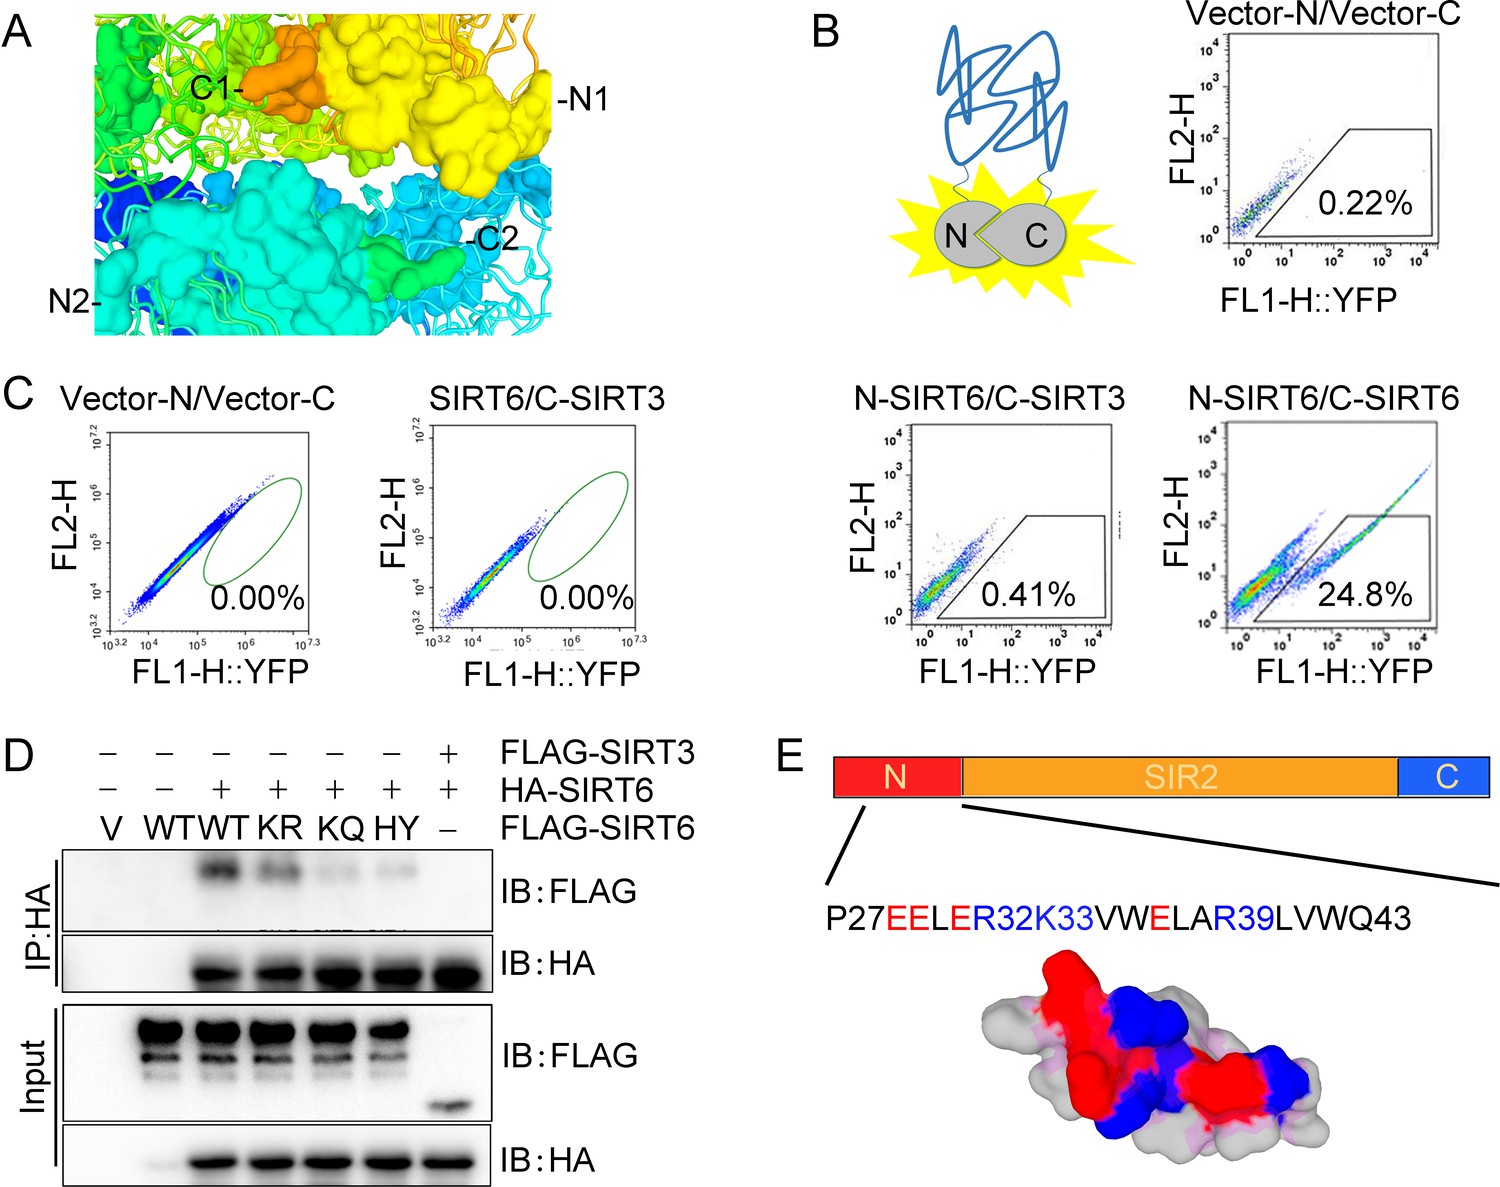
Polymerization of SIRT6.
(A) Schematic of one putative DSB-binding pocket, consisting of two N-termini (yellow and aquamarine) and two C-termini (orange and lime green) of two adjacent SIRT6 hexamer molecules. (B) Schematic of the BiFC system (upper left) and yellow fluorescence detection in HEK293 cells co-transfected with empty vectors; N-SIRT6 and C-SIRT6; N-SIRT6 and C-SIRT3 via the BiFC system. (C) Yellow fluorescence detection in HEK293 cells ectopically expressing untagged SIRT6 and C-SIRT3. (D) Co-IP and western blot analysis of potential interaction between HA-SIRT6 and FLAG-SIRT6 WT, K33R, K33Q and H133Y. FLAG-SIRT3 was included as control. (E) Schematic of a SIRT6 N-terminal peptide showing the positively (blue) and negatively charged residues (red).
Figure 2—figure supplement 2
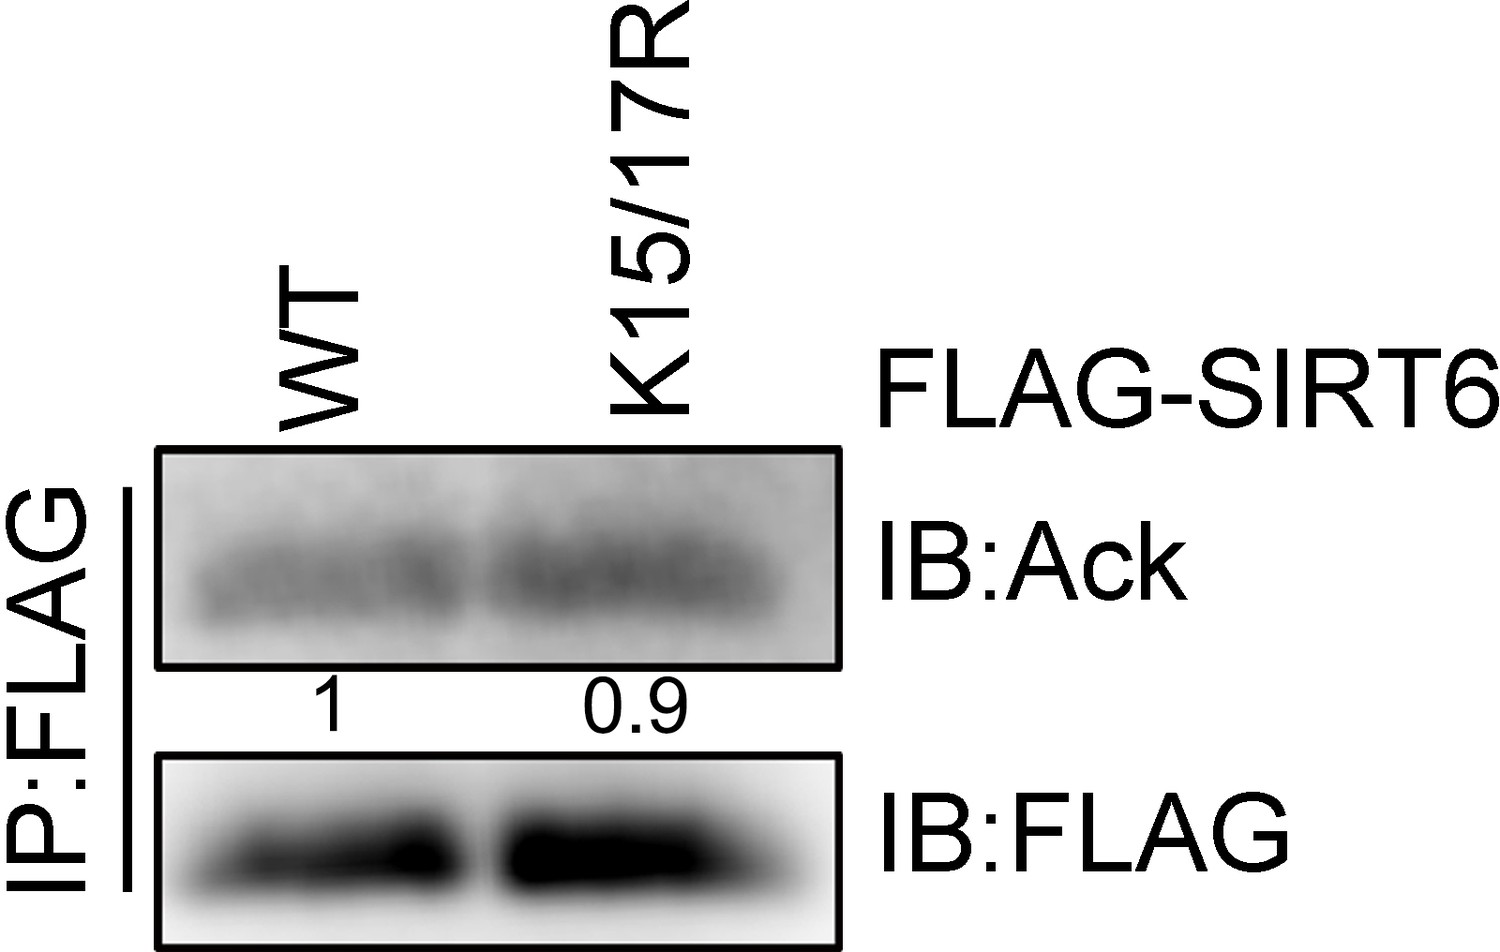
Acetylation of SIRT6.
SIRT6 K15/17R acetylation levels were determined by IP and western blotting with a pan anti-acetyl lysine antibody in HEK293 cells.
Figure 2—figure supplement 3
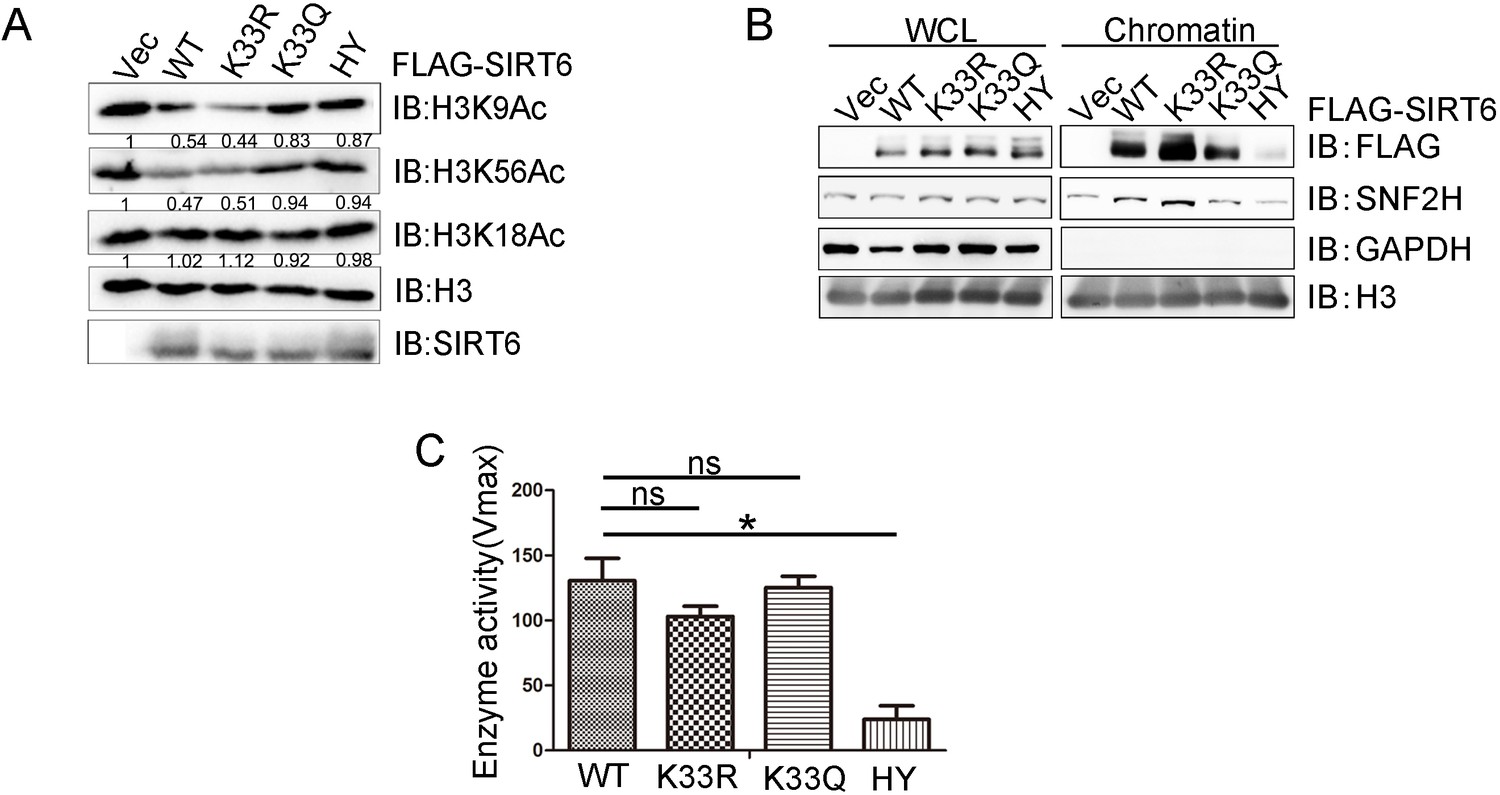
Deacetylase activity of SIRT6.
(A) Western blotting analysis of the acetylation levels of histone H3 in SIRT6 KO HEK293 cells reconstituted with SIRT6 WT or indicated mutants. (B) Cell fractionation analysis to detect the chromatin enrichment of SNF2H and SIRT6 in FLAG-SIRT6, K33R, K33Q and HY reconstituted SIRT6 KO HEK293T cells. WCL: whole cell lysate. (C) Recombinant GST-SIRT6, K33R, K33Q and H133Y (HY) deacetylation activities (Vmax) were detected in vitro (CycLex). The data represent the means ± s.e.m., *p<0.05, ns: not significant, n = 3.
Figure 2—figure supplement 4
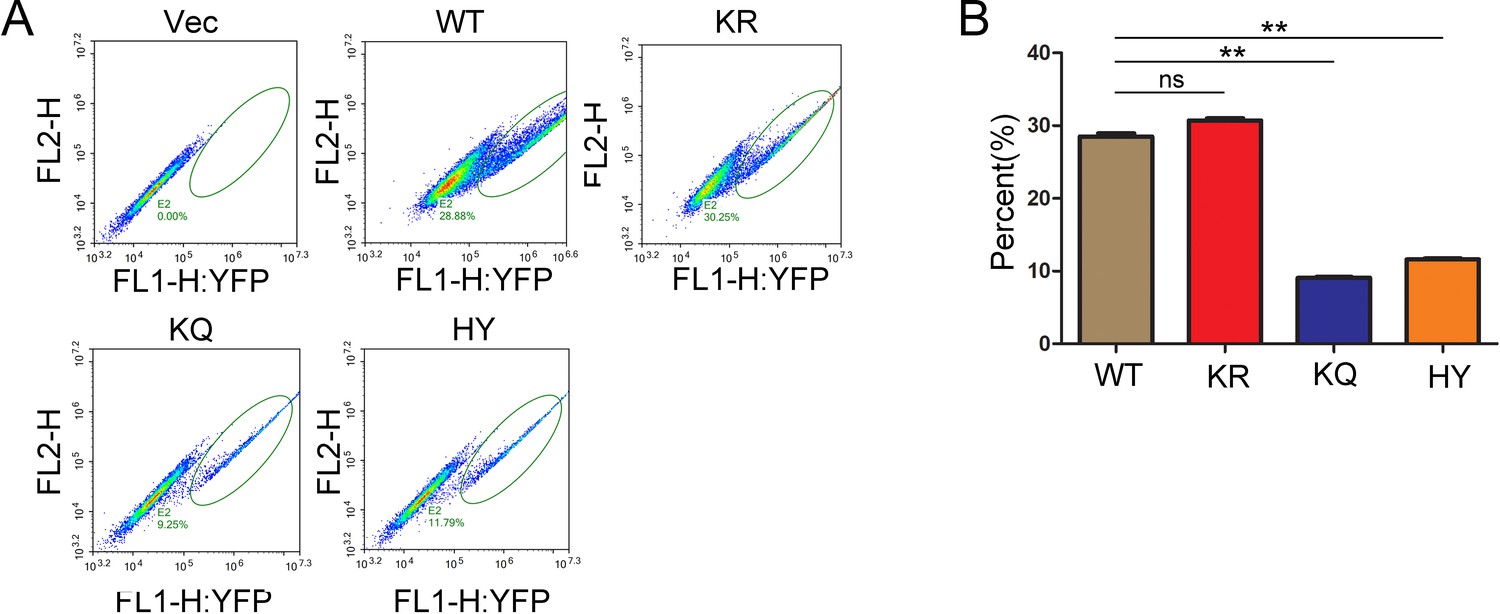
Polymerization of SIRT6.
(A) Yellow fluorescence detection by FACS in HEK293 cells ectopically expressing vector only, SIRT6-WT, SIRT6-KR, SIRT6-KQ or SIRT6-HY via the BiFC system. Green ovals indicate yellow-fluorescence-positive cell population. (B) The percent of yellow-fluorescence-positive cells from each group shown in A. The data represent the means ± s.e.m., **p<0.01, ns: not significant, n = 3.
Figure 3 with 2 supplements
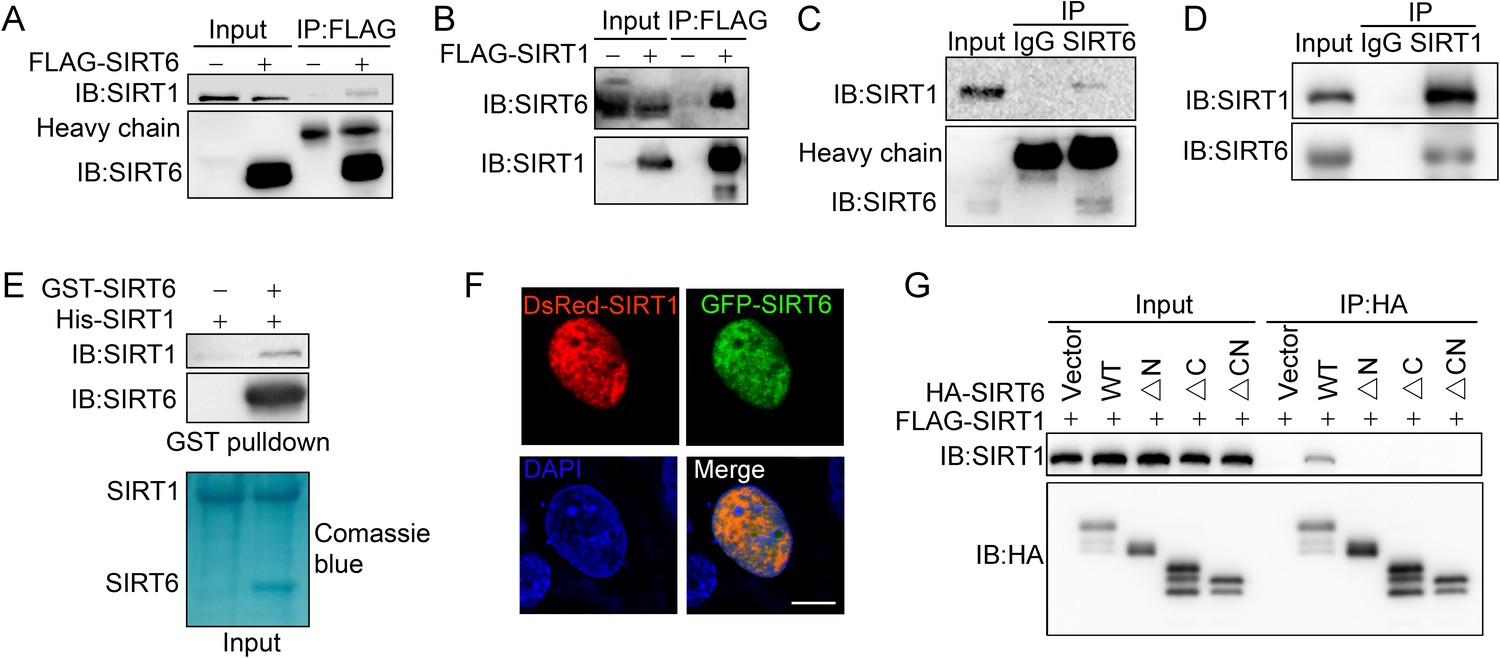
SIRT6 interacts with SIRT1.
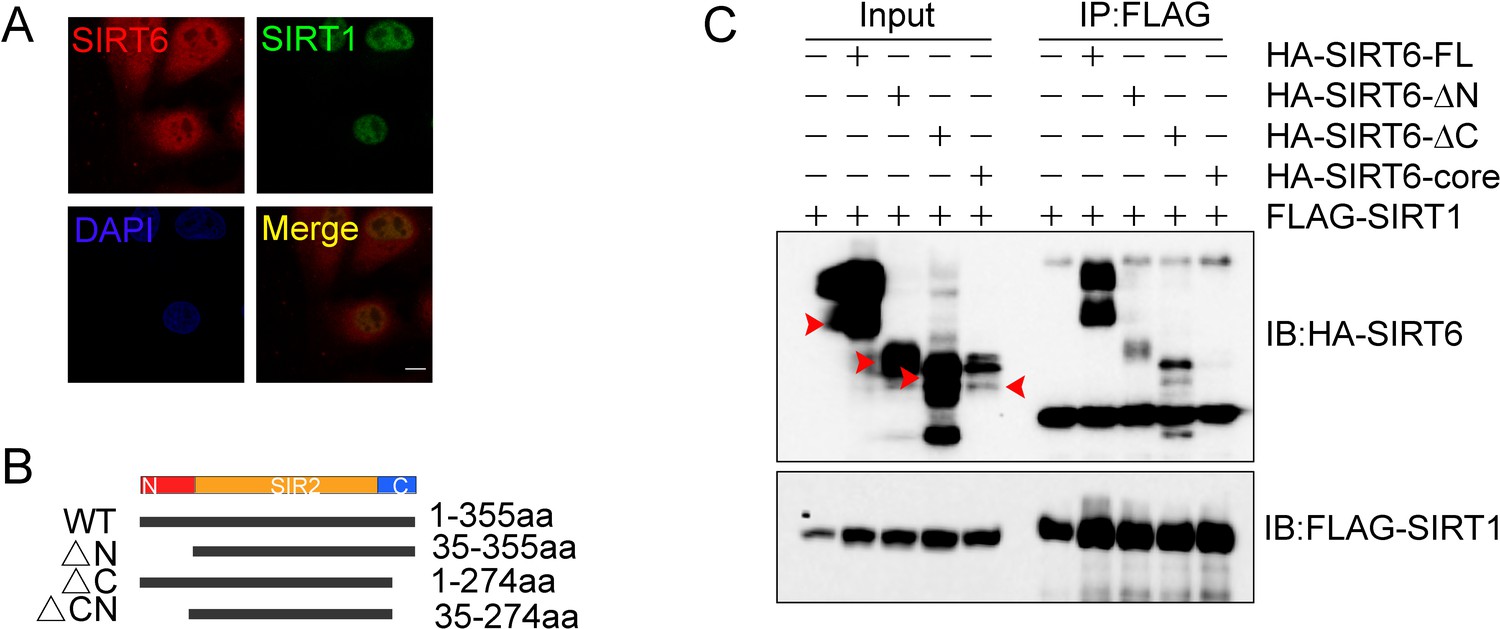
(A) Western blot analysis of SIRT1 levels in anti-FLAG immunoprecipitates in HEK293 cells transfected with FLAG-SIRT6 or an empty vector. (B) Western blot analysis of SIRT6 levels in anti-FLAG immunoprecipitates in HEK293 cells transfected with FLAG-SIRT1 or an empty vector. (C) Western blot analysis of SIRT1 in anti-SIRT6 immunoprecipitates in HeLa cells. (D) Western blot analysis of SIRT6 in anti-SIRT1 immunoprecipitates in HeLa cells. (E) GST pulldown assay between GST-SIRT6 and His-SIRT1 in vitro. (F) Representative images of DsRed-SIRT1 and GFP-SIRT6 localization in U2OS cells, determined by confocal microscopy. Scale bar, 10 μm. (G) Co-immunoprecipitation and western blot analysis of FLAG-SIRT1 in HEK293 cells overexpressing FLAG-SIRT1 and HA-SIRT6 ΔN (N-terminus deleted), ΔC (C-terminus deleted) or ΔCN (N-/C-termini deleted).
Figure 3—figure supplement 1

Acetylation level of SIRT6.
The acetylation levels of FLAG-SIRT6 in the presence of NAM (5 mM), TSA (1 μM) or Ex527 (1 μM) were determined by anti-FLAG IP and western blotting using an anti-pan-acetyl lysine antibody in HEK293 cells.
Figure 3—figure supplement 2
SIRT1-SIRT6 interaction.
(A) Immunofluorescence analysis of endogenous SIRT1 (Green) and SIRT6 (Red) protein levels. Representative images are shown, captured under a confocal imaging microscope. Scale bar, 10 μm. (B) A schematic of the various domain-modified SIRT6 constructs. (C) Co-IP and western blot analysis of the interaction between SIRT1 and various domain modified SIRT6 constructs overexpressed in HEK293 cells.
Figure 4 with 1 supplement
SIRT1 deacetylates SIRT6 at K33.
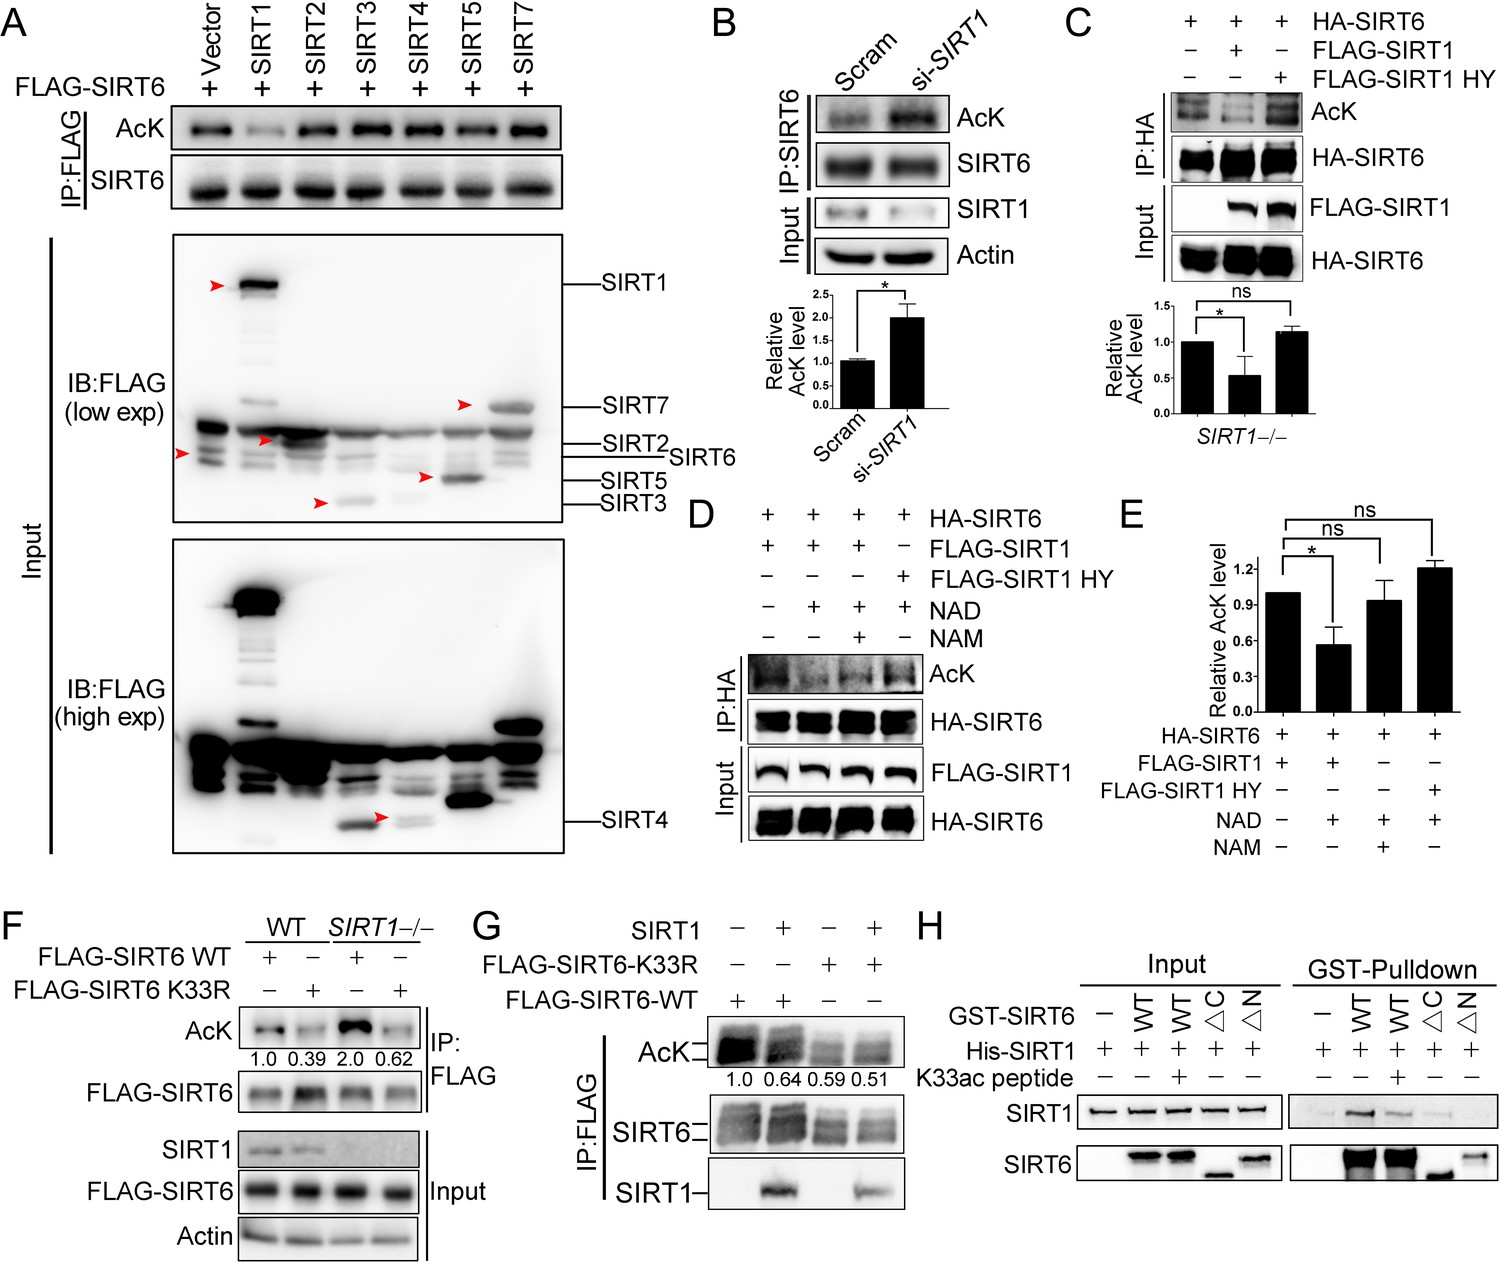
(A) The acetylation level of FLAG-SIRT6 in HEK293 cells ectopically expressing SIRT1-5 and SIRT7. (B) The acetylation level of endogenous SIRT6 in HEK293 cells treated si-SIRT1 or scramble (Scram) siRNAs. The intensity of acetylated bands was quantified by Image J and normalized to scramble control. The data represent the means ± s.e.m., *p<0.05, n = 3. (C) The acetylation level of HA-SIRT6 in SIRT1–/– cells reconstituted with SIRT1 or the enzyme-inactive SIRT1 H363Y. The intensity of acetylated bands was quantified by Image J and normalized to scramble control. The data represent the means ± s.e.m. *p<0.05, ns: not significant, n = 3. (D–E) The acetylation level of HA-SIRT6 in the presence of FLAG-SIRT1, H363Y, NAD+ (500 μM) and/or NAM (2 mM) (D). The intensity of acetylated bands was quantified by Image J and normalized to scramble control (E).The data represent the means ± s.e.m. *p<0.05, ns: not significant, n = 3. (F) The acetylation level of FLAG-SIRT6 and FLAG-SIRT6 K33R in SIRT1–/– and WT HEK293 cells. (G) The acetylation level of FLAG-SIRT6 and K33R in HEK293 cells with or without ectopic SIRT1. (H) GST pulldown assay with GST-SIRT6 WT, ΔN, ΔC and His-SIRT1 in the presence or absence of 10 μM K33ac peptide [PEELERK(ac)VWELARL], which represents a 14-aa peptide containing acetylated SIRT6 K33.
Figure 4—figure supplement 1
Acetylation levels of SIRTs.
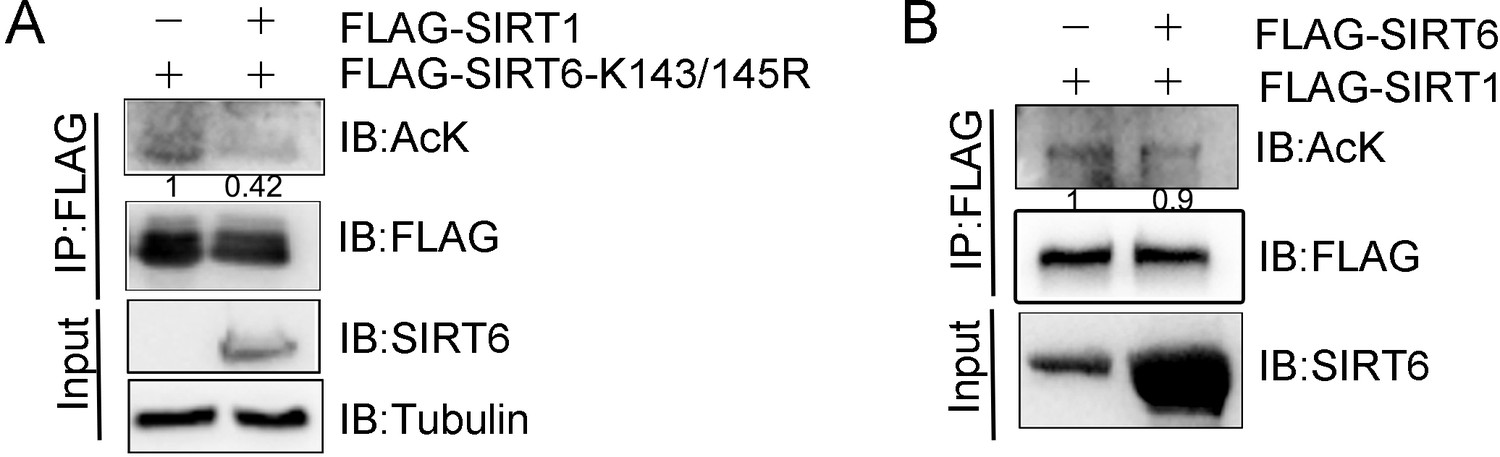
(A) SIRT6 K143/145R acetylation levels in anti-FLAG IPs derived from HEK293 cells, was determined by western blotting with a pan anti-acetyl lysine antibody. (B) FLAG-SIRT1 acetylation levels in anti-FLAG IPs derived from HEK293 cells overexpressing ectopic HA-SIRT6, were determined by western blotting with a pan anti-acetyl lysine antibody.
Figure 5 with 1 supplement
γH2AX is required for the chromatin retention of SIRT6.
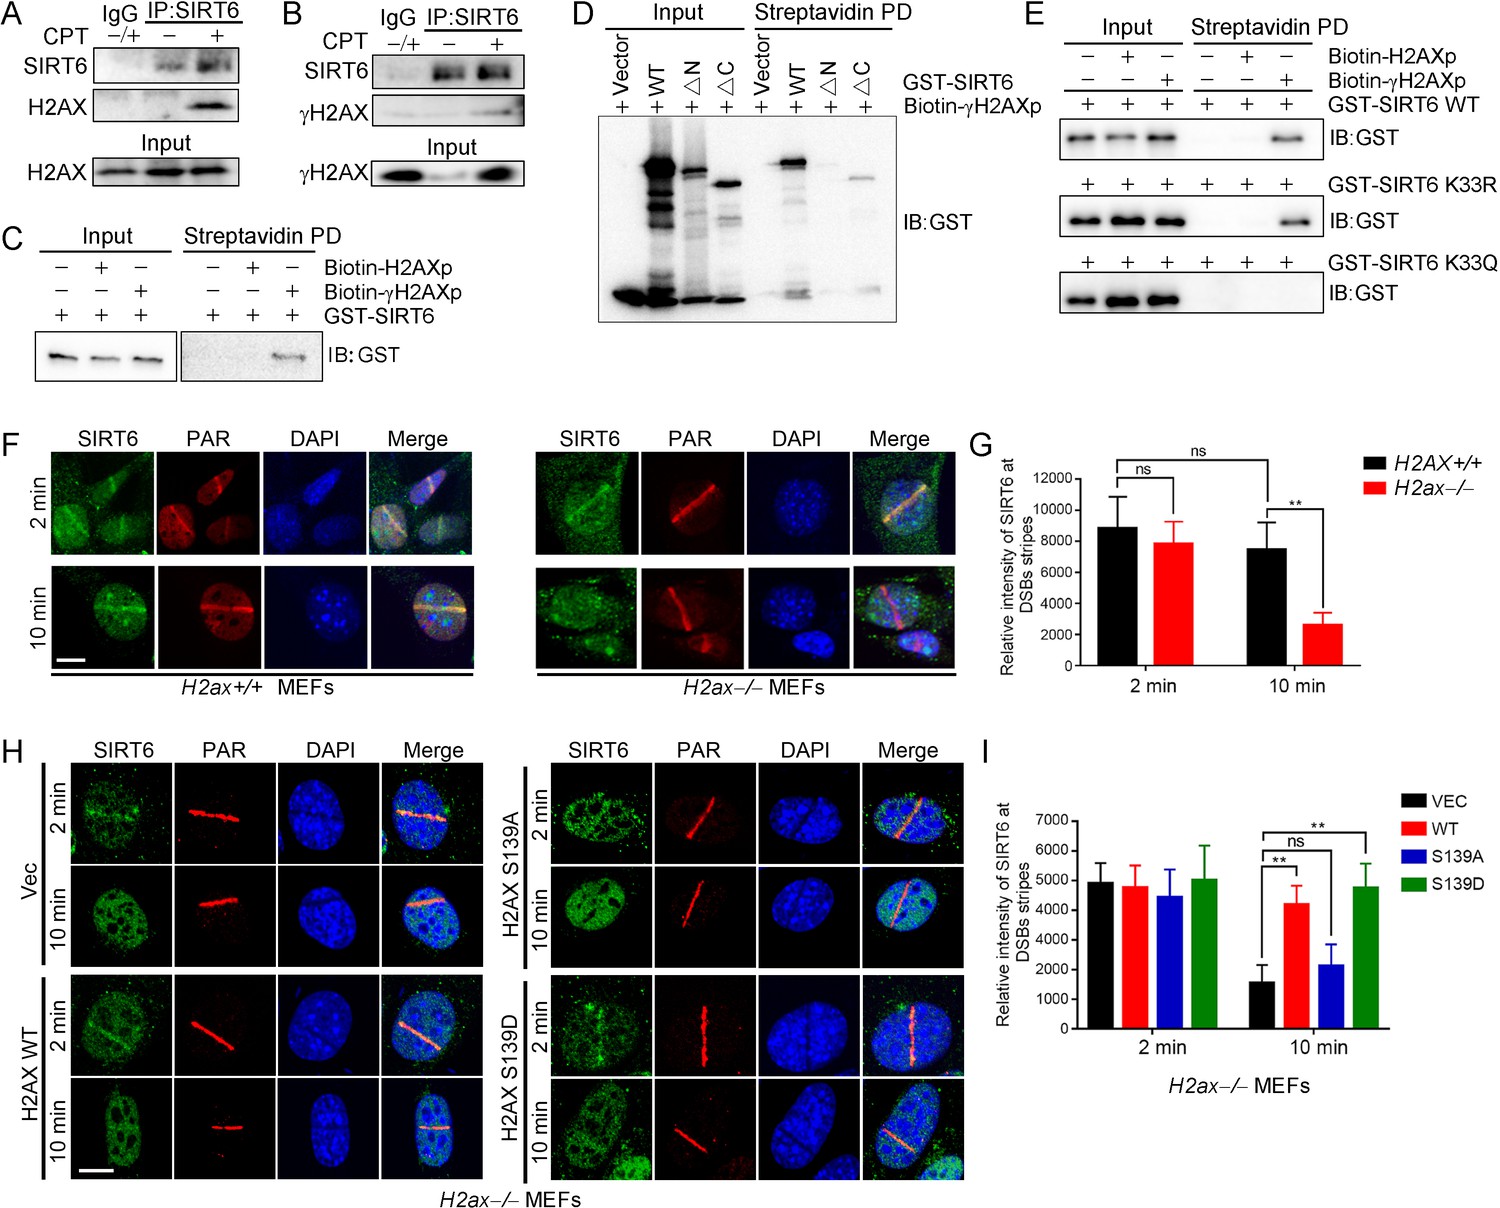
(A,B) Representative western blots showing H2AX (A) and γ-H2AX (B) levels in anti-SIRT6 immunoprecipitates from HEK293 cells treated with or without 1 μM camptothecin (CPT). The IgG control experiment was performed in mixed lysate from cells treated with CPT and cells without CPT. (C) Streptavidin pulldown (PD) assay and western blot analysis of the interactions between GST-SIRT6 and biotinylated γH2AX (biotin-γH2AXp) and H2AX peptides (biotin-H2AXp). (D) Streptavidin pulldown assay and western blot analysis of the interactions between biotin-γH2AXp, GST-SIRT6 WT and truncated GST-SIRT6 ΔN and ΔC. (E) Streptavidin pulldown assay and western blot analysis of the interactions between biotin-γH2AXp and GST-SIRT6 WT, K33R and K33Q. (F–I) Laser MicroPoint analysis of SIRT6 recruitment in H2ax+/+ and H2ax–/– MEFs (F–G), and in H2ax–/– MEFs reconstituted with H2AX WT, S139D mimicking hyper-phosphorylation or S139A mimicking hypo-phosphorylation (H–I). PAR immunostaining was used to identify the DNA damage site. Scale bar, 10 μm. The relative fluorescence intensity was calculated by Fiji (Image J) (G and J). The data represent the means ± s.e.m., **p<0.01, ns: not significant, n = 10.
Figure 5—figure supplement 1
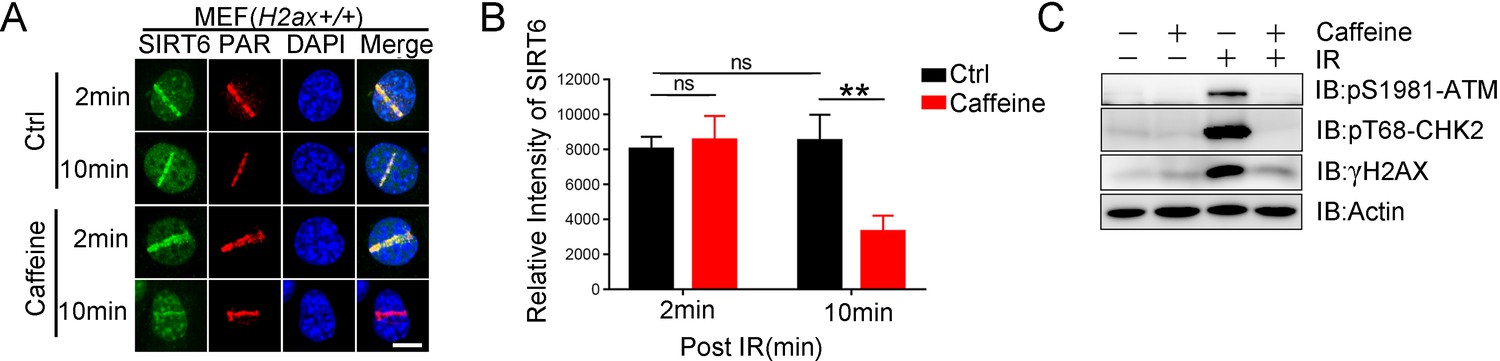
SIRT6 recruitment in cells treated with caffeine.
(A) Laser MicroPoint analysis of SIRT6 recruitment in MEFs treated with caffeine (5 mM) 1 hr. Scale bar, 10 μm. (B) The relative intensity was calculated in Fiji (Image J). The data represent the means ± s.e.m., **p<0.01,n.s.: not significant, n = 10. (C) Western blot analysis of γH2AX, pS1981 ATM and pT68 CHK2 levels in MEFs after caffeine treatment.
Figure 6

SIRT1 facilitates SIRT6 recruitment to chromatin during the DDR.
(A,B) ChIP-qPCR analysis of the SIRT6 levels in the vicinity of a DSB in cells treated with a SIRT1 siRNA (si-SIRT1) or a scrambled negative control (NC). The western blots show the FLAG-SIRT6 and SIRT1 protein levels. The data represent the means ± s.e.m., *p<0.05, n = 3. (C,D) GFP-SIRT6 was introduced into Sirt1+/+ and Sirt1–/– MEFs and the fluorescence signal was captured at various time points after laser-induced DNA damage. Representative images are shown (C). The white dashed circles indicate the damage sites. Scale bar, 10 μm. The relative intensity was calculated in Image J (D). The data represent the means ± s.e.m., **p<0.01, ns: not significant, n = 30. (E,F) ChIP-qPCR analysis of the SIRT1 levels in the vicinity of a DSB in cells treated with SIRT6 siRNA (si-SIRT6) or NC. The western blots show the FLAG-SIRT1 and SIRT6 protein levels. The data represent the means ± s.e.m., ns: not significant, n = 3, determined by Student t test. (G–H) GFP-SIRT1 was introduced into Sirt6+/+ and Sirt6–/– MEFs and the fluorescence signal was captured after laser-induced damage at various time points. Representative images are shown. The red dashed lines indicate laser-induced damage sites. Scale bar, 10 μm. The data represent the means ± s.e.m., ns: not significant, n = 32.
Figure 7 with 5 supplements
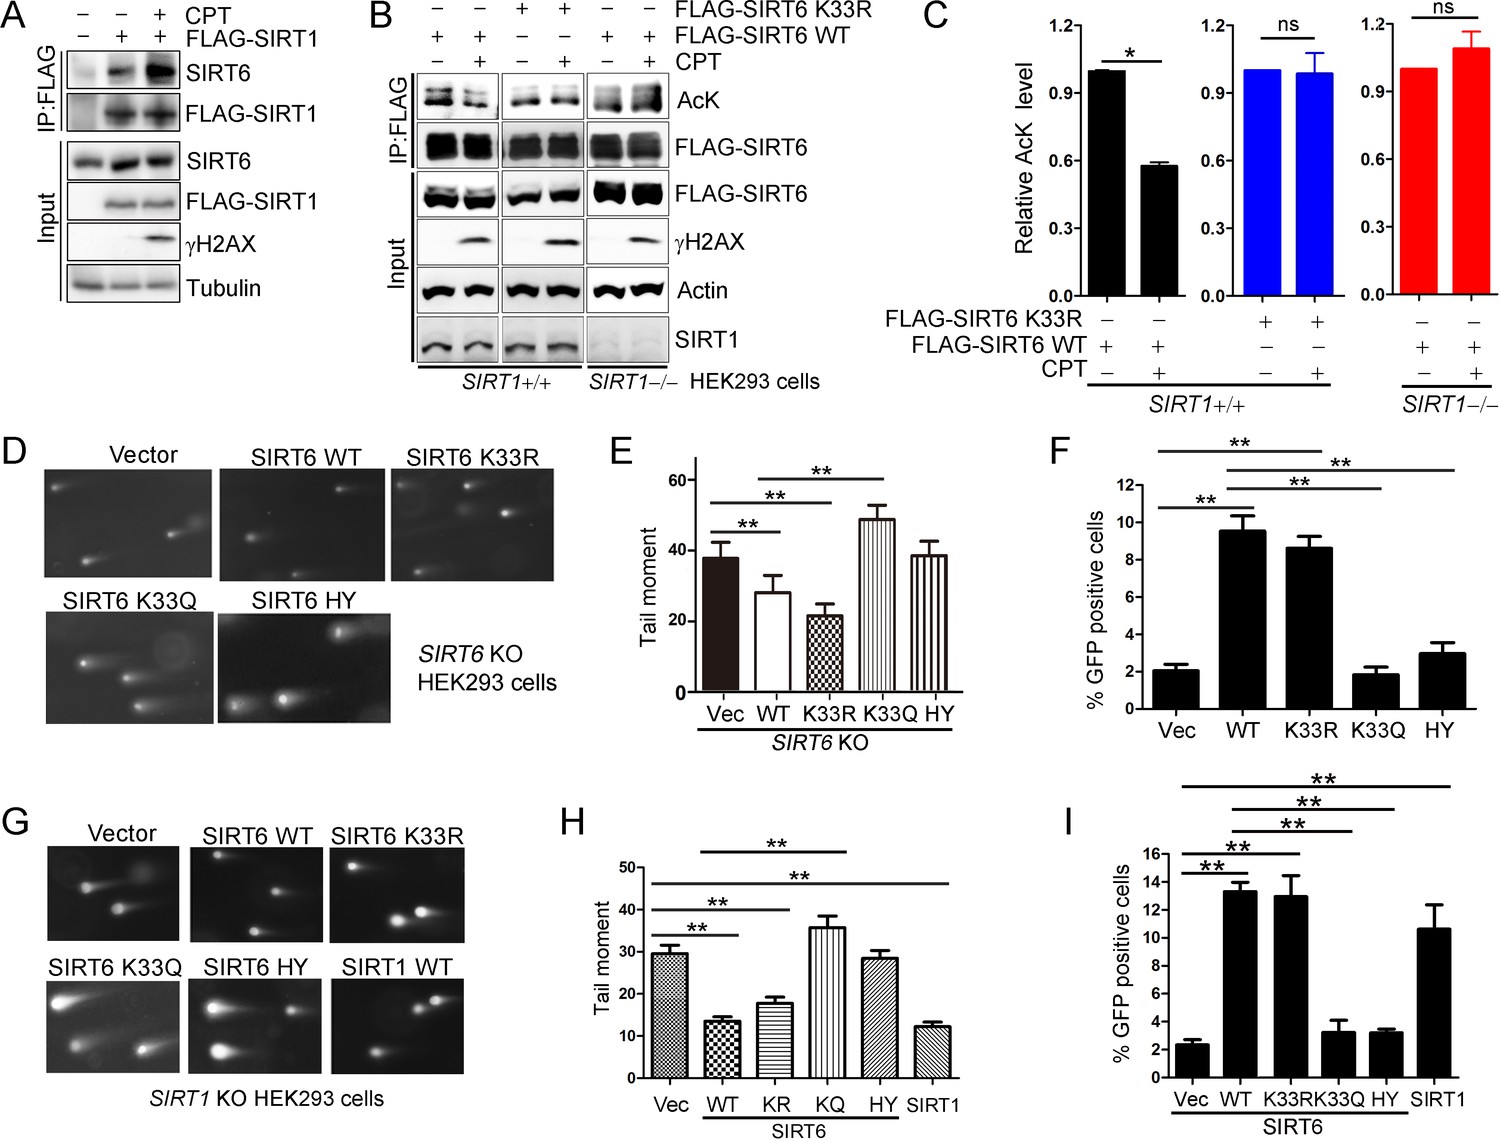
SIRT6 rescues DNA repair defects caused by a SIRT1 deficiency.
(A) Co-IP and western blot analysis of the interaction of FLAG-SIRT1 and SIRT6 in HEK293 cells overexpressing FLAG-SIRT1 and treated with CPT (1 μM) for 1 hr. (B–C) The acetylation level of SIRT6 WT and K33R SIRT1+/+ and SIRT1–/– HEK293 cells treated or not with CPT (1 μM) for 1 hr. The intensity of acetylated bands was quantified by Image J and normalized to scramble control. The data represent the means ± s.e.m., *p<0.05, ns: not significant, n = 3. (D–E) Representative images of comet assay in FLAG-SIRT6, K33R, K33Q and HY reconstituted SIRT6 KO cells treated with CPT for 1 hr (D). Tail moment were calculated by software Open Comet. The data represent the means ± s.e.m., **p<0.01, n = 50. (F) HR assay in U2OS cells ectopically expressing FLAG-SIRT6, K33R, K33Q or HY. The percent GFP-positive cells was calculated. The data represent the means ± s.e.m., **p<0.01, n = 3. (G–H) Comet assay in SIRT1–/– HEK293 cells transfected with FLAG-SIRT6, K33R, K33Q, HY and SIRT1 and treated with CPT for 1 hr. Tail moment were calculated by software Open Comet. The data represent the means ± s.e.m., **p<0.01, n = 50. (I) HR assay in SIRT1–/– HEK293 cells ectopically expressing FLAG-SIRT6, K33R, K33Q, HY and SIRT1-WY. The percent GFP positive cells was calculated. The data represent the means ± s.e.m., **p<0.01, n = 3.
Figure 7—figure supplement 1
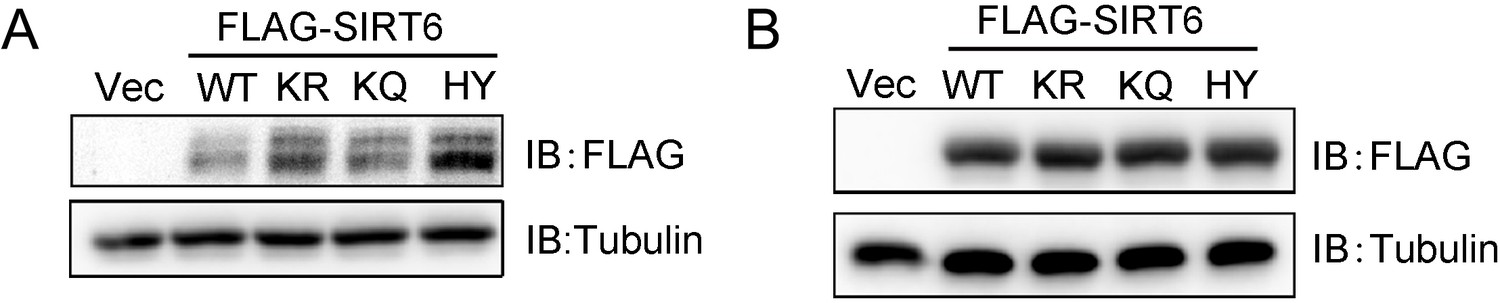
SIRT6 levels in SIRT6–/– cells.
(A) Western blots showing SIRT6 protein levels in SIRT6–/– HEK293 cells transfected with FLAG-SIRT6 WT, K33R, K33Q and H133Y constructs. Related to Figure 7D,E. (B) Western blots showing SIRT6 protein levels in SIRT6–/– HEK293 cells transfected with FLAG-SIRT6 WT, K33R, K33Q and H133Y constructs. Related to Figure 7F.
Figure 7—figure supplement 2
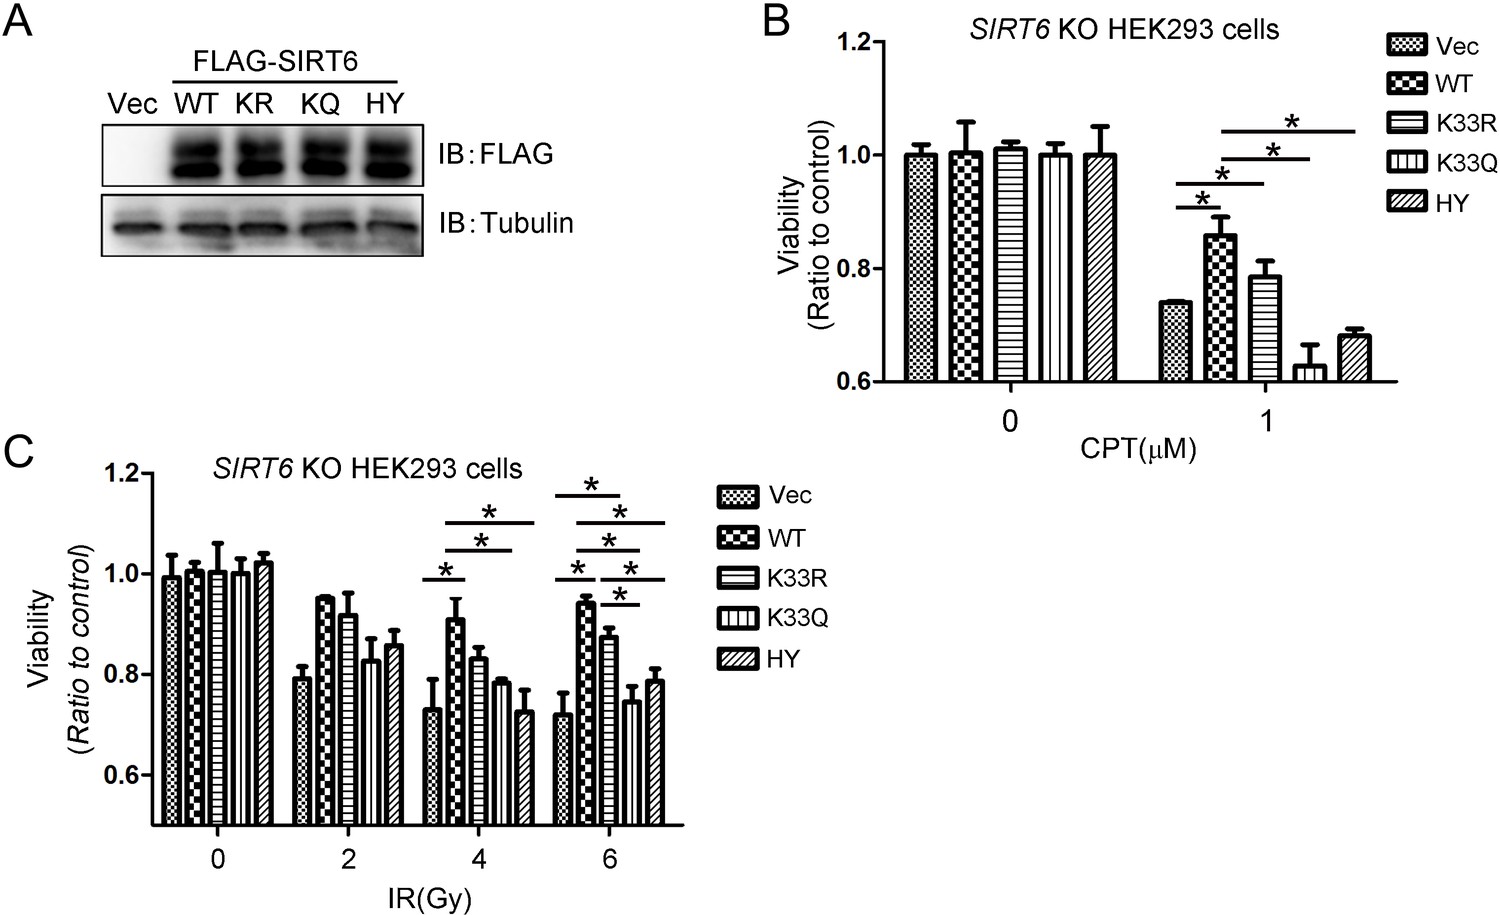
Cell viability assay in SIRT6–/– cells.
(A) Western blots showing SIRT6 protein levels in SIRT6–/– HEK293 cells transfected with FLAG-SIRT6 WT, K33R, K33Q or H133Y constructs. (B) Cell viability of SIRT6–/– HEK293 cells expressing ectopic FLAG-SIRT6, K33R, K33Q or H133Y was assessed by MTS assay after CPT (1 μM) treatment at 48 hr. (C) Cell viability of SIRT6–/– HEK293 cells expressing ectopic FLAG-SIRT6, K33R, K33Q or H133Y was assessed by MTS assay after IR (2 Gy, 4 Gy, 6 Gy) at 48 hr. The data represent the means ± s.e.m., *p<0.05, n = 3.
Figure 7—figure supplement 3
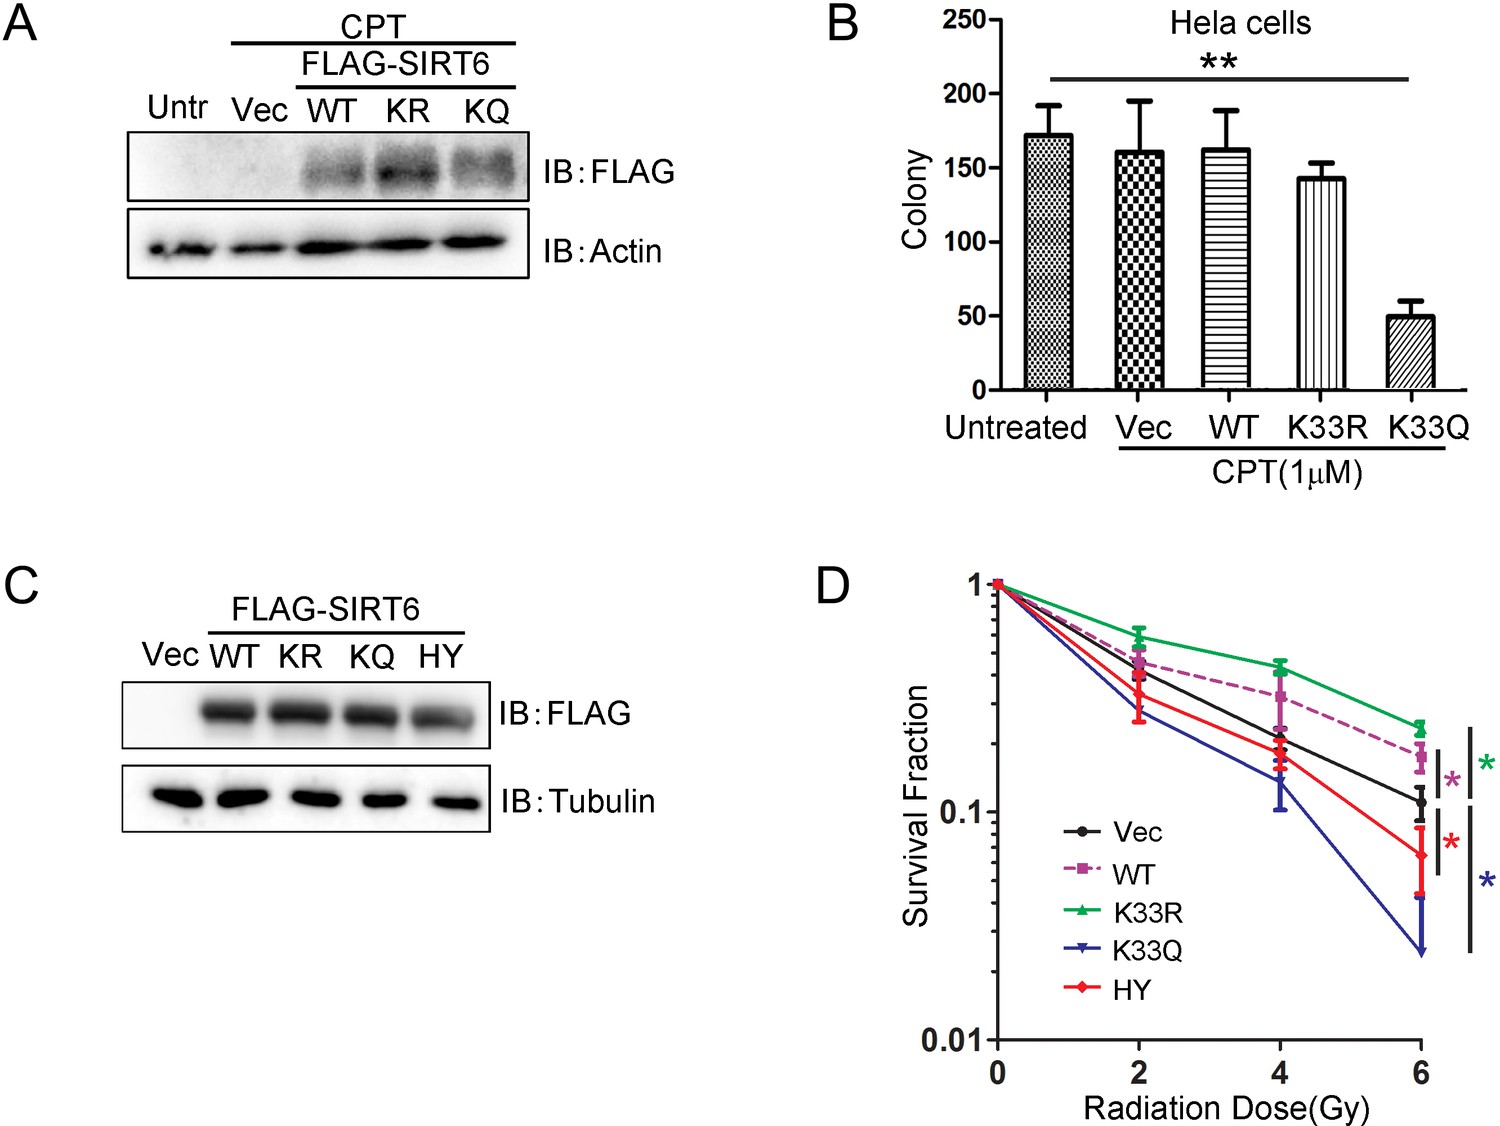
Colony-forming ability of HeLa cells.
(A) Western blots showing SIRT6 protein levels in HeLa cells stably transfected with FLAG-SIRT6 WT, K33R, K33Q constructs. (B) Colony-forming assay in HeLa cells ectopically expressing FLAG-SIRT6, K33R or K33Q. The data represent the means ± s.e.m., **p<0.01, n = 3. (C) Western blots showing SIRT6 protein levels in HeLa cells stably transfected with FLAG-SIRT6 WT, K33R, K33Q or H133Y constructs. (D) Colony-forming assay in HeLa cells stably overexpressing ectopic FLAG-SIRT6 WT, K33R, K33Q or H133Y after radiation at indicated dose. The data represent the means ± s.e.m., *p<0.05, n = 3.
Figure 7—figure supplement 4
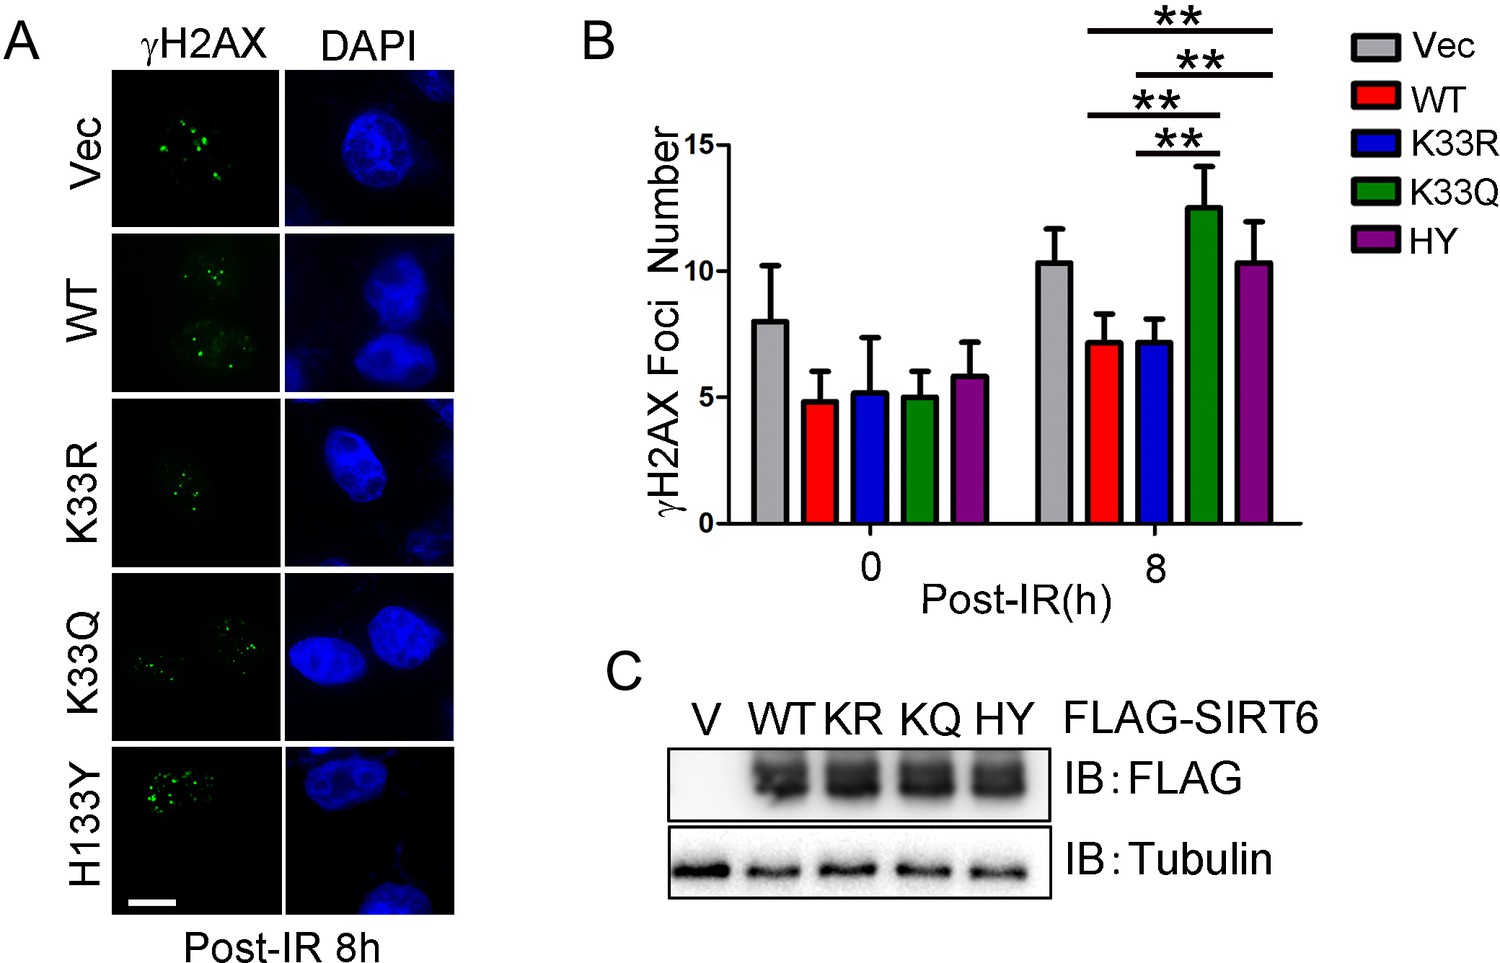
γH2AX foci in HeLa cells.
(A) Immunofluorescence staining of γH2AX foci in HeLa cells expressing ectopic FLAG-SIRT6 WT, K33R, K33Q or H133Y at 8 hr after radiation. Scale bar, 10 μm. (B) Quantification of γH2AX foci-positive cells (>5 foci per cell). A total of 100 cells per sample was counted. The data represent the means ± s.e.m., **p<0.01, n = 3.
Figure 7—figure supplement 5
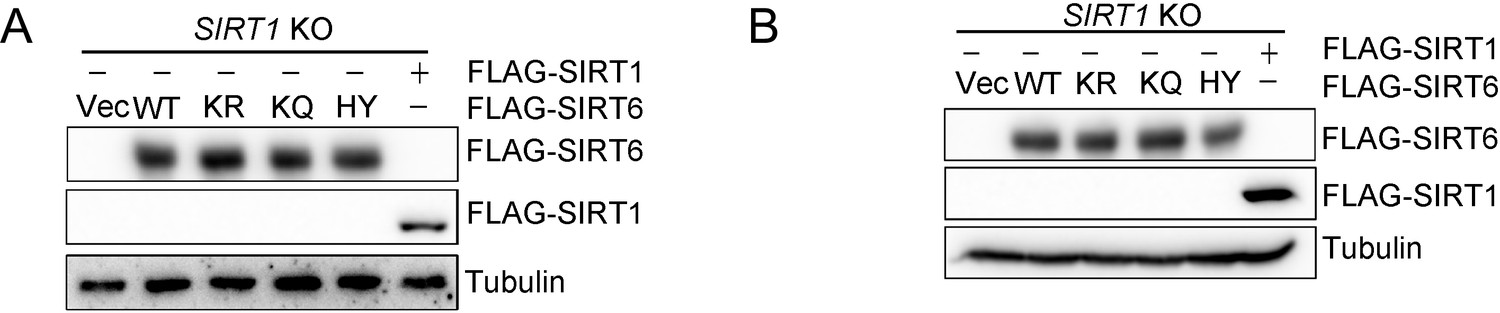
SIRTs levels in SIRT1–/– cells.
(A) Western blots showing SIRT6 and SIRT1 levels in SIRT1–/– cells transfected with SIRT6 WT, K33R, K33Q, H133Y or SIRT1 constructs. (B) Western blots showing SIRT6 and SIRT1 levels in SIRT1–/– cells transfected with SIRT6 WT, K33R, K33Q, H133Y or SIRT1 constructs.
Figure 8
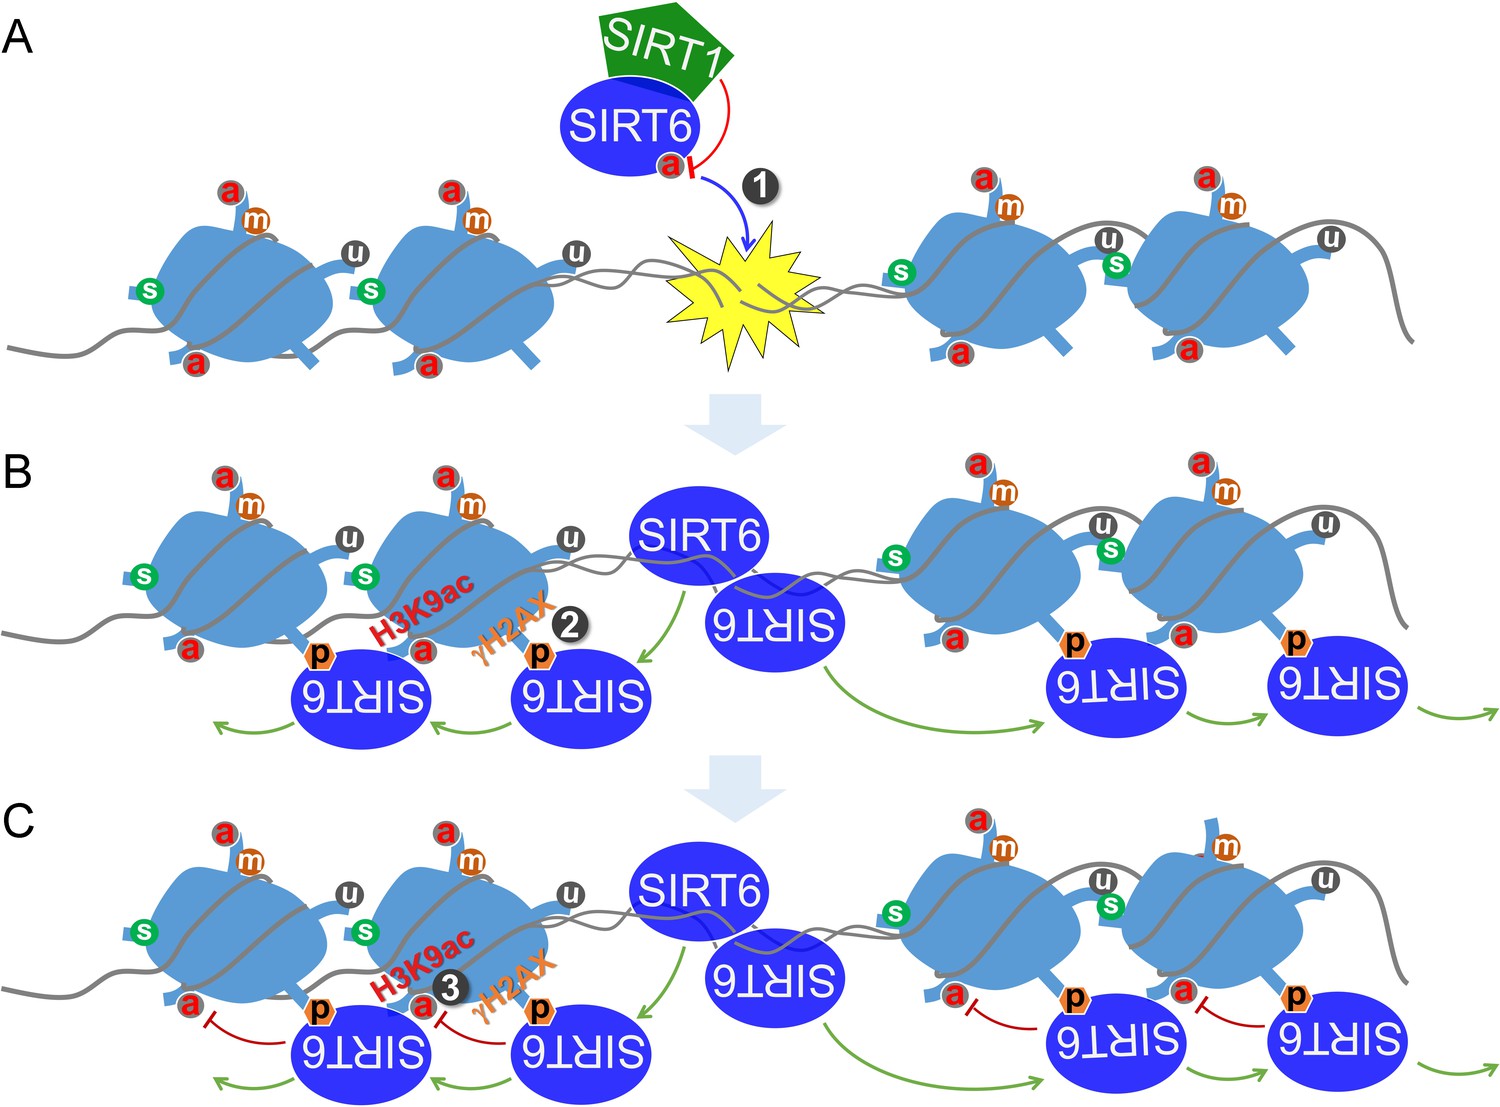
A working model.
(A) SIRT6 is deacetylated by SIRT1 at K33, which promotes SIRT6 polymerization and recognition of DSBs. (B) Beyond DSBs, K33-deacetylated SIRT6 anchors to γH2AX and expands on local chromatin flanking DSBs. (C) SIRT6 mediates local chromatin remodeling via deacetylating H3K9ac and/or H3K56ac.
Tables
Key resources table
| Reagent type (species) or resource | Designation | Source or reference | Identifiers | Additional information |
|---|---|---|---|---|
| Gene (Homo sapiens) | SIRT6 | National Center for Biotechnology Information | Gene ID: 51548 | |
| Gene (Homo sapiens) | SIRT1 | National Center for Biotechnology Information | Gene ID: 23411 | |
| Gene (Mus musculus) | H2ax | National Center for Biotechnology Information | Gene ID: 15270 | |
| Gene (Homo sapiens) | H2AX | National Center for Biotechnology Information | Gene ID: 3014 | |
| Cell line (Homo sapiens) | HEK293 | ATCC | ATCC CRL-1573 | |
| Cell line (Homo sapiens) | HeLa | ATCC | ATCC CRM-CCL-2 | |
| Cell line (Mus musculus) | MEF | Dr Linyu Lu (Zhejiang University, China) | ||
| Cell line (Mus musculus) | H2ax-/- MEF | Dr Linyu Lu (Zhejiang University, China) | ||
| Antibody | SIRT6 (rabbit, polyclonal) | Abcam (Cambridge, UK) | Cat# ab62738, RRID:AB_956299 | Applications: WB; Dilution: 1:1000;Immunofluorescence; Dilution:1:100 |
| Antibody | SIRT1 (mouse, monoclonal) | Cell Signaling Technology | Cat# 8469, RRID:AB_10999470 | Applications: WB;Dilution:1:1000;Immunofluorescence; Dilution:1:100 |
| Antibody | FLAG (mouse, monoclonal) | Sigma-Aldrich | Cat# F1804; RRID:AB_262044 | Applications: WB; Dilution: 1:1000; Chromatin immunoprecipitation |
| Antibody | HA (mouse, monoclonal) | Sigma-Aldrich | Cat# H3663; RRID:AB_262051 | Applications: WB; Dilution: 1:1000 |
| Antibody | GST(mouse, monoclonal) | Cell Signaling Technology | Cat# 2624, RRID:AB_2189875 | Applications: WB; Dilution: 1:1000 |
| Antibody | γH2AX (rabbit, monoclonal) | Abcam (Cambridge, UK) | Cat# ab81299; RRID:AB_1640564 | Applications: WB; Dilution: 1:1000 |
| Antibody | H3K9ac (rabbit, polyclonal) | EMD Millipore | Cat# 07–352; RRID:AB_310544 | Applications: WB; Dilution: 1:1000 |
| Antibody | H3K56ac(Rabbit, Polyclonal) | EMD Millipore | Cat# 07–677, RRID:AB_390167 | Applications: WB; Dilution: 1:1000 |
| Antibody | acetyl Lysine (Rabbit, Polyclonal) | Abcam (Cambridge, UK) | Cat# ab80178, RRID:AB_1640674 | Applications: WB; Dilution: 1:1000 |
| Transfected construct (Homo sapiens) | pDR-GFP | Addgene (Cambridge, MA) | RRID:Addgene_26475 | |
| Commercial assay or kit | CycLex SIRT6 Deacetylase Fluorometric Assay Kit | MBL life science | CY-1156V2 | |
| Chemical compound, drug | Ex527 | Sigma-Aldrich | E7034 | |
| Chemical compound, drug | Trichostatin A | Sigma-Aldrich | T1952 | |
| Chemical compound, drug | Nicotinamide | Sigma-Aldrich | N3376 | |
| Chemical compound, drug | Camptothecin | Sigma-Aldrich | C9911 | |
| Software, algorithm | GraphPad Prism | GraphPad | RRID:SCR_002798 |
Additional files
-
Supplementary file 1
Acetylated K residues of SIRT6 identified by LC-MS/MS.
- https://cdn.elifesciences.org/articles/55828/elife-55828-supp1-v2.xlsx
-
Transparent reporting form
- https://cdn.elifesciences.org/articles/55828/elife-55828-transrepform-v2.docx
Download links
A two-part list of links to download the article, or parts of the article, in various formats.
Downloads (link to download the article as PDF)
Open citations (links to open the citations from this article in various online reference manager services)
Cite this article (links to download the citations from this article in formats compatible with various reference manager tools)
Synergy between SIRT1 and SIRT6 helps recognize DNA breaks and potentiates the DNA damage response and repair in humans and mice
eLife 9:e55828.
https://doi.org/10.7554/eLife.55828


