Whole-brain mapping of socially isolated zebrafish reveals that lonely fish are not loners
- The Wolfson Institute for Biomedical Research, University Street, University College London, United Kingdom
- Sainsbury Wellcome Centre, Howland Street, University College London, United Kingdom
Figures
Figure 1 with 1 supplement
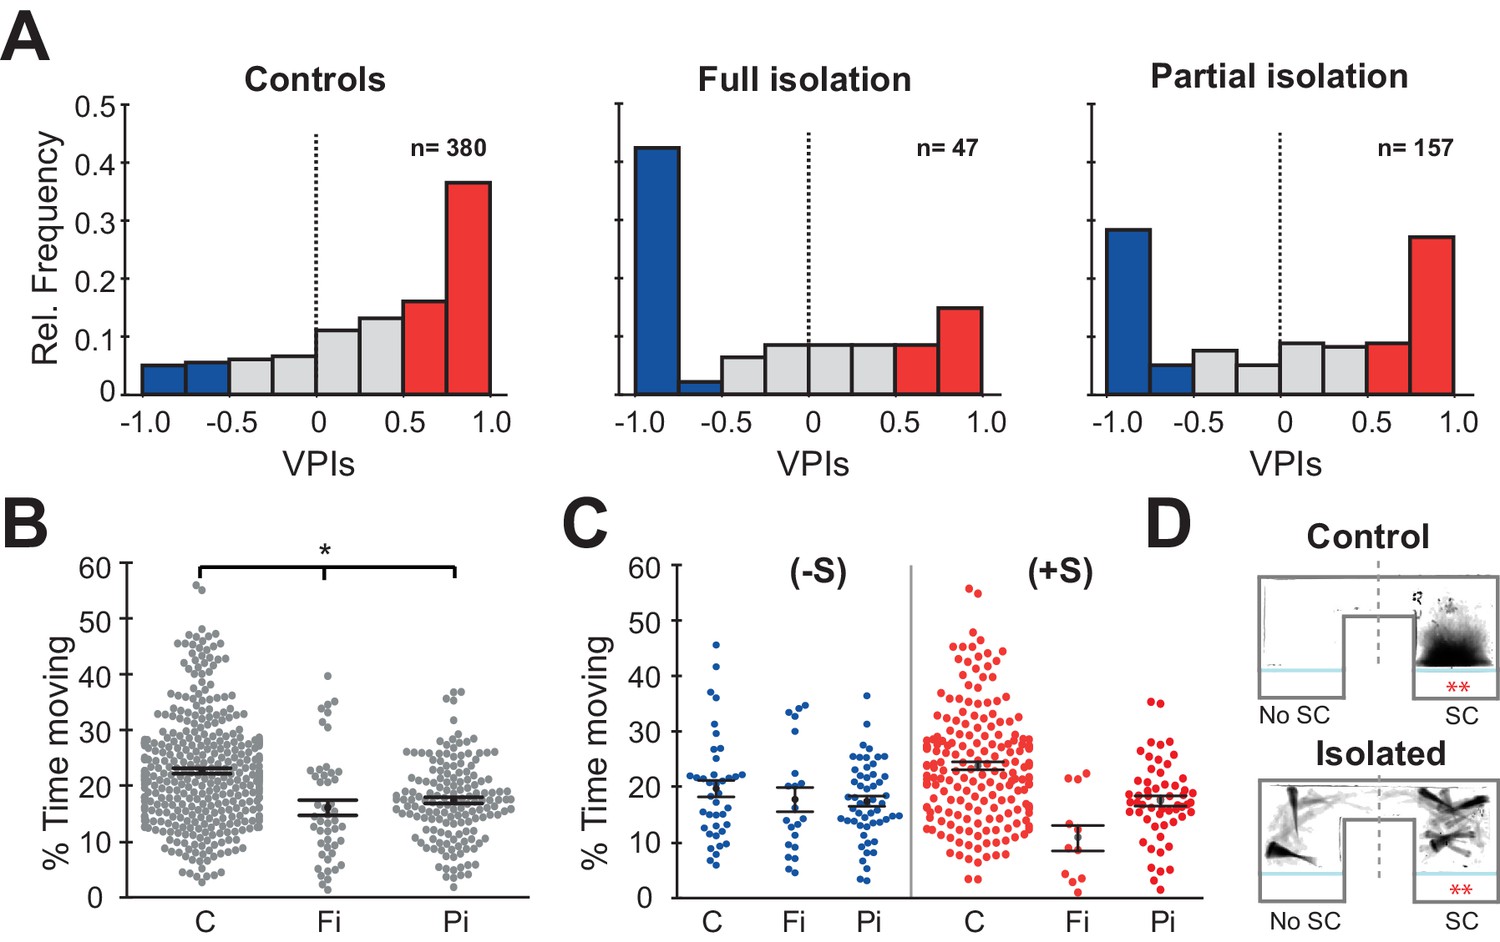
Isolation alters social preference behavior and swimming activity.
(A) Histograms of all the VPIs during the social cue period across different conditions: controls (C, left), full isolation (Fi, middle), and partial isolation (Pi, right). For visual clarity, red bars highlight strong pro-social fish (+S, VPIs > 0.5), blue bars anti-social fish(-S, VPIs < -0.5), and gray non-social fish (ns, -0.5 < VPI < +0.5). (B) Swarm plots comparing the activity levels of fish during the acclimation period expressed as percent time moving (C, n=380; Fi, n=47; Pi, n=157). Mean and standard errors are shown. (C) Swarm plots comparing the activity levels of anti-social (left) and social (fish) fish during visual social cue exposure for each rearing condition (C (-S), n=39; Fi (-S), n=21; Pi (-S), n=53) or (C (+S), n=193; Fi, n=11; Pi (+S), n=57). (D) Time projection through the video of a pro-social control, C(+S), and a fully isolated, Fi(+S), fish during social cue exposure. The dashed lines mark the division between the social cue side (SC) and the side without social cues (No SC) that was used to calculate VPI.
Figure 1—figure supplement 1
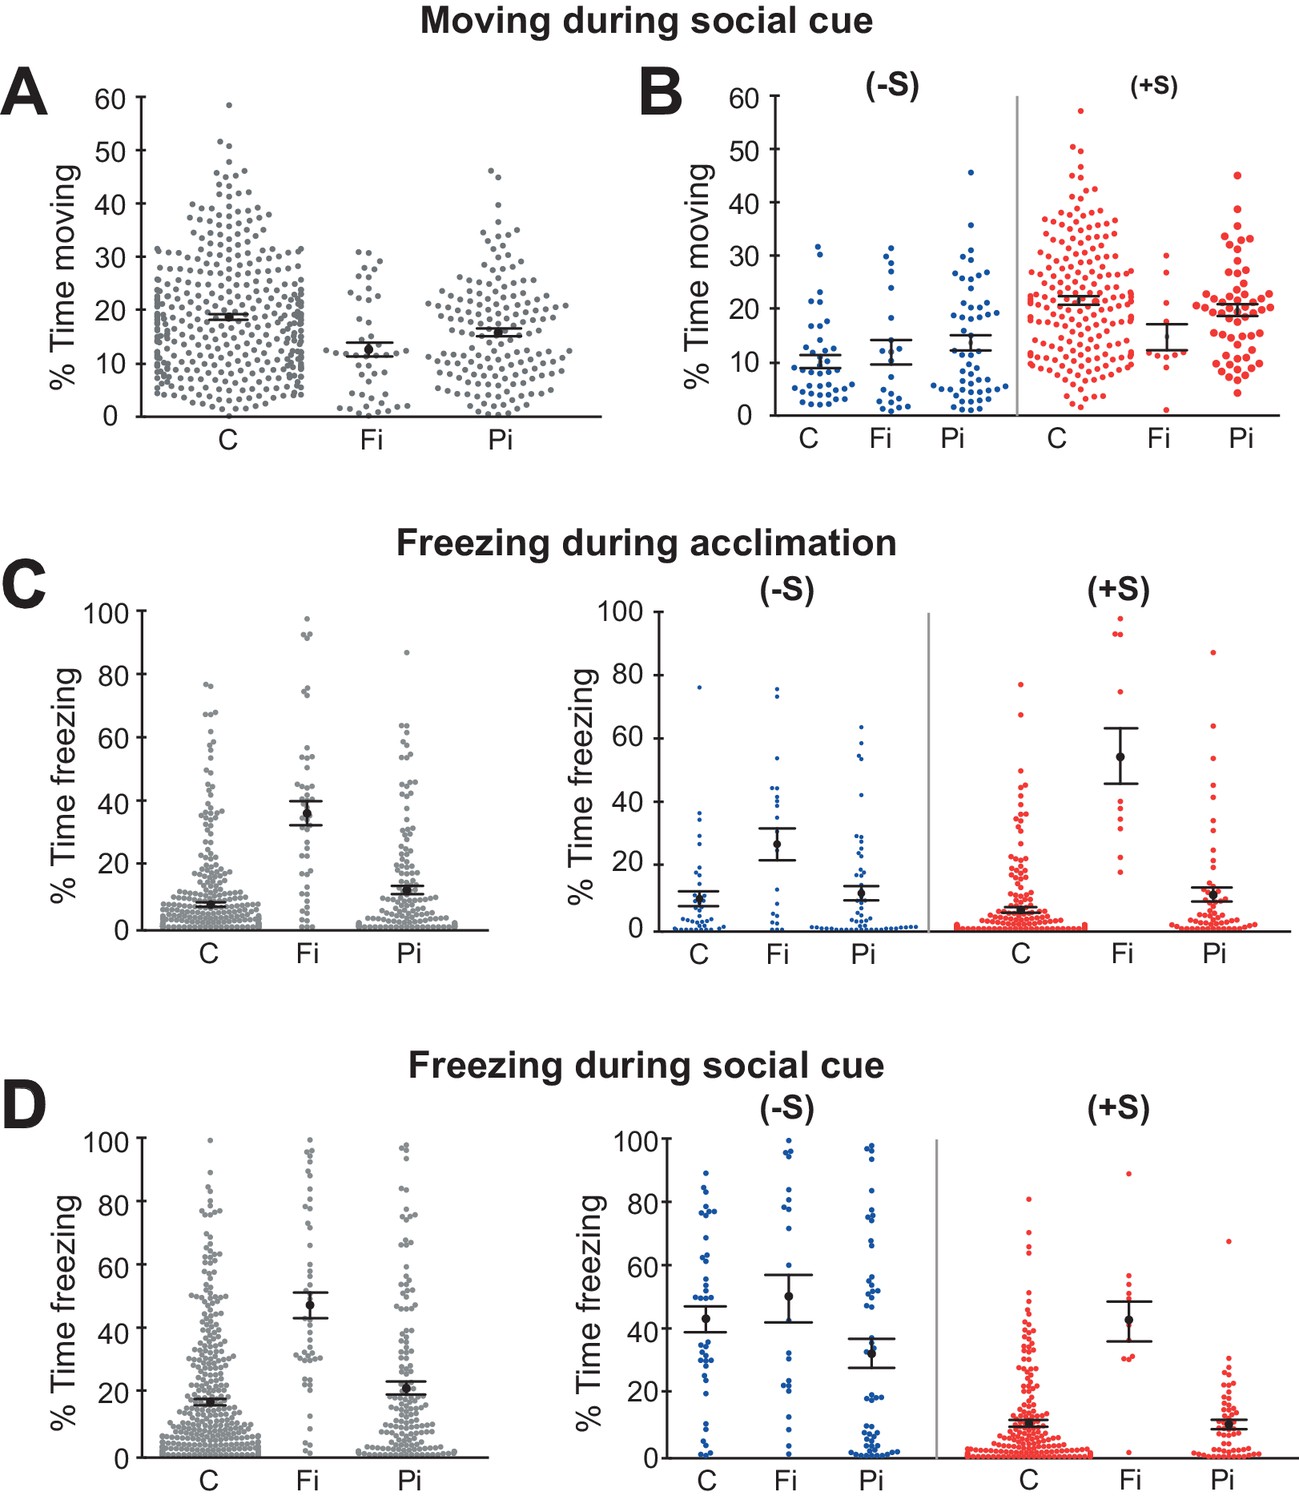
Isolation alters social preference behaviour and swimming activity.
(A) Swarm plots comparing the activity levels of fish during the social period expressed as percentage time moving for each rearing condition (C, n = 380; Fi, n = 47; Pi, n = 157). Mean and standard errors are shown. (B) Swarm plots comparing the activity levels of anti-social (-S) and pro-social (+S) fish during visual social cue exposure for each rearing condition (anti-social C n = 39; Fi n = 21; Pi n = 53) or social (C n = 193; Fi n = 11; Pi n = 57). (C) (Left) Swarm plots comparing freezes (movement pauses longer than 3 s) for the same groups in A during the acclimation period expressed as percentage time freezing for each rearing condition. (Right) Swarm plots comparing freezes for the separated anti-social (-S) and pro-social (+S) groups in B during the acclimation period. (D) Same presentation as C for the social cue period.
Figure 2
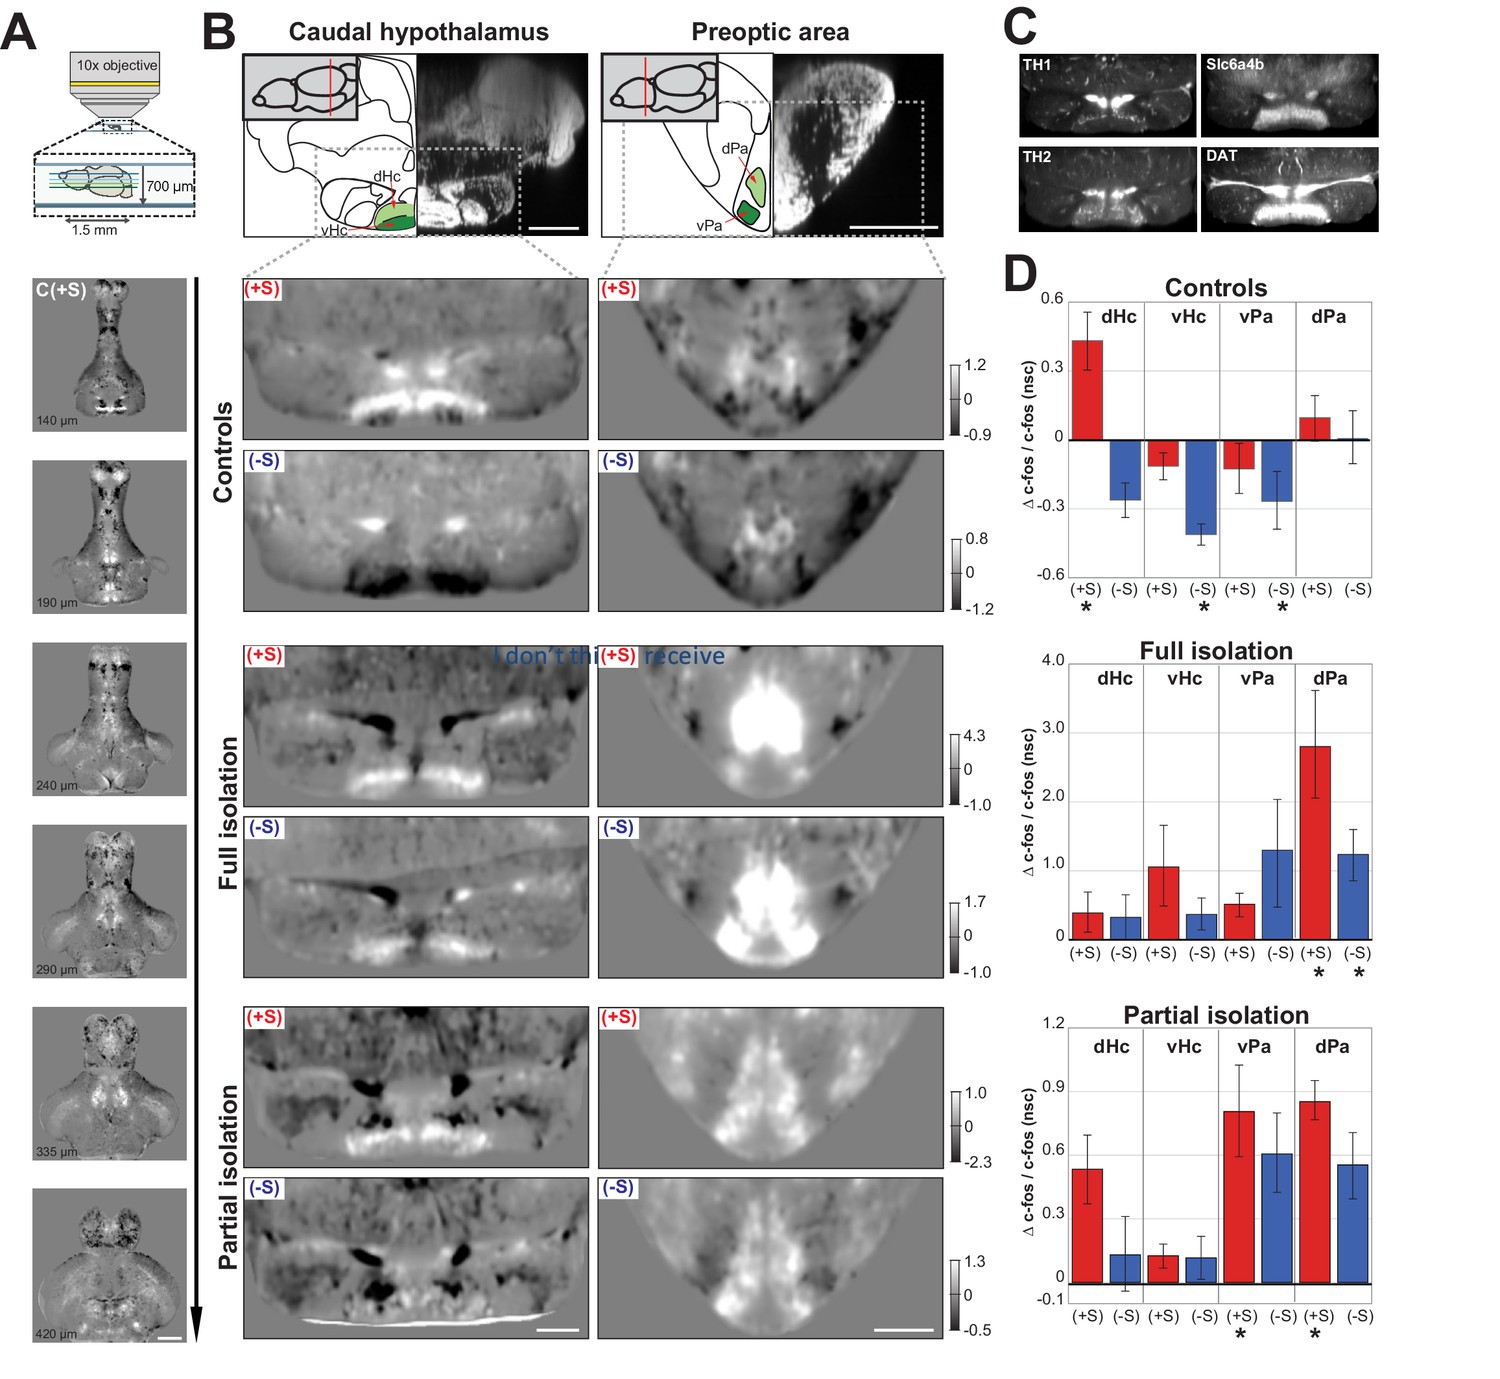
Functional maps of the social brain in normal and isolated fish.
(A) Schematic of the custom-built two-photon microscope used for acquiring whole-brain volumes of dorsal-down mounted fish brains (top panel). Horizontal sections of pro-social control fish (C(+S)) responses at increasing imaging depth (lower panels). Images are average differences between (C(+S)) and siblings not presented with a social cue. Positive values (white) indicate increased cFos expression in socially preferring fish, while negative values (black) indicate decreased expression. Scale bar is 200μm. The intensity scale bar is shown in B, C(+S) row. (B) Region analysis of two different brain areas that have been implicated in social behavior: caudal hypothalamus and preoptic area. A schematic of the anatomical regions and corresponding DAPI staining is shown (top panel) with two sub-regions highlighted in green. Images showing changes in cFos activation in these areas for pro- (+S) and anti-social (-S) controls, fully isolated, and partially isolated fish are shown. Images are horizontal sections of the average difference between each test group and their corresponding sibling group not presented with a social cue. Scale bar is 100μm. Intensity scale bar is shown for each group. (C) Average image of TH1, TH2, Slc6a4b, and DAT expression in the same section of the caudal hypothalamus as 2B (n=3 each). Scale bar is 100μm. (D) Summary graphs showing the change in cFos activation for four different brain areas calculated by using the average difference images shown in (B) and using 3D masks (a single plane of each area of the masks is shown in green in B). Positive values indicate increases in cFos expression; asterisks mark significant changes relative to no social cue siblings. D=dorsal and V=ventral caudal hypothalamus; Pa=ventrolateral preoptic area, PM=dorsal preoptic area.
Figure 3
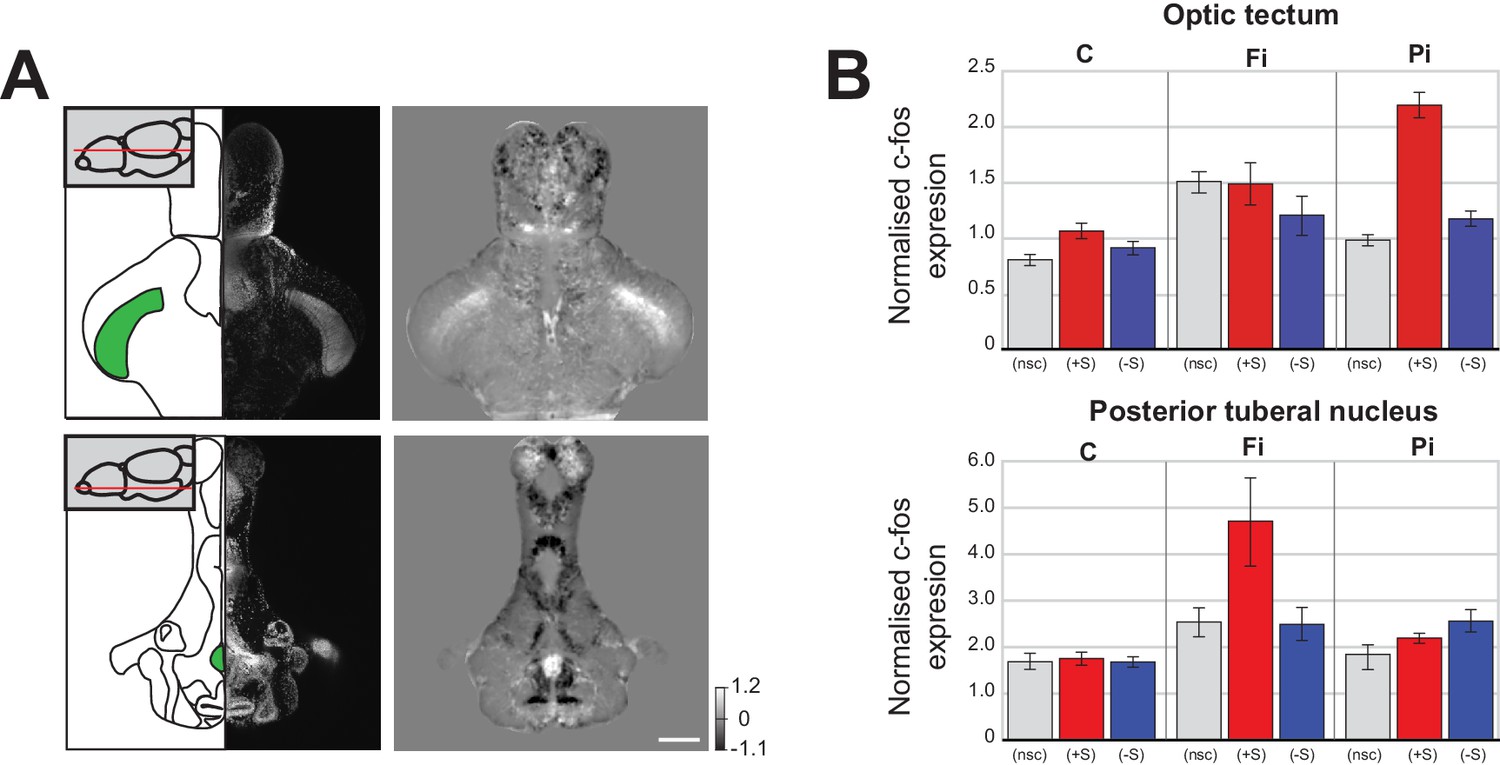
Changes in baseline brain activity following isolation.
(A) Images of two areas that show strong c-fos activation in fully isolated fish independent of social stimuli (optic tectum and posterior tuberal nucleus (PTN)). Schematics of the horizontal sections and corresponding DAPI image are shown in the left panels. One plane of the 3D mask regions used for subsequent analysis is indicated (green). Images of Fully isolated fish c-fos neuronal activity, calculated as average differences between fully isolated (Fi) fish and normally raised fish without social cues (nsc) are shown in the right panels. Scale bar 200 μm. (B) Summary graphs showing the normalised c-fos expression in the optic tectum and PTN 3D masks for each experimental condition: non social cue (nsc), pro-social (+S) and anti-social (-S) for all the controls (C), fully isolated (Fi), and partially isolated (Pi) fish.
Figure 4 with 1 supplement

Buspirone rescues social preference in isolated fish.
(A) Histogram of VPIs during the social cue period in partially isolated (Pi) fish treated with 30 μM and 50 μM of Buspirone (combined). For visual clarity, the bars are colored as in Figure 1. (B) VPI values calculated in one-minute time bins for controls (C, black line, n=380), partial isolated (Pi, blue line, n=157), and Pi treated with Buspirone (Pi+B, green line, n=118). Note how Buspirone treated fish recover normal social preference within the first 5 minutes. (C) Percentage of time moving calculated in one-minute bins for the same fish as B, thin lines indicate standard error.
Figure 4—figure supplement 1
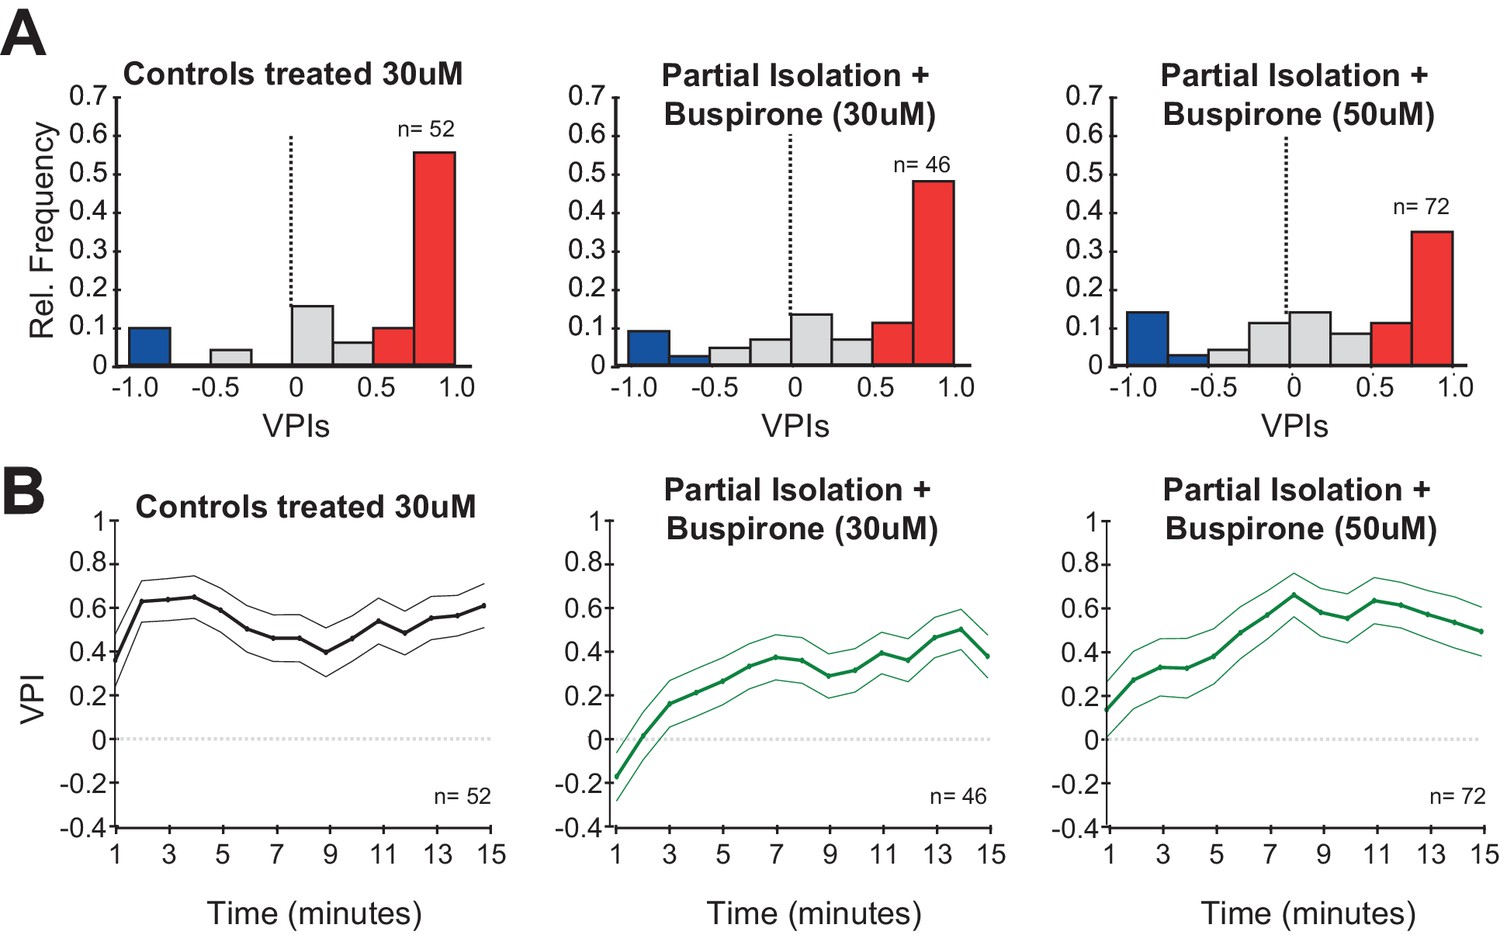
Buspirone rescues social preference in isolated fish.
(A) Histograms of VPIs during the social cue period in control fish treated with 30 μM of Buspirone and in partially isolated fish treated with 30 μM and 50 μM of Buspirone. The bars are coloured as in Figure 1. (B) VPI values calculated in one-minute time bins for controls treated with 30 μM of Buspirone, Pi fish treated with 30 μM, and Partially isolated fish treated with 50 μ M of Buspirone, thin lines indicate standard error.
Videos
Video 1
Example of a control and a fully isolated +S fish video during social cue presentation.
Two minutes of behaviour is shown in 20 s (6x playback acceleration). The control fish shows a strong social preference for the social cue and has a stereotypical social phenotype (left). The test fish spends most of its time watching the social cue with a 45-degree angle and synchronizing its bout motion with the other two conspecifics. The fully isolated fish spends long periods of time as well on the side of the conspecifics. Its behaviour, however, its characterized by long pauses while watching the conspecifics (right).
Tables
Key resources table
| Reagent type (species) or resource | Designation | Source or reference | Identifiers | Additional information |
|---|---|---|---|---|
| Antibody | Anti- digoxigenin-POD, sheep, polyclonal Fab fragments | Sigma-Aldrich, Rouche | Roche, Cat# 11207733910, RRID:AB_514500 | 1:3000 |
| Sequence-based reagent | cFos _F | This paper | PCR primers | CCGATACACTGCAAGCTGAA |
| Sequence-based reagent | cFos_R | This paper | PCR primers | ATTGCAGGGCTATGGAAGTG |
| Peptide, recombinant protein | Proteinase K | Sigma-Aldrich | Cat# P6556-10MG | 2 mg/ml |
| Commercial assay | TSA Plus Cyanine three system | Sigma-Aldrich, Perkin Elmer | Cat# NEL74401KT | Dilution 1:50 |
| Chemical compound, drug | Buspirone hydrochloride | Sigma-Aldrich | Cat# B7148-1G | 30 uM and 50 uM |
| Software, algorithm | Anaconda, Spyder | Anaconda (https://www.anaconda.com/) | Spyder, RRID:SCR_017585 | Version 4.0.1 |
| Software | ImageJ | NIH (http://imagej.nih.gov/ij/) | RRID:SCR_003070 | |
| Software | ANTs- Advanced Normalisation Tools | http://stnava.github.io/ANTs/ | RRID:SCR_004757 | Version 2.1.0 |
| Other | DAPI staining | Sigma-Aldrich | Cat# D9564-10MG | 1 mg/ml |
| Other | Slc6a4b RNA probe | Norton et al., 2008 | ||
| Other | DAT RNA probe | Filippi et al., 2010 | ||
| Other | Th1 RNA Probe | Filippi et al., 2010 | ||
| Other | Th2 RNA probe | Filippi et al., 2010 |
Additional files
Download links
A two-part list of links to download the article, or parts of the article, in various formats.
Downloads (link to download the article as PDF)
Open citations (links to open the citations from this article in various online reference manager services)
Cite this article (links to download the citations from this article in formats compatible with various reference manager tools)
Whole-brain mapping of socially isolated zebrafish reveals that lonely fish are not loners
eLife 9:e55863.
https://doi.org/10.7554/eLife.55863


