Obesity causes selective and long-lasting desensitization of AgRP neurons to dietary fat
- UCSF Department of Medicine, United States
- Howard Hughes Medical Institute, United States
- Northwestern University Feinberg School of Medicine, Comprehensive Metabolic Core, United States
- UCSF Department of Physiology, United States
- UCSF Neuroscience Graduate Program, United States
- Kavli Institute for Fundamental Neuroscience, United States
Figures
Figure 1 with 1 supplement
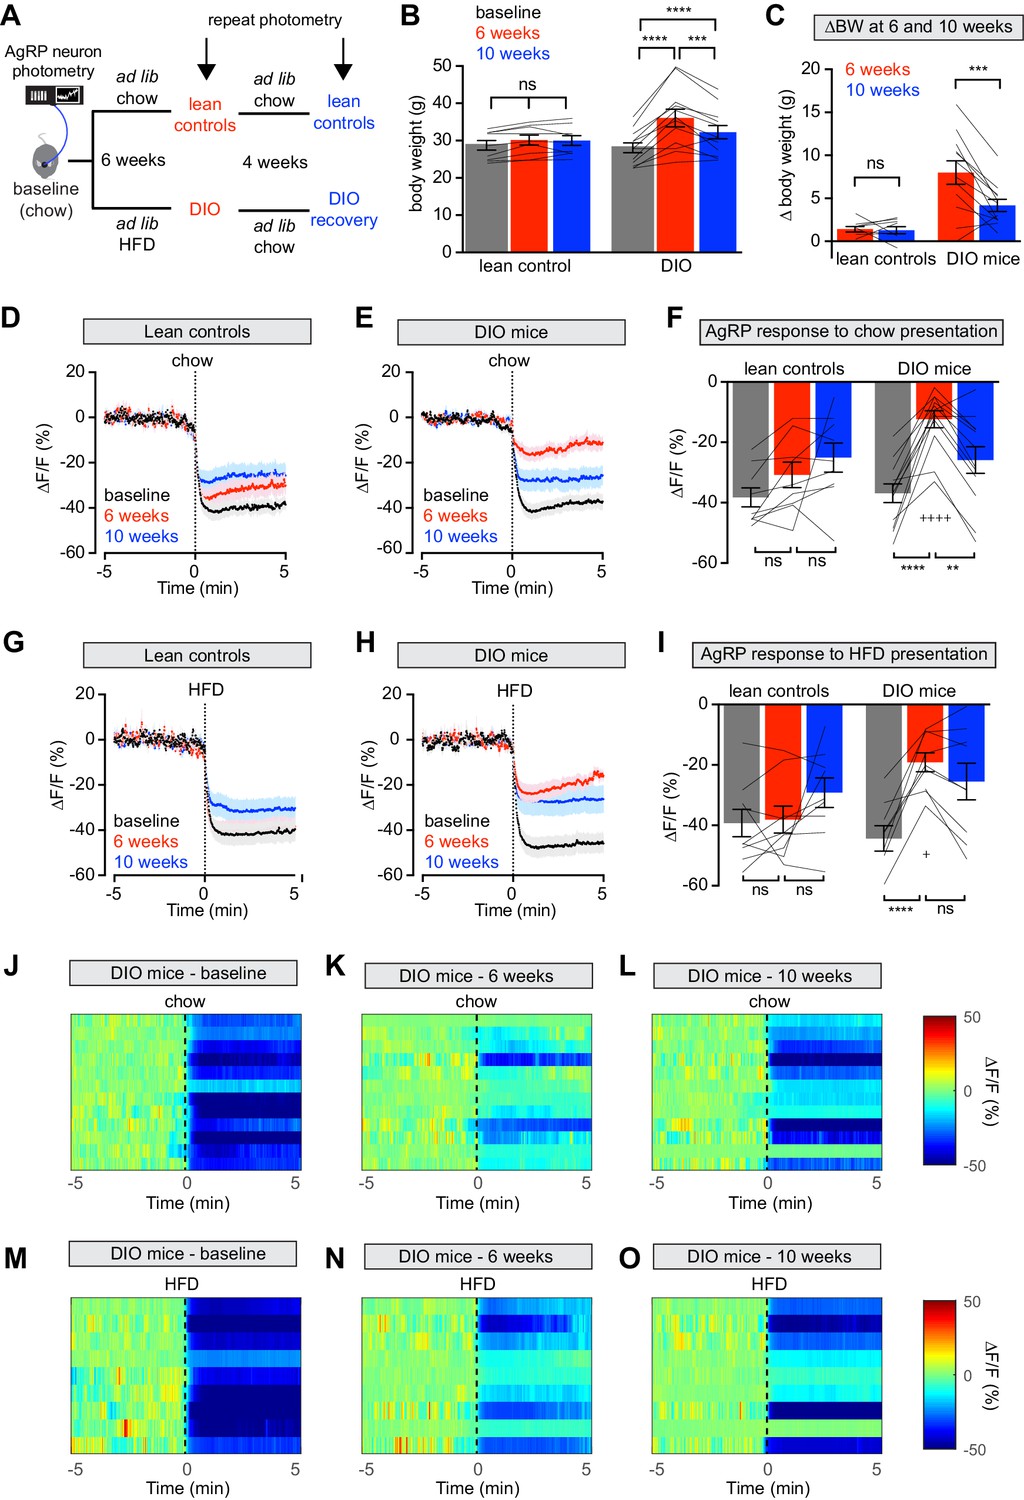
Diet-induced obesity (DIO) reversibly attenuates AgRP neuron inhibition in response to food presentation.
(A) Schematic for the photometry experiments performed in this study. Mice were divided into two cohorts, one of which received chow throughout (lean controls) and one of which was challenged with high-fat diet (HFD) for 6 weeks and then returned to chow for 4 weeks (DIO mice). Baseline recordings were taken from AgRP neurons on day 0, then repeated after 6 weeks on either HFD or chow, and then repeated 4 weeks later after all DIO mice had been returned to chow. (B) Body weights in lean control (left) and DIO (right) mice at baseline, after 6 weeks of chow or HFD, and after an additional 4 weeks of chow (n = 9–12 mice per group). (C) Change in body weight from baseline in mice from (B) (D and E) Calcium signal from AgRP neurons in fasted control (D) and DIO (E) mice presented with chow at baseline (black), after 6 weeks of chow or HFD (red), and after an additional 4 weeks of chow (blue). (n = 9–12 mice per group). (F) Quantification of ΔF/F from (D) and (E) for 5 min after chow presentation. (G and H) Calcium signal from AgRP neurons in fasted control (G) and DIO (H) mice presented with HFD at baseline (black), after 6 weeks of chow or HFD (red), and after an additional 4 weeks of chow (blue). (n = 9 mice per group). (I) Quantification of ΔF/F from (G) and (H) for 5 min after HFD presentation. (J–L) Peri-stimulus heatmaps depicting ΔF/F of AgRP neurons in individual DIO mice (from E) following presentation of chow at baseline (J), 6 weeks (K) and after 4 weeks recovery (L). (M–O) Peri-stimulus heatmaps depicting ΔF/F of AgRP neurons in individual DIO mice (from H) following presentation of HFD at baseline (M), 6 weeks (N) and after 4 weeks recovery (O). *p<0.05, **p<0.01, ***p<0.001 and ****p<0.001 as indicated. +p<0.05, ++++p<0.0001 compared to lean control at the 6 week timepoint. There was no significant difference between lean control and DIO groups at baseline. (D,E,G,H) Traces represent mean ± SEM (B,C,F,I) Lines denote individual mice. Error bars represent mean ± SEM.
Figure 1—figure supplement 1
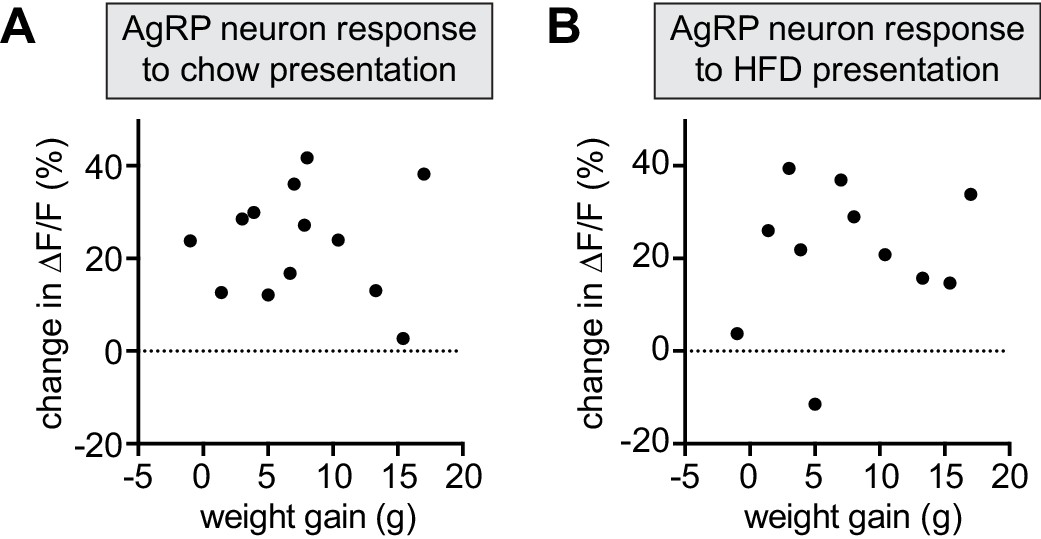
Magnitude of DIO-induced changes in AgRP neuron dynamics are not correlated with amount of weight gain.
(A and B) Change in ∆F/F (response after 6 weeks HFD exposure minus response at baseline) in fasted DIO animals presented with chow (A) or HFD (B) plotted against the weight gain of individual animals. (A) R2 = 0.001, p=0.90 (n = 13 mice) (B) R2 = 0.028, p=0.62 (n = 11 mice).
Figure 2 with 1 supplement

Diet-induced obesity reversibly attenuates fasting induced re-feeding.
(A–D) Animals were maintained on either a chow diet throughout the entire experiment (lean controls, A and C) or exposed to high-fat diet for 6 weeks before being returned to chow diet for an additional 4 weeks (DIO mice, B and D). At 0, 6 and 10 weeks, animals were fasted overnight, and then re-fed for 30 min with chow (A and B) or HFD (C and D) and caloric intake was recorded (n = 8–12 mice per group). **p<0.01, ***p<0.001, ****p<0.0001 as indicated. Lines denote individual mice. Error bars represent mean ± SEM.
Figure 2—figure supplement 1
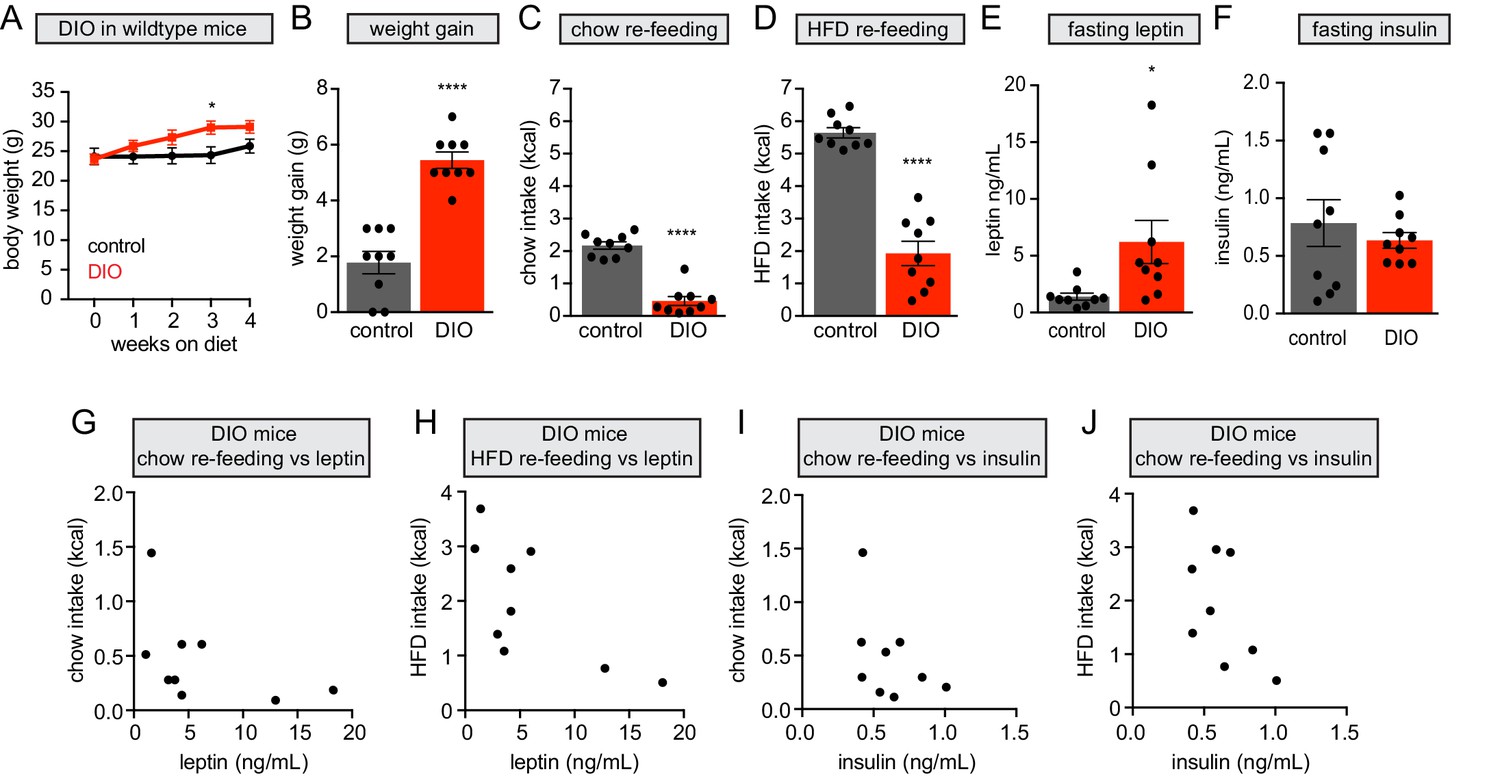
Hyperleptinemia in diet-induced obesity correlates with suppression of fast re-feeding.
(A) Body weight curves in DIO (red) and lean control (black) mice during 4 weeks of dietary intervention (n = 9 mice per group). (B) Weight gain from baseline in mice from (A). (C and D) 30 min chow (C) or HFD (D) re-feeding in overnight-fasted mice from (A) after 4 weeks of dietary intervention. (E and F) Plasma leptin (E) and insulin (F) levels in overnight-fasted mice from (A) after 4 weeks of dietary intervention (G and H) Chow (G) – R2 = 0.237, p=0.18) or HFD (H) - R2 = 0.491, p=0.03) re-feeding versus leptin levels in DIO mice following 4 weeks of HFD (n = 9 mice). (I and J) Chow (I) – R2 = 0.205, p=0.22) or HFD (J) - R2 = 0.368, p=0.08) re-feeding versus insulin levels in DIO mice following 4 weeks of HFD (n = 9 mice). *p<0.05 and ****p<0.0001 in DIO mice compared to lean controls Error bars represent mean ± SEM.
Figure 3
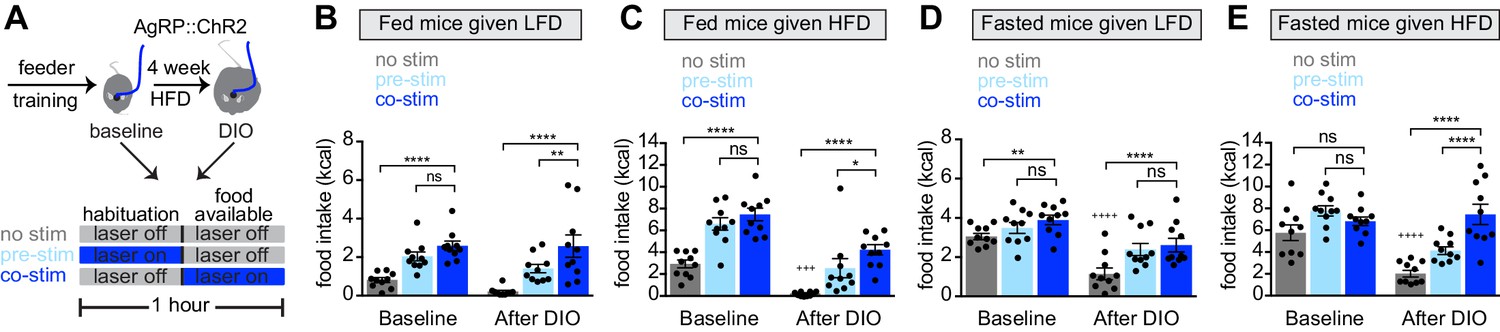
Obesity alters the ability of AgRP neurons to drive food consumption.
(A) Schematic for optogenetic experiments. Animals equipped for optogenetic stimulation of AgRP neurons were trained to retrieve pellets from a feeder then exposed to three optical stimulation (stim) conditions on different days. All sessions consisted of 30 min habituation without food availability followed by 30 min of food availability. During no stim sessions, the laser remained off throughout this duration. During pre-stim sessions, laser - stimulation occurred during habituation only. During concurrent-stim (co-stim) sessions, laser stimulation occurred during food availability only. Each animal was tested using either low-fat diet (LFD, grain pellets) or high-fat diet (HFD) as the available food and in the fed and fasted states . Each experiment was performed on the same animals at baseline and after 4 weeks of ad libitum HFD intake for a total of 12 sessions. (B–C) Calories consumed by fed mice as LFD (B) or HFD (C) at baseline and after DIO induction under no stim (gray), pre-stim (light blue), and co-stim (dark blue) conditions. (D–E) Calories consumed by fasted mice as LFD (D) or HFD (E) at baseline and after DIO induction under no stim (gray), pre-stim (light blue), and co-stim (dark blue) conditions. n = 10 animals; *p<0.05, **p<0.01, ****p<0.0001 as indicated; +++ p<0.001, ++++ p<0.0001 DIO no stim compared to baseline no stim. (B–E) • denotes individual mice. Error bars represent mean ± SEM.
Figure 4 with 1 supplement
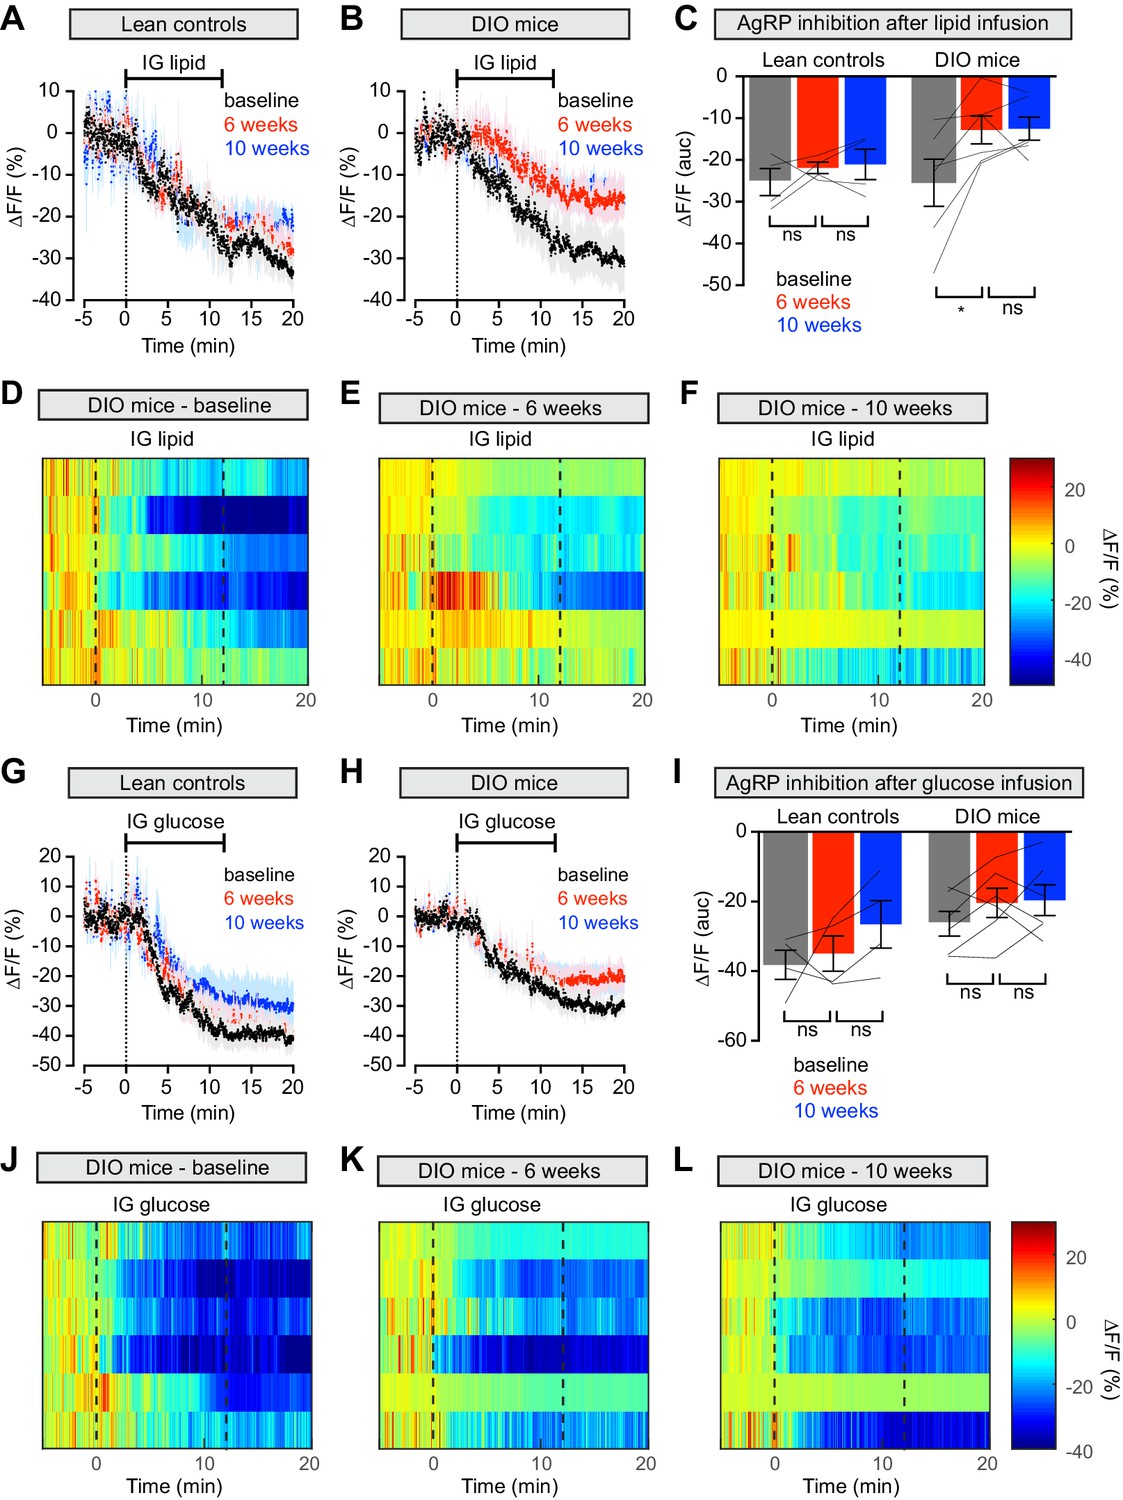
Diet-induced obesity causes selective and long-lasting attenuation of AgRP neuron inhibition by lipid.
(A and B) Calcium signal from AgRP neurons in fasted control (A) and DIO (B) mice during intragastric infusion with intralipid at baseline (black), after 6 weeks of chow or HFD (red), and after an additional 4 weeks of chow (blue). (n = 4–6 mice per group) (C) Quantification of ΔF/F from (A) and (B) showing inhibition at the end of infusion. (D–F) Peri-infusion heatmaps depicting ΔF/F during photometry recording in individual DIO mice (from B) at baseline (D), after 6 weeks on HFD (E), and after 4 weeks recovery (F). (G and H) Calcium signal from AgRP neurons in fasted control (G) and DIO (H) mice during intragastric infusion with glucose at baseline (black), after 6 weeks of chow or HFD (red), and after an additional 4 weeks of chow (blue). (n = 4–6 mice per group) (I) Quantification of ΔF/F from (G) and (H) showing inhibition at the end of infusion. (J–L) Peri-infusion heatmaps depicting ΔF/F during photometry recording in individual DIO mice (from H) at baseline (J), after 6 weeks on HFD (K), and after 4 weeks recovery (L). *p<0.05 as indicated. There was no significant difference between lean control and DIO groups at baseline. (A,B,G,H) Traces represent mean ± SEM. (C,I) Lines denote individual mice. Error bars represent mean ± SEM.
Figure 4—figure supplement 1
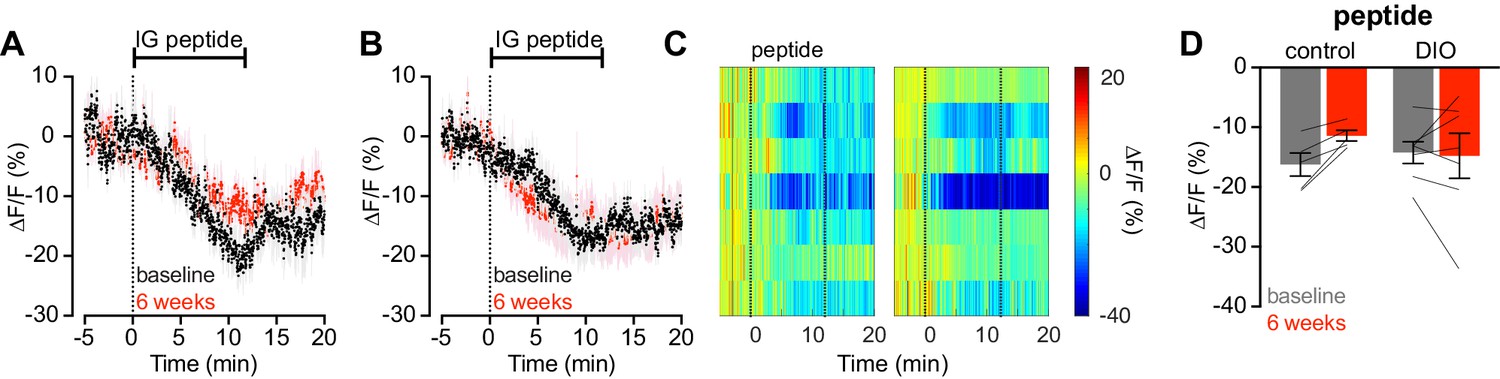
Diet-induced obesity does not alter AgRP neuron response to intragastric infusion of peptides.
(A and B) Calcium signal from AgRP neurons in fasted control (A) and DIO (B) mice during intra- gastric infusion with a peptide mixture at baseline (black) and after 6 weeks of chow or HFD (red). (n = 5–7 mice per group). (C) Peri-infusion heatmaps depicting ΔF/F during photometry recording in individual DIO mice (from B) at baseline (left) and after 6 weeks on HFD (right). (D) Quantification of ΔF/F from (A) and (B) showing inhibition at the end of infusion. (A,B) Traces represent mean ± SEM. (D) Lines denote individual mice. Error bars represent mean ± SEM.
Figure 5 with 1 supplement

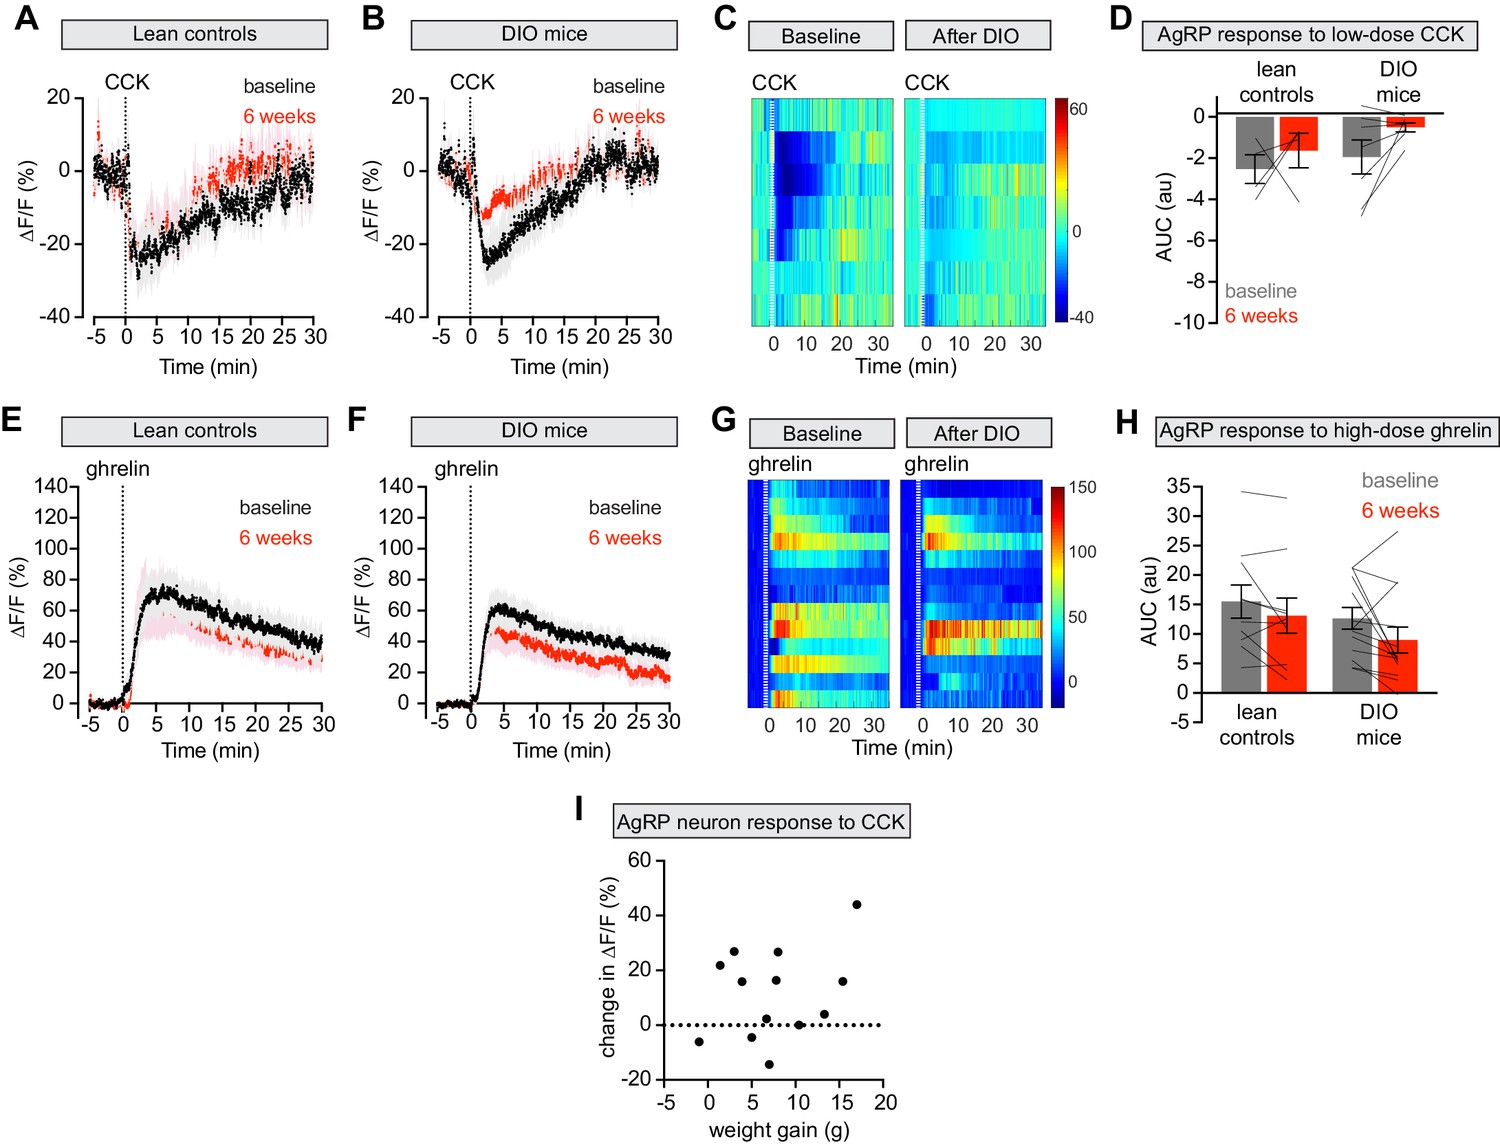
Diet-induced obesity attenuates AgRP neural and behavioral responses to CCK and ghrelin.
(A and B) Calcium signal from AgRP neurons in fasted control (A) and DIO (B) mice treated with CCK 30 μg/kg IP at baseline (black), after 6 weeks on chow or HFD (red), and after an additional 4 weeks of chow (blue). (n = 9–12 mice per group). (C) Quantification of ΔF/F from (A) and (B) showing area under the curve (AUC) for 20 min after injection. (D–F) Peri-injection heatmaps depicting ΔF/F during photometry recording in individual DIO mice from (B) at baseline (D), after 6 weeks on HFD (E), and after 4 weeks recovery (F). (G and H) Calcium signal from AgRP neurons in ad libitum fed control (G) and DIO (H) mice treated with ghrelin 0.1 mg/kg IP at baseline (black), after 6 weeks on chow or HFD (red), and after an additional 4 weeks of chow (blue). (n = 4–6 mice per group). (I) Quantification of ΔF/F from (G) and (H) showing area under the curve (AUC) for 30 min after injection. (J–L) Peri-injection heatmaps depicting ΔF/F during photometry recording in individual DIO mice from (H) at baseline (J), after 6 weeks on HFD (K), and after 4 weeks recovery (L). (M and N) 30 min food intake in fasted control (M) or DIO (N) animals re-fed with chow or HFD, respectively following injection of the indicated doses of CCK. (n = 9–10 mice per group). (O and P) 30 min food intake in ad libitum fed control (O) or DIO (P) animals of chow or HFD, respectively, following injection of the indicated doses of ghrelin (n = 6 mice per group). *p<0.05, **p<0.01, and ****p<0.0001 as indicated. There was no significant difference between lean control and DIO groups at baseline. (A,B,G,H) Traces represent mean ± SEM. (C,I) Lines denote individual mice. Error bars represent mean ± SEM. (M,N,O,P) • denotes individual mice. Error bars represent mean ± SEM.
Figure 5—figure supplement 1
The effect of DIO on AgRP neuronal responses to CCK and ghrelin is dose-dependent.
(A and B) Calcium signal from AgRP neurons in fasted control (A) and DIO (B) mice treated with CCK 10 μg/kg IP at baseline (black) and after 6 weeks on chow or HFD (red). (n = 4–7 mice per group). (C) Peri-injection heatmaps depicting ΔF/F during photometry recording in individual DIO mice from (B) at baseline (left) and after 6 weeks on HFD (right). (D) Quantification of ΔF/F from (A) and (B) showing area under the curve (AUC) for 20 min after injection. (E and F) Calcium signal from AgRP neurons in ad libitum fed control (E) and DIO (F) mice treated with ghrelin 0.5 mg/kg IP at baseline (black) and after 6 weeks on chow or HFD (red). (n = 10–13 mice per group). (G) Peri-injection heatmaps depicting ΔF/F during photometry recording in individual DIO mice from (F) at baseline (left) and after 6 weeks on HFD (right). (H) Quantification of ΔF/F from (E) and (F) showing area under the curve (AUC) for 30 min after injection. (I) Change in ΔF/F (response after 6 weeks HFD exposure minus response at baseline) in fasted DIO animals treated with with CCK plotted against the weight gain of individual animals. R2 = 0.103, p=0.28. (n = 13 mice). (A,B,E,F) Traces represent mean ± SEM. (D,H) Lines denote individual mice. Error bars represent mean ± SEM.
Tables
Key resources table
| Reagent type (species) or resource | Designation | Source or reference | Identifiers | Additional information |
|---|---|---|---|---|
| Strain, strain background (Mus musculus) | Wildtype | Jackson Labs | Stock No:000664 | |
| Strain, strain background (M. musculus) | AgRP-Cre | Jackson Labs | Stock No:012899 | |
| Strain, strain background (M. musculus) | ROSA26-loxStoplox-ChR2-eYFP | Jackson Labs | Stock No:012569 | |
| Strain, strain background (adeno-associated virus-1) | AAV1.CAG.Flex.GCaMP6s | Addgene | ID:100842 | |
| Peptide, recombinant protein | CCK | Bachem | Product No:4033010.0001 | |
| Peptide, recombinant protein | Ghrelin | R and D Systems | Catalog #:1465/1 | |
| Commercial assay or kit | Leptin ELISA | Crystal Chem | Catalog #:90030 | |
| Commercial assay or kit | Insulin ELISA | Crystal Chem | Catalog #:90080 | |
| Chemical compound, drug | ‘high-fat diet; HFD’ | Research Diets | Diet Formula:D12492 | |
| Chemical compound, drug | ‘low-fat pellets; food pellets’ | Bio-Serv | Product #:F0163 | |
| Software, algorithm | MATLAB | MathWorks | RRID:SCR_001622 | |
| Software, algorithm | Prism | GraphPad | RRID:SCR_002798 |
Additional files
Download links
A two-part list of links to download the article, or parts of the article, in various formats.
Downloads (link to download the article as PDF)
Open citations (links to open the citations from this article in various online reference manager services)
Cite this article (links to download the citations from this article in formats compatible with various reference manager tools)
Obesity causes selective and long-lasting desensitization of AgRP neurons to dietary fat
eLife 9:e55909.
https://doi.org/10.7554/eLife.55909


