Automated task training and longitudinal monitoring of mouse mesoscale cortical circuits using home cages
- Department of Psychiatry, Kinsmen Laboratory of Neurological Research, Canada
- Djavad Mowafaghian Centre for Brain Health, University of British Columbia, Canada
Figures
Figure 1
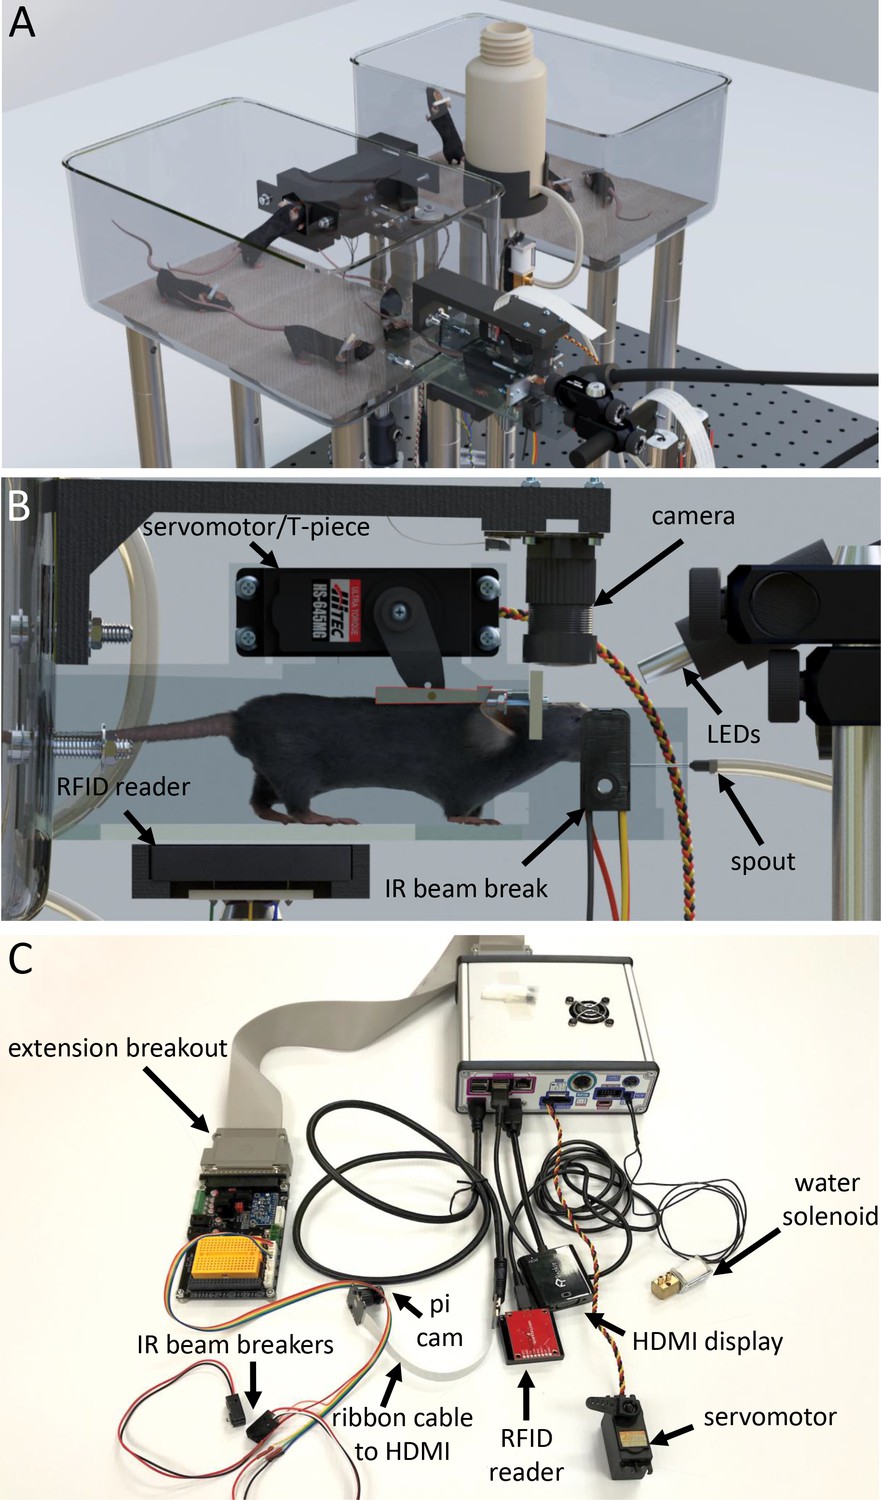
Tandem autoheadfixation and brain imaging home cage.
(A) 3D graphic of the home cage system with 8 mice. Two cages are connected via a tunnel with an RFID sensor underneath and designed to automatically monitor the weight of the traversing mice. (B) Side view of the imaging chamber with a head-fixed mouse. An RFID sensor identifies the specific mouse. The snout of the mouse breaking the IR beam initiates the servo motor to head-fix the mouse by using the mounted aluminum T-piece to press the head-bar against the metal reinforced end of the chamber. Imaging LEDs, brain camera, and body cameras which record the behavior (eye, face and body) of the head-fixed animal are then activated. The spout provides the water rewards and detects licks for the task via a capacitance sensor. The Raspberry Pi processes inputs from the lick sensor and controls task related electronics (water solenoid, stimulus buzzer, auditory feedback). (C) Photo of the assembled major cage components. The Raspberry Pi and a printed circuit board (PCB) containing transistor logic switches and servo driving hardware are covered in a metal case (upper right). Electronic devices are plugged into headers on the PCB breakout (Water solenoid, Servo Motor) or into the Raspberry Pi directly (HDMI, USB RFID Reader). Picam with triple band filter 69013 m Chroma was used for brain imaging. IR beam breakers, auditory feedback buzzer, LEDs, vibration motor and licking sensor adapters (need short wiring to reduce noise) can be plugged via unique cables to the breakout extension board and to the Raspberry Pi. The breakout also supplies several regulated supply voltages and contains a small breadboard for use in developing future behavioral tasks.
Figure 2
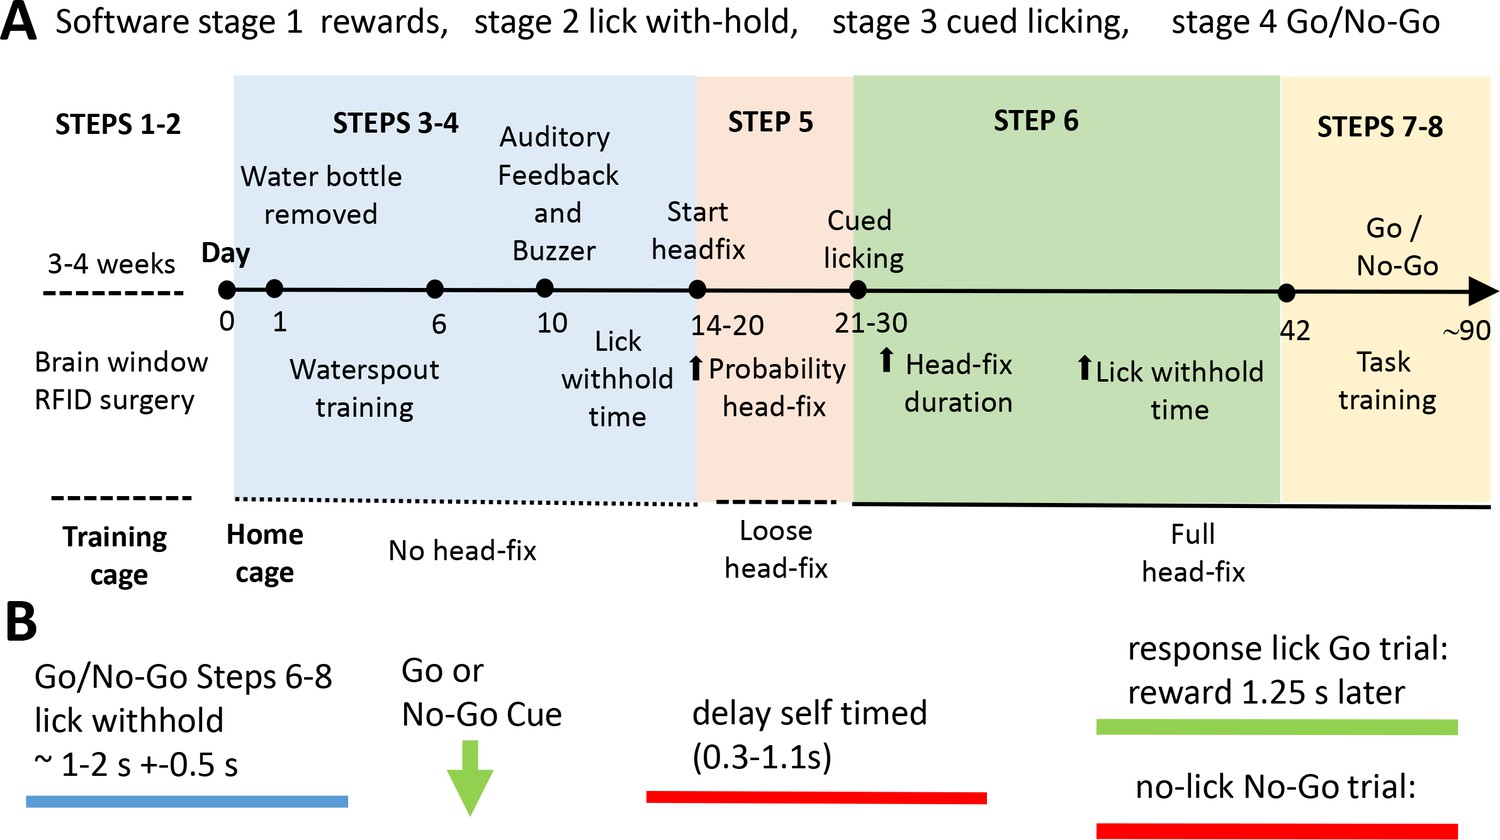
Scheme of the home cage training procedure leading to self-initiated head-fixing and task-based brain imaging.
(A) Mice were kept in a training double-cage with a connecting tunnel to allow acclimation of pooled liters to achieve 8–10 mice of a particular genotype, sex, and age and receive ad lib water via a bottle (protocol step 1–2). After relocation to the home cage mice learned that water was provided from a spout near the entrance of the imaging chamber. Over time the spout is moved towards the end of the chamber (step 3). Once mice break the IR beam at the end of the chamber they were rewarded with more water. During this beam break training basic task trials can be introduced (step 4). Mice need to withhold licking for a short time to get a water drop after a buzz cue and receive auditory feedback for inappropriate licking. Requested lick withhold time can be increased each day. After mice learn the basic concept of lick withholding the servo motor was engaged and they are loose head-fixed for approximately 20 s with a random probability of 50%. The ratio of loose head-fixed trials was increased during the next week to ~70% and servo motor travel was increased further reducing head movement (step 5). When servo is tight enough to press the head-bar against the chamber metal stop the mice were trained to detect a stimulus (step 6). A licking response is now required in order to trigger water delivery. Additionally, the mouse has to delay its licking for some time after the stimulus (vibration) was given. During the next weeks head-fix duration and delay time are increased. In some cases no-go trials were introduced for cages with long runtime (steps 7–8). The acquisition software is organized by Python code stimulator objects that achieve specific broad training goals (these are termed stages: stage 1 rewards, stage 2 lick with-hold, stage 3 cued licking, stage 4 go and no-go). (B) General structure of a task trial within a headfixed session. To initiate a trial the mouse has to withhold its licking (blue) for an interval termed ‘lick withhold time’. A vibration cue follows the cued licking (green arrow can be go or no-go based on buzz frequency). After the stimulus the mouse had to delay its licking for self-timed period (red) until the response licking period. Delay time was increased during step 6–8. After the delay time has passed the mouse needs to lick within 1.25 s in Go trials. If the mouse correctly responded to the go stimulus water is provided after the 1.25 s. In no-go trials the mouse has to further suppress licking waiting for the next stimulus. Auditory feedback was given for inappropriate licks in no-go trials. Delay time was first introduced in group 2. Groups 2–3 faced constant delay times (0.5 s and 0.25 s). Groups 4–5 experienced delay time training.
Figure 3 with 1 supplement

Entry, licking, and headfixing statistic for all mice tested.
(A) Entries into the head-fix chamber, (B) spout licks, (C) head-fixes and (D) total time spent under head-fixation. All plots display participation relative to the starting day of loose head-fixing protocol (day 0). Entries are counted when the RFID sensor initially detects the presence of an RFID tag (implanted within the abdomen of a mouse). The lick detector in the first cage (group 1) was installed 6 days after beginning of the record, but before loose head-fixing protocol started. The 5 cage groups had slightly different runtimes and external interruptions of the systems (i.e. day 13–17 of Group 3 were not collected due to a power outage at the animal facility, animals were manually given water).
Figure 3—figure supplement 1
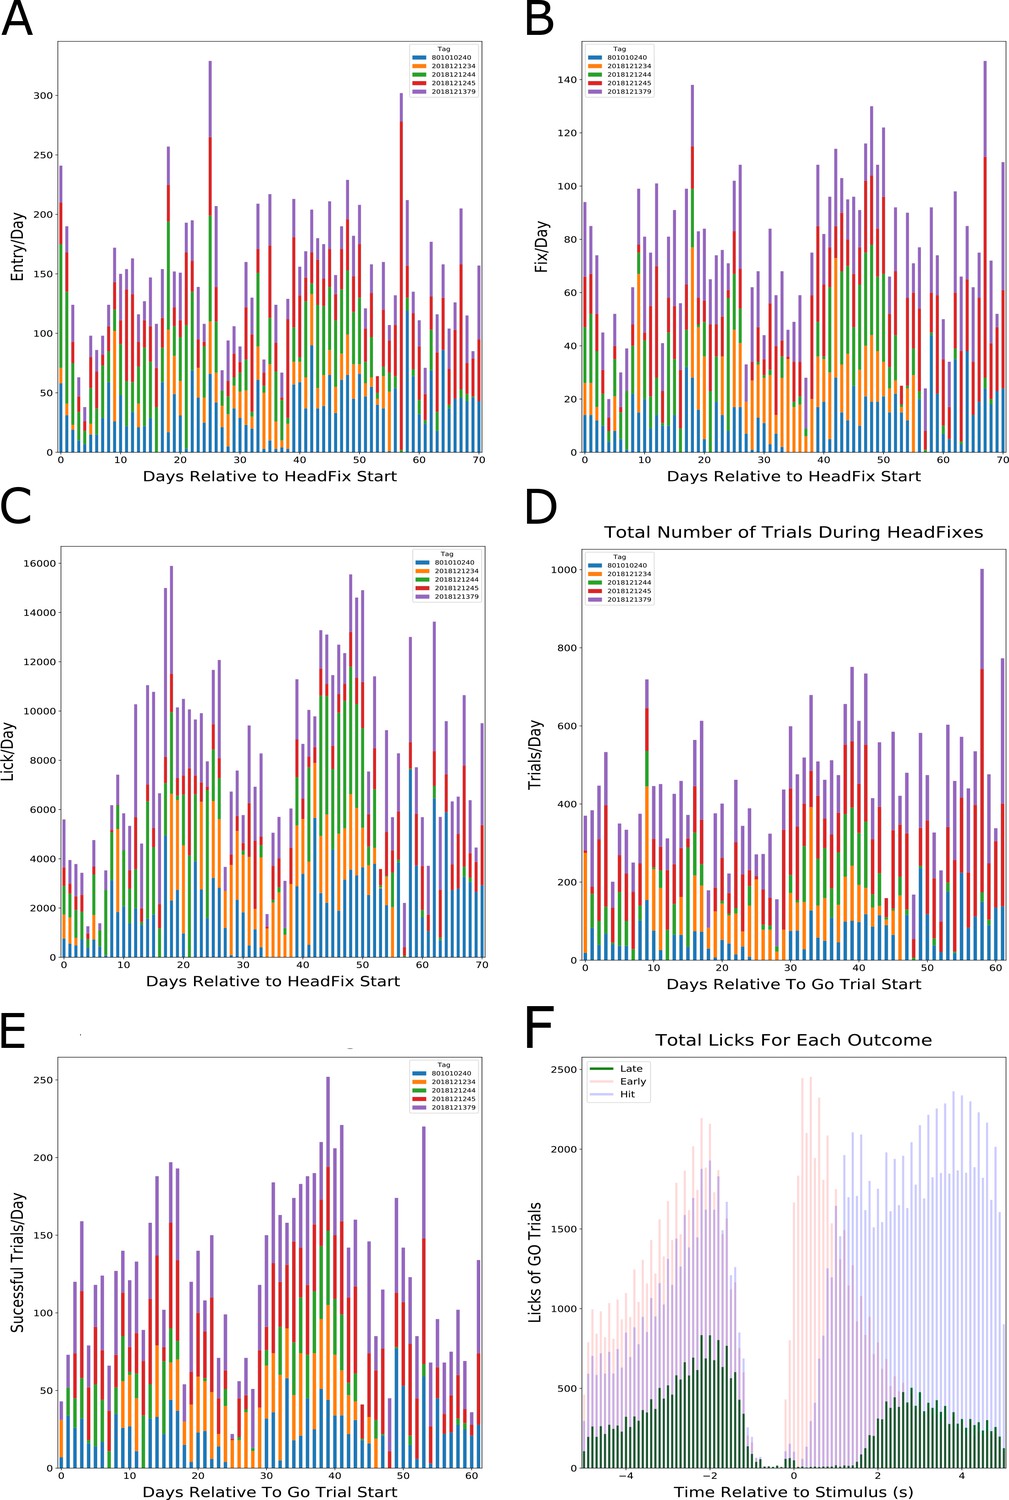
Headfixing and Go-trial statistics for 8 female mice training using ~7 h/day laboratory-based unsupervised training.
(A) Entries/day for each of 5 mice that were active in the task. (B) Head-fixes/day, (C) Licks/day, (D) total task trials presented with any outcome, (E) Successful trials/day, and (F) total licks for each trial outcome across all female mice, note due to timing errors a small number of licks to appear in the lick withhold period.
Figure 4

Group dynamics during headfixed behavior.
(A) Histograms show the inter-headfixation interval for individual mice (same mouse) or for two different mice. Individual mice were most likely to start a new head-fix session within the first 10 s after the previous session. In about 90% of cases other mice were found to also enter within 60 s of an individual mouse (overlap darker red). Displayed bin size is 5 s. (B) Histogram plotted over longer time scale. After 10 min was more likely that the next head-fixation was done by another mouse than the same mouse as the gray area is greater (displayed bin size is 5 min) and after 2 hr the probability becomes equal again. Histograms include data from all 5 mouse groups during the time under head-fixing protocol. Group specific medians of the head-fix intervals can be found in C) using the same color code and the left (log) scale. (C) Distributions of different values over the 5 groups. Medians are displayed in red and black lines using the left (log) scale. The bar plots display the proportion of headfix clusters that include the activity of one, two or more mice, each bar sums up to 100%. (D) Group dynamics and diurnal variation in headfixation rates for cage group 4. Day 0 represents the beginning of the loose head-fixing protocol. Each circle represents a head-fix session and the colors correspond to unique RFID tags. (E) Count of head-fixes that were associated in clusters of distinct size resulting from KDE cluster analysis. Note that the displayed binning of cluster sizes was not linear and counts of larger cluster sizes were grouped together. (F) Data plotted for cage 1, note cage 1 started with 10 mice Ai-94 genotype.
Figure 5
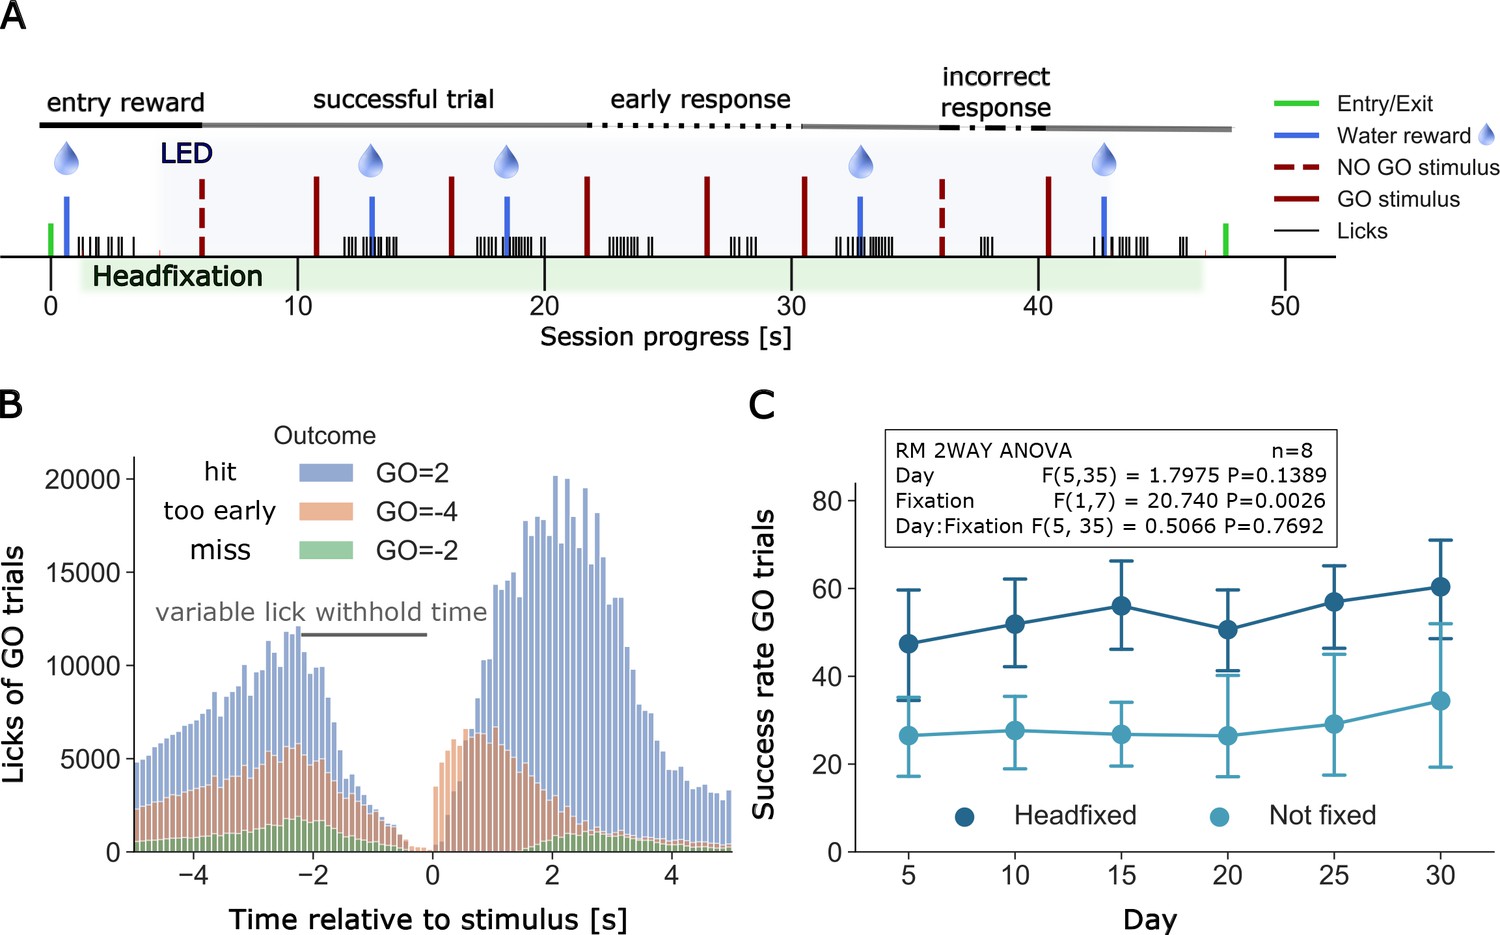
Example of a full headfixation session and group licking behavior during go-trial detection task.
(A) The entering TTA-GCaMP6s mouse (RFID tag ID 201608423, Group 4, day 49 of head-fixation) was rewarded with a water drop and was head-fixed when it broke the infrared beam and brain and body behavioral video recording was started. The blue light LED directed to the brain window for GCaMP epi-fluorescence was turned on 3 s after the beginning of head-fixation and was switched off 3 s before the servomotor releases the mouse. Trial outcomes included in the displayed session scheme (in order left to right): GO = 1, GO = 2, GO = 2, GO=-4, GO=-4, GO = 2, GO=-1, GO = 2 (outcome shortcuts specified in Figure 6B). (B) Time distribution of licks of different outcomes of GO trials under head-fixation, note the delay period increases as training progresses. Plot displays all licks from 20 mice of groups 2–5. Mice of group 1 did not have a self-timed lick delay time and thus no GO=-4 outcomes and were excluded from the plot. Y-axis displays the raw count of licks (binned in intervals of 0.1 s) between −5 and 5 s after stimulus. Licks between two stimuli are displayed twice, considered as a lick before and after a stimulus (multiple stimulus trials up to 7 are given in a single headfixed session). Number of trials and licks due to outcome (trials/displayed licks/unique licks): GO=-2 (6181/65225/58538), GO=-4 (14501/295624/263467), GO = 2 (30005/823637/661619). Outcome shortcuts: (GO=) 2: successful go trial, −2: unsuccessful go trial (no/late response), −4: unsuccessful go trial (early response, licked within delay time). (C) Repeated measurements two-way ANOVA comparing success rates of go trials between head-fixed and not head-fixed trials. Mice of group 2–5 had a random chance (30%) of getting a session without head-fixation. Procedure and task were the same as in head-fixed sessions. Success rates of mice that performed over a period of 30 days (n = 8) were binned in 5 day intervals. The ANOVA shows a significant lower success rate of non-fixed go trials.
Figure 6

Go and No-Go Task training for an individual mouse.
(A) Shows the number of trials performed, outcome software shortcuts and their consideration in the d’ analysis of displayed trials for TTA-GCaMP6s mouse RFID tag ID 201608423. Go=-3 trials are not displayed in D) due to their rare occurrence. (B) Lick histograms for go trials on different training days. If the mouse withholds its licking for a given amount of time (up to 2 +- 0.5 s) a new trial is initiated by a randomly given go (or no-go) cue. Correct no-go trials are unrewarded, correct go trials are rewarded if the mouse delays its licking response for a given delay time. After the delay time has passed the mouse has 1.25 s to respond with licking. A water reward is given when the 1.25 s have passed and the mouse responded within this 1.25 s time window. A new cue is given when the mouse withholds its licking again for approximately 2 s. Blue bars show the lengthening of the delay time. Water drops indicate when the reward is given. (C) Delay times used and (D) No-go trial lick histograms.
Figure 7
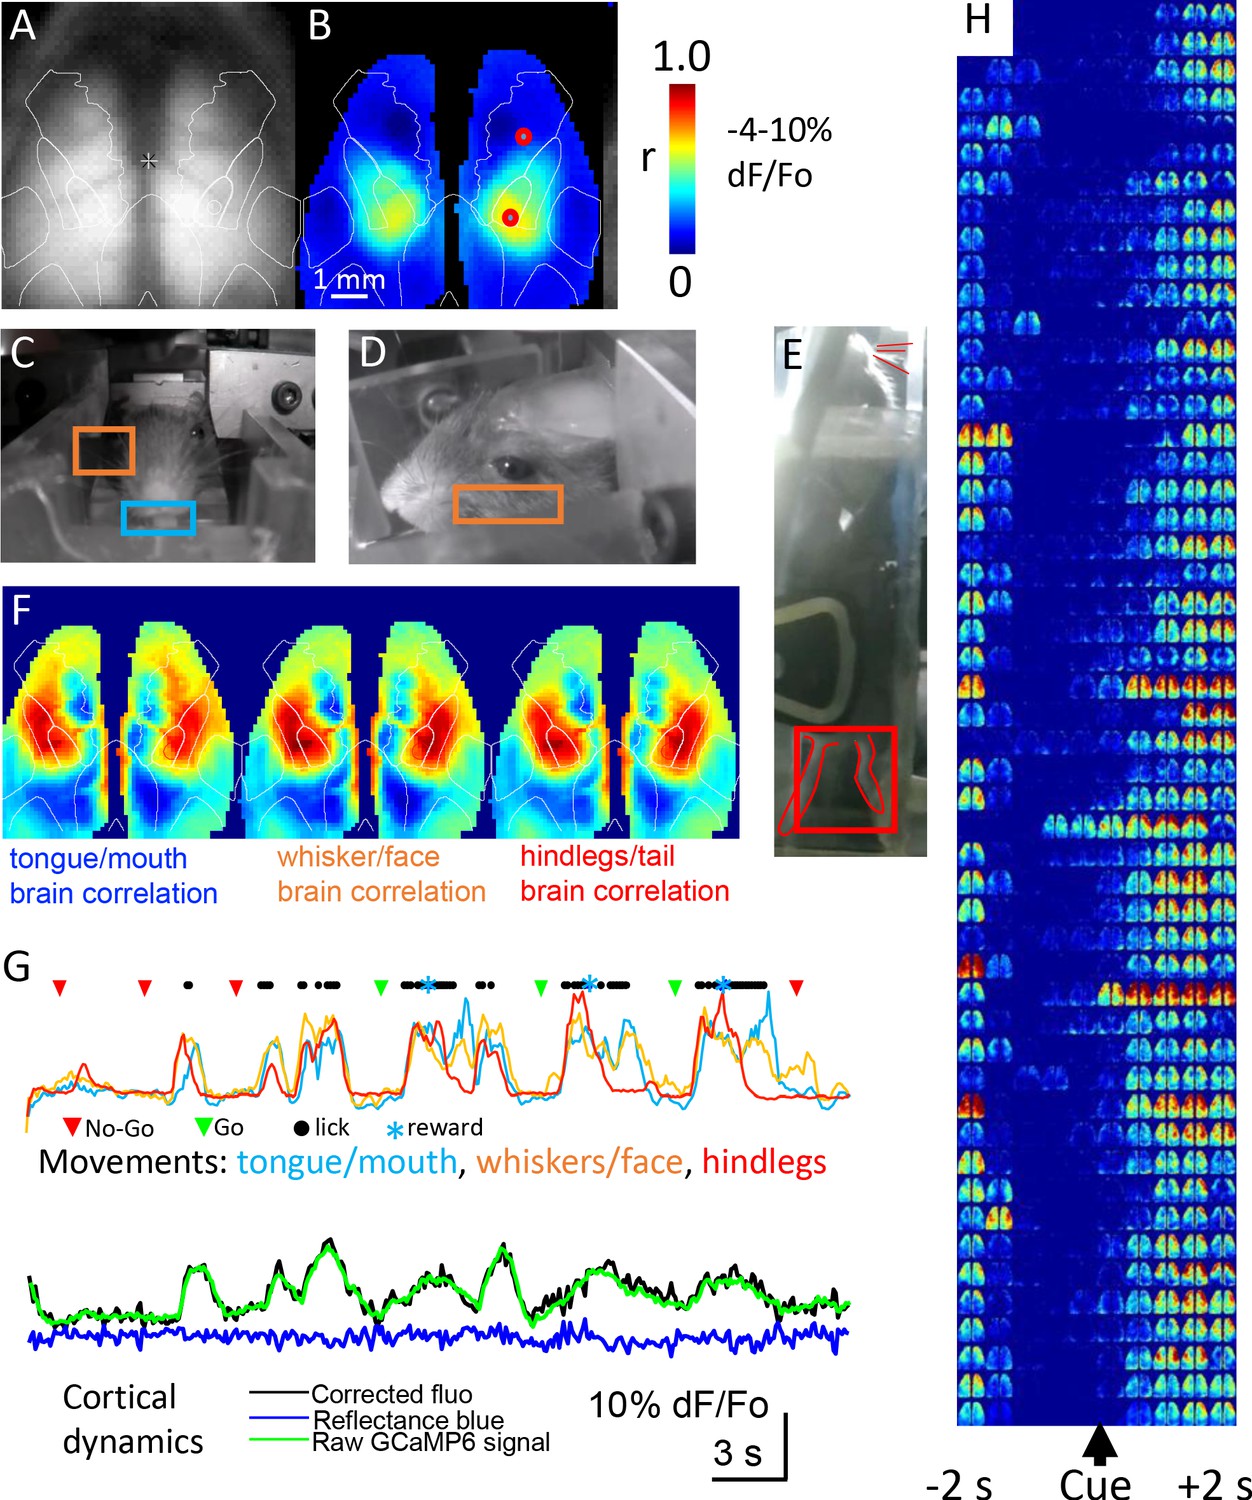
Mesoscale imaging of task-dependent GCaMP6 activity in automated home cages.
(A) Raw fluorescence image of GCaMP and transcranial window, overlay represents a re-drawing from the Oh et al., 2014, note we have down-sampled the original data (256 × 256 pixels) to 64 × 64 pixels to speed processing. (B) Seed-pixel correlation map with seeded region in the right hind limb somatosensory cortex for mouse M8423 for data from 09252018 to 09292018 over which 151 headfixed sessions occurred (total imaging time of ~88 min, concatenated headfixed trials), red circle on the right hemisphere in the area of high correlation was the presumed hind limb area, the second red circle located more anterior was used for plotting ROI values in panel G. (C, D, E) Examples of behavioral ROIs for mouse tongue face, whisker, and hind leg, regions of interest (ROIs colored coded as in F). Analyses in panels B and F used global signal regression on cortical GCaMP signal to emphasize local networks, this step was removed for all other analysis. (F) Correlation maps (zero lag time) between behavioral activity (gradient pixel analysis of videos, see methods) and brain GCaMP-6 calcium-dependent activity made over the 151 concatenated head-fixed sessions. Pixel by pixel brain GCaMP correlation with three different behavioral ROIs are shown. (G) Plots of behavioral ROI values on the same timescale as mesoscale GCaMP signal from frontal motor cortex, the gradient values were auto-scaled based on min/max movements. During each cycle of movement that typically involved multiple body parts there was a large GCaMP signal within frontal motor cortex (2nd head-fixed session from 09252018 for M8423, 38–76 s of the dataset), ROI is the anterior red circle in panel B. (H) Single trial pseudo colored changes in GCaMP6 fluorescence with during licking task (cue time indicated) for 50 consecutive rewarded Go hit trials that received a code of 2 for mouse 8423 using data from 08252018 (each image reflects the maximal value of 400 ms time bins).
Figure 8 with 11 supplements
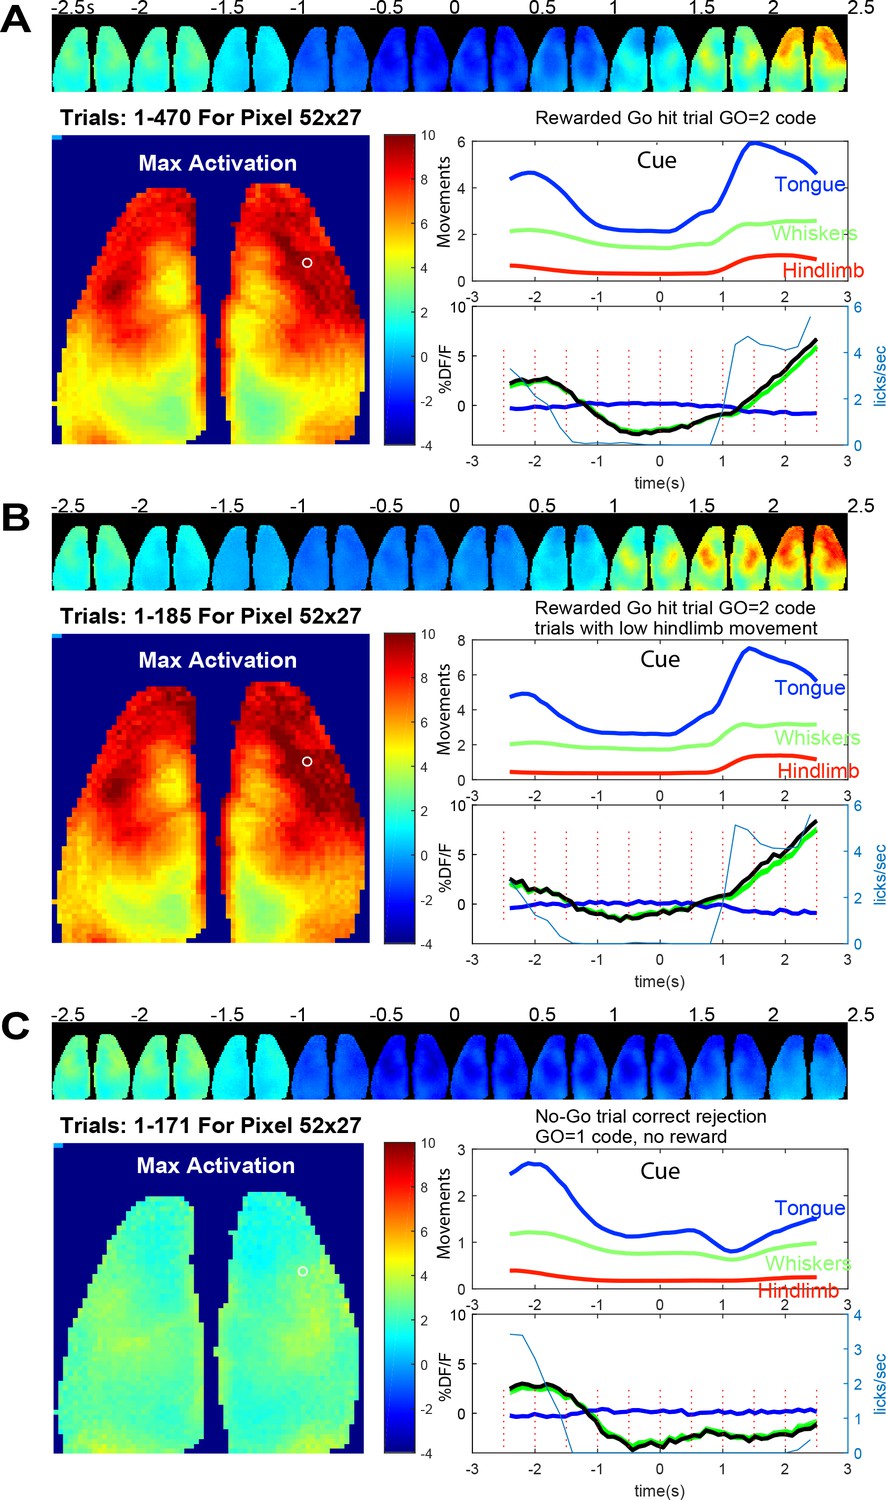
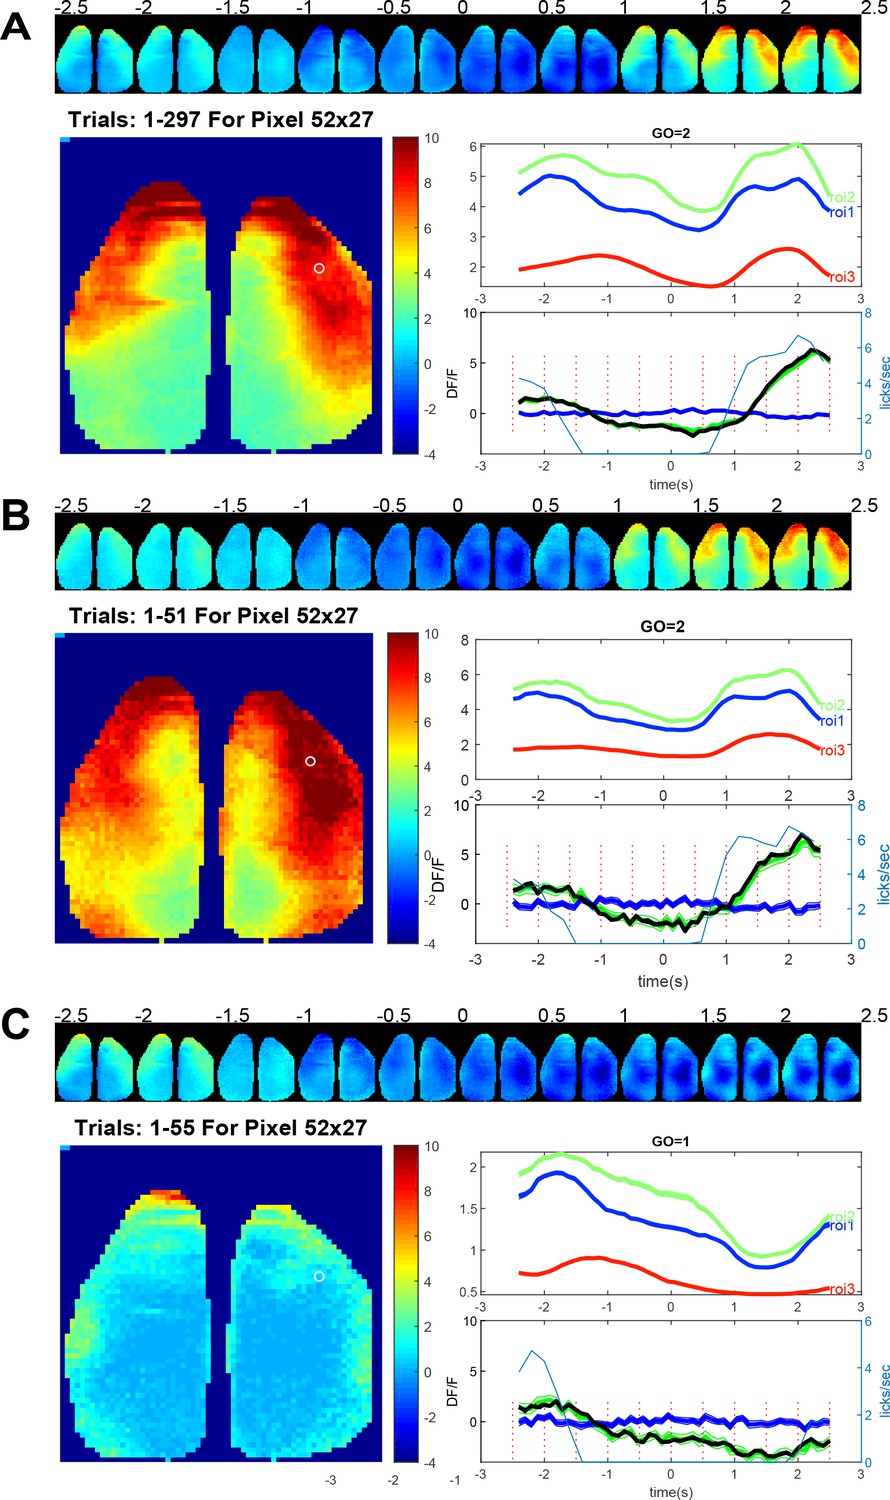
Averaged brain GCaMP6 and behavioral ROI data for licking task.
(A) Trial averaged pseudo-colored GCaMP cortical image montage binned every 500 ms (pixelwise to show maximum values) during go-task activity. Data from a 2.5 s period before and after vibratory go-cue presentation (500 ms vibration, begins at time 0) for mouse tag 8423 and 49 days since the start of the go task training and 36 days from no-go. Large image shows the maximal activation over this period (difference between pre-cue minimum and post-cue maximum values for images binned over 100 ms). Upper panel plot normalized behavioral gradient signal for indicated body region ROIs. Bottom panel plots: average GCaMP signal for 470 trials of successful licking Go-trials (lick rate plotted in blue thin lines) for a pixel in anterolateral motor cortex (white circle coordinates 52, 27 in the 64 × 64 image shown, note image was binned spatially from 256 × 256 raw data). By examining the lick rate plot, the lick withhold time (with random 500 ms interval) can be seen when licks plummet to 0 just before trial start. The response window after the self-timed delay (900 ms) is also visible with licks being detected again and then a second peak of licks at the reward delivery is observed. (B) Identical plots as A for trials where hindlimb movements 0–2.5 s before the vibration were <0.4 stdev (ROI 1 = tongue/mouth, 2 = whiskers, and 3 = hindlegs). This criterion makes pre-stimulus baseline activity more constant but otherwise shows similar dynamics. (C) Identical plots as B but for trials where a no-go stimulus (3, 100 ms vibrations with 200 ms inter stimulus interval) was given. These data were autonomously obtained from 9/25/2018 to 9/29/2018 and are the average of all head-fixed trials of given outcome type.
Figure 8—figure supplement 1
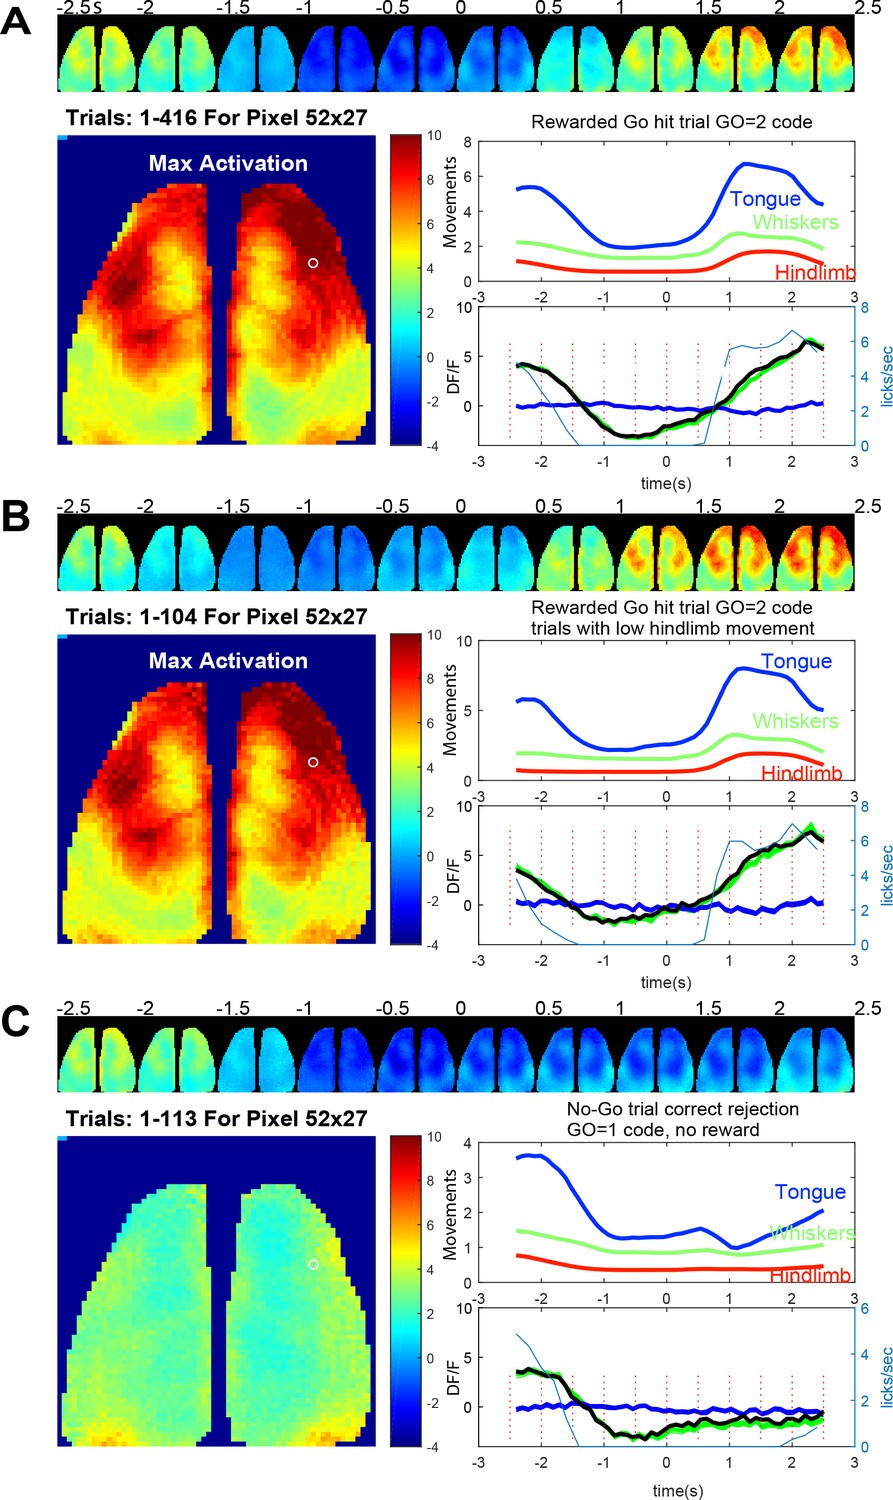
Averaged GCaMP6 and behavioral ROI data for licking task early training data.
(A) Average pseudo-colored GCaMP cortical image montage binned every 500 ms go-task activity over a 2.5 s period before and after vibratory go-cue presentation (500 ms vibration, begins at time 0) for mouse tag 8423 and 17 days since the start of the go task training and 4 days from no-go. Large image shows the maximal activation over this period (difference between pre-cue minimum and post-cue maximum values for images binned over 100 ms)). Upper panel plot normalized behavioral gradient signal for indicated body region ROIs. Bottom panel plots: average GCaMP signal for 416 trials of successful go licking trial (lick rate plotted in blue thin lines) for a pixel in anterolateral motor cortex (white circle coordinates 52, 27 in the 64 × 64 image shown). By examining the lick rate plot, the lick withhold time (with random 500 ms interval) can be seen when licks plummet to 0 just before trial start. The response window after the self-timed delay (600 ms) is also visible with licks being detected again and then a second peak of licks at the reward delivery is observed. (B) Identical plots as A, but for trials where hindlimb movements 0–2.5 s before the vibration were <0.4 stdev (ROI 1 = tongue, 2 = whiskers, and 3 = hindlegs). This criterion makes pre-stimulus baseline activity more constant but otherwise shows similar dynamics. (C) Identical plots as B but for trials where a no-go stimulus (3, 100 ms vibrations with 200 ms inter-stimulus interval) was given. These data were obtained autonomously from 8/24/2018 to 8/29/2018 and are the average of all head-fixed trials of given outcome type.
Figure 8—figure supplement 2
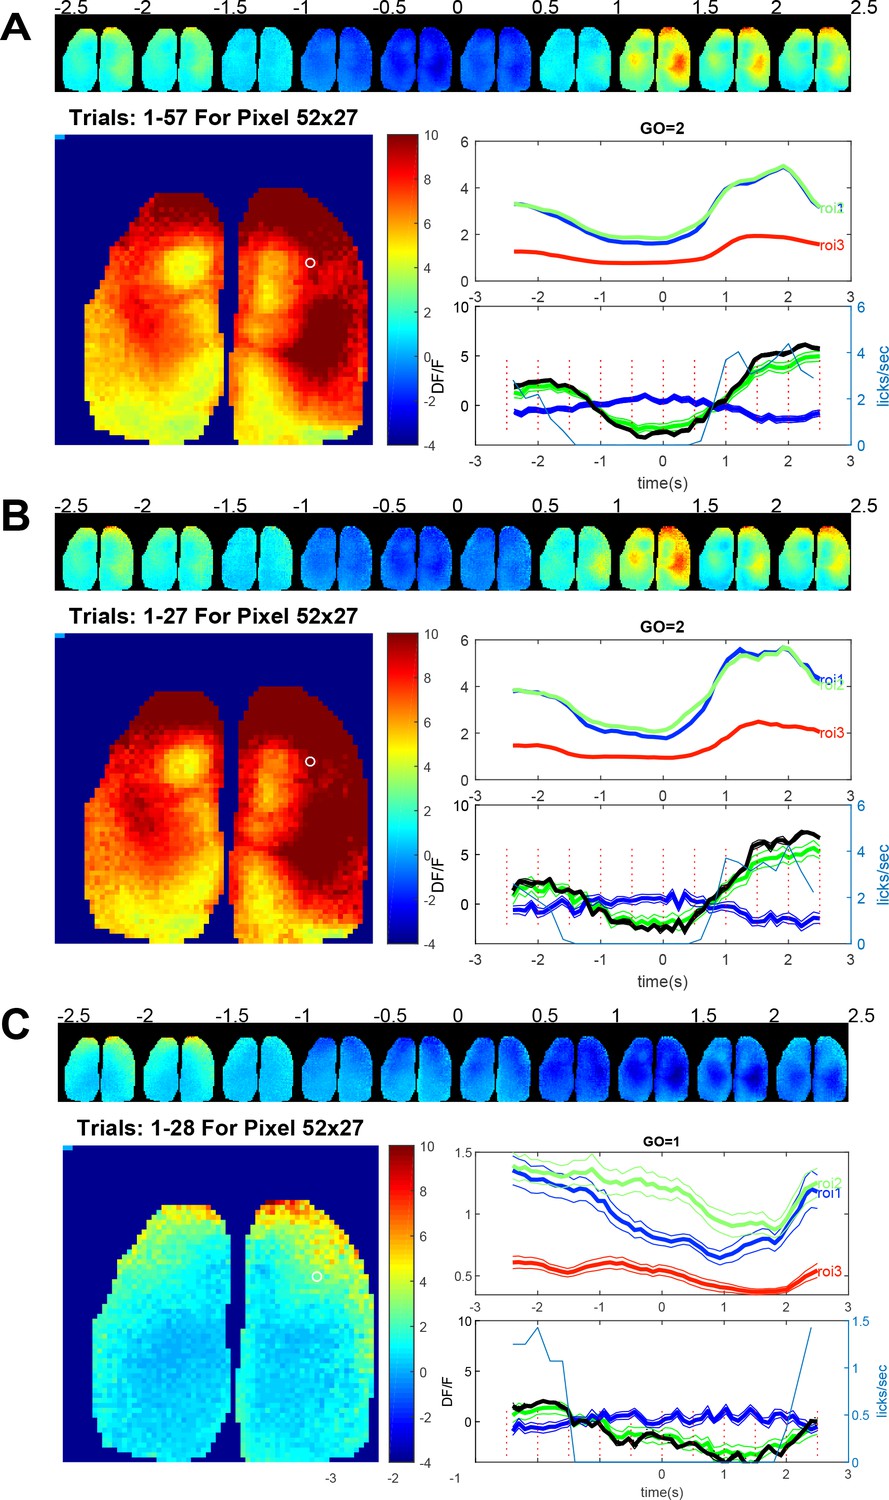
Averaged GCaMP6 and behavioral ROI data for licking task early training data from mouse 8474, Go and No-Go.
(A) Average pseudo-colored GCaMP cortical image montage binned every 500 ms go-task activity over a 2.5 s period before and after vibratory go-cue presentation (500 ms vibration) 17 days since the start of the go task training and 4 days from no-go. Large image shows the maximal activation over this period (difference between pre-cue minimum and post-cue maximum values for images binned over 100 ms). Upper panel plot normalized behavioral gradient signal for indicated body region ROIs. Bottom panel plots: average GCaMP signal of successful go licking trial (lick rate plotted in blue thin lines) for a pixel in anterolateral motor cortex (white circle coordinates 52, 27 in the 64 × 64 image shown). (B) Identical plots as A, but for trials where hindlimb movements 0–2.5 s before the vibration were <0.5 stdev (ROI 1 = tongue, 2 = whiskers, and 3 = hindlegs). This criterion makes pre-stimulus baseline activity more constant but otherwise shows similar dynamics. (C) Identical plots as B but for trials where a no-go stimulus (3, 100 ms vibrations with 200 ms inter-stimulus interval) was given. These data were obtained autonomously from 8/24/2018 to 8/29/2018 and are the average of all head-fixed trials of given outcome type.
Figure 8—figure supplement 3
Averaged GCaMP6 and behavioral ROI data for licking task early training data from mouse 0252, Go and No-Go.
(A) Average pseudo-colored GCaMP cortical image montage binned every 500 ms go-task activity over a 2.5 s period before and after vibratory go-cue presentation (500 ms vibration) 17 days since the start of the go task training and 4 days from no-go. Large image shows the maximal activation over this period (difference between pre-cue minimum and post-cue maximum values for images binned over 100 ms). Upper panel plot normalized behavioral gradient signal for indicated body region ROIs. Bottom panel plots: average GCaMP signal of successful go licking trial (lick rate plotted in blue thin lines) for a pixel in anterolateral motor cortex (white circle coordinates 52, 27 in the 64 × 64 image shown). (B) Identical plots as A, but for trials where hindlimb movements 0–2.5 s before the vibration were <0.5 stdev (ROI 1 = tongue, 2 = whiskers, and 3 = hindlegs). This criterion makes pre-stimulus baseline activity more constant but otherwise shows similar dynamics. (C) Identical plots as B but for trials where a no-go stimulus (3, 100 ms vibrations with 200 ms inter-stimulus interval) was given. These data were obtained autonomously from 8/24/2018 to 8/29/2018 and are the average of all head-fixed trials of given outcome type.
Figure 8—figure supplement 4
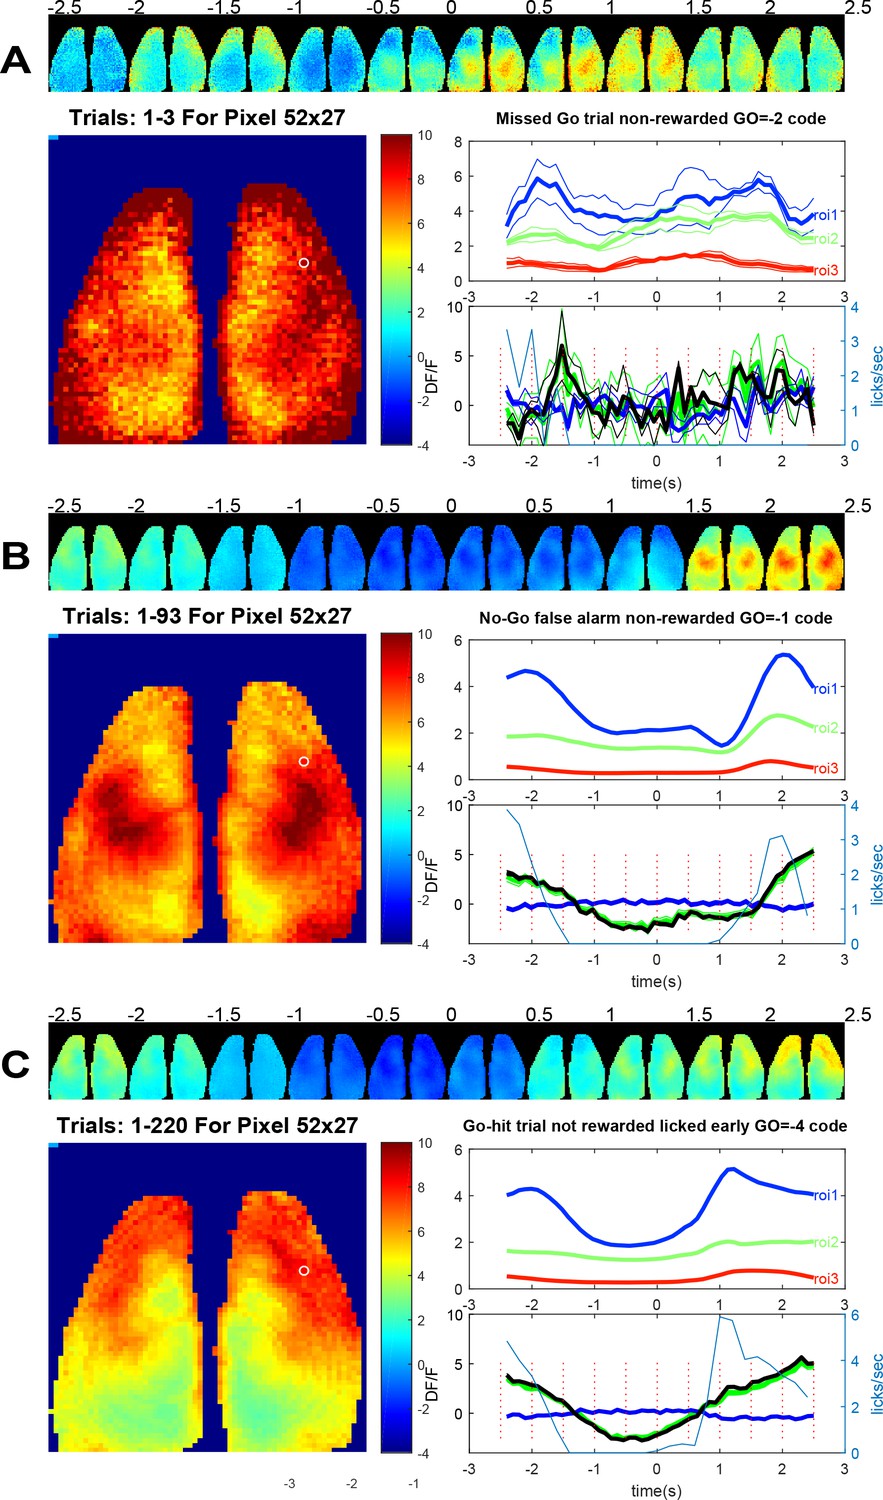
Averaged GCaMP6 and behavioral ROI data for licking task error trials for dataset presented in Figure 8.
(A) Average pseudo-colored GCaMP cortical image montage binned every 500 ms go-task activity over a 2.5 s period before and after vibratory go-cue presentation (500 ms vibration) for mouse tag 8423. Large image shows the maximal activation over this period (difference between pre-cue minimum and post-cue maximum values for images binned over 100 ms)). Upper panel plot normalized behavioral gradient signal for indicated body region ROIs. Bottom panel plots: average GCaMP signal for 3 trials of unsuccessful go licking trial (no licking in the response window) for a pixel in anterolateral motor cortex (white circle coordinates 52, 27 in the 64 × 64 image shown). (B) Similar plots as A, but for trials a No-Go false alarm event occurred (mouse licked in the correct time window but for a non-rewarded cue). (C) Similar plots as A but for trials where a go stimulus was given but the mouse licked too early and was not rewarded. These data were obtained autonomously from 9/25/2018 to 9/29/2018 and are the average of all head-fixed trials of given outcome type.
Figure 8—figure supplement 5
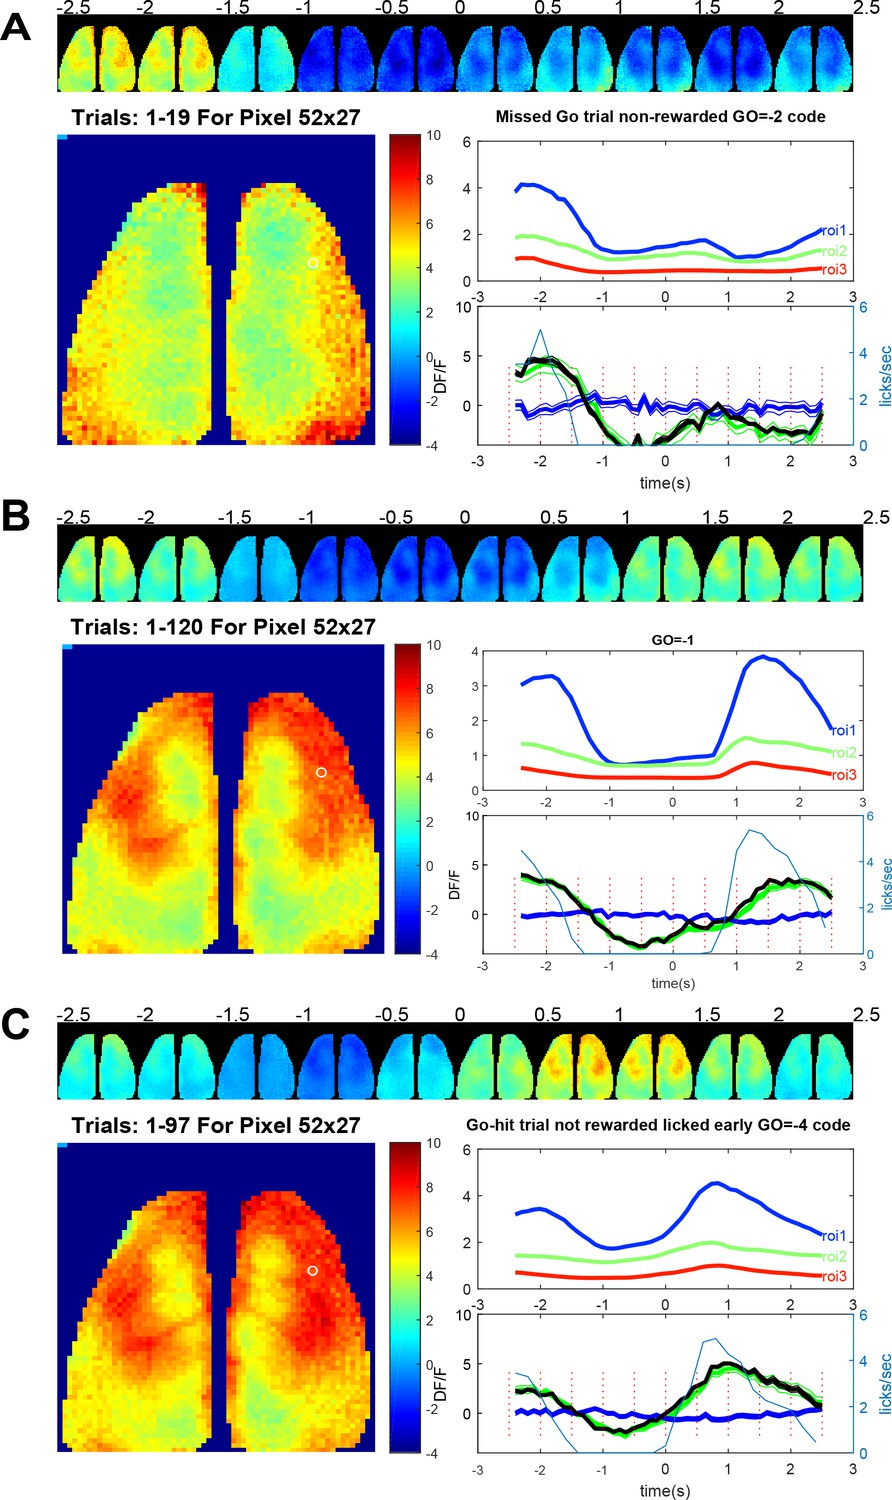
Averaged GCaMP6 and behavioral ROI data for licking task: error trials for dataset presented in Figure 8—figure supplement 1.
(A) Average pseudo-colored GCaMP cortical image montage binned every 500 ms go-task activity over a 2.5 s period before and after vibratory go-cue presentation (500 ms vibration) for mouse tag 8423 at a time early in training (beginning 17 days after the start of training). Large image shows the maximal activation over this period (difference between pre-cue minimum and post-cue maximum values for images binned over 100 ms). Upper panel plot normalized behavioral gradient signal for indicated body region ROIs. Bottom panel plots: average GCaMP signal for 3 trials of unsuccessful go licking trial (no licking in the response window) for a pixel in anterolateral motor cortex (white circle coordinates 52, 27 in the 64 × 64 image shown). (B) Similar plots as A but for trials a No-Go false alarm event occurred (mouse liked in the correct time window but for a non-rewarded cue). (C) Similar plots as A, but for trials where a go stimulus was given but the mouse licked too early and was not rewarded. These data were obtained autonomously from 8/24/2018 to 8/29/2018 and are the average of all head-fixed trials of given outcome type.
Figure 8—figure supplement 6
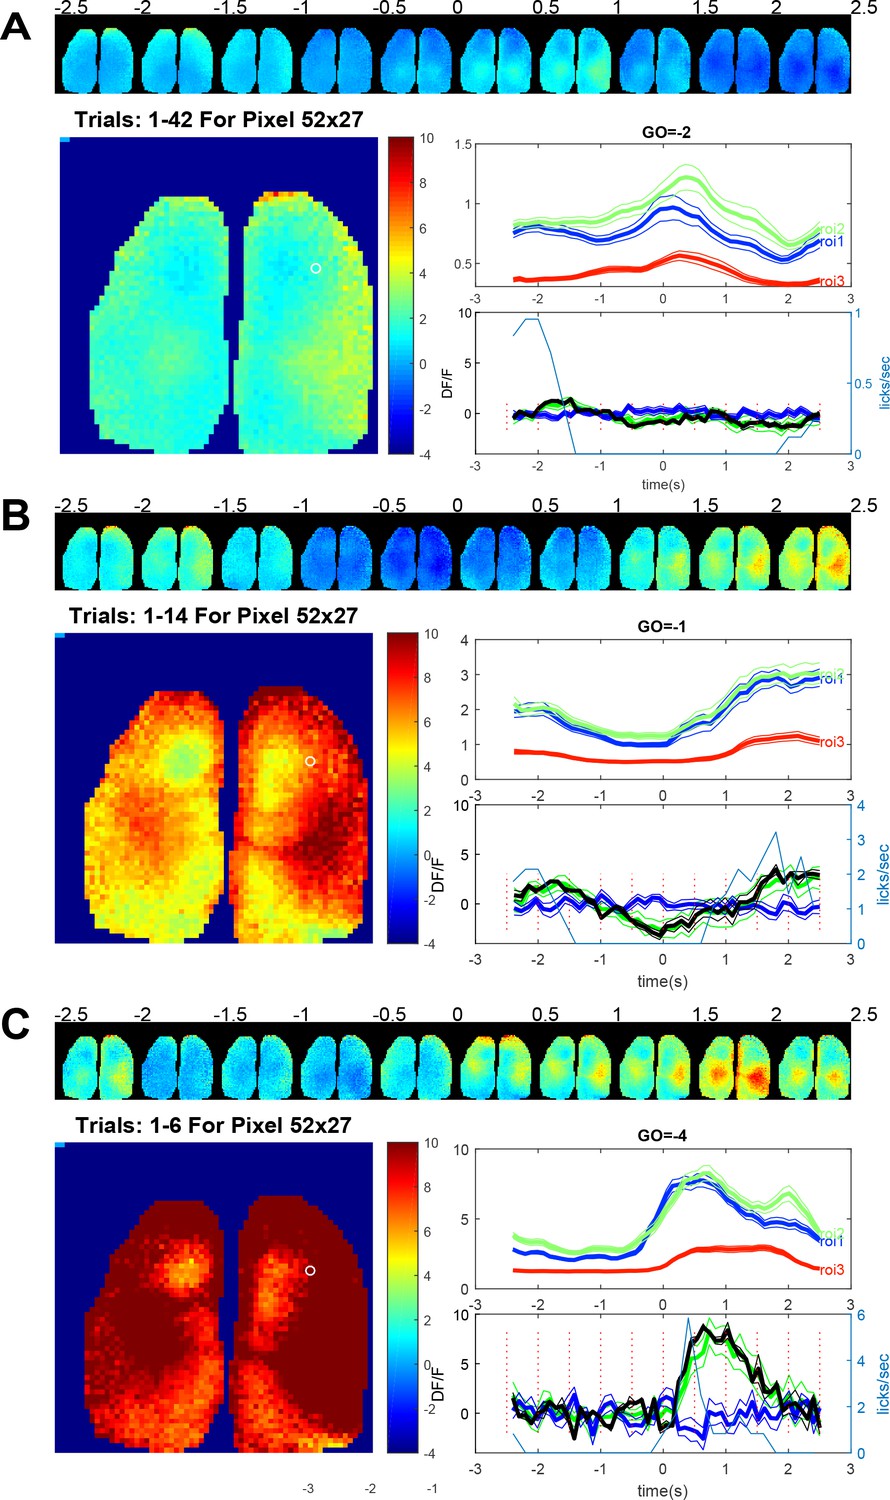
Averaged GCaMP6 and behavioral ROI data for licking task error trials for mouse 8474.
(A) Average pseudo-colored GCaMP cortical image montage binned every 500 ms go-task activity over a 2.5 s period before and after vibratory go-cue presentation (500 ms vibration) for mouse tag 0252. Large image shows the maximal activation over this period (difference between pre-cue minimum and post-cue maximum values for images binned over 100 ms). Upper panel plot normalized behavioral gradient signal for indicated body region ROIs. Bottom panel plots: average GCaMP signal for 3 trials of unsuccessful go licking trial (no licking in the response window) for a pixel in anterolateral motor cortex (white circle coordinates 52, 27 in the 64 × 64 image shown). (B) Similar plots as A but for trials a No-Go false alarm event occurred (mouse liked in the correct time window but for a non-rewarded cue). (C) Similar plots as A but for trials where a go stimulus was given but the mouse licked too early and was not rewarded. These data were obtained autonomously from 8/24/2018 to 8/29/2018 and are the average of all head-fixed trials of given outcome type.
Figure 8—figure supplement 7

Averaged GCaMP6 and behavioral ROI data for licking task error trials for mouse 0252.
(A) Average pseudo-colored GCaMP cortical image montage binned every 500 ms go-task activity over a 2.5 s period before and after vibratory go-cue presentation (500 ms vibration) for mouse tag 8474. Large image shows the maximal activation over this period (difference between pre-cue minimum and post-cue maximum values for images binned over 100 ms). Upper panel plot normalized behavioral gradient signal for indicated body region ROIs. Bottom panel plots: average GCaMP signal for 3 trials of unsuccessful go licking trial (no licking in the response window) for a pixel in anterolateral motor cortex (white circle coordinates 52, 27 in the 64 × 64 image shown). (B) Similar plots as A but for trials a No-Go false alarm event occurred (mouse licked in the correct time window but for a non-rewarded cue). (C) Similar plots as A but for trials where a go stimulus was given but the mouse licked too early and was not rewarded. These data were obtained autonomously from 8/24/2018 to 8/29/2018 and are the average of all head-fixed trials of given outcome type.
Figure 8—video 1
Correct response hit-trial Go-trial (Go = 2 code), averaged pseudo-colored GCaMP cortical images over a 2.5 s period before and after vibratory go-cue presentation for mouse M8423.
Recorded cortical images were concatenated as video files after spatial and temporal binning into 64 × 64 pixels every 100 ms (spatial binning is done by averaging, temporal binning uses the maximum of dF/Fo values). The 500 ms vibration cue is indicated with a red bar in the upper part of the video starting at 0 s and date, mouse and outcome-code of the trials shown are displayed above the image data. In case of successful Go trials (Go = 2) water reward is approximately given at 2 s, all other trials are unrewarded. Data corresponds to Figure 8 in trial number and other factors.
Figure 8—video 2
Correct rejection no-response No-Go-trial (Go = 1 code), averaged pseudo-colored GCaMP cortical images over a 2.5 s period before and after vibratory cue presentation for mouse M8423, not rewarded.
Recorded cortical images were concatenated as video files after spatial and temporal binning into 64 × 64 pixels every 100 ms (spatial binning is done by averaging, temporal binning uses the maximum of dF/Fo values). The 500 ms vibration cue is indicated with a red bar in the upper part of the video starting at 0 s and date, mouse and outcome-code of the shown trials are displayed above the image data. In case of successful Go trials (Go = 2) water reward is approximately given at 2 s, all other trials are unrewarded (as was this averaged data). Data correspond to Figure 8 in trial number and other factors.
Figure 8—video 3
In-correct response Go-trial licked early (−4 code, considered hit because they responded to correct cue), averaged pseudo-colored GCaMP cortical images over a 2.5 s period before and after vibratory go-cue presentation for mouse M8423, not rewarded.
Recorded cortical images were concatenated as video files after spatial and temporal binning into 64 × 64 pixels every 100 ms (spatial binning is done by averaging, temporal binning uses the maximum of dF/Fo values). The 500 ms vibration cue is indicated with a red bar in the upper part of the video starting at 0 s and date, mouse and outcome-code of the shown trials are displayed above the image data. In case of successful Go trials (Go = 2) water reward is approximately given at 2 s, all other trials are unrewarded. Data correspond to Figure 8.
Figure 8—video 4
In-correct response false alarm No-Go-trial (licked in correct time window for No-Go −1 code), averaged pseudo-colored GCaMP cortical images over a 2.5 s period before and after vibratory go-cue presentation for mouse M8423, not rewarded.
Recorded cortical images were concatenated as video files after spatial and temporal binning into 64 × 64 pixels every 100 ms (spatial binning is done by averaging, temporal binning uses the maximum of dF/Fo values). The 500 ms vibration cue is indicated with a red bar in the upper part of the video starting at 0 s and date, mouse and outcome-code of the shown trials are displayed above the image data. In case of successful Go hit trials (Go = 2) water reward is approximately given at 2 s, all other trials are unrewarded. Data correspond to Figure 8.
Figure 9
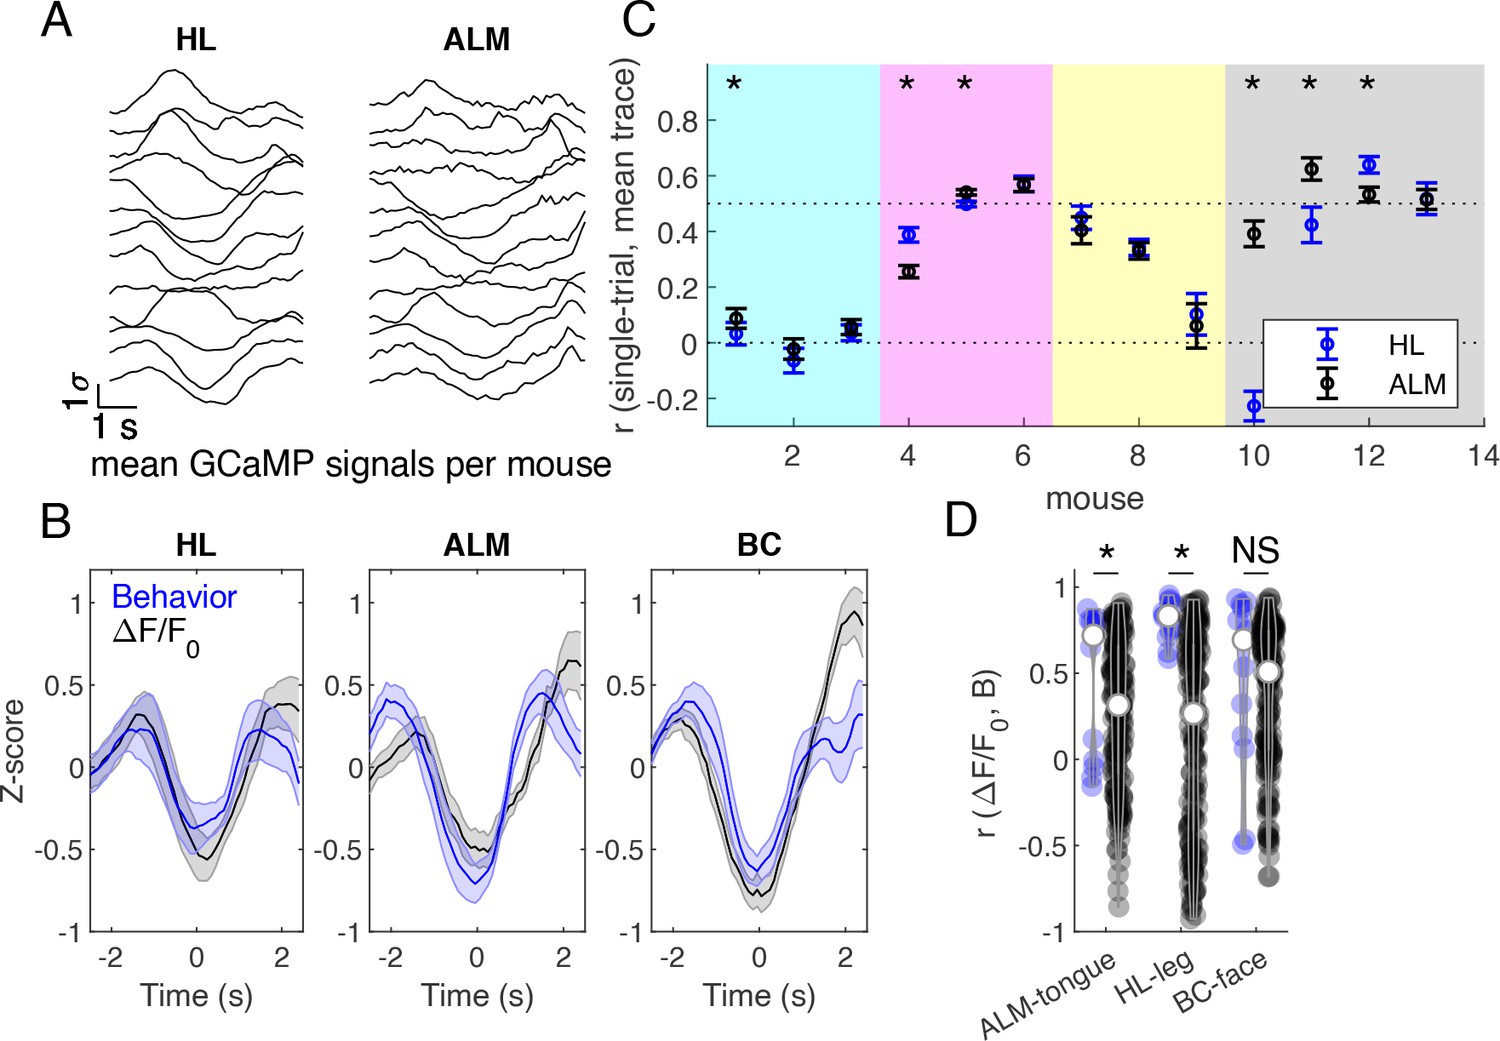
Brain-behavior correlations on grouped mouse data during successful Go trials.
(A) Z-scored cortical fluorescence values plotted for each of 13 mice, first averaged spatially over the cortical region, then averaged across trials, for hind limb (HL) and anterior lateral motor (ALM) cortical areas. (B) Averaged z-scored fluorescence signal (black) and behavioral gradients (blue) across mice in hindlimb (HL), anterior lateral motor (ALM), and barrel cortex (BC) areas. Mean +/- SEM. (C) Correlation between single trial fluorescence activity and the averaged fluorescence signal across mice in hind limb (blue) and anterior lateral motor cortex (black). Markers indicate mean +/- SEM. Mice from different cages are grouped by background color (females last 4 mice, #10-13). (D) Correlations between average fluorescence signal and behavior gradients. Blue violins show correct pairings, and black violins show mismatched pairings across mice. * indicates p<0.05, Wilcoxon signed rank test.
Figure 10
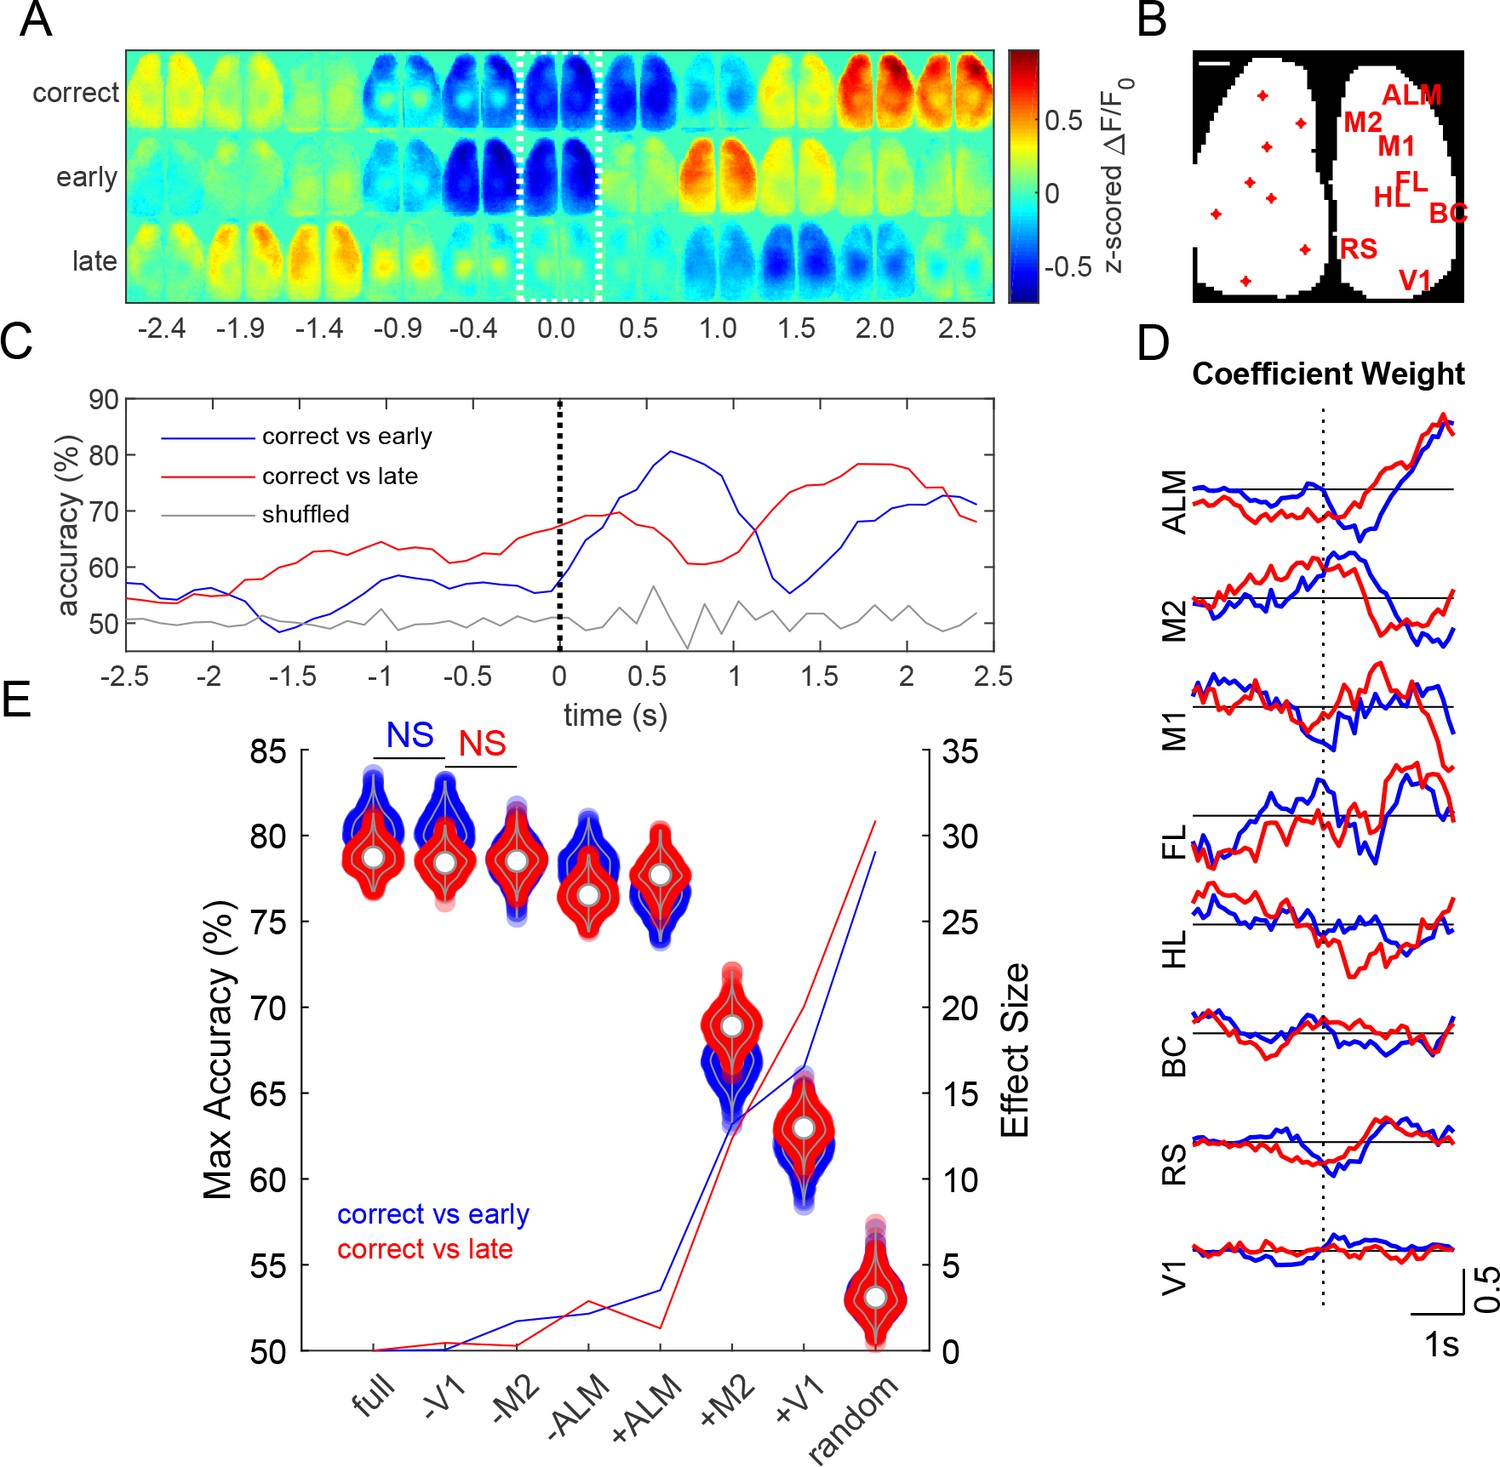
Prediction of task outcome from cortical fluorescence signals using a ridge regression model.
(A) Z-scored fluorescence maps over the course of the trial (averaged across 454 trials averaged over 13 mice for each trial outcome). Dotted region indicates time when cue is delivered. (B) Locations of cortical regions used for the general linear model (scale bar: 1 mm). (C) Task outcome prediction accuracy vs time. Black dotted line indicates the time when the stimulus was delivered. (D) Coefficient weights as a function of time for correct vs early (blue) and correct vs late (red) models. (E) Violin plots show maximum accuracy for full and reduced models. Solid lines show effect sizes for reduced models compared to the full model. Model types denoted by (-) indicate that the region specified was randomly permuted, whereas (+) indicates that all regions except for the specified region were randomly permuted (e.g. –V1 indicates V1 calcium signal trials were shuffled, whereas +V1 indicates that all calcium signal trials except those from V1 were shuffled). (p<0.05, repeated measures one way ANOVA with post-hoc Bonferroni correction for all groups except those labeled not significant (NS)).
Tables
Table 1
Headfixation statistics for 23 of 44 male and 5 of 8 female mice (lower panel) that were good performers.
6 of the 23 shown male mice were subsequently removed from the task due to health issues (2/6) or because they suddenly stopped performing (4/6). All together 23 of 44 mice were removed from the task, due to issues with the window and/or health (6/23), sideways entries (3/23) or poor participation (14/23) while 21 of 44 continued to perform. 4 mice of these latter 14 already stopped participating before headfixation protocol started. All behavioral data are available online in database where animal specific queries can be made (see Methods).Genotypes: Ai94-GCaMP6s (Group 1,3), Thy1-GCaMP6s (Group 2), TTA-GCaMP6s (Group 4,5, 6 females). Headfixed stats were calculated for the number of days with headfixation as indicated and only headfixed trials were used for calculation of task success rate.
| Male Mice Facility trained 24/7 | Group | Days under headfix protocol | Days with head-fixation | Total head-fixes | Total hours head-fixed | Head-fixes /day | Minutes head-fixed /day | Success rate GO trials of last 5 days [%] | Number of trials daily average based on 5 days at max success, all outcomes |
|---|---|---|---|---|---|---|---|---|---|
| 2016080026 | 1 | 90 | 60 | 933 | 9.8 | 15.6 | 9.8 | 91.3 | 17.6 |
| 201608466 | 1 | 93 | 91 | 2440 | 26 | 26.8 | 17.1 | 87.8 | 46.8 |
| 201608468 | 1 | 93 | 93 | 8360 | 97.7 | 89.9 | 63 | 8.6 | 1615.2 |
| 201608481 | 1 | 92 | 91 | 2197 | 24.2 | 24.1 | 15.9 | 92.8 | 222.6 |
| 201609136 | 1 | 90 | 82 | 1469 | 16.1 | 17.9 | 11.8 | 56.5 | 335 |
| 201609336 | 1 | 93 | 90 | 1344 | 11.9 | 14.9 | 8 | 70.4 | 23 |
| 210608298 | 1 | 92 | 88 | 2369 | 25.4 | 26.9 | 17.3 | 95.2 | 209.8 |
| 2016090793 | 2 | 43 | 32 | 1397 | 11.5 | 43.7 | 21.6 | 41.4 | 162.4 |
| 2016090943 | 2 | 47 | 37 | 1118 | 9.2 | 30.2 | 14.9 | 34.6 | 184.8 |
| 2016091112 | 2 | 13 | 7 | 141 | 1.1 | 20.1 | 9.1 | 6.1 | 28 |
| 2016090629 | 3 | 36 | 34 | 763 | 9.4 | 22.4 | 16.5 | 78.3 | 196.2 |
| 2016090797 | 3 | 33 | 30 | 866 | 10.8 | 28.9 | 21.7 | 75.8 | 173.2 |
| 2016090882 | 3 | 14 | 12 | 170 | 2 | 14.2 | 9.8 | 62.3 | 96.6 |
| 2016090964 | 3 | 9 | 8 | 144 | 1.4 | 18 | 10.6 | 58.8 | 100.5 |
| 2016090965 | 3 | 35 | 31 | 1024 | 12.8 | 33 | 24.8 | 68.8 | 185.8 |
| 2016090985 | 3 | 36 | 34 | 2072 | 25.9 | 60.9 | 45.7 | 0.4 | 581 |
| 2016091183 | 3 | 13 | 12 | 288 | 3.2 | 24 | 15.9 | 40.7 | 130.2 |
| 2016080252 | 4 | 85 | 73 | 1314 | 14.6 | 18 | 12 | 74.9 | 74.8 |
| 201608423 | 4 | 91 | 84 | 2513 | 29.9 | 29.9 | 21.4 | 73.1 | 359.8 |
| 201608474 | 4 | 35 | 33 | 632 | 6.7 | 19.2 | 12.1 | 42.9 | 199 |
| 801010205 | 5 | 22 | 21 | 368 | 2.8 | 17.5 | 8 | 31.5 | 92.8 |
| 801010219 | 5 | 36 | 34 | 803 | 7 | 23.6 | 12.4 | 34.6 | 153.4 |
| 801010270 | 5 | 34 | 27 | 362 | 3 | 13.4 | 6.7 | 30.2 | 130.4 |
| AVG | 53.3 | 48 | 1438.6 | 15.8 | 27.5 | 17.7 | 54.7 | 231.3 | |
| STDEV | 32.4 | 31.0 | 1690.9 | 19.9 | 17.3 | 12.9 | 28.4 | 326.8 | |
| SUM | 1225 | 1104 | 33087 | 362.4 | 633.1 | 406.1 | 5318.9 | ||
| Female Mice lab trained ~ 7 h/day | |||||||||
| 801010240 | 6 | 83 | 62 | 953 | 9.9 | 13.4 | 9.6 | 42.9 | 78 |
| 2018121234 | 6 | 83 | 39 | 812 | 8.8 | 14.5 | 13.6 | 43.5 | 93.4 |
| 2018121244 | 6 | 83 | 57 | 818 | 8.1 | 11.9 | 8.6 | 30.6 | 123.4 |
| 2018121245 | 6 | 83 | 68 | 1308 | 14.2 | 18.4 | 12.5 | 36.8 | 125.4 |
| 2018121379 | 6 | 83 | 70 | 1532 | 16.2 | 21.6 | 13.9 | 34.4 | 148.2 |
| AVG | 83 | 59.2 | 1084.6 | 11.5 | 16.0 | 11.6 | 37.6 | 113.68 | |
| STDEV | 0 | 12.4 | 321.2 | 3.6 | 4.0 | 2.4 | 5.5 | 27.9 | |
| SUM | 415 | 355.2 | 5423 | 57.3 | 79.8 | 58.2 | 568.4 | ||
Table 2
Parts for Headfixing System.
| Description | # | Manufacturer | Part Number | |||
|---|---|---|---|---|---|---|
| Cage | ||||||
| 1/4–20 Bolts, Setscrews, Nuts, Washers | ||||||
| 8/32 Bolts, Nuts, Washers | ||||||
| M2 and M3 Screws, Nuts, and Washers | ||||||
| Cage 7.5’ X 11.5’ X 5’ | 2 | Lab Products | 10027 | |||
| Aluminum Breadboard 18’ x 24’ x 1/2’, 1/4’−20 Taps | 1 | Thorlabs | MB1824 | |||
| Ø1’ Pillar Posts with 1/4’−20 Taps, 2’ | 4 | Thorlabs | RS2 | |||
| Ø1’ Pillar Posts with 1/4’−20 Taps, 3’ | 8 | Thorlabs | RS3 | |||
| Ø1’ Pillar Posts with 1/4’−20 Taps, 6’ | 8 | Thorlabs | RS6 | |||
| Clamping Fork, 1.24’ Counterbored Slot, Universal | 4 | Thorlabs | CF125 | |||
| Ø1/2’ Pedestal Post Holder | 3 | Thorlabs | PH2E | |||
| Ø1/2’ Optical Post, SS, 8–32 Setscrew, 1/4’−20 Tap, L = 8’ | 3 | Thorlabs | TR8 | |||
| Ø1/2’ Optical Post, SS, 8–32 Setscrew, 1/4’−20 Tap, L = 12’ | 1 | Thorlabs | TR12 | |||
| Right-Angle Clamp for Ø1/2’ Posts, 3/16’ Hex | 2 | Thorlabs | RA90 | |||
| Ø25 mm Post Spacer, Thickness = 3 mm | 1 | Thorlabs | RS3M | |||
| Ø1.25’ Studded Pedestal Base Adapter, 1/4’−20 Thread | 1 | Thorlabs | BE1 | |||
| Glass cut to 93 mm X 31 mm X 3 mm rectangle | 1 | Superglass | Custom | |||
| HS-645MG High Torque, Metal Gear Premium Sport Servo | 1 | Hitec | 32645S | |||
| HSB-9475SH brushless motor servo superior performance | 1 | Hitec | ||||
| RFID Reader ID-20LA (125 kHz) | 2 | IDInnovations | ID-20LA | |||
| RFID Reader Breakout | 2 | Sparkfun | 13030 | |||
| IR Break Beam Sensor - 5 mm LEDs | 1 | Adafruit | 2168 | |||
| NIR-Blocking Filters CALFLEX X | 1 | Qioptiq | G380227033 | |||
| RPi Camera (F), Supports Night Vision, Adjustable-Focus | 2 | Waveshare | 10299 | |||
| Flex Cable for Raspberry Pi Camera or Display - 2 meters | 2 | Adafruit | 2144 | |||
| Load Cell Amplifier - HX711 | 1 | Sparkfun | SEN-13879 | |||
| Micro Load Cell (0–100 g) - CZL639HD | 1 | Bonad/Alibaba | CZL639M | |||
| Capacitance sensor MRP121 | 1 | Adafruit | 1982 | |||
| Machined Parts (Stainless Steel) | ||||||
| Head_fix_servo_coupler_PROFESH_revised_no_pinch.ipt | 1 | Servo T-arm | ||||
| ahf_contact_plate_L.stp | 1 | Tube ending | ||||
| ahf_contact_plate_R.stp | 1 | Tube ending | ||||
| 3D Printed Parts (Black PLA) | ||||||
| Camera_Mount_V2.stl | 1 | |||||
| head_bar_grabbing_plate_extended_6 mm_hole_in_bottom v25_reinforced.stl | 1 | |||||
| Tunnel_Coupler.stl | 1 | |||||
| Tunnel_Guider.stl | 2 | |||||
| Tunnel_V2.stl | 1 | |||||
| RFID_Holder.stl | 2 | |||||
| Bottle_Holder.stl | 1 | |||||
| AHF_HeadStraightener_25 mm.stl | 1 | |||||
| AHF_HeadStraightener_50 mm.stl | 1 | |||||
| 3D Printed Parts (Protolabs Watershed plastic) | ||||||
| head_bar_grabbing_plate_extended_6 mm_hole_in_bottom V24 barrier1mmgreater_cut_front_bottom.stl | 1 | Protolabs special order | ||||
| Water reward parts valve, tubing etc. | ||||||
| Ø1’ Pillar Post, 1/4’−20 Taps, L = 12’ | 1 | Thorlabs | RS12 | |||
| Water Solenoid | 1 | Gems Sensor | 45M6131 | |||
| Male Luer 1/16 | 2 | Component Supply Co. | LN-ML-062 | |||
| Polyurethane Tubing 1/8"ID X 3/16"OD | 1 | Component Supply Co. | PUT-02A | |||
| Med/Surgical Tubing 1/16"ID X 1/8"OD | 1 | Component Supply Co. | TND65-062A | |||
| 22 Gauge Needle 1.5 Inch | 1 | Becton Dickinson | Z192473 | |||
| 250 ml Water Bottle | 1 | Thermo Fisher Nalgene | 2003–0008 | |||
| 3D Printed Parts (Black PLA) | ||||||
| Triple Light Guide and Imaging Parts | ||||||
| Triple Bandpass Filter (camera) | 1 | Chroma | 69013 m | |||
| Liquid Light Guide | 1 | Thorlabs | LLG0338-4 | |||
| SM1 Adapter for Liquid Light Guide | 1 | Thorlabs | AD3LLG | |||
| SM1 Lens Tube, 3.00’ Thread Depth | 3 | Thorlabs | SM1L30 | |||
| SM1 Lens Tube, 1.00’ Thread Depth | 3 | Thorlabs | SM1L10 | |||
| SM1 Lens Tube, 2.00’ Thread Depth | 1 | Thorlabs | SM1L20 | |||
| SM1 Retaining Rings | 2 | Thorlabs | SM1RR-P10 | |||
| Dichroic Cage Cube | 2 | Thorlabs | CM1-DC | |||
| Cage Cube Connector | 1 | Thorlabs | CM1-CC | |||
| Compact Clamp with Variable Height | 1 | Thorlabs | CL3 | |||
| Bi-Convex Lens | 4 | Thorlabs | LB1761 | |||
| AT455DC Size: 26 * 38 mm | 1 | Chroma | AT455DC | |||
| 25 mm x 36 mm Longpass Dichroic Mirror, 550 nm Cutoff | 1 | Thorlabs | DMLP550R | |||
| Ø1’ Bandpass Filter, CWL = 620 ± 2 nm, FWHM = 10 ± 2 nm | 1 | Thorlabs | FB620-10 | |||
| ET480/30x Size: 25mmR R = Mounted in Ring | 1 | Chroma | ET480/30x | |||
| Ø1’ Bandpass Filter, CWL = 440 ± 2 nm, FWHM = 10 ± 2 nm | 1 | Thorlabs | FB440-10 | |||
| Royal-Blue (448 nm) Rebel LED | 1 | Luxeon Star | SP-01-V4 | |||
| Blue (470 nm) Rebel LED | 1 | Luxeon Star | SP-01-B6 | |||
| Red-Orange (617 nm) Rebel LED | 1 | Luxeon Star | SP-01-E6 | |||
| Machined Parts (Stainless Steel) | ||||||
| Milled as-1.50_2_v2.SLDPRT | 3 | |||||
| Spacer_with_wire_hole_as-.500_v2.SLDPRT | 3 | |||||
| LED_mount_as-1.50_v2.SLDPRT | 3 | |||||
| 3D Printed Parts (Black PLA) | ||||||
| TripleLEDLightGuide_Base.stl | 1 | |||||
| Light_Guide_Mount_V2.stl | 1 | |||||
Additional files
-
Supplementary file 1
Illustrated supplemental cage construction guide.
- https://cdn.elifesciences.org/articles/55964/elife-55964-supp1-v2.pdf
-
Supplementary file 2
CAD for 3D printed and machined parts.
- https://cdn.elifesciences.org/articles/55964/elife-55964-supp2-v2.zip
-
Supplementary file 3
Electronics schematics.
- https://cdn.elifesciences.org/articles/55964/elife-55964-supp3-v2.zip
-
Transparent reporting form
- https://cdn.elifesciences.org/articles/55964/elife-55964-transrepform-v2.pdf
Download links
A two-part list of links to download the article, or parts of the article, in various formats.
Downloads (link to download the article as PDF)
Open citations (links to open the citations from this article in various online reference manager services)
Cite this article (links to download the citations from this article in formats compatible with various reference manager tools)
Automated task training and longitudinal monitoring of mouse mesoscale cortical circuits using home cages
eLife 9:e55964.
https://doi.org/10.7554/eLife.55964


