Mouse T cell priming is enhanced by maturation-dependent stiffening of the dendritic cell cortex
- Department of Pathology and Laboratory Medicine, Children's Hospital of Philadelphia Research Institute and Perelman School of Medicine at the University of Pennsylvania, United States
Figures
Figure 1 with 4 supplements
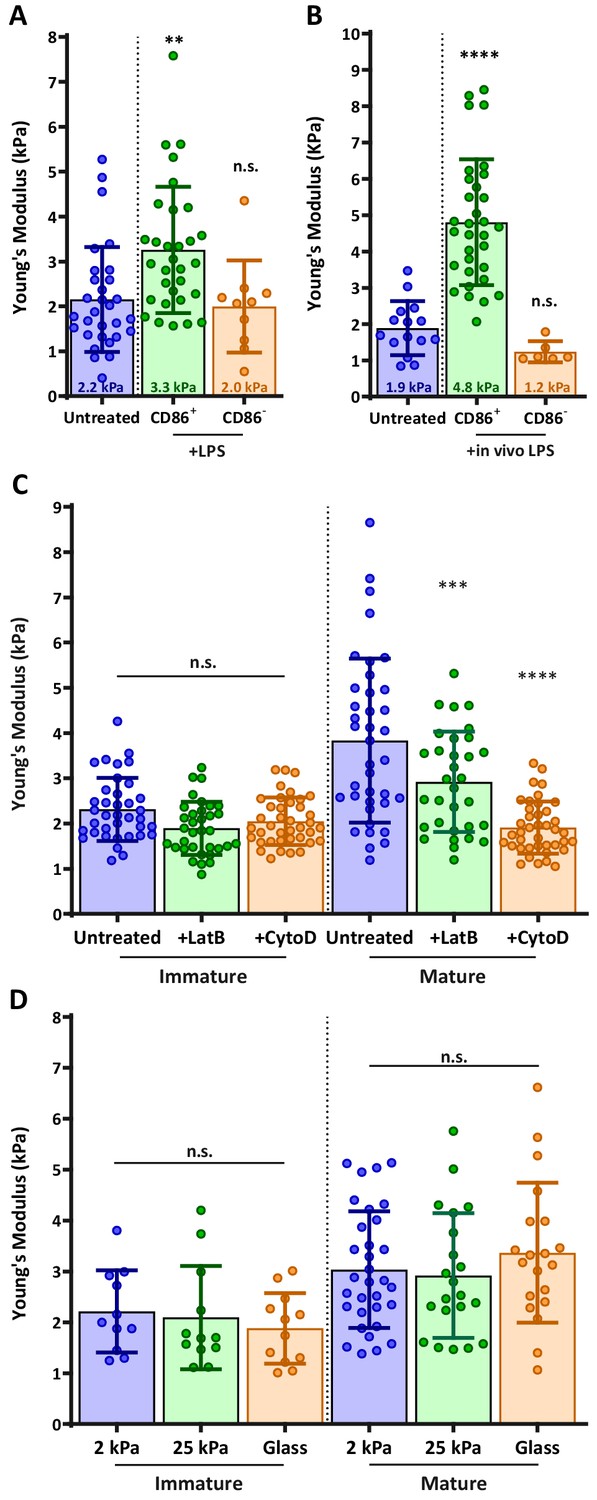
DC maturation induces an actin-dependent increase in cortical stiffness.
(A) BMDCs were untreated or matured by treatment with LPS, and cortical stiffness was measured by AFM microindentation. Fluorescent anti-CD86 labeling was used to select immature (CD86-negative) or mature (CD86 high) cells. (B) Ex vivo DCs were purified from spleens of untreated mice or from mice injected with lipopolysaccharide 24 hr before harvesting the spleen, and analyzed as in A. (C) Immature or LPS-matured BMDCs either left untreated or treated with 10 µm of the actin depolymerizing agents latrunculin-B or cytochalasin-D before AFM measurements. (D) Immature or LPS-matured BMDCs were plated on substrates of different stiffness before AFM measurements. Data are pooled from 2 to 3 independent experiments. Each data point represents an average of two stiffness measurements at different locations around a single cell nucleus. Error bars denote standard deviation. n.s non-significant, **p<0.01, ***p<0.001, ****p<0.0001 calculated by an unpaired one-way ANOVA, post-hoc Tukey corrected test.
-
Figure 1—source data 1
Figure 1 - data table.
- https://cdn.elifesciences.org/articles/55995/elife-55995-fig1-data1-v2.xlsx
Figure 1—figure supplement 1
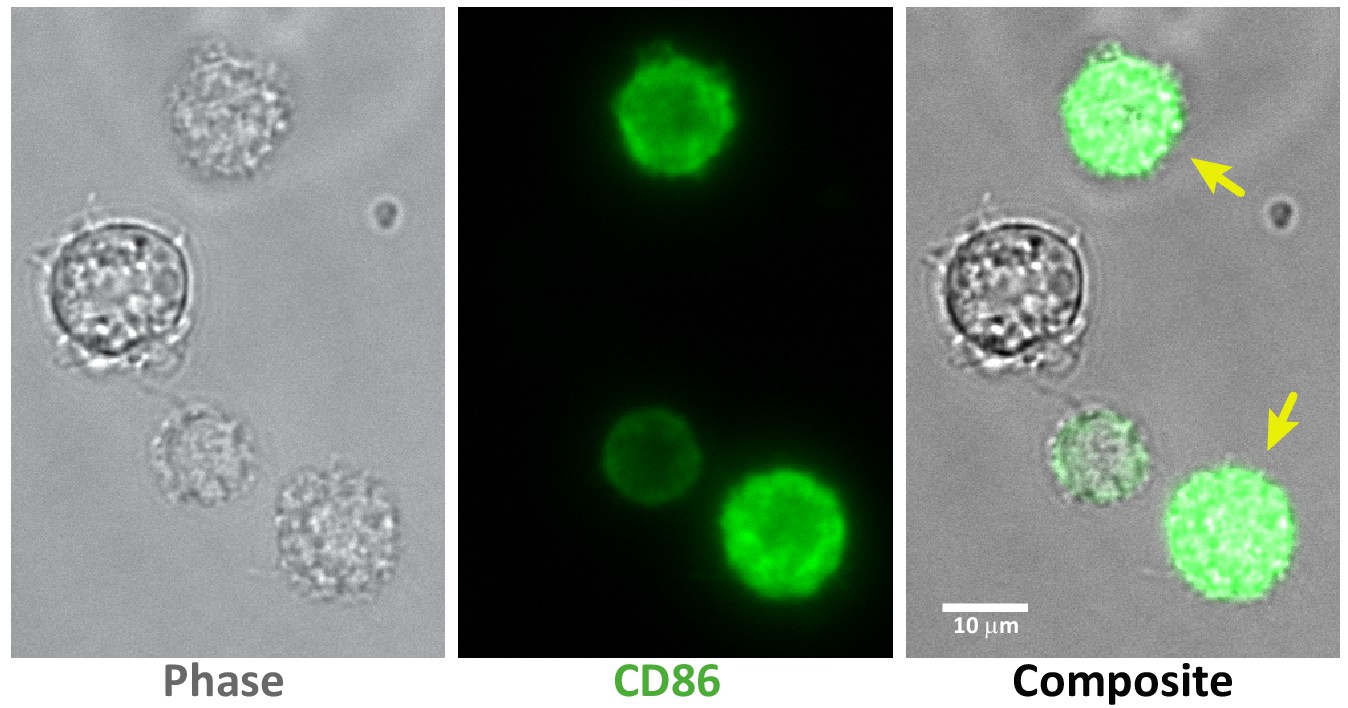
Selecting mature or immature BMDCs based on CD86 staining.
40× images of LPS-treated BMDCs stained with Alexa 488-αCD86, demonstrating how cells were selected for AFM measurements. Images clearly show that while many cells express high levels of CD86, some express little to none. Only cells expressing high levels of CD86 (yellow arrows) were selected for the analysis of mature BMDCs.
Figure 1—figure supplement 2
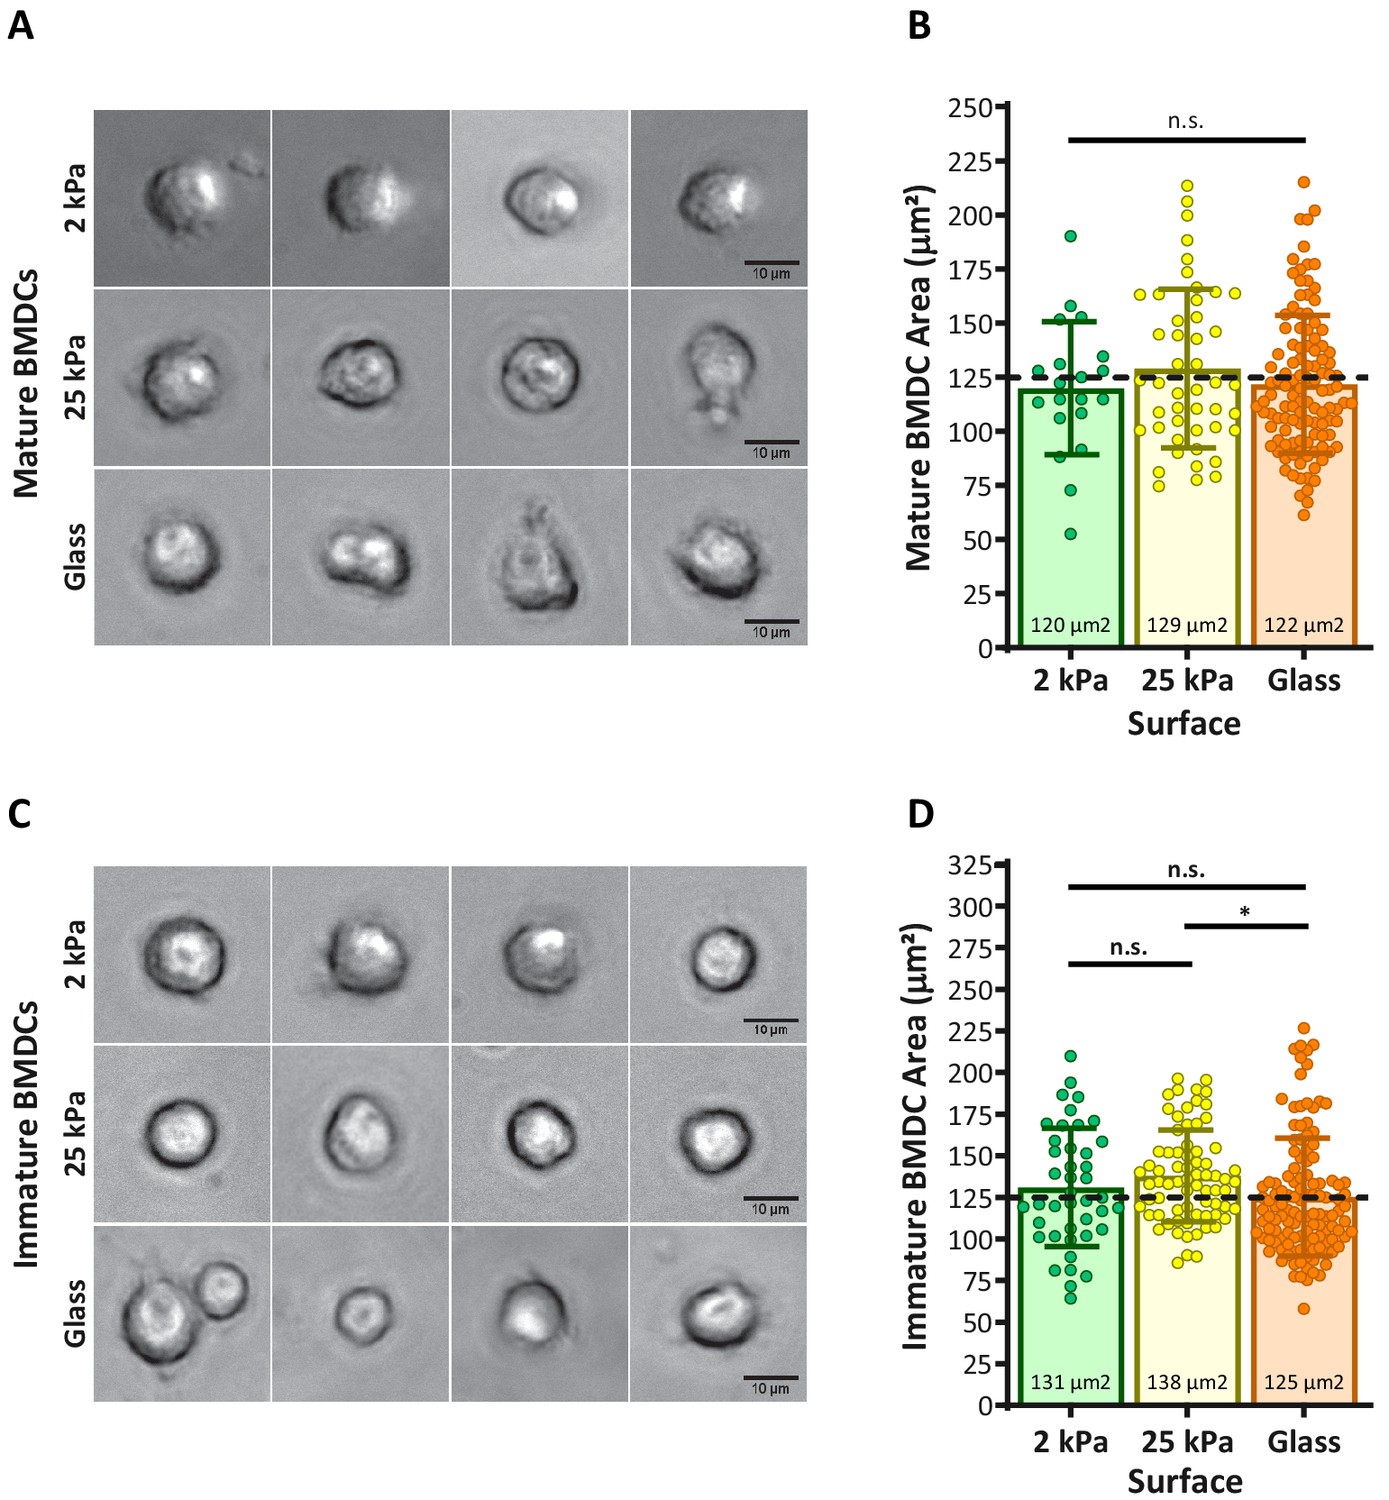
Analysis of BMDC spreading on hydrogel and glass surfaces.
BMDCs were allowed to spread for 4 hr on 2 and 25 kPa hydrogels or glass surfaces. Cells were imaged through the hydrogel using a 40×, long working distance objective. (A,C) Representative phase-contrast images of mature and immature BMDC. (B,D) Analysis of spreading area, determined from parallel widefield fluorescence images of cells expressing GFP-Lifeact.
-
Figure 1—figure supplement 2—source data 1
Figure 1 - figure supplement 2 - data table.
- https://cdn.elifesciences.org/articles/55995/elife-55995-fig1-figsupp2-data1-v2.xlsx
Figure 1—figure supplement 3
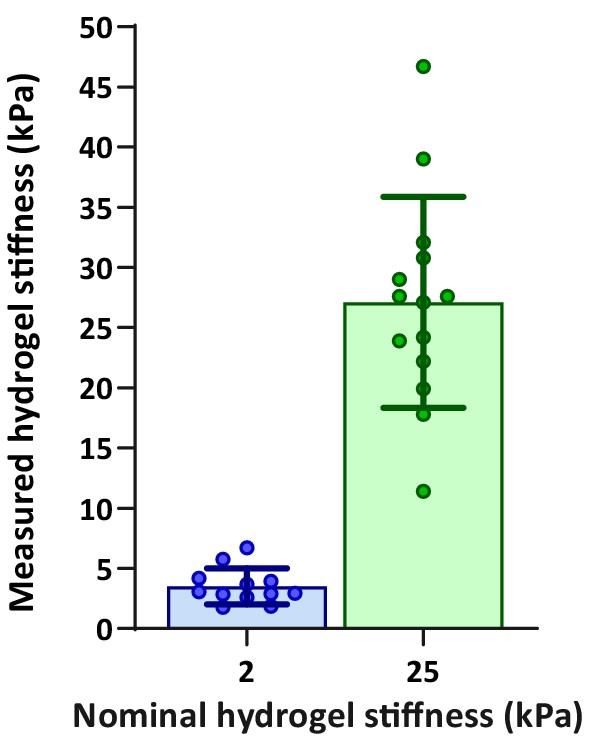
Validation of hydrogel compliances.
Direct AFM measurements of hydrogel compliance, validating the stiffness of hydrogels used for measuring the effects of substrate compliance on DC stiffness.
-
Figure 1—figure supplement 3—source data 1
Figure 1 - figure supplement 3 - data table.
- https://cdn.elifesciences.org/articles/55995/elife-55995-fig1-figsupp3-data1-v2.xlsx
Figure 1—figure supplement 4
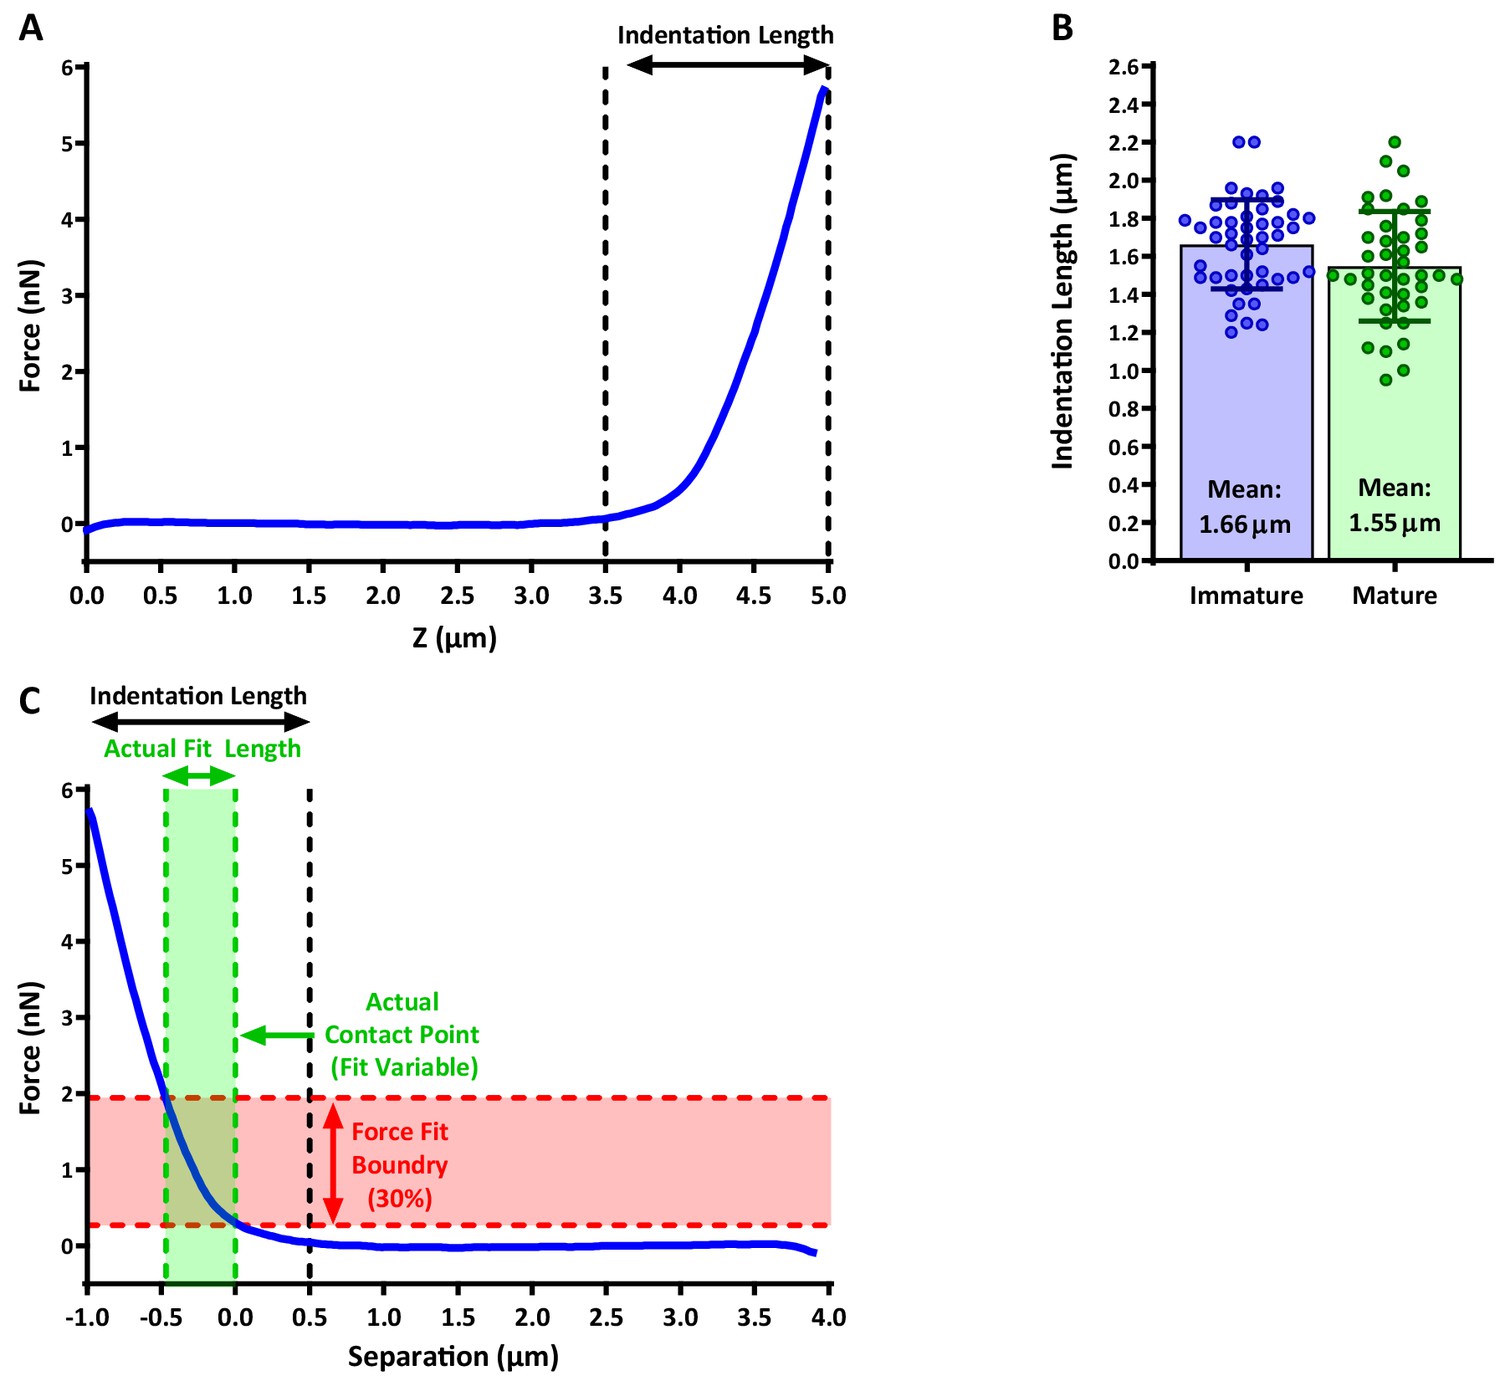
Indentation length and Hertzian model fitting on AFM data.
Indentation length was defined as the distance between initial deflection to maximal cantilever displacement. (A) An example of a force curve and the extraction of the de facto indentation length. (B) Quantification of indentation length for immature and mature DCs. (C) Example of fitting the data with the Hertzian model to calculate the Young’s modulus. Fitting is restricted to 30% of total force applied, which corresponds to ~0.5 µm indentation depth. Note that the contact point set by the fitting algorithm differs from the reference point used for the indentation length calculation (compare the dashed black line with the rightmost dashed green line).
-
Figure 1—figure supplement 4—source data 1
Figure 1 - figure supplement 4 - data table.
- https://cdn.elifesciences.org/articles/55995/elife-55995-fig1-figsupp4-data1-v2.xlsx
Figure 2
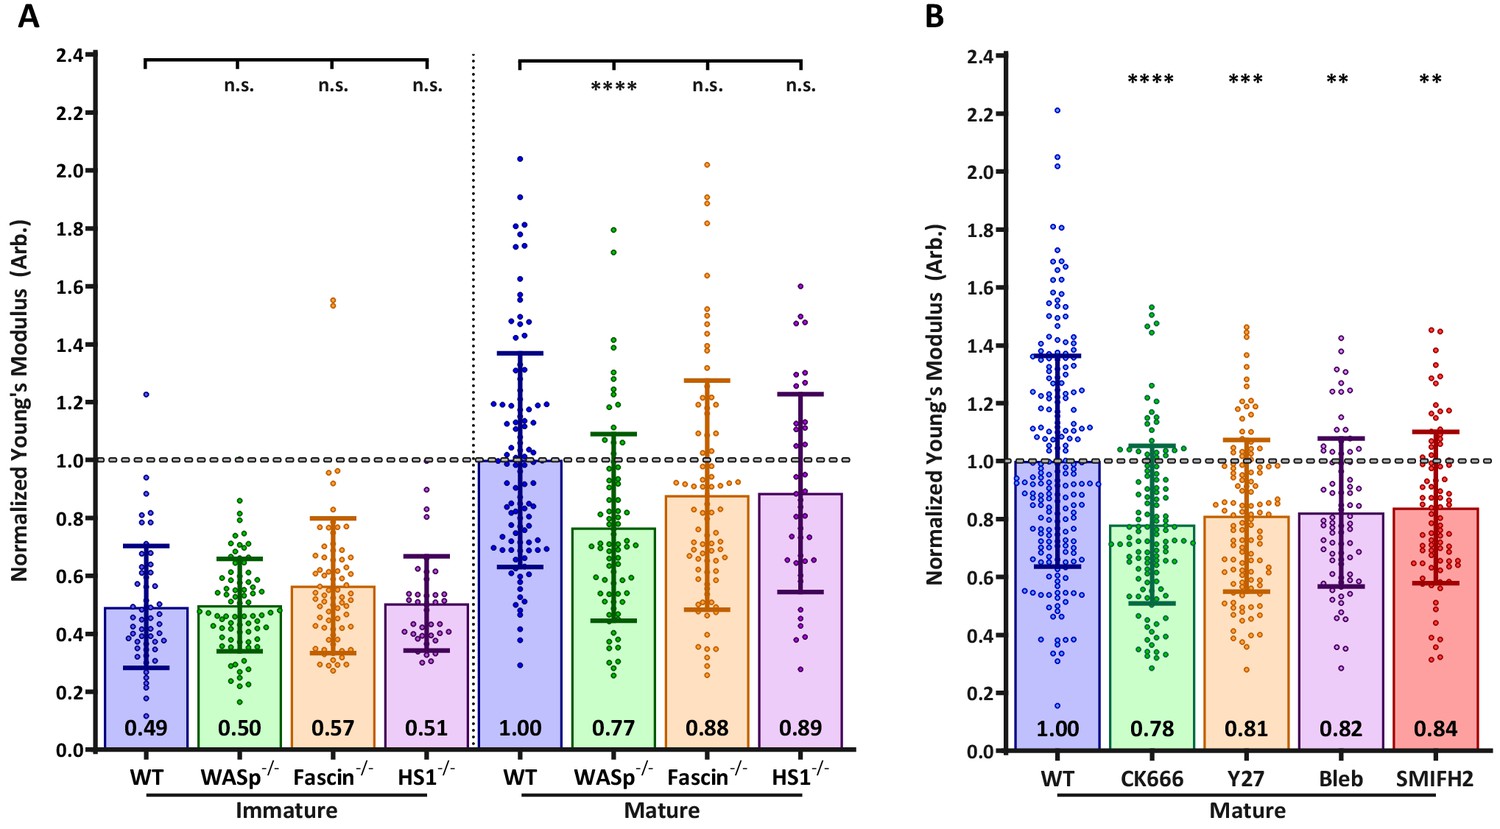
Effects of actin regulatory proteins on DC cortical stiffness.
Murine BMDCs from WT mice or mice lacking key actin-associated proteins were untreated or matured by treatment with LPS, and cortical stiffness was measured by AFM microindentation. To facilitate comparison between experiments, results were normalized to values of mature WT BMDCs in each experiment. (A) Cortical stiffness of BMDCs from mice lacking important actin modulating proteins. (B) Cortical stiffness of WT BMDCs treated with cytoskeletal inhibitors. CK666 (100 µM) was used to inhibit branched actin polymerization by Arp2/3. SMIFH2 (10 µm) was used to inhibit linear actin polymerization by formins. Acto-myosin contractility was inhibited directly with blebbstatin (50 µM) or indirectly with the Rho-kinase inhibitor Y27632 (25 µM). All drugs do not affect immature BMDCs (data not shown). Data points for untreated WT BMDCs (both immature and mature) were pooled from all experiments as a reference. The dashed line represents the average stiffness of untreated mature WT BMDCs from all experiments. Data are pooled from two to three independent experiments. Each data point represents an average of two stiffness measurements at different locations around a single cell nucleus. Error bars denote standard deviation. n.s non-significant, *p<0.05, **p<0.01, ***p<0.001, ****p<0.0001 calculated by an unpaired one-way ANOVA, with post-hoc Tukey correction.
-
Figure 2—source data 1
Figure 2 - data table.
- https://cdn.elifesciences.org/articles/55995/elife-55995-fig2-data1-v2.xlsx
Figure 3 with 2 supplements
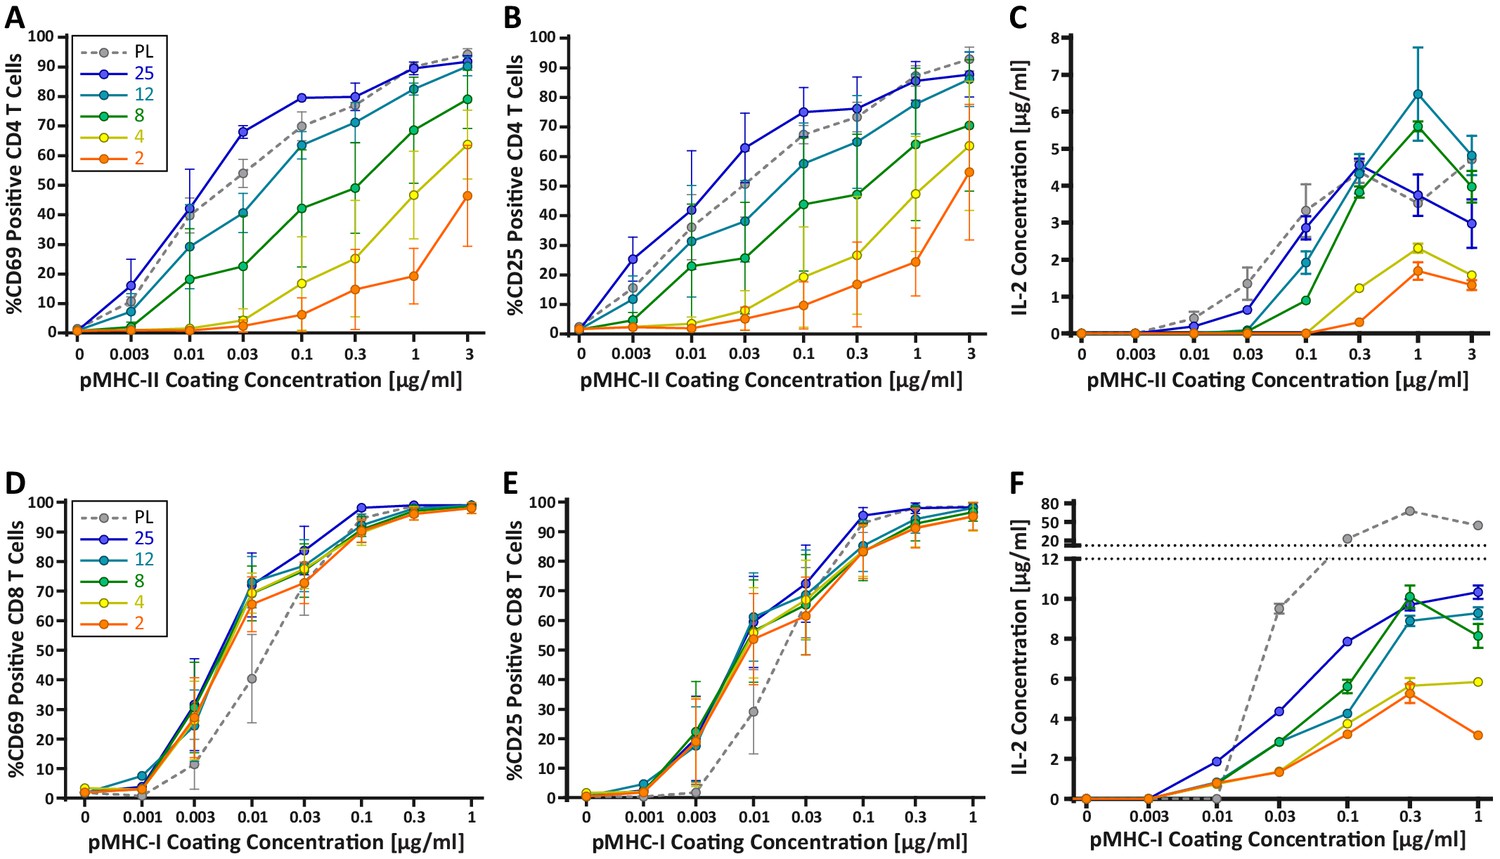
CD4+ and CD8+ T cells demonstrate vastly different stiffness responses.
Murine T cells were purified from lymph nodes and spleen and activated on stimulatory acrylamide hydrogel surfaces with a stiffness range of 2–25 kPa and plastic (PL). Stimulatory surfaces were coated with the indicated concentrations of pMHC-I or pMHC-II together with 2 µg/mL anti-CD28 to stimulate OT-I CD8+ or OTI-II CD4+ T cells, respectively. (A,B,D,E) Cells were harvested 24 hr post activation and expression of early activation markers was measured by flow cytometry. Data represent averages +/- SEM of percent positive cells from N = 3 independent experiments. (A,B) CD4+ T cells show profound stiffness dependent expression of both markers. (C,F) Cell supernatants were collected at 24 hr and IL-2 expression was analyzed by ELISA. Data represent means +/- StDev from three to six replicate samples from one representative experiment, N = 2 experiments.
-
Figure 3—source data 1
Figure 3 - data table.
- https://cdn.elifesciences.org/articles/55995/elife-55995-fig3-data1-v2.xlsx
Figure 3—figure supplement 1

Validation of hydrogel compliances.
Direct AFM measurements of hydrogel compliance, validating the stiffness of hydrogel surfaces used for activation of T cells.
-
Figure 3—figure supplement 1—source data 1
Figure 3—figure supplement 1 - data table.
- https://cdn.elifesciences.org/articles/55995/elife-55995-fig3-figsupp1-data1-v2.xlsx
Figure 3—figure supplement 2
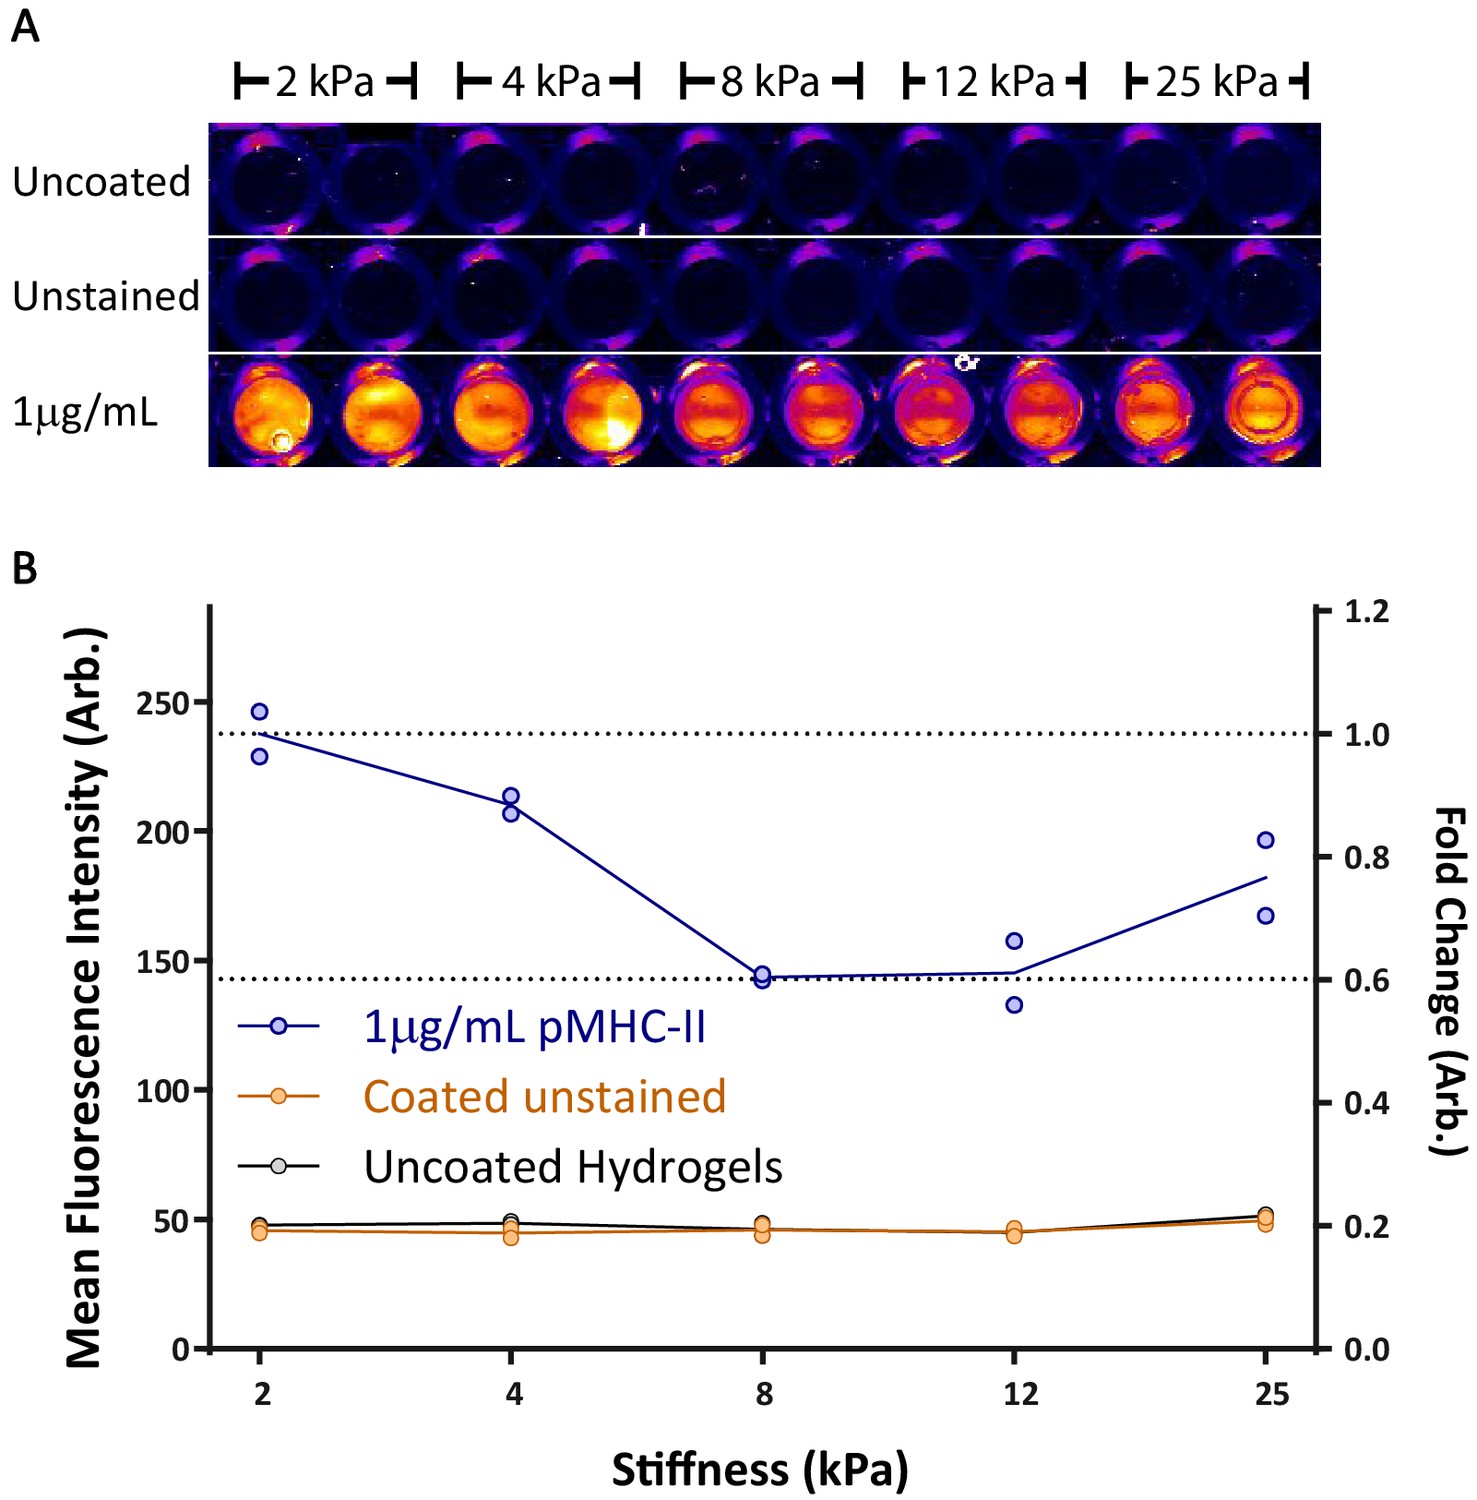
Binding of pMHC complex to various hydrogel surfaces.
Hydrogel surfaces were coated with 1 µg/mL pMHC-II complex, blocked with 0.25% bovine gelatin, then stained with rat-anti-mouse I-A\I-E followed by goat-anti-Rat Alexa680. (A) Fluorescence image of uncoated, unstained, and stained hydrogels using a LI-COR Odyssey reader. (B) Quantification of mean fluorescence intensity for the center of each well. Each data point represents a single hydrogel well (all measurements were made in duplicate); lines show mean values. Similar results were obtained using fluorescent neutravidin (not shown).
-
Figure 3—figure supplement 2—source data 1
Figure 3—figure supplement 2 - data table.
- https://cdn.elifesciences.org/articles/55995/elife-55995-fig3-figsupp2-data1-v2.xlsx
Figure 4
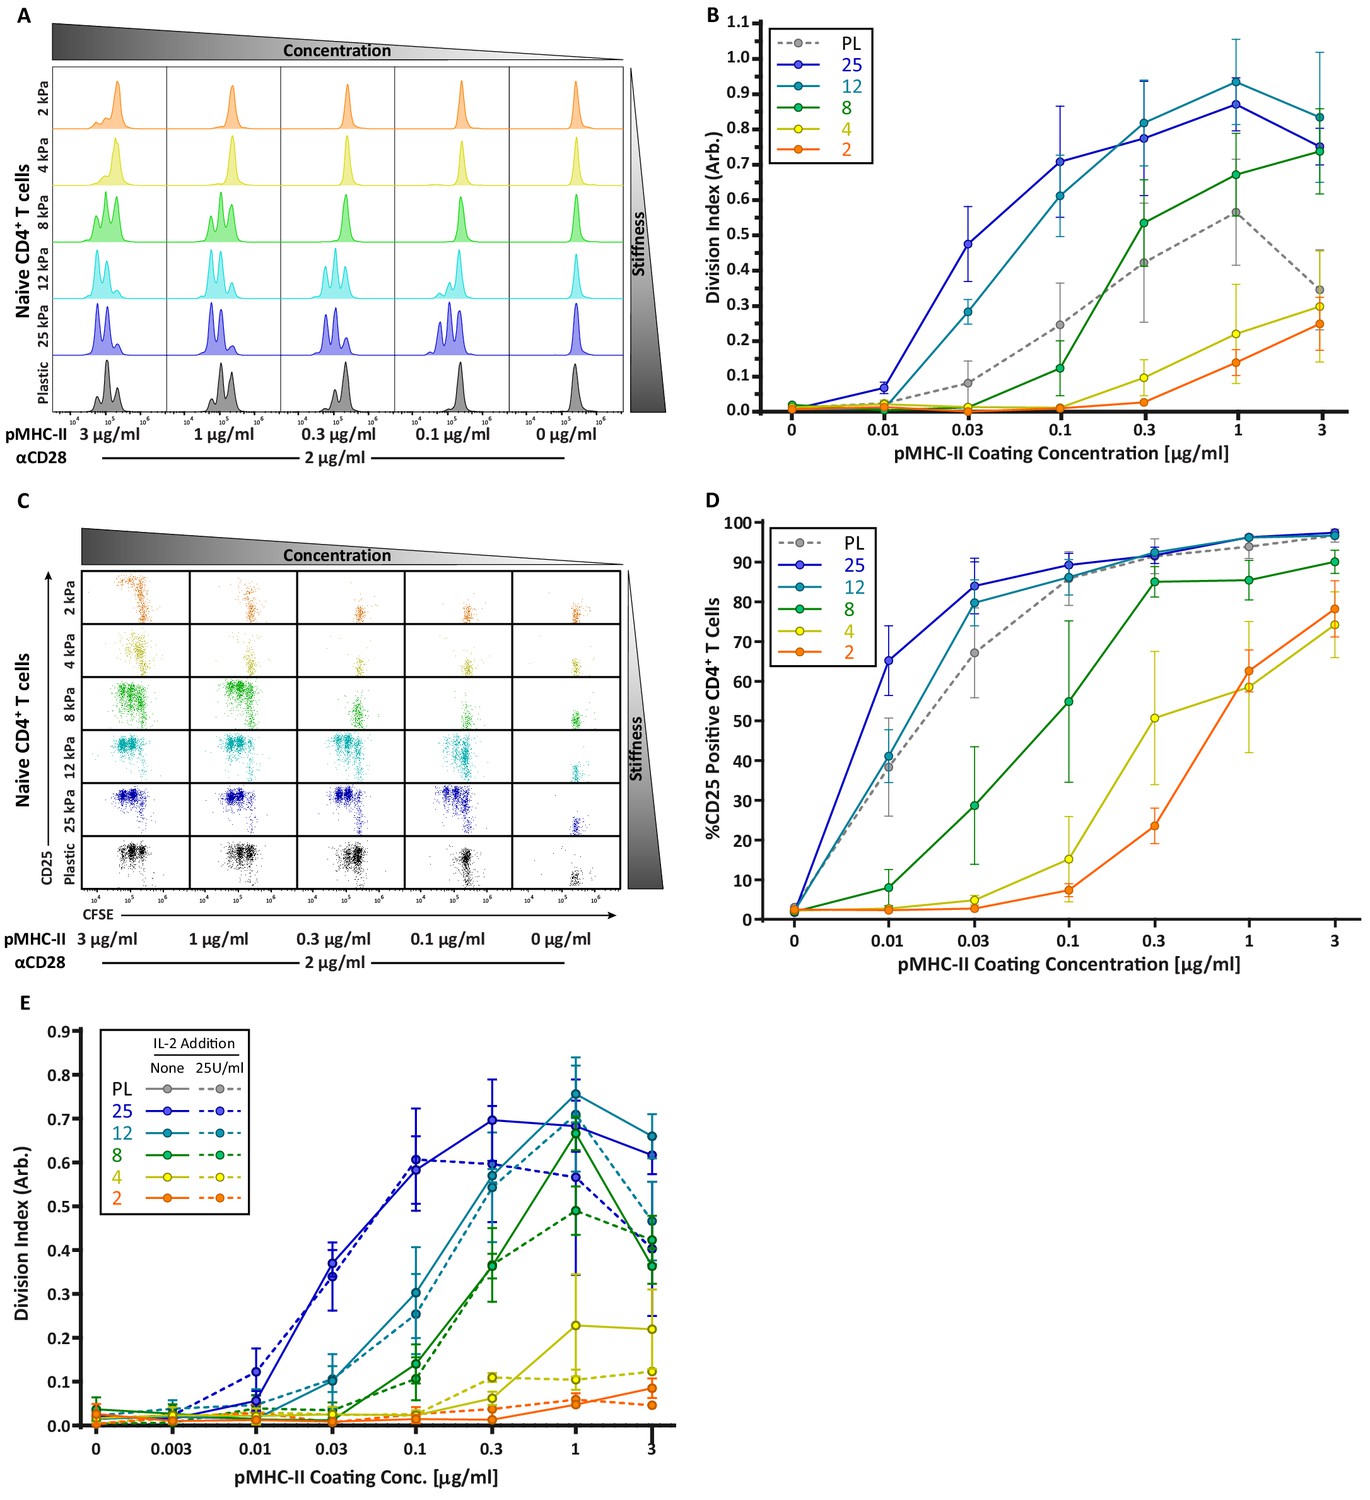
CD4 T cell proliferation is stiffness dependent and IL-2 independent.
OT-II CD4+ T cells were purified from lymph nodes and spleen and activated on stimulatory acrylamide hydrogel surfaces with a stiffness range of 2–25 kPa and plastic (PL). Stimulatory surfaces were coated with the indicated concentrations of pMHC-II together with 2 µg/mL anti-CD28. (A,B) Proliferation of CD4+ T cells was measured by CFSE dilution at 72 hr post activation, showing profound stiffness-dependent proliferation. (A) Representative CFSE dilution matrix from a single experiment. (B) Average division index from three independent experiments. (C) Representative plots of CD25 expression as a function of CFSE dilution at 72 hr from a single experiment shows that upregulation of CD25 on T cell membrane precedes proliferation. (D) Average percent of T cells expressing CD25 from three independent experiments. (E) Division index of CD4+ T cells activated with or without addition of 25 U/mL of exogenous IL-2. Data in B, D, and E represent averages +/- SEM from at least three independent experiments.
-
Figure 4—source data 1
Figure 4 - data table.
- https://cdn.elifesciences.org/articles/55995/elife-55995-fig4-data1-v2.xlsx
Figure 5 with 1 supplement

CD8+ T cell proliferation and degranulation show moderate stiffness dependency.
Naïve OT-I CD8+ T cells were purified from lymph nodes and spleen and activated on stimulatory acrylamide hydrogel surfaces with a stiffness range of 2–25 kPa and plastic (PL). Stimulatory surfaces were coated with the indicated concentrations of pMHC-I together with 2 µg/mL anti-CD28. (A,B) Proliferation of CD8+ T cells was measured by CFSE dilution at 72 hr post activation, showing only moderate stiffness-dependent proliferation. (A) Representative CFSE dilution matrix from a single experiment. Note that the threshold pMHC-I concentration needed to induce proliferation is very similar between the different stiffness surfaces. (B) Average division index from three independent experiments. (C) Representative plot of CD25 expression as a function of CFSE dilution at 72 hr from a single experiment shows a binary stiffness response. Note that with low doses of pMHC-I, only cells stimulated on very stiff substrates (25 kPa or plastic) survived and proliferated. Percent of live cells is given for each condition. (D) Average percent of T cells expressing CD25 from two independent experiments. Levels of CD25 membrane expression are very similar between the different substrates, probably reflecting the fact that only T cells that upregulate CD25 survive. (E) Cytotoxic CD8+ T cells on day 8 or 9 of culture were restimulated on hydrogel surfaces with a range of pMHC-I concentrations, and degranulation was measured based on surface exposure of CD107a (N = 3). Data in B, D, and E represent averages +/- SEM from at least three independent experiments.
-
Figure 5—source data 1
Figure 5 - data table.
- https://cdn.elifesciences.org/articles/55995/elife-55995-fig5-data1-v2.xlsx
Figure 5—figure supplement 1
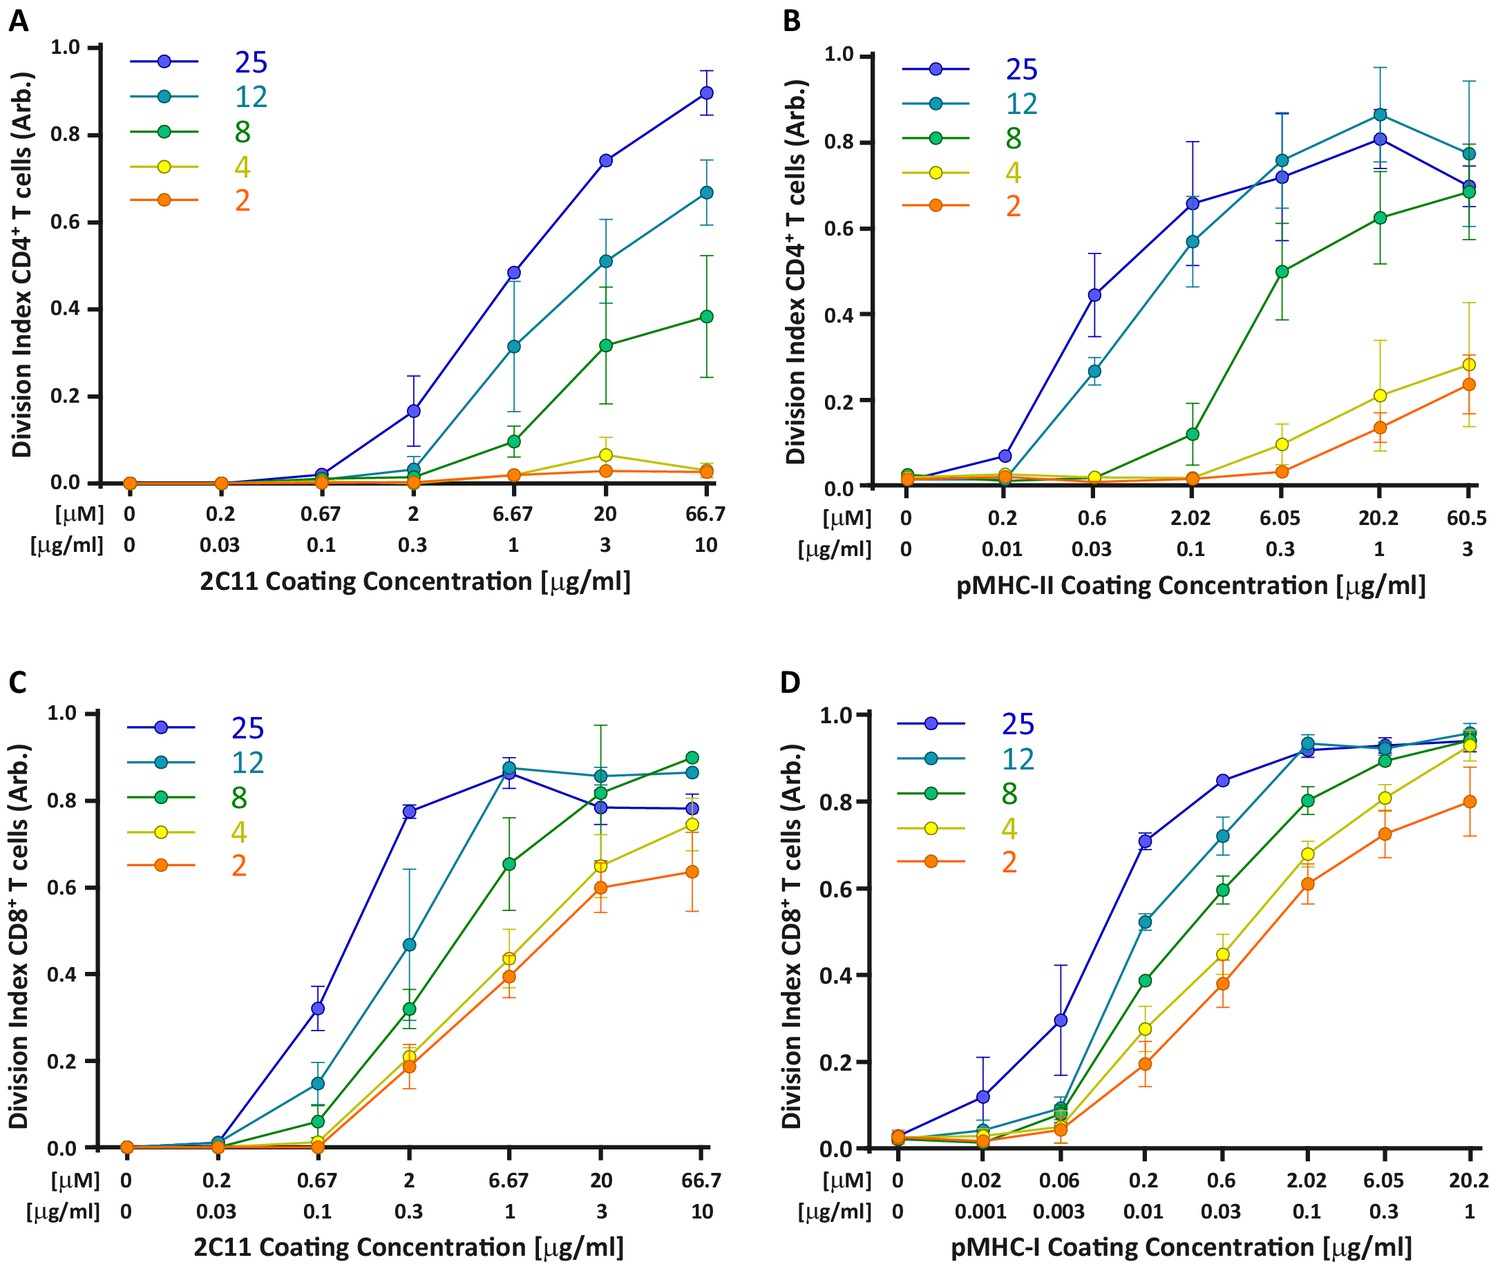
Comparing T cell activation with 2C11 and pMHC complexes.
Comparison of T cells activated on surfaces coated with a constant dose of αCD28 together with varying concentrations with 2C11 or pMHC complexes. Division indices were normalized within each dataset to facilitate comparison of stiffness responses. (A,B) OT-II CD4 T cells stimulated with (A) 2C11 (N = 3) or (B) pMHC-II (normalized data from Figure 4B, N = 3). Note that regardless of whether CD4+ T cells are stimulated with 2C11 of pMHC, they show a large increase in proliferation between 4 and 8 kPa. (C,D) OT-I CD8 T cells activated on varying concentrations of (C) 2C11 (N = 3) or (D) pMHC-II (normalized data from Figure 5B, N = 3). In both cases, only modest stiffness responses are observed.
-
Figure 5—figure supplement 1—source data 1
Figure 5—figure supplement 1 - data table.
- https://cdn.elifesciences.org/articles/55995/elife-55995-fig5-figsupp1-data1-v2.xlsx
Figure 6
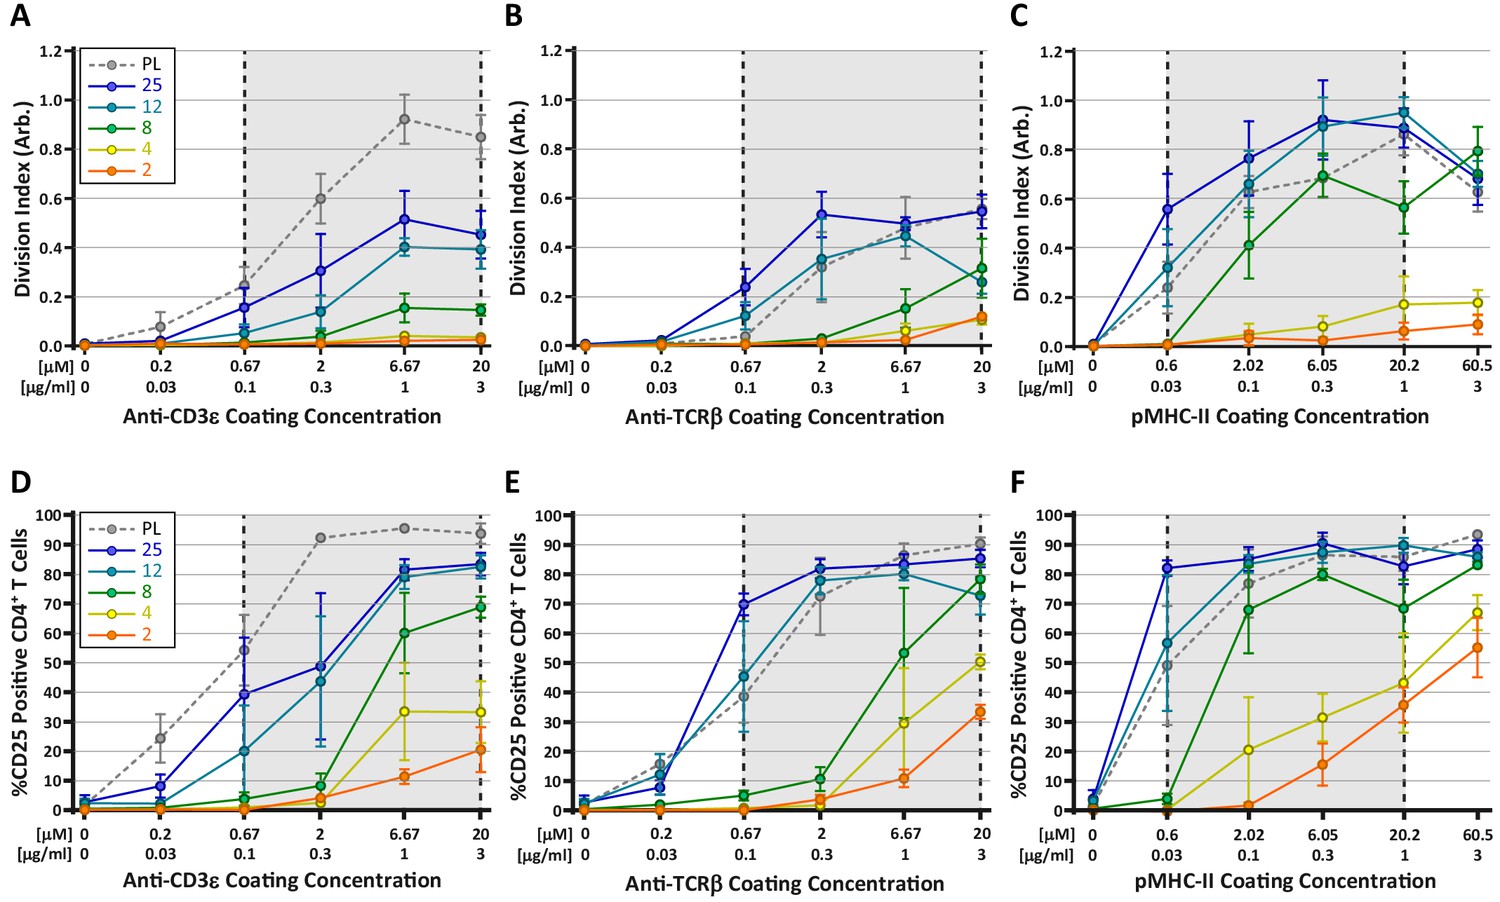
Stimulation of TCR with pMHC leads to the strongest stiffness-dependent response.
OT-II CD4+ T cells were stimulated on acrylamide hydrogels of different stiffnesses coated with the indicated range of stimulatory ligands. Proliferation and membrane expression of CD25 were measured 72 hr post activation using flow cytometry. (A,D) Stimulation with anti-CD3ε antibody. (B,E) Stimulation with anti-TCRβ antibody. (C,F) Stimulation with pMHC-II. Plots show the average division index or CD25 expression from three independent experiment. Gray areas denote a similar range of stimulatory ligand molar concentrations to aid comparison.
-
Figure 6—source data 1
Figure 6 - data table.
- https://cdn.elifesciences.org/articles/55995/elife-55995-fig6-data1-v2.xlsx
Figure 7
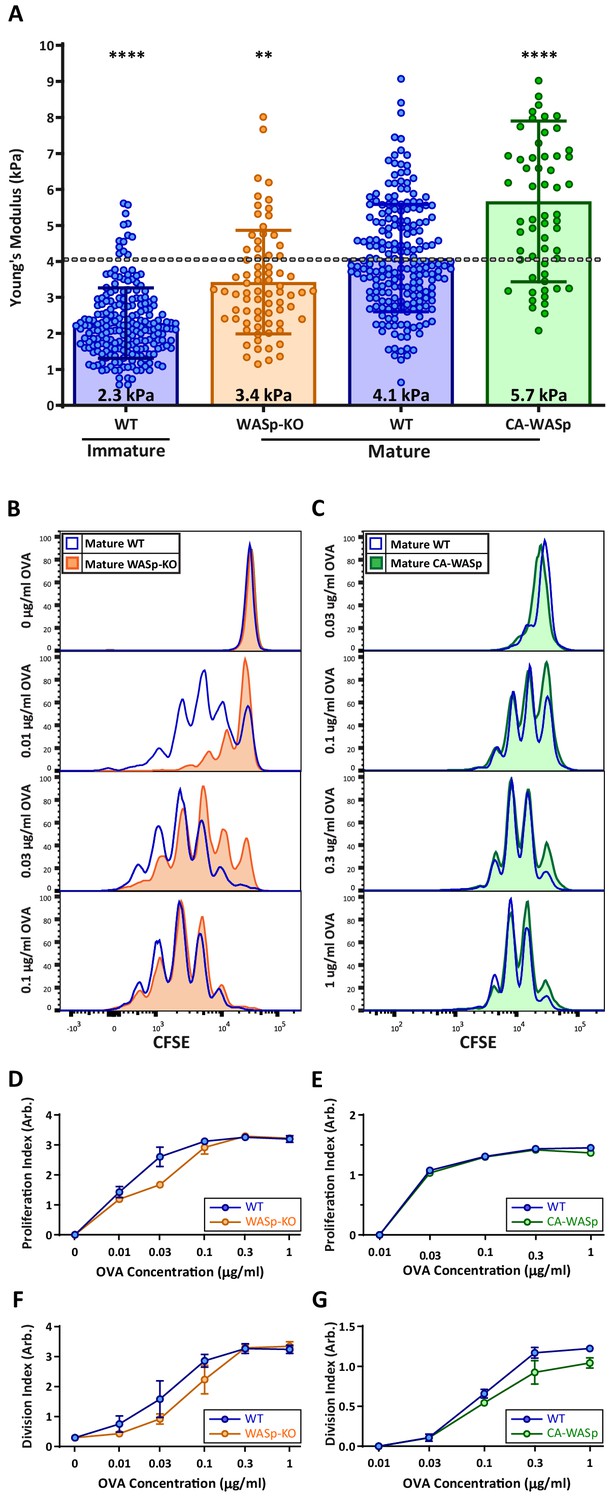
DC cortical stiffness acts as a costimulatory signal for T cell activation.
WT or WASp-/- BMDCs, or WT BMDCs transduced with constituently active form of WASp (CA-WASp) were untreated or matured by treatment with LPS. (A) Cortical stiffness was measured by AFM microindentation. Each data point represents an average of two stiffness measurements at different locations around a single cell nucleus. Error bars denote standard deviation. ***p<0.001, ****p<0.0001 calculated by an unpaired one-way ANOVA, comparing mature WT with all other treatments, with post-hoc Tukey correction. (B,C) LPS-matured BMDCs were pulsed with a range of OVA323-339 peptide concentrations and co-cultured with ex-vivo OT-II CD4+ T cells for 72 hr. Proliferation was measured by CFSE dilution. (D,E) Proliferation index pooled from two independent experiments. (F–G) Division index values pooled from two independent experiments. Error bars represent StDev.
-
Figure 7—source data 1
Figure 7 - data table.
- https://cdn.elifesciences.org/articles/55995/elife-55995-fig7-data1-v2.xlsx
Author response image 1
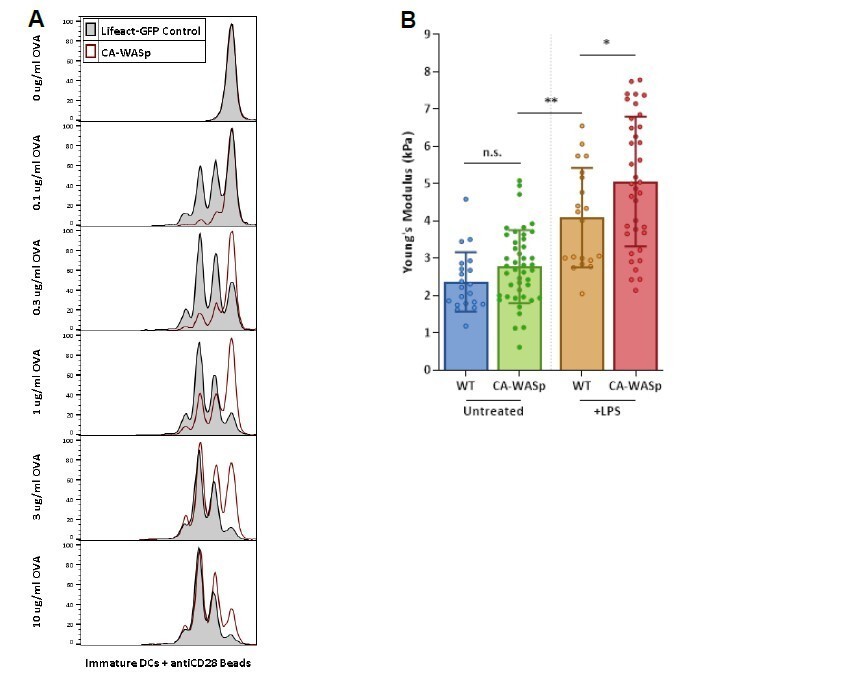
(A) CFSE dilution plots comparing T cell priming by WT (grayfilled histogram) or CA-WASp (redopen histogram) immature DCs in the presence of a range of OVA peptide with CD28 costimulation given in trans.
(B) AFM analysis of CA-WASp transduced cells. immature CA-WASp DC stiffness (green) is shown side-by-side with older data (Figure 6 in the manuscript) to facilitate comparison with WT CA-WASp mature cells.
Tables
Key resources table
| Reagent type (species) or resource | Designation | Source or reference | Identifiers | Additional information |
|---|---|---|---|---|
| Antibody | APC/APC-Cy7 anti-CD4 (rat, clone GK1.5) | Biolegend | Biolegend:100411/10041; RRID:100411/AB_312698 | Flow (1:350) |
| Antibody | APC/PE-Cy7 anti-CD8a (rat, clone 53–6.7) | Biolegend | Biolegend: 00711/100721; RRID:AB_312750/AB_312760 | Flow (1:350) |
| Antibody | anti-CD3ε (A. hamster, clone 145–2 C11) | BioXCell | BioXcell: BE0001-1; RRID:AB_1107634 | 0.003 µg/mL - 10 µg/mL |
| Antibody | anti-CD28 (Syrian hamster, clone PV1) | BioXCell | BioXcell:BE0015-5; RRID:AB_1107628 | 1 µg/mL - 2 µg/mL |
| Antibody | Anti-CD86 (rat, clone GL-1) | BioXCell | BioXcell: BE0025; RRID:AB_1107678 | Stain (1:100) |
| Antibody | Alexa647 anti-CD86 (rat, clone GL-1) | BioLegend | BioLegend: 105020; RRID:AB_493464 | Stain (1:100) |
| Antibody | APC-Cy7 anti-CD86 (rat, clone GL-1) | BioLegend | BioLegend:105029; RRID:AB_2074993 | Flow (1:100) |
| Antibody | Anti I-A/I-E (rat, clone M5/114) | BioXCell | BioXcell:BE0108-5; RRID:AB_10949298 | Stain (10 µg/mL) |
| Antibody | PE anti- I-A/I-E (rat, clone M5/114.15.2) | BioLegend | BioLegend:107607; RRID:AB_313322 | Flow (1:100) |
| Antibody | APC anti-CD11c (rat, clone N418) | BioLegend | BioLegend:117309; RRID:AB_313778 | Flow (1:100) |
| Antibody | PE-antiCD107a (LAMP-1) (rat, clone 1D4B) | BioLegend | BioLegend:121611; RRID:AB_1732051 | Assay (2 µg/mL) |
| Antibody | Alexa680 goat anti-Rat IgG (H+L) | ThermoFisher | ThermoFisher: A-21096 RRID:AB_2535750 | Stain (1:500) |
| Chemical compound, drug | Cytochalasin-D | EMD Millipore | EMD Millipore: 250255; CAS:22144-77-0 | 10 µM |
| Chemical compound, drug | Latrunculin-B | EMD Millipore | EMD Millipore: 428020; CAS:76343-94-7 | 10 µM |
| Chemical compound, drug | (S)-nitro-Blebbistatin | Cayman Chemical | Cayman Chemical:13891; CAS:856925-75-2 | 50 µM |
| Chemical compound, drug | CK666 | EMD Millipore | Millipore: 182515; CAS:442633-00-3 | 100 µM |
| Chemical compound, drug | Y27632 | SIGMA | SIGMA:688000; CAS:146986-50-7 | 25 µM |
| Chemical compound, drug | SMIFH2 | SIGMA | SIGMA:344092; CAS:340316-62-3 | 10 µM |
| Chemical compound, drug | Escherichia coli 026:B6; LPS | SIGMA | SIGMA:L2762; ECN:297-473-0 | 200 ng/mL |
| Chemical compound, drug | Collagenase D | SIGMA | SIGMA: COLLD-RO; EC#:3.4.25.3 | 2 mg/mL |
| Chemical compound, drug | IL-2 | NIAID, NIH | N/A | 25U;100U |
| Chemical compound, drug | streptavidin-coated polystyrene beads | Spherotech | Spherotech: SVP-60–5 | |
| Chemical compound, drug | EZ-link NHS biotin kit | Thermo Fisher Scientific | Thermo Fisher Scientific: 21217 | |
| Chemical compound, drug | CFSE | Invitrogen | Invitrogen: C34570 | |
| Commercial assay or kit | CF555 Mix-n-Stain | Biotium | Biotium:92234 | |
| Commercial assay or kit | MACS pan-dendritic cell isolation kit | Miltenyi Biotec | Miltenyi: 130-100-875 | |
| Commercial assay or kit | mouse IL-2 ELISA kit | Invitrogen | Invitrogen: 88-7024-88 | |
| Gene (mouse) | Was; Wiskott–Aldrich syndrome gene | DOI:10.1084/jem.20091245 | MGI:105059; NCBI Gene: 22376 | |
| Other | Hydrogel surfaces (96-well plates) | Matrigen | EasyCoat Softwell 96G | Customized plates |
| Other | AFM 1 µM spherical polystyrene probe | Novascan | Novascan: PT.PS | Si3N4 cantilever k = 0.06 N/m |
| Peptide, recombinant protein | Peptide MHC-II Complex | NIH Tetramer Core | I-Ab | Sequence: HAAHAEINEA |
| Peptide, recombinant protein | Ovalbumin 323–339; OVA323–339 | Anaspec | Anaspec: AS-27025; LOT:1755317 | Sequence: ISQAVHAAHAEINEAGR |
| Recombinant DNA reagent | pLX301 (plasmid) | Addgene | Addgene: 25895; RRID:Addgene_25895 | DOI:10.1038/nmeth.1638 |
| Software, algorithm | FlowJo | FlowJo LLC | RRID:SCR_008520 | |
| Software, algorithm | NanoScope Analysis | Broker | N/A | |
| Strain, strain background (Mice) | OT-II Transgenic mice/OT-II | Jackson Laboratories | Stock: 004194; RRID:IMSR_JAX:004194 | B6.Cg-Tg(TcraTcrb)425Cbn/J |
| Strain, strain background (Mice) | OT-I Transgenic mice/OT-I | Jackson Laboratories | Stock: 003831; RRID:IMSR_JAX:003831 | C57BL/6-Tg(TcraTcrb)1100Mjb/J |
| Strain, strain background (Mice) | Was-/-; WASP-,WASp-KO | Jackson Laboratories | Stock: 003292; RRID:IMSR_JAX:003292 | 129S6/SvEvTac-Wastm1Sbs/J |
| Strain, strain background (Mice) | Hcls1-/-; HS1-KO | David Rawlings, MD. | PMCID:PMC394441 | |
| Strain, strain background (Mice) | Fscn1-/- | KOMP Repository, UC Davis | MGI:5605764 | Fscn1tm1.1(KOMP) Vlcg |
Additional files
Download links
A two-part list of links to download the article, or parts of the article, in various formats.
Downloads (link to download the article as PDF)
Open citations (links to open the citations from this article in various online reference manager services)
Cite this article (links to download the citations from this article in formats compatible with various reference manager tools)
Mouse T cell priming is enhanced by maturation-dependent stiffening of the dendritic cell cortex
eLife 9:e55995.
https://doi.org/10.7554/eLife.55995


