The dynamic interplay between ATP/ADP levels and autophagy sustain neuronal migration in vivo
- CERVO Brain Research Center, Canada
- Université Laval, Canada
Figures
Figure 1

Migrating cells express autophagy-related proteins and display active autophagic flux.
(A) Experimental design for the quantification of autophagy in migrating neuroblasts (B–D) Confocal images and quantification showing Atg5, LC3A, and LC3B expression by neuroblasts and astrocytes. The percentage of co-localization was calculated as the number of GFP+ cells (neuroblasts or astrocytes) with labeling for one of these proteins over the total number of GFP+ cells. (E) Electron microscopy (EM) analysis of autophagy in neuroblasts in the RMS of Slc1a3(Glast)CreErt2::GFP mice. The neuroblasts were labeled with anti-GFP immunogold particles. An autophagosome is indicated with an arrowhead. (F) Western blot analysis of LC3 in OB and RMS samples. (G) Scheme of the RFP-GFP-LC3 fusion protein used to study autophagic flux. The RFP-GFP-LC3 fusion protein makes it possible to label autophagosomes for RFP and GFP. Autolysosomes were only labeled for RFP because GFP was quenched due to the acidic pH in the lysosomes. (H) Percentage of GFP+/RFP+ vesicles with respect to RFP+ vesicles in neuroblasts in fixed brain sections obtained after stereotaxic injections of retrovirus-encoding RFP-GFP-LC3 (n = 10 cells from three animals) (I) Wide-field time-lapse imaging and kymograph of RFP-LC3 vesicles in the leading process of migrating neuroblasts. (J) Example of two-photon imaging of RFP-GFP-LC3 vesicles in the leading process of migrating neuroblasts in acute brain sections. RFP+ autophagosomes/autolysosomes are indicated with arrows, while GFP+/RFP+ autophagosome is indicated with an arrowhead. (K:) Quantification of GFP+/RFP+ vesicles among RFP+ vesicles during the different phases of cell migration (n = 18 cells from three animals). Data are expressed as means ± SEM, **p<0.005 with the Student t-test. (L) Quantification of changes in the RFP+ punctae of individual neuroblasts during the different phases of cell migration. Data are plotted as the density of RFP+ autophagosomes/autolysosomes in neuroblasts during the different migration phases (n = 11 cells from six animals). The results were normalized to the density of the first stationary phase to be able to make inter-cell and inter-animal comparisons. Data are expressed as means ± SEM, *p<0.05 with the Student t-test. See also Video 1.
Figure 2 with 1 supplement
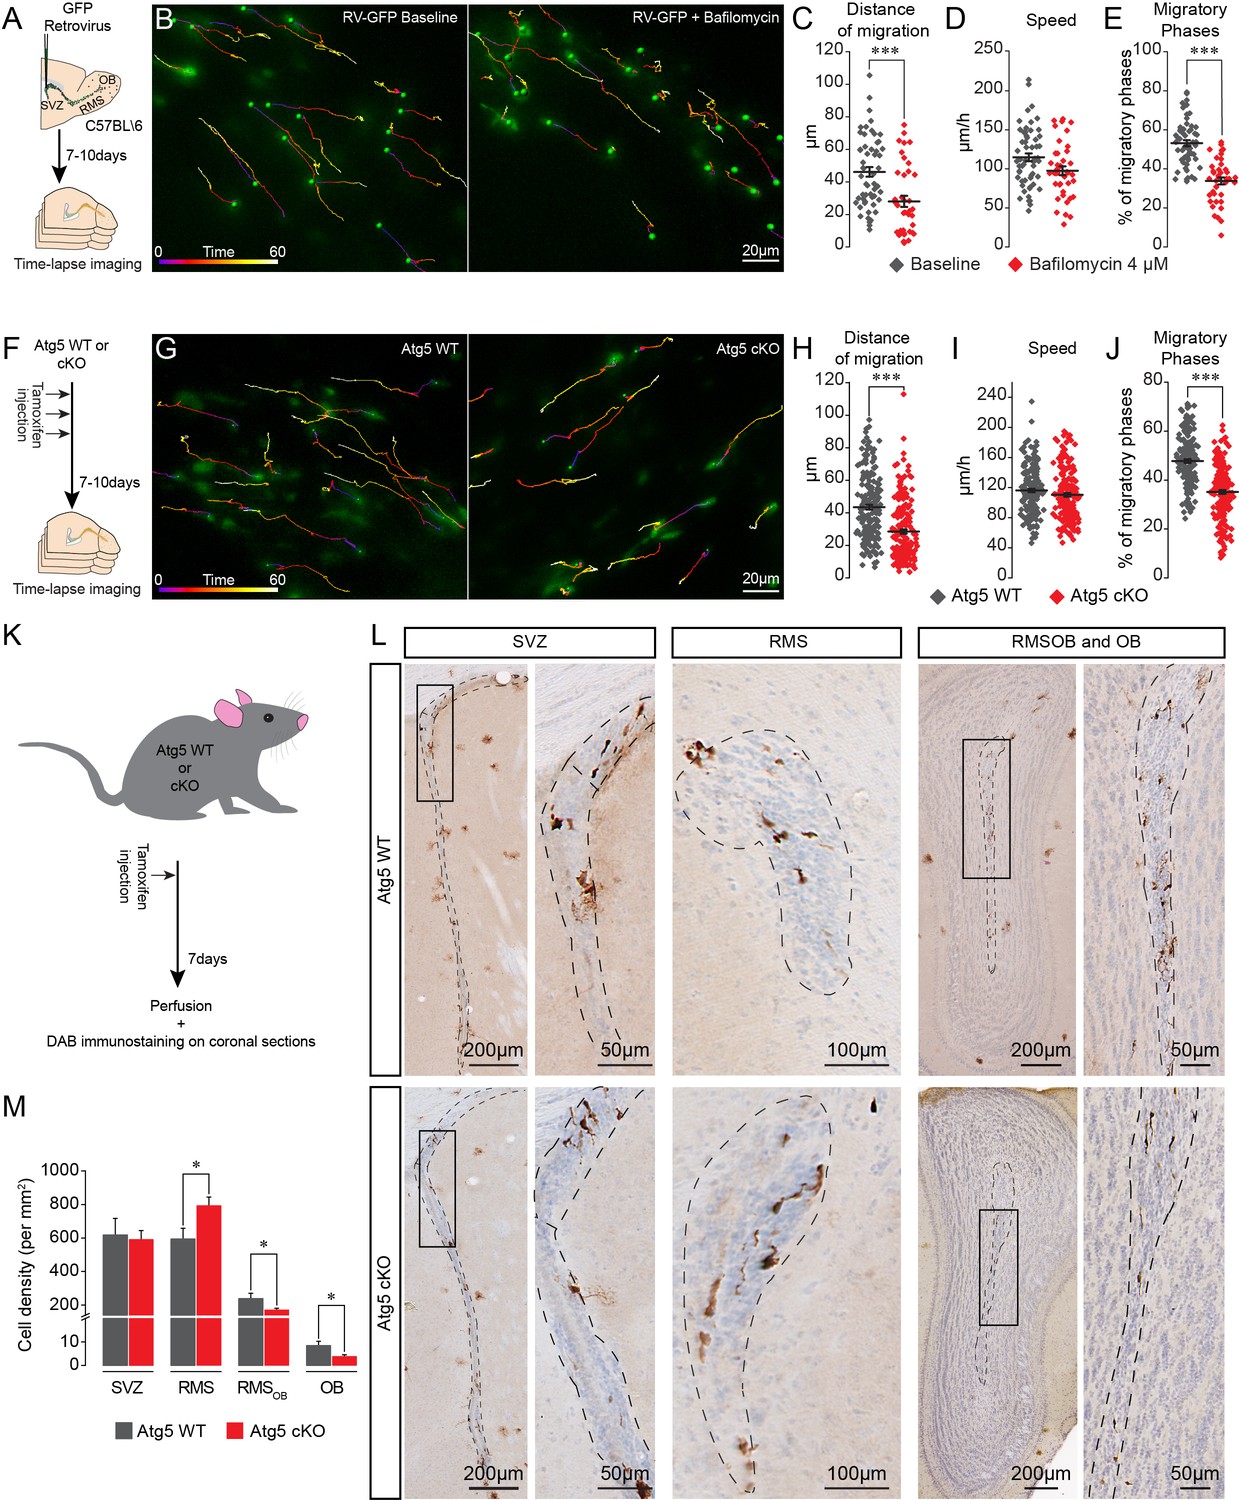
Pharmacological and genetic impairment of autophagy-related genes disrupts cell migration.
(A) Experimental design for the pharmacological impairment of autophagy using bafilomycin. (B) Time-lapse imaging of GFP+ neuroblasts in acute brain sections. (C–E) Distance of migration, speed of migration, and percentage of migratory phases of neuroblasts under control condition and following application of bafilomycin (n = 55 and 41 cells from three mice for the control and bafilomycin mice, respectively, ***p<0.001 with the Student t-test). (F) Experimental design to conditionally delete Atg5 in adult mice. (G) Time-lapse imaging of Atg5 cKO and Atg5 WT neuroblasts in acute brain sections. (H–J) Distance of migration, speed of migration, and percentage of migratory phases of Atg5 cKO and Atg5 WT neuroblasts (n = 188 and 198 cells from 9 Atg5 WT and 9 Atg5 cKO mice, respectively. ***p<0.001 with the Student t-test). (K) Experimental design to conditionally delete Atg5 in adult mice to follow the impact of autophagy on the entire cell population. (L) Example of DAB staining of coronal sections from Atg5 cKO and Atg5 WT mice obtained from brains fixed 7 days after a single tamoxifen injection. (M) Quantification of GFP+ neuroblast density in the SVZ, RMS, RMSOB, and OB of Atg5 WT and cKO mice (n = 8 for the Atg5 cKO mice and n = 7 for the Atg5 WT mice, *p<0.05 with the Student t-test). See also Figure 2—figure supplement 1 and Video 2.
Figure 2—figure supplement 1
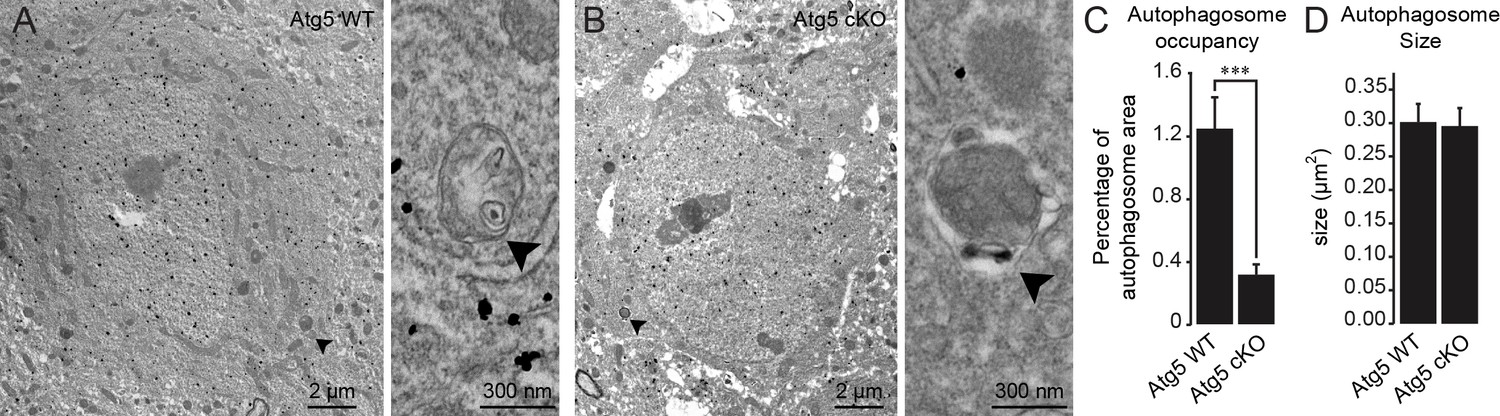
Validation of autophagy impairment in Atg5 cKO mice by electron microscopy.
(A-B) Example of electron microscopic images of neuroblasts in the RMS of Atg5 WT and Atg5 cKO mice. The neuroblasts were labeled with anti-GFP immunogold particles. The autophagosomes are indicated with an arrowhead. (C) Quantification of the percentage of the autophagosome area in Atg5 WT and Atg5 cKO mice (n = 57 cells for Atg5 WT and n = 73 cells for Atg5 cKO, three animals per condition). ***p<0.001 with the Student t-test. (D) Quantification of the individual autophagosome size in Atg5 WT and Atg5 cKO mice. (n = 57 cells for Atg5 WT and n = 73 cells for Atg5 cKO, three animals per condition).
Figure 3 with 1 supplement
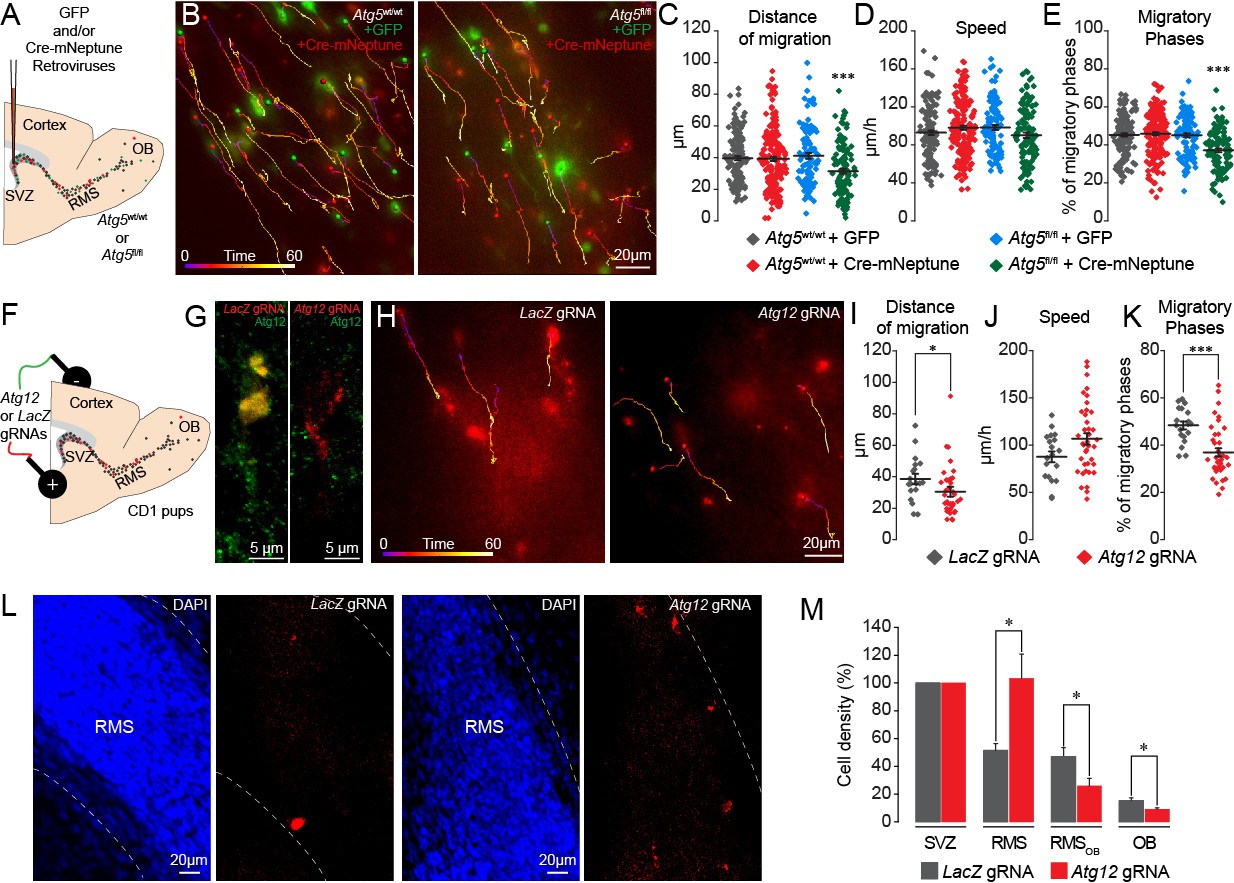
Genetic impairment of autophagy-related genes in the adult and early postnatal mice disrupts cell migration.
(A) Experimental procedure for GFP- and Cre-mNeptune-encoding retroviral labeling of neuroblasts from Atg5wt/wt and Atg5fl/fl mice. (B) Example of time-lapse imaging of neuroblasts expressing GFP or Cre-mNeptune. (C–E) Distance of migration, speed of migration, and percentage of migratory phases for Atg5wt/wt and Atg5fl/fl mice injected with GFP or Cre-mNeptune retroviruses. Atg5wt/wt-GFP (n = 143 cells from eight mice), Atg5wt/wt-Cre-mNeptune (n = 208 cells from nine mice), Atg5fl/fl-GFP (n = 106 cells from seven mice), and Atg5fl/fl-Cre-mNeptune (n = 121 cells from five mice). ***p<0.001 with a one-way ANOVA followed by an LSD-Fisher post hoc test. (F) Experimental procedure for the electroporation of plasmids expressing Cas9-T2A-mCherry and gRNAs. Plasmids were injected into the lateral ventricle of P1-P2 pups followed by the application of electrical pulses. Acute sections were prepared 8–13 days post-electroporation, and the migration of electroporated cells was assessed by time-lapse imaging. (G) Example of immunostaining of Atg12 on cells expressing LacZ gRNA (green) and Atg12 gRNA (red). (H) Time-lapse imaging of neuroblasts electroporated with LacZ gRNA or Atg12 gRNA in acute brain sections. (I–K) Distance of migration, speed of migration, and percentage of migratory phases of cells electroporated with LacZ gRNA or Atg12 gRNA (n = 19 and 40 cells from 5 and 13 animals for LacZ gRNA and Atg12 gRNA, respectively, *p<0.05 and ***p<0.001 with Student t-test). Individual values and means ± SEM for all time-lapse imaging experiments are shown. (L) Example of a brain section showing neuroblasts electroporated with LacZ gRNA (left) or Atg12 gRNA (right) in the RMS. (M) Quantification of Cas9-T2A-mCherry+ neuroblast density in the SVZ, RMS, RMSOB, and OB of LacZ gRNA- and Atg12 gRNA-electroporated mice. Data are expressed as a percentage of the cell density with 100% defined as the cell density in the SVZ (n = 8 mice for LacZ gRNA and seven mice for Atg12 gRNA, *p<0.05). See also Figure 3—figure supplement 1 and Video 3.
Figure 3—figure supplement 1
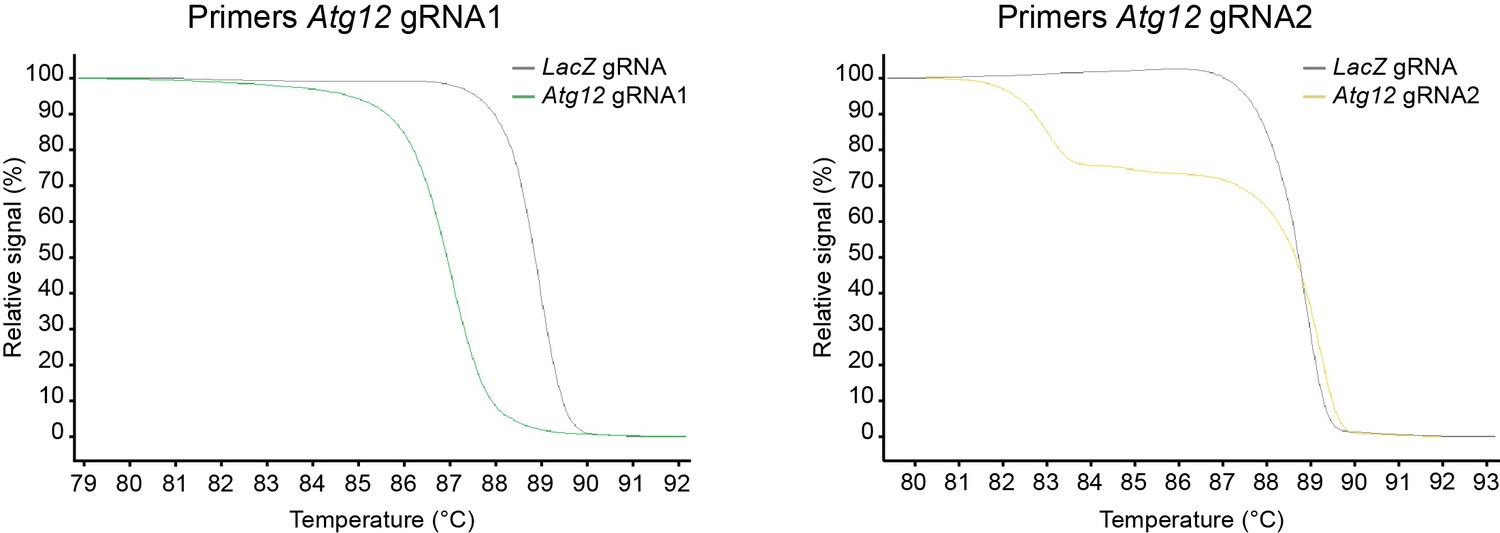
Validation of gRNA efficiency by high-resolution melting (HRM) PCR.
SVZ cells were isolated and were cultured in vitro. The cells were transfected with plasmids carrying Cas9 and various gRNAs. The PCR reaction was performed on genomic DNA, and HRM curves were generated over a 65–95°C range in 0.2°C increments.
Figure 4 with 2 supplements
ATP/ADP ratios are dynamically modulated during cell migration and trigger autophagy via AMPK.
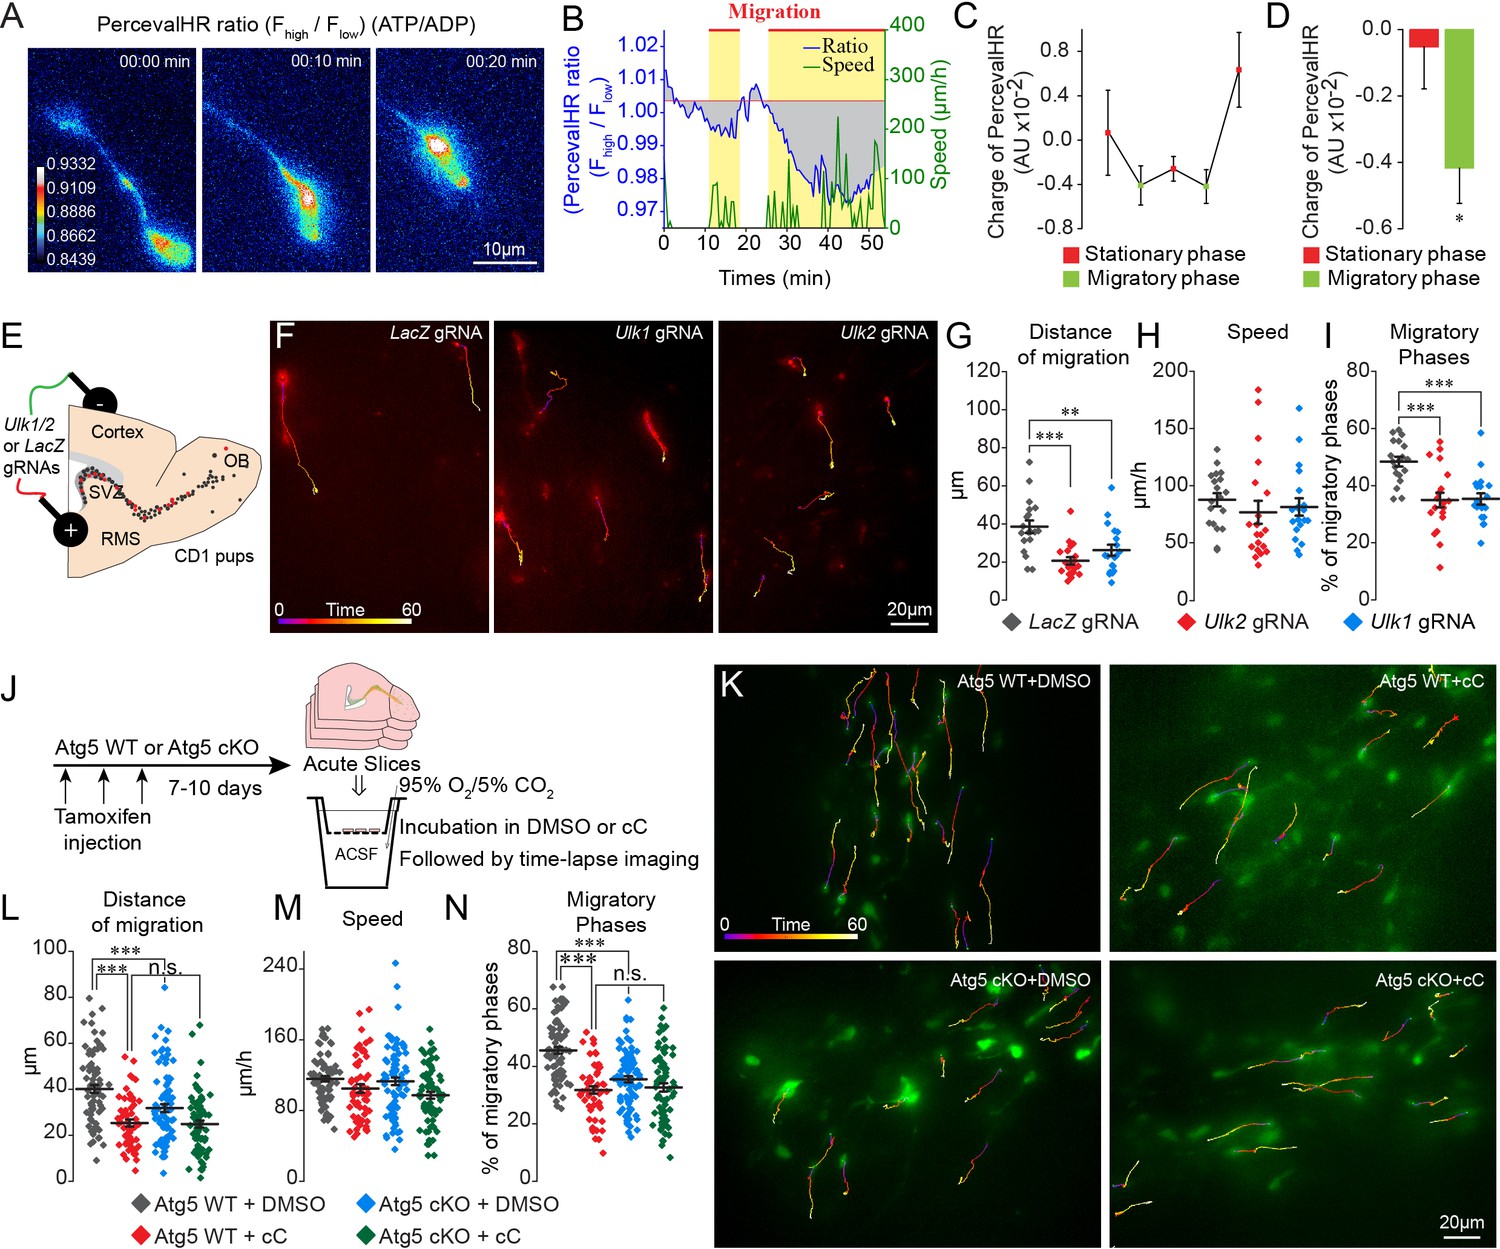
(A–B:) Example and quantification of changes in the ATP/ADP ratios of individual neuroblasts during the different cell migration phases. Yellow boxes indicate the migratory phases. As the duration of the migratory and stationary phases in individual neuroblasts as well as across different cells varies, we calculated the changes in the ATP/ADP ratio as the changes in the charge (area under the curve; gray areas) divided by the duration of the different phases. The baseline for the area under the curve was fixed as the mean PercevalHR ratio during the stationary period. (C–D:) Quantification of changes in the ATP/ADP ratio of neuroblasts during the migratory and stationary phases (n = 19 cells from eight animals). Data are expressed as means ± SEM, *p<0.05 with the Student t-test. (E:) Experimental procedure for the electroporation of plasmids expressing Cas9-T2A-mCherry and gRNAs. (F:) Time-lapse imaging of neuroblasts electroporated with LacZ, Ulk1, and Ulk2 gRNAs in acute brain sections. (G–I:) Distance of migration, speed of migration, and percentage of migratory phases of cells electroporated with LacZ, Ulk1, and Ulk2 gRNAs (n = 19 cells for LacZ and Ulk1 gRNAs, and 20 cells for Ulk2 gRNAs from 5, 7, and four animals, respectively, **p<0.005 and ***p<0.001 with a one-way ANOVA followed by an LSD-Fisher post hoc test). (J:) Experiments to study the role of AMPK in autophagy-dependent neuronal migration. Acute sections from Atg5 WT and Atg5 cKO mice were incubated for 2 hr with DMSO or cC (20 µM) followed by time-lapse imaging of cell migration in the presence of DMSO or cC. (K:) Example of time-lapse imaging of cell migration of Atg5 WT and Atg5 cKO neuroblasts in the presence of DMSO or cC. (L–N:) Distance of migration, speed of migration, and percentage of migratory phases of neuroblasts (n = 79 cells from five mice for Atg5 WT+DMSO, n = 56 cells from five mice for Atg5 WT+cC, n = 85 cells from six mice for Atg5 cKO+DMSO, and n = 72 cells from seven mice for Atg5 cKO+cC, ***p<0.001 with a one-way ANOVA followed by an LSD-Fisher post hoc test). Individual values and means ± SEM for all the time-lapse imaging experiments are shown. See also Video 4.
Figure 4—figure supplement 1
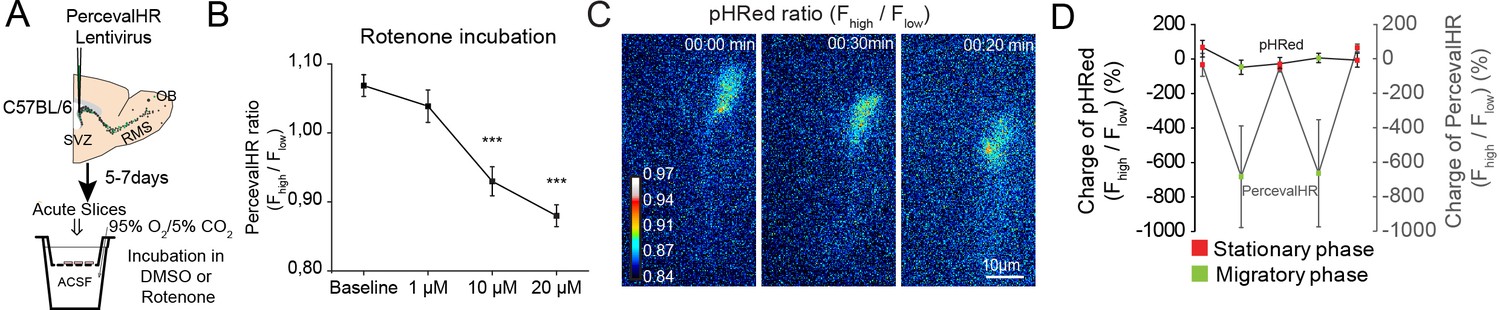
Validation of the PercevalHR functionality in migrating neuroblasts.
(A:) Experimental procedure to visualize the impact of rotenone on the ATP/ADP ratio. (B:) Quantification of changes in the PercevalHR ratio in neuroblasts following the incubation of acute brain sections with 1, 10, or 20 µM rotenone (n = 29 cells for the baseline, and 32, 31, and 33 cells from three mice for 1, 10, and 20 µM rotenone). Data are expressed as the mean ± SEM. ***p<0.001 with a one-way ANOVA followed by a post hoc LSD-Fisher test. ( C:) Example of changes in pH in individual neuroblasts during cell migration. (C–D:) Quantification of changes in the pHRed ratio compared to changes in the PercevalHR ratio in neuroblasts during the migratory and stationary phases. Data are expressed as the percentage of change. Data are expressed as the mean ± SEM.
Figure 4—figure supplement 2
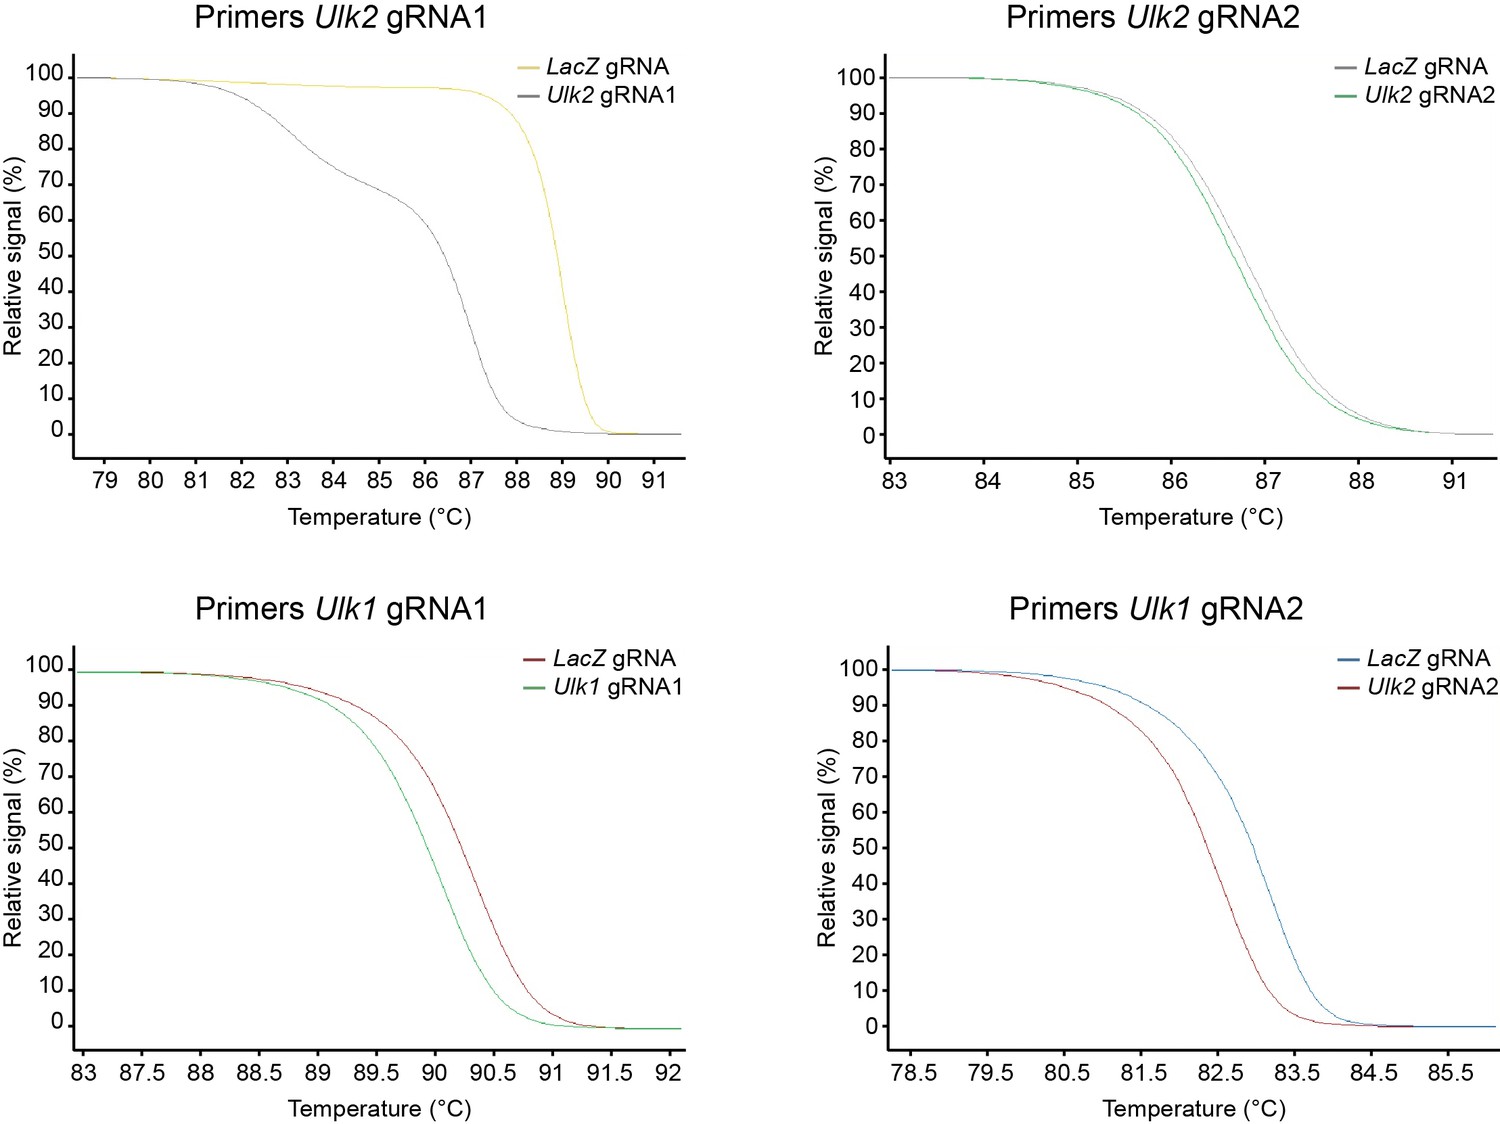
Validation of gRNA efficiency by high-resolution melting (HRM) PCR.
SVZ cells were isolated and were cultured in vitro. The cells were transfected with plasmids carrying Cas9 and various gRNAs. The PCR reaction was performed on genomic DNA, and HRM curves were generated over a 65–95°C range in 0.2°C increments.
Figure 5
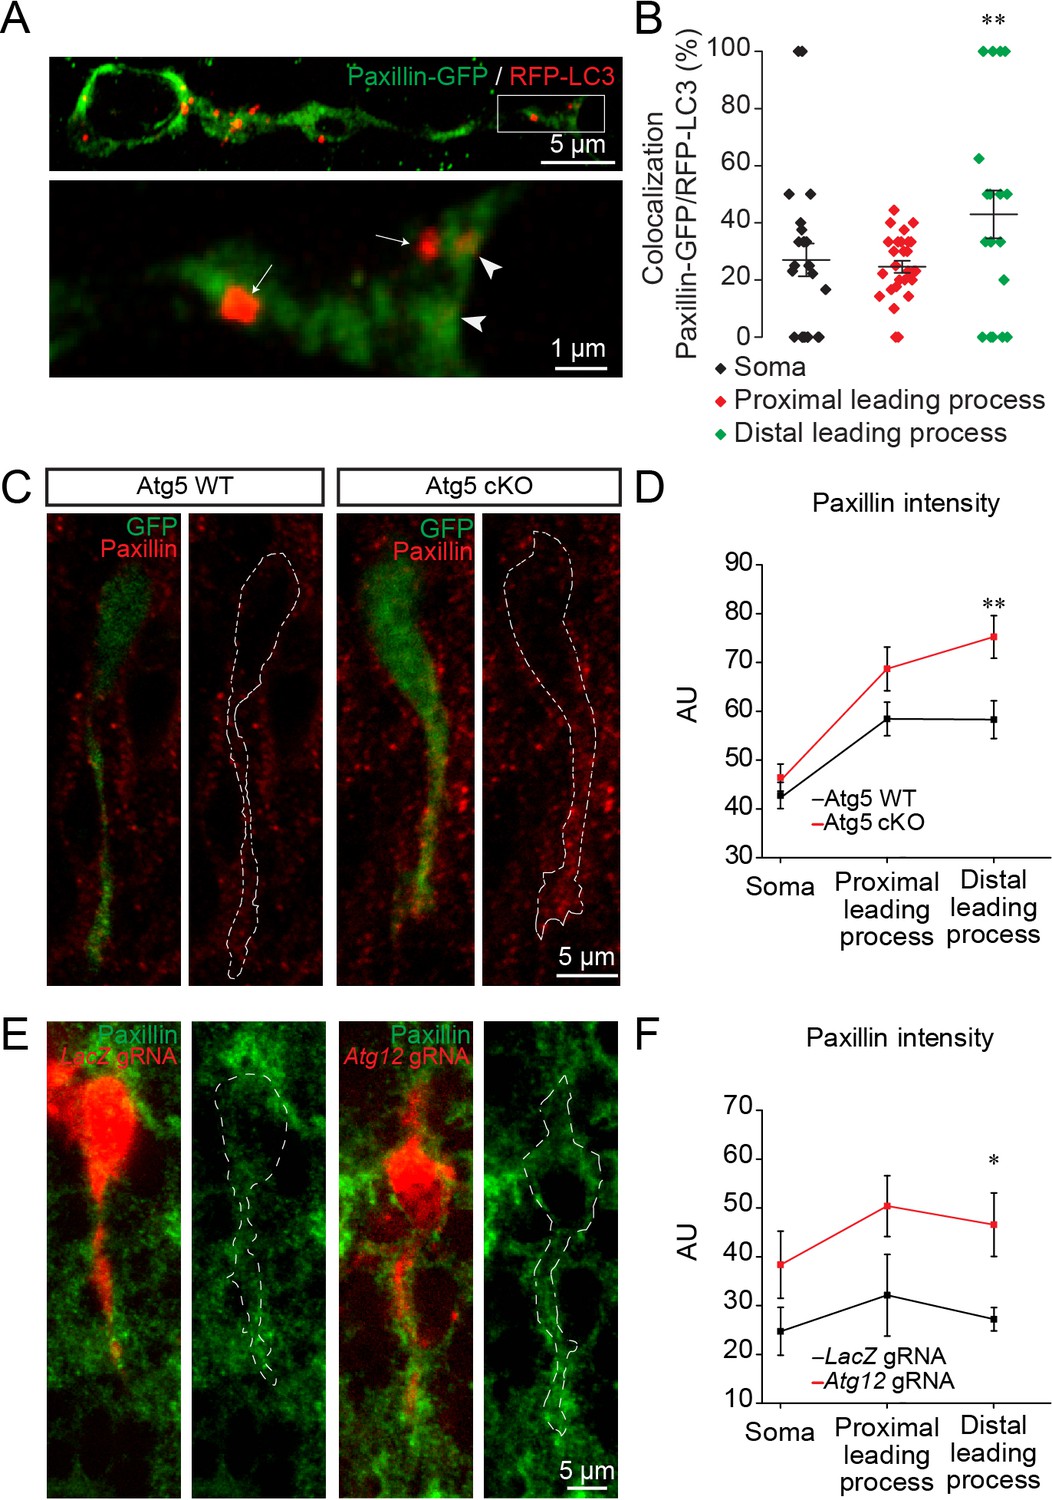
Autophagy affects neuronal migration by the recycling of paxillin.
(A) Example of paxillin-GFP and RFP-LC3 punctae in migrating neuroblasts. Arrowheads indicate paxillin-GFP/RFP-LC3 punctae whereas arrows indicate RFP-LC3 punctae. (B) Quantification of paxillin-GFP+ and RFP-LC3+ vesicles in the cell body and the proximal and distal parts of the leading process (28.4 ± 1.7% of GFP+/RFP+ in the cell body, 24.5 ± 2.0% in the proximal leading process, and 42.5 ± 7.9% in the distal leading process, n = 30 cells from three mice; **p<0.005 with a one-way ANOVA followed by an LSD-Fisher post hoc test). (C) Example of paxillin immunolabeling in neuroblasts from Atg5 WT and Atg5 cKO mice. (D) Quantification of the fluorescence intensity of paxillin in the soma and in the proximal and distal parts of the leading process. For Atg5 WT mice, the fluorescence was 47.7 ± 2.7 AU for the soma, 58.43 ± 3.4 AU for the proximal leading process, and 58.3 ± 3.9 AU for the distal part of the leading process; for Atg5 cKO mice, the fluorescence intensity was 46.4 ± 4.62 AU for the soma, 76.3 ± 4.5 AU for the proximal leading process, and 74.2 ± 4.8 AU for the distal part of the leading process; n = 38 cells from three mice for Atg5 WT and n = 31 cells from three mice for Atg5 cKO (**p<0.005 with Student t-test). (E) Example of paxillin immunolabeling in neuroblasts expressing LacZ gRNA or Atg12 gRNA. (F) For the LacZ gRNA, the fluorescence intensity was 24.7 ± 4.9 AU for the soma, 32.1 ± 8.4 AU for the proximal part of the leading process, and 27.2 ± 2.4 AU for the distal part of the leading process; for the Atg12 gRNA, the fluorescence intensity was 38.4 ± 1.6 AU for the soma, 50.4 ± 5.5 AU for the proximal part of the leading process, and 46.5 ± 2.5 AU for the distal part of the leading process; n = 10 cells from three mice for LacZ gRNA and for Atg12 gRNA, *p<0.05 with the Student t-test.
Figure 6
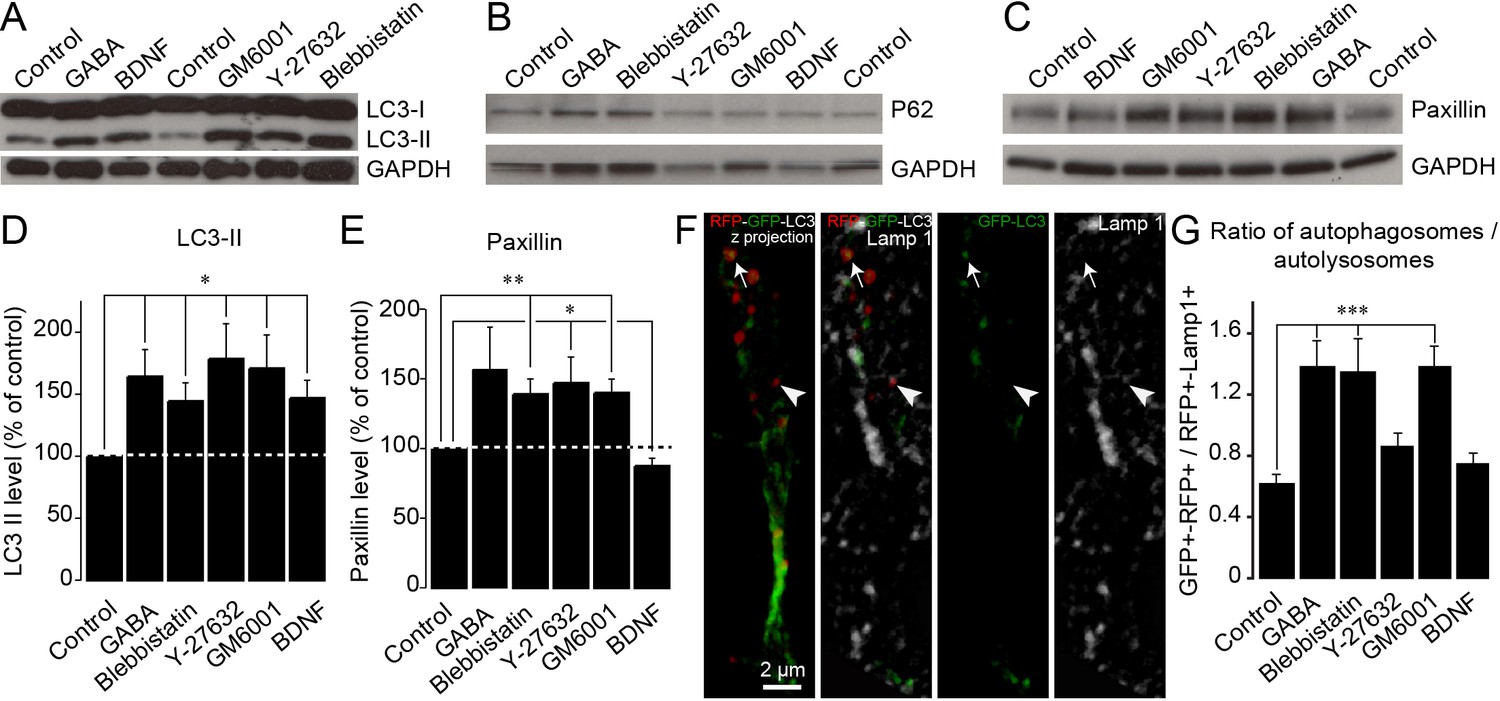
Autophagy is dynamically regulated by migration-promoting and migration-inhibiting cues and is required for the recycling of paxillin.
(A–C:) Immunoblotting for the lipidated form of LC3 (LC3-II), p62, and paxillin on RMS samples dissected from acute sections previously incubated with BDNF, GABA, GM60001, Y27632, or blebbistatin for 2 hr. GAPDH was used as a housekeeping protein. (D–E:) Quantification of LC3-II and paxillin levels after the pharmacological manipulation of cell migration (n = 5–7 mice for both groups, *p<0.05 and **p<0.005 with a Student t-test). (F): Example of a cell infected with a retrovirus expressing the LC3-GFP-RFP fusion protein and immunostained for Lamp1 to label autophagosomes (GFP+/RFP+) and autolysosomes (RFP+/Lamp1+). (G:) Percentage of autophagosomes and autolysosomes after a 2 hr incubation with BDNF, GABA, GM60001, Y27632, or blebbistatin. The autophagosome/autolysosome ratio was assessed for each cell, and the results are expressed as means ± SEM. ***p<0.001 with a one-way ANOVA followed by a post hoc LSD-Fisher test.
Videos
Video 1
Time-lapse imaging of RFP-GFP-LC3 in migrating neuroblasts.
Time-lapse imaging of RFP-LC3 punctae in neuroblasts. The time is indicated in the upper left corner.
Video 2
Neuronal migration of Atg5 WT and Atg5 cKO neuroblasts in acute sections of the adult RMS.
Time-lapse imaging of GFP+ neuroblasts in sections from Atg5 WT (left) and Atg5 cKO (right) mice. The time is indicated in the upper left corner.
Video 3
Neuronal migration of Cre-mNeptune- and GFP-infected cells in Atg5fl/fl mice.
Example of time-lapse imaging of neuroblasts on acute slices from Atg5fl/fl mice infected with retroviruses expressing GFP and Cre-mNeptune. The images were acquired every 15 s for 1 hr. The time is indicated in the upper left corner.
Video 4
The ATP/ADP ratio is dynamically modulated during cell migration.
Time-lapse imaging of neuroblasts infected with PercevalHR-encoding and Td-Tomato-encoding lentiviruses. PercevalHR was used for ratiometric measurements of changes in the ATP/ADP ratio. The ATP/ADP ratio is shown. Note that the ATP/ADP ratio dynamically changes during the different cell migration phases. The time is indicated in the upper left corner.
Tables
Key resources table
| Reagent type (species) or resource | Designation | Source or reference | Identifiers | Additional information |
|---|---|---|---|---|
| Strain, strain background (M. musculus, male and female) | CAG-CAT-EGFP | Waclaw et al., 2010 | ||
| Strain, strain background (M. musculus, male and female) | Slc1a3(Glast)CreErt2 mice | Mori et al., 2006 | ||
| Strain, strain background (M. musculus, male and female) | Atg5fl/fl | Riken | B6.129S-Atg5 < tm1Myok> RRID:IMSR_RBRC02975 | |
| Strain, strain background (M. musculus, male and female) | CD1 | Charles Rivers | Strain code: 022 | |
| Strain, strain background (M. musculus, male) | C57BL/6NCRL | Charles Rivers | Strain code: 027 | |
| Strain, strain background (M. musculus, male and female) | GFAP-GFP | Jackson | Strain code: 003257FVB/N-Tg(GFAPGFP)14Mes/J | |
| Transfected construct (Synthetic) | RV-GFP | Molecular Tool Platform, CERVO Brain Research Center | Lot #RV 39 | Retroviral construct |
| Transfected construct (Synthetic) | RV-Cre-mNeptune | Molecular Tool Platform, CERVO Brain Research Center | Lot #RV 34 | Retroviral construct |
| Transfected construct (R. norvegicus) | RV- RFP-GFP-LC3 | Molecular Tool Platform, CERVO Brain Research Center | Lot #RV15 | Retro viral construct |
| Transfected construct (Synthetic) | LV-CMV-PercevalHR | University of North Carolina Vector Core Facility | Lot #43–44213 PercevalHR | Lentiviral construct |
| Transfected construct (Synthetic) | LV-CMV-TdTomato | University of North Carolina Vector Core Facility | Lot #43–44213 TdTomato | Lentiviral construct |
| Antibody | Anti-GFP (Rabbit polyclonal) | Thermo Fisher Scientific | Cat#A-11122; RRID:AB_221569 | DAB (1:1000) |
| Antibody | Anti-GFP (Chicken polyclonal) | Avés | GFP-1020; RRID:AB_10000240 | IF (1:1000) |
| Antibody | Anti-LC3B (Rabbit polyclonal) | Novus | Cat#NB100-2220, RRID:AB_10003146 | IF (1:200) WB (1:1000) |
| Antibody | Anti- Cleaved LC3A (Rabbit polyclonal) | Abgent | Cat#AP1805a, RRID:AB_2137587 | IF (1:100) |
| Antibody | Anti-murine Atg5 (Rabbit polyclonal) | Novus | Cat#NB110-53818, RRID:AB_828587 | IF (1:400) |
| Antibody | Anti-LAMP-1 (CD107a) (Rabbit polyclonal) | Millipore | Cat#AB2971, RRID:AB_10807184 | IF (1:500) |
| Antibody | Anti-paxillin (Mouse monoclonal) | BD Biosciences | Cat#610051, RRID:AB_397463 | IF (1:100) WB (1:1000) |
| Antibody | Anti-P62/SQSTM1 (Rabbit polyclonal) | Proteintech | Cat#18420–1-AP, RRID:AB_10694431 | WB (1:500) |
| Antibody | Anti-GAPDH (Mouse monoclonal) | Thermo Fisher Scientific | Cat#MA5-15738, RRID:AB_10977387 | WB (1:5000) |
| Antibody | Anti-rabbit IgG, biotin-SP conjugate (Goat polyclonal) | Millipore | Cat#AP132B, RRID:AB_11212148 | DAB (1:1000) |
| Antibody | Anti-GFP (Rabbit polyclonal) | Abcam | Cat#ab290, RRID:AB_303395 | EM (1:1000) |
| Antibody | Nanogold-Fab goat anti-rabbit | Nanoprobe | Cat#2004, RRID:AB_2631182 | EM (1:20) |
| Antibody | Anti-Atg12 (Rabbit polyclonal) | Abcam | Cat#ab155589 | IF (1:500) |
| Antibody | Anti-mCherry (16D7) (Rat monoclonal) | Thermo Fisher Scientific | Cat #M11217, RRID:AB_2536611 | IF (1:1000) |
| Recombinant DNA reagent | FUGW-PercevalHR (plasmid) | Addgene | RRID:Addgene_49083 | |
| Recombinant DNA reagent | pCSCMV:tdTomato (plasmid) | Addgene | RRID:Addgene_30530 | |
| Recombinant DNA reagent | ptfLC3 (plasmid) | Addgene | RRID:Addgene_21074 | |
| Recombinant DNA reagent | PU6-BbsI-CBh-Cas9-T2AmCherry (plasmid) | Addgene | RRID:Addgene_64324 | |
| Recombinant DNA reagent | pmRFP-LC3 (plasmid) | Addgene | RRID:Addgene_21075 | |
| Recombinant DNA reagent | pRK GFP paxillin (plasmid) | Addgene | RRID:Addgene_50529 | |
| Recombinant DNA reagent | GW1-pHRed (plasmid) | Addgene | RRID:Addgene_31473 | |
| Sequence-based reagent | Atg12-gRNA1-Fw | This paper | PCR primer | CGGAAACAGCCACCCCAGAG |
| Sequence-based reagent | Atg12-gRNA1-Rs | This paper | PCR primer | GCCCACTAACGGATGTTGACATTACTT |
| Sequence-based reagent | Atg12-gRNA2-Fw | This paper | PCR primer | ACGCTGCTACGTCACTTCC |
| Sequence-based reagent | Atg12-gRNA2-Rs | This paper | PCR primer | GCTCTGGAAGGCTCTCGC |
| Sequence-based reagent | Ulk1-gRNA1-Fw | This paper | PCR primer | TCGCAAGGACCTGATTGGAC |
| Sequence-based reagent | Ulk1-gRNA1-Rs | This paper | PCR primer | CCTCGCAATCCCGGACTC |
| Sequence-based reagent | Ulk1-gRNA2-Fw | This paper | PCR primer | CATCTGCTTTTTATCCCAGCA |
| Sequence-based reagent | Ulk1-gRNA2-Rs | This paper | PCR primer | CTGCAACAGAGCCAGGAG |
| Sequence-based reagent | Ulk2-gRNA1-Fw | This paper | PCR primer | TACTGCAAGCGGGACCT |
| Sequence-based reagent | Ulk2-gRNA1-Rs | This paper | PCR primer | TTTCGCACCAGACAACGGG |
| Sequence-based reagent | Ulk2-gRNA2-Fw | This paper | PCR primer | CTCTGAGTGAAGATACTATCAGAGTG |
| Sequence-based reagent | Ulk2-gRNA2-Rs | This paper | PCR primer | GATCCCTGTGGATTATCCCTTT |
| Commercial assay or kit | DNeasy Blood and Tissue Kit | Qiagen | Cat#69504 | |
| Commercial assay or kit | LightCycler 480 High Resolution Melting Master | Roche | Cat#04909631001 | |
| Commercial assay or kit | VECTASTAIN ABC-Peroxidase Kit | Vector Laboratories | Cat#PK4000 | |
| Commercial assay or kit | HQ Silver Enhancement kit | Product | Cat#2012 | |
| Chemical compound, drug | NeuroCult Proliferation Supplement | StemCell Technologies | Cat#05701 | |
| Chemical compound, drug | NeuroCult Basal Medium | StemCell Technologies | Cat#05700 | |
| Chemical compound, drug | EGF | Sigma-Aldrich | Cat#E4127 | |
| Chemical compound, drug | bFGF | Sigma-Aldrich | Cat#SRP4038-50UG | |
| Chemical compound, drug | Heparin | StemCell Technologies | Cat#07980 | |
| Chemical compound, drug | MgCl2 | Sigma-Aldrich | Cat#M8266; CAS 7786-30-3 | |
| Chemical compound, drug | Paraformaldehyde | Sigma-Aldrich | Cat#P6148; CAS: 30525-89-4 | |
| Chemical compound, drug | Tamoxifen | Sigma-Aldrich | Cat#T5648; CAS: 10540-29-1 | |
| Chemical compound, drug | Anhydrous ethyl alcohol | Commercial Alcohols | 1019C | |
| Chemical compound, drug | Sunflower seed oil | Sigma-Aldrich | Cat#S5007 CAS: 8001-21-6 | |
| Chemical compound, drug | Protease Inhibitor Cocktail Set III | Millipore | 539134 | |
| Chemical compound, drug | Blebbistatin | Research Chemicals Inc Toronto | Cat#B592490-10 CAS: 674289-55-5 | |
| Chemical compound, drug | GM6001 | Abmole | Cat#M2147-10MG CAS: 142880-36-2 | |
| Chemical compound, drug | Y-27632 | Cayman Chemical | Cat#10005583–5 CAS: 129830-38-2 | |
| Chemical compound, drug | Compound C | EMD Millipore | Cat#171260–10 MG CAS: 866405-64-3 | |
| Peptide, recombinant protein | BDNF | Peprotech | Cat#450–02 | |
| Peptide, recombinant protein | GABA | Sigma-Aldrich | Cat#A5835-25G CAS: 56-12-2 | |
| Software, algorithm | Imaris 7.2 | Bitplane, Oxford Instrument | https://imaris.oxinst.com/ | |
| Software, algorithm | MATLAB 2016a | Mathworks | https://www.mathworks.com/ | |
| Software, algorithm | MATLAB scripts PercevalHR imaging analysis | This paper | https://github.com/SagLab-CERVO/PercevalHR-fluorescence-intensity | To track cell and measure PercevalHR fluorescence intensity (Labrecque et al., 2020; copy archived at https://github.com/elifesciences-publications/PercevalHR-fluorescence-intensity) |
| Software, algorithm | ImageJ | NIH | https://imagej.net/Welcome | |
| Software, algorithm | Origin 2016 | OriginLab Corporation | https://www.originlab.com/ | |
| Software, algorithm | Statistica 6.1 | Stat Soft | N/A | |
| Software, algorithm | Primer-Blast software | NCBI | https://www-ncbi-nlm-nih-gov.acces.bibl.ulaval.ca/tools/primer-blast/ | |
| Software, algorithm | ChopChop online software | Labun et al., 2019 | https://chopchop.cbu.uib.no/ | |
| Software, algorithm | LightCycler 480 SW1.5.1 software | Roche | 04994884001 |
Additional files
Download links
A two-part list of links to download the article, or parts of the article, in various formats.
Downloads (link to download the article as PDF)
Open citations (links to open the citations from this article in various online reference manager services)
Cite this article (links to download the citations from this article in formats compatible with various reference manager tools)
The dynamic interplay between ATP/ADP levels and autophagy sustain neuronal migration in vivo
eLife 9:e56006.
https://doi.org/10.7554/eLife.56006


