A high-throughput small molecule screen identifies farrerol as a potentiator of CRISPR/Cas9-mediated genome editing
- Clinical and Translational Research Center of Shanghai First Maternity & Infant Hospital, Shanghai Key Laboratory of Signaling and Disease Research, Frontier Science Center for Stem Cell Research, School of Life Sciences and Technology, Tongji University, China
- State Key Laboratory of Natural Medicines, China Pharmaceutical University, China
- Tsingtao Advanced Research Institute, Tongji University, China
Figures
Figure 1 with 3 supplements
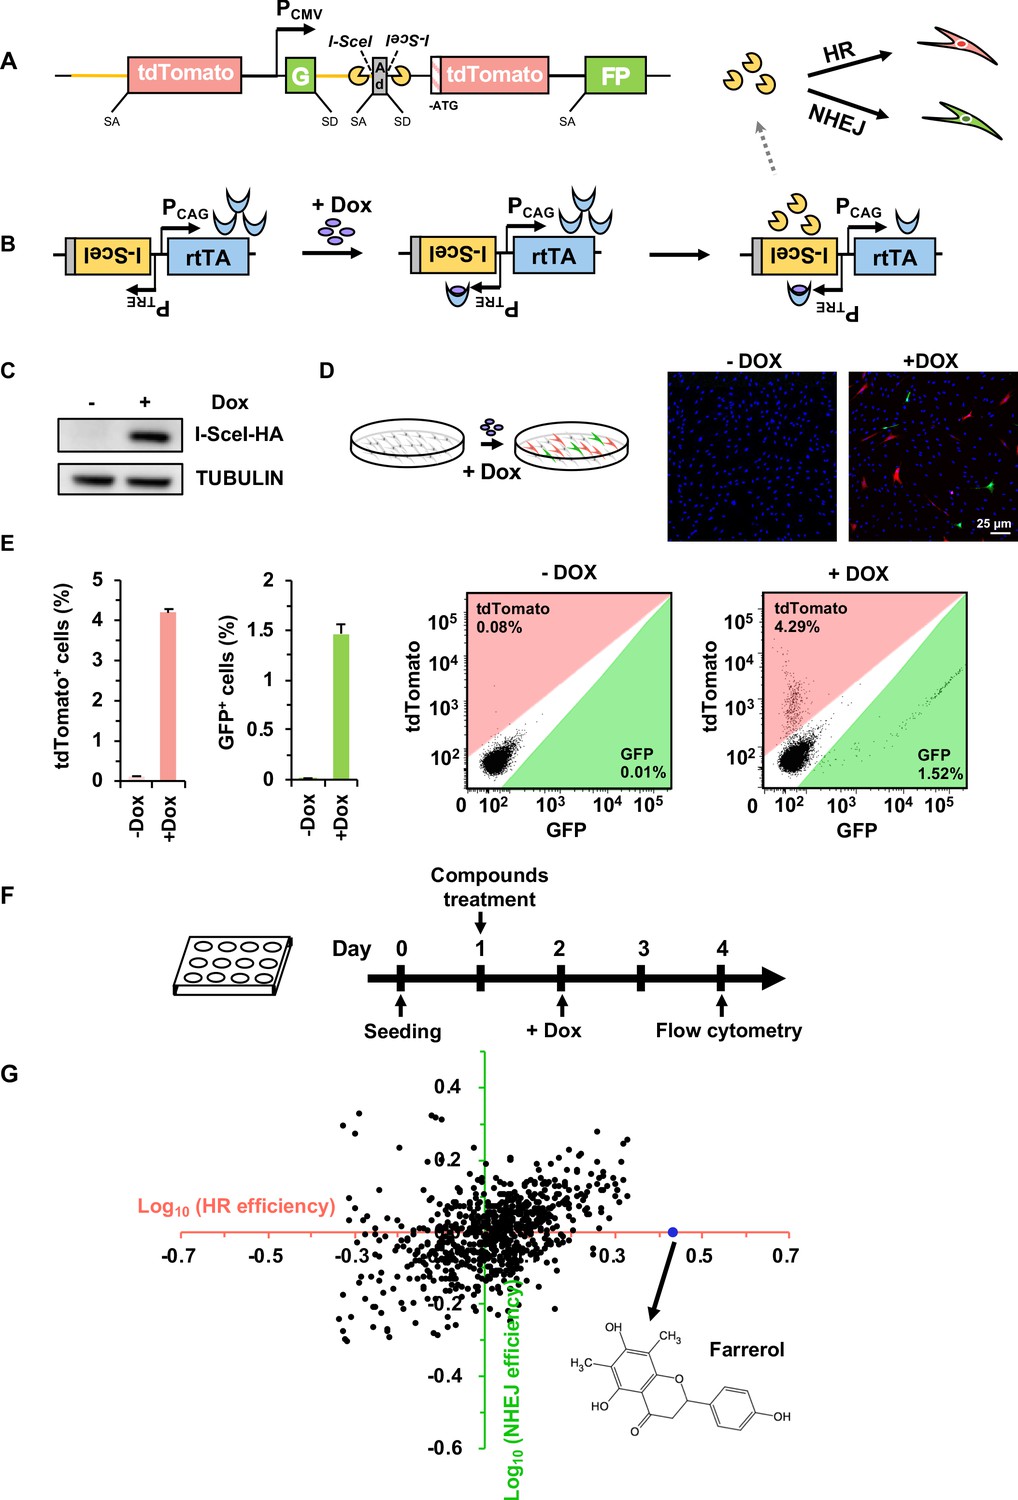
Establishment of a compound screening platform for monitoring the efficiency of DSB repair by HR and NHEJ.
(A) Diagram of the HR-NHEJ dual fluorescent reporter (Chen et al., 2019). SD, splice donor; SA, splice acceptor. In the reporter cassette for simultaneous analysis of HR and NHEJ at the same chromosomal site, it contains two parts separated by a CMV promoter. The part downstream of the promoter contains two GFP exons separated by the engineered Pem1 intron with splice donor and acceptor, an adenoviral exon (AD2) with splice donor and acceptor, two I-SceI recognition sites in an inverted orientation, and an ATG-less tdTomato gene. The second part upstream of the promoter contains the Pem1 intron and a full-length tdTomato gene with a splice donor before start codon ATG. The homology region between the two parts of the reporter is approximately 3.9 kb including the rat Pem1 intron (marked in yellow line) and the tdTomato gene. (B) Schematic diagram of the doxycycline-inducible I-SceI expression vector. rtTA, reverse tetracycline trans-activator protein; PTRE, promoter of tetracycline response element; PCAG, the CAG promoter, a strong synthetic promoter frequently used to drive high levels of gene expression in mammalian systems. (C–D) Generation of the compound screening platform. The linearized doxycycline-inducible I-SceI expression vector was nucleofected into D4a cells followed by selection with 30 μg/mL hygromycin B. Then individual colonies were picked and one of the colonies, CLZ3, was utilized for further studies. I-SceI endonuclease expression could be efficiently induced upon doxycycline supplementation (C), further resulting in the generation of DSBs on the reporter cassette. Successful repair by HR or NHEJ results in functional tdTomato or GFP, turning cells red or green respectively, which could be observed via microscopy (D). (E) Flow cytometry analysis of tdTomato+ and GFP+ cells upon doxycycline addition (left panel). The representative FACS traces are shown (right panel). (F) Workflow of compound screening using the CLZ3 cell line. (G) 722 small molecules were screened using CLZ3 cells and farrerol (highlighted in blue) was identified as an HR enhancer.
-
Figure 1—source data 1
The list of small molecule compounds and their influences on DNA repair.
- https://cdn.elifesciences.org/articles/56008/elife-56008-fig1-data1-v2.xlsx
-
Figure 1—source data 2
Summary of NHEJ, HR and SSA efficiency.
- https://cdn.elifesciences.org/articles/56008/elife-56008-fig1-data2-v2.xlsx
Figure 1—figure supplement 1
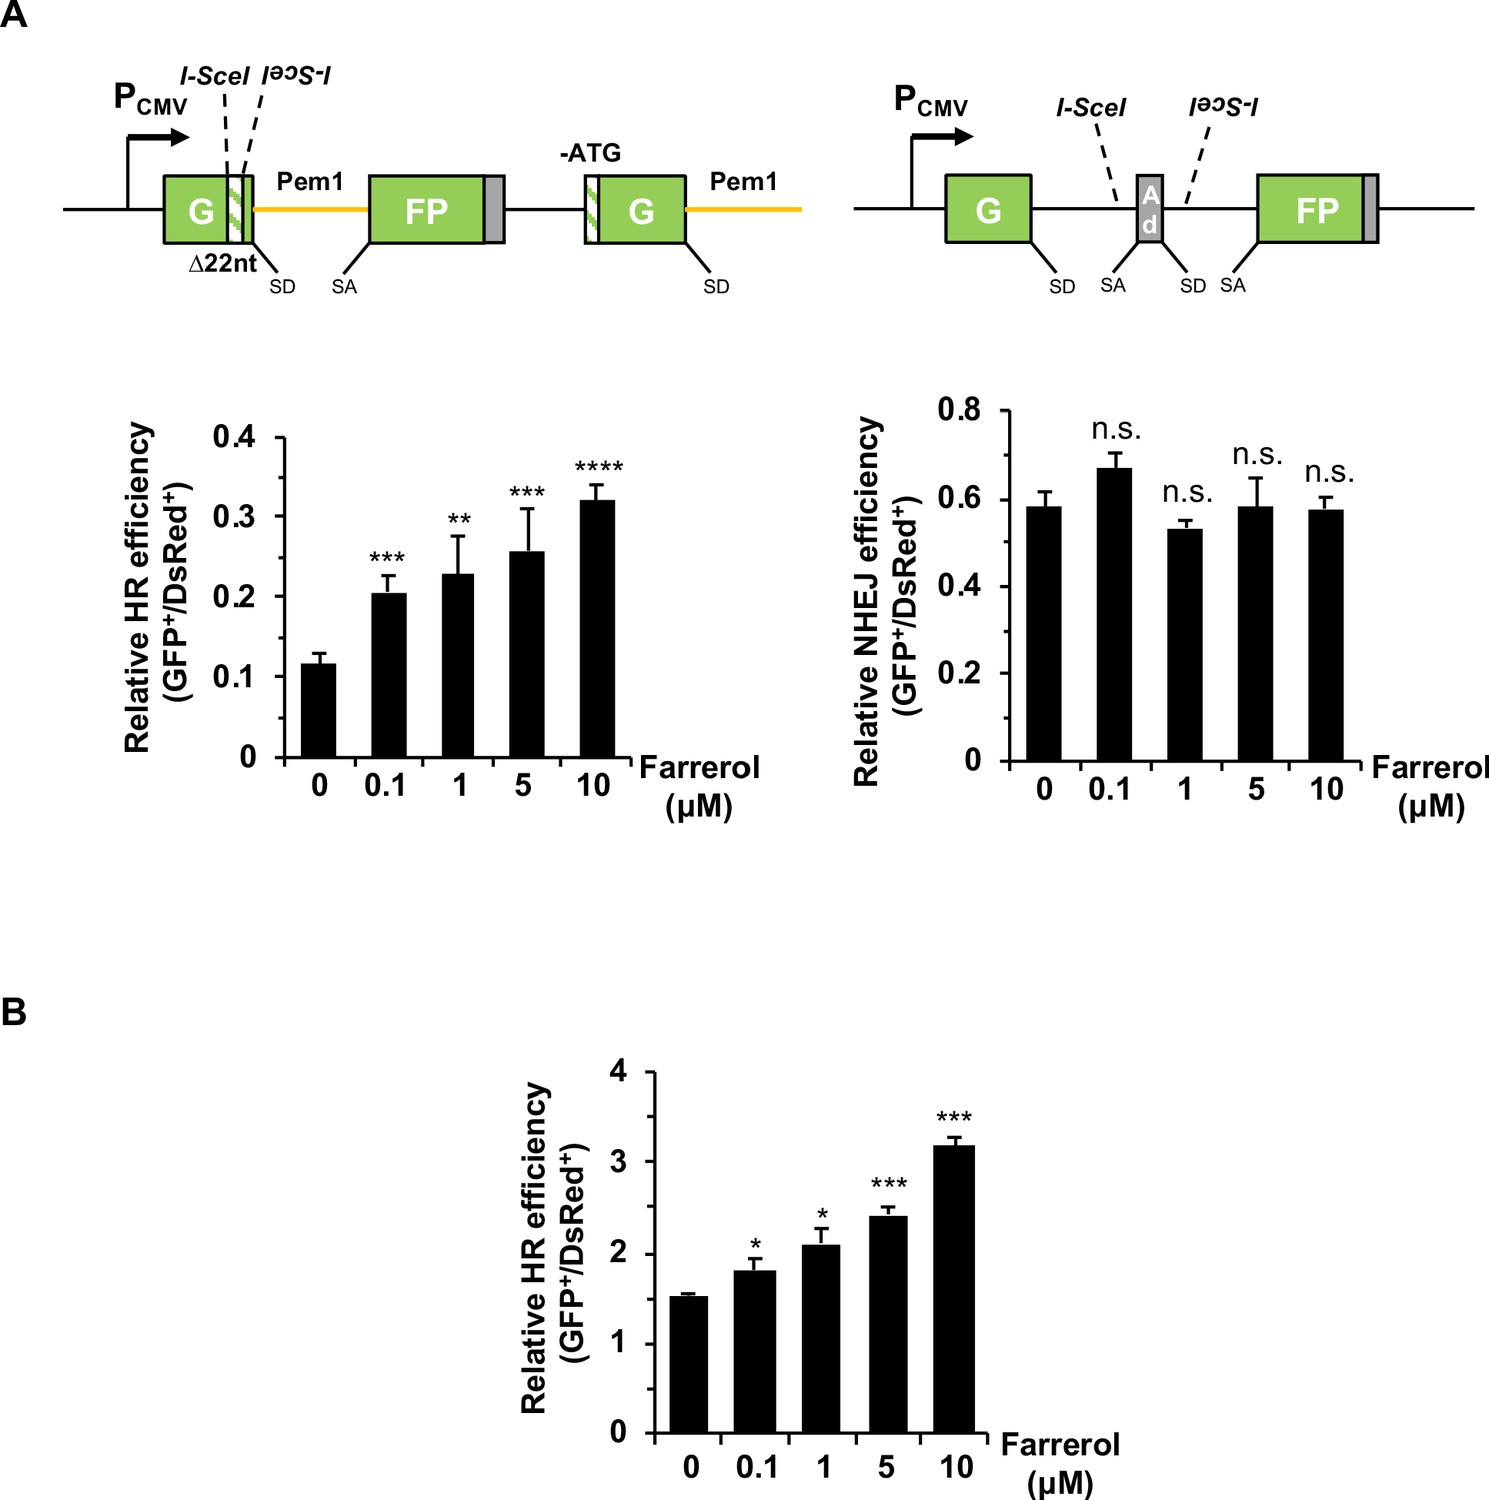
Farrerol stimulates the precise HR in human fibroblasts and mouse ESCs.
(A) Farrerol significantly promotes HR efficiency in HCA2-H15c cells harboring the single HR reporter (left panel), while does not influence NHEJ efficiency in HCA2-I9a cells harboring the single NHEJ reporter (right panel). The HR and NHEJ reporters were generated as previously described (Mao et al., 2008a). SD, splice donor; SA, splice acceptor; the yellow line stands for the homologous arm. (B) Farrerol significantly enhances HR efficiency in mouse ESCs. HR reporter was linearized in vitro with I-SceI to induce DSBs. Mouse ESCs were pretreated with indicated doses of farrerol for 24 hr. Then 0.5 μg purified linearized HR reporter was transfected into 2 × 10⁵ mouse ESCs along with 100 ng plasmid encoding pDsRed2-N1 for normalizing the transfection efficiency. Farrerol was supplemented into the culture medium of transfected cells until FACS analysis at 48 hr post transfection. The ratio of GFP positive cells versus DsRed positive cells was used as the measure of HR efficiency. Error bars represent the s.d. *p<0.05, **p<0.01, ***p<0.001, ****p<0.0001, n.s., not significant, t-test. All experiments were repeated at least three times.
Figure 1—figure supplement 2
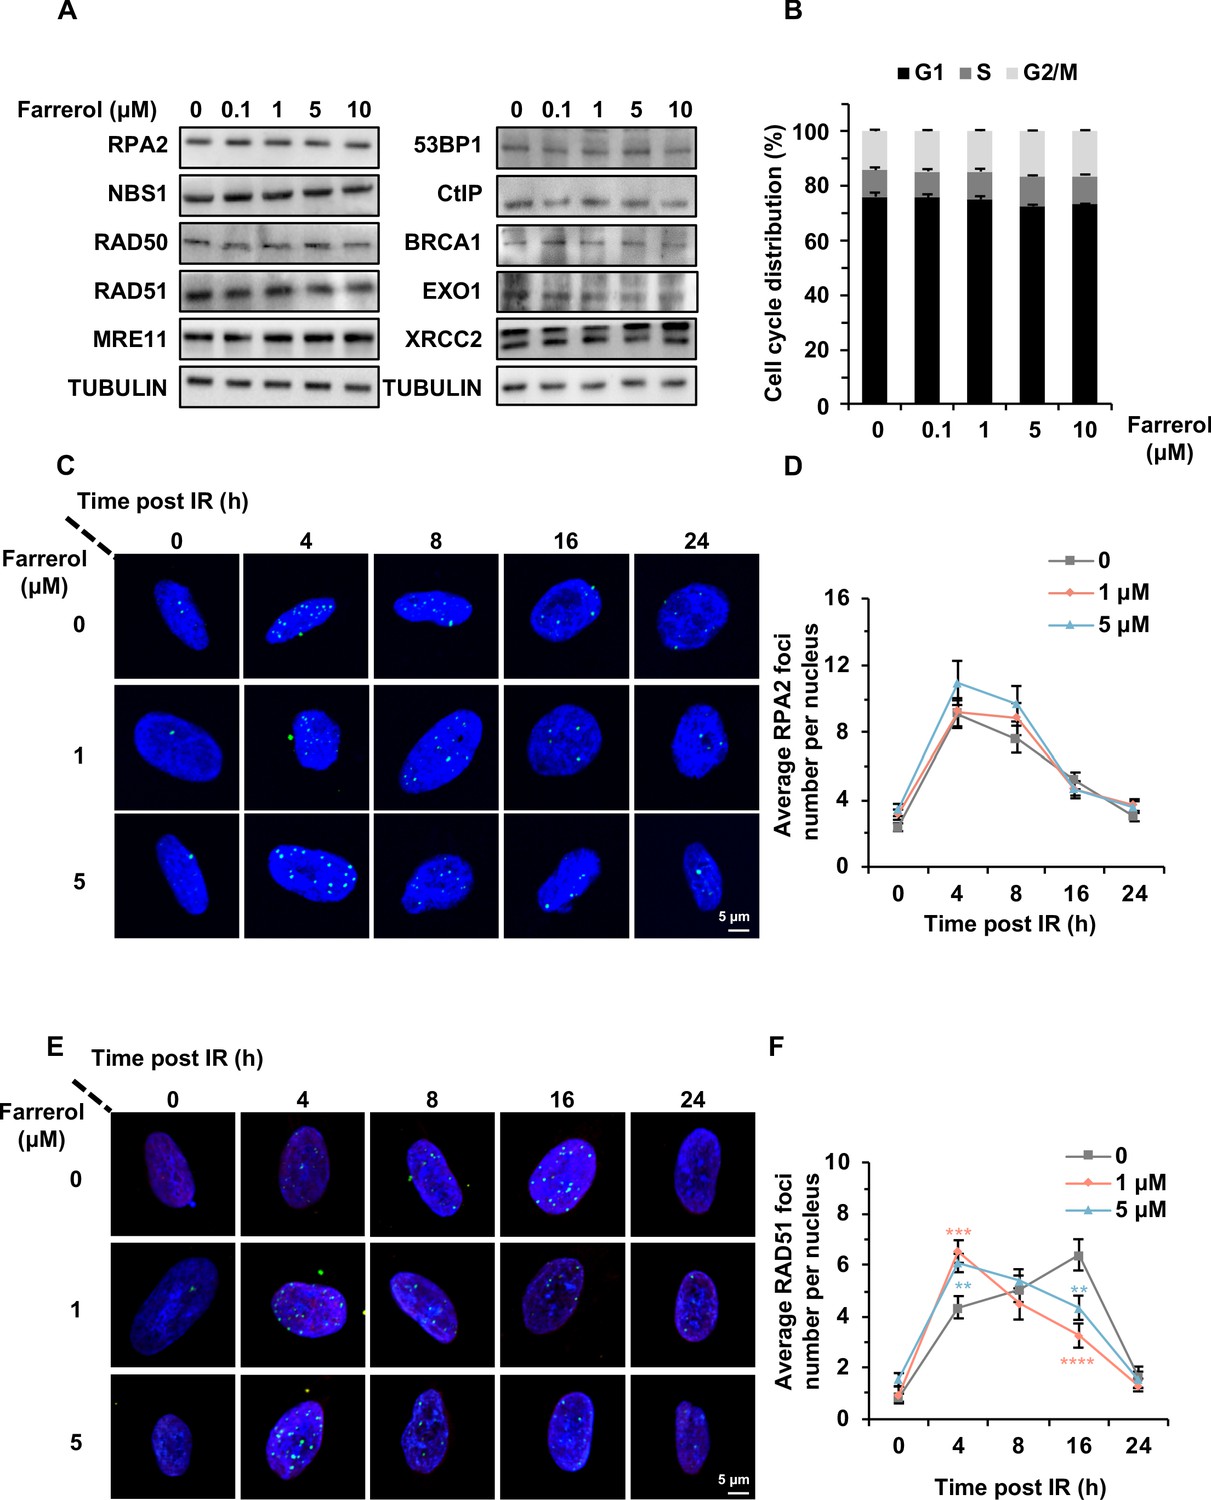
Farrerol accelerates the recruitment of RAD51 rather than influences the expression of the indicated HR-related factors.
(A) Farrerol does not influence the protein level of important HR factors, and 53BP1, a critical negative regulator of HR. (B) Analysis of cell cycle distribution in HCA2-hTERT cells treated with farrerol at indicated concentrations. (C–D) Farrerol does not affect the recruitment of RPA2 in HCA2-hTERT cells post 2 Gy X-Ray treatment. (E–F) Farrerol promotes RAD51 recruitment in HCA2-hTERT cells post 2 Gy X-Ray treatment. Error bars in (B) represent the s.d. Error bars in (D) and (F) represent the s.e.m. **p<0.01, ***p<0.001, ****p<0.0001, t-test.
Figure 1—figure supplement 3
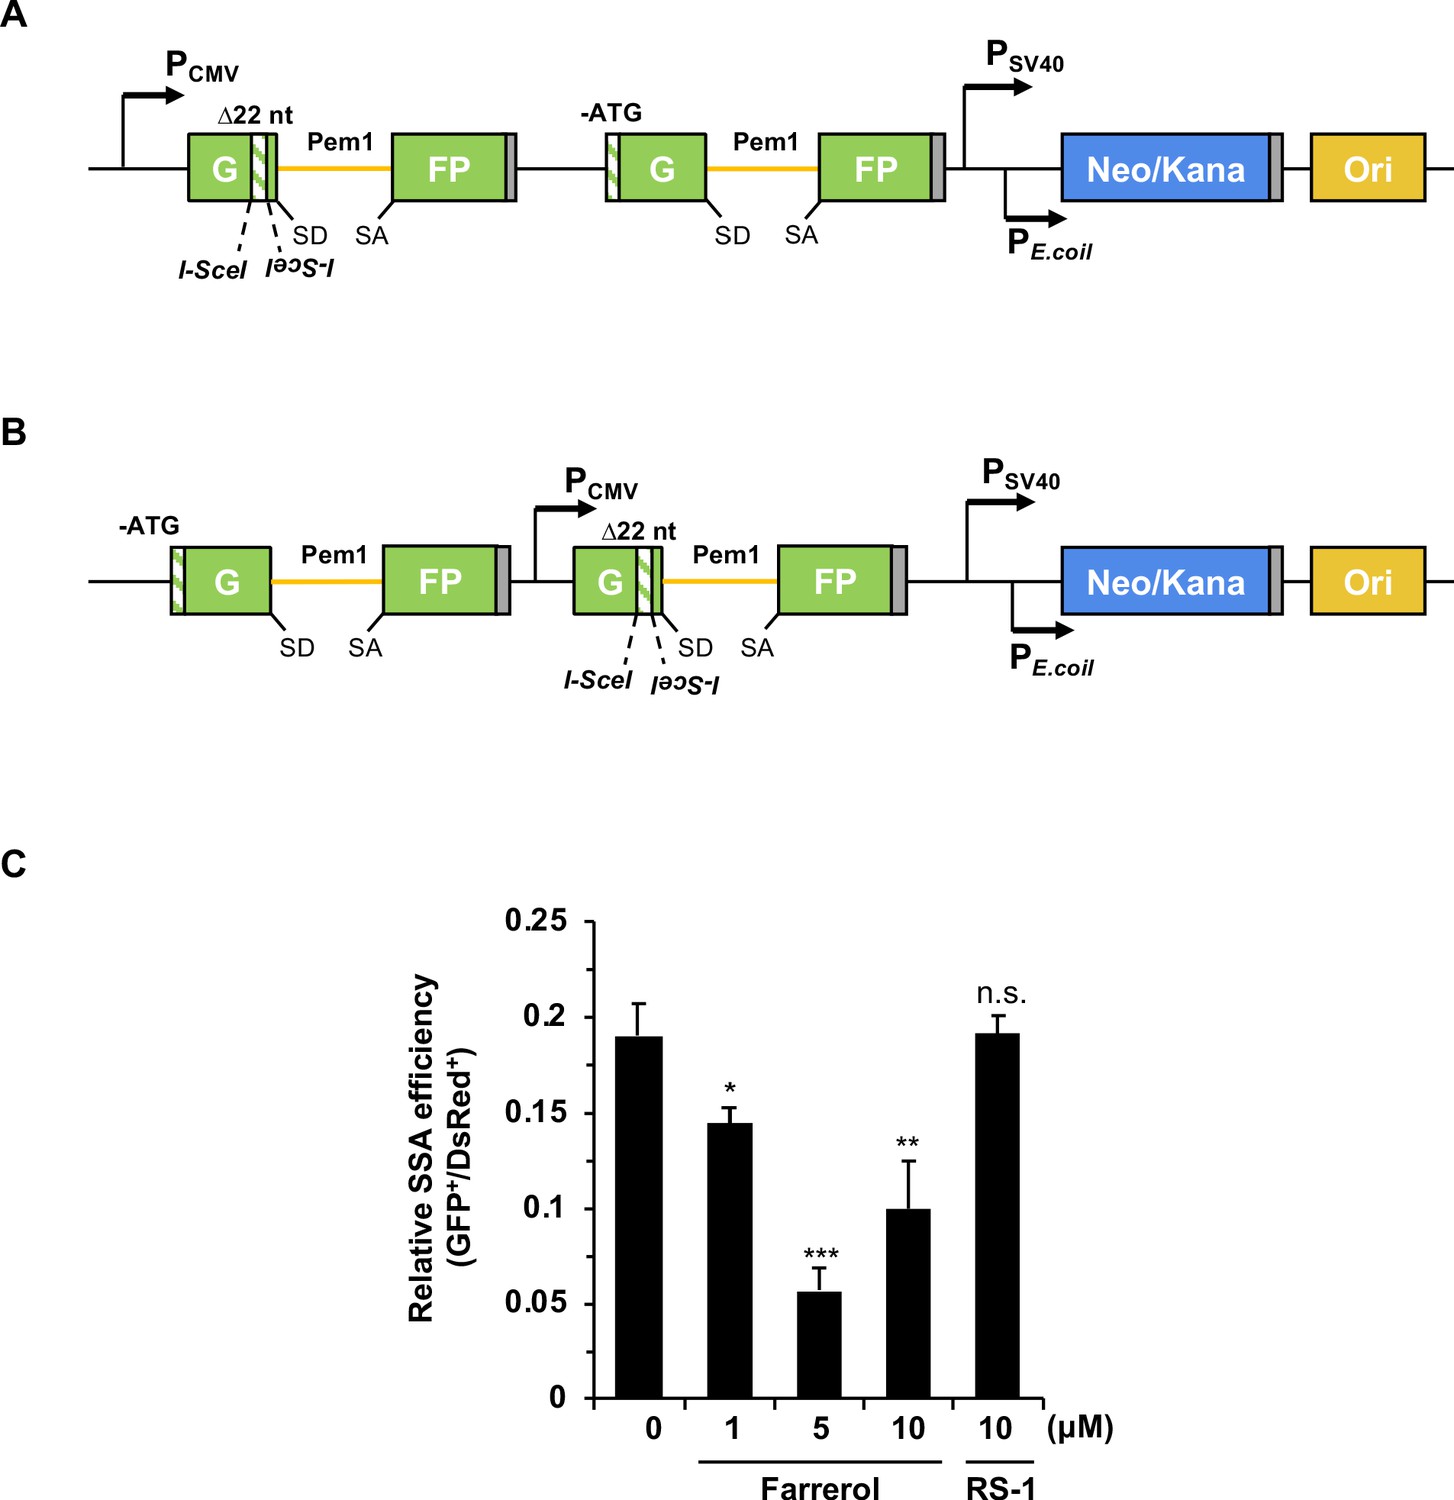
Farrerol inhibits the SSA efficiency.
(A) Schematic diagram of reporter cassette HRF measuring gene conversion, crossing over, and SSA. The cassette contains two copies of defective GFP-Pem1. The first copy has two inverted I-SceI recognition sites, and a 22-nt deletion on the first exon of GFP, and the second copy of GFP lacks the start codon. I-SceI induced DSBs can be repaired by gene conversion, crossing over or SSA, resulting in functional GFP. SD, splice donor; SA, splice acceptor; the yellow line stands for the homologous arm. (B) Schematic diagram of reporter cassette HRIF measuring gene conversion and crossing over. The positions of the two copies of defective GFP is different in HRF and HRIF. In HRF reporter, both copies are downstream CMV promoter while in HRIF reporter the CMV promoter is located between the two copies of GFP. In response to I-SceI digestion, only gene conversion or crossing over can reconstitute functional GFP. SD, splice donor; SA, splice acceptor; the yellow line stands for the homologous arm. (C) Effect of farrerol and RS-1 treatment on SSA efficiency. The two reporters were integrated into HCA2-hTERT cells, and a pool of colonies containing chromosomally integrated reporters were mixed for further analysis. HRF minus HRIF was employed as the measure of SSA efficiency. 5 μg I-SceI vector and 15 ng pDsRed2-N1 were transfected into reporter cells pre-treated with different small molecules. Small molecules were still added to the cells until FACS analysis three days after transfection. The ratio of GFP positive cells versus DsRed positive cells was used as the measure of repair efficiency. Error bars represent the s.d. *p<0.05, **p<0.01, ***p<0.001, n.s., not significant, t-test. All experiments were repeated at least three times.
Figure 2 with 1 supplement
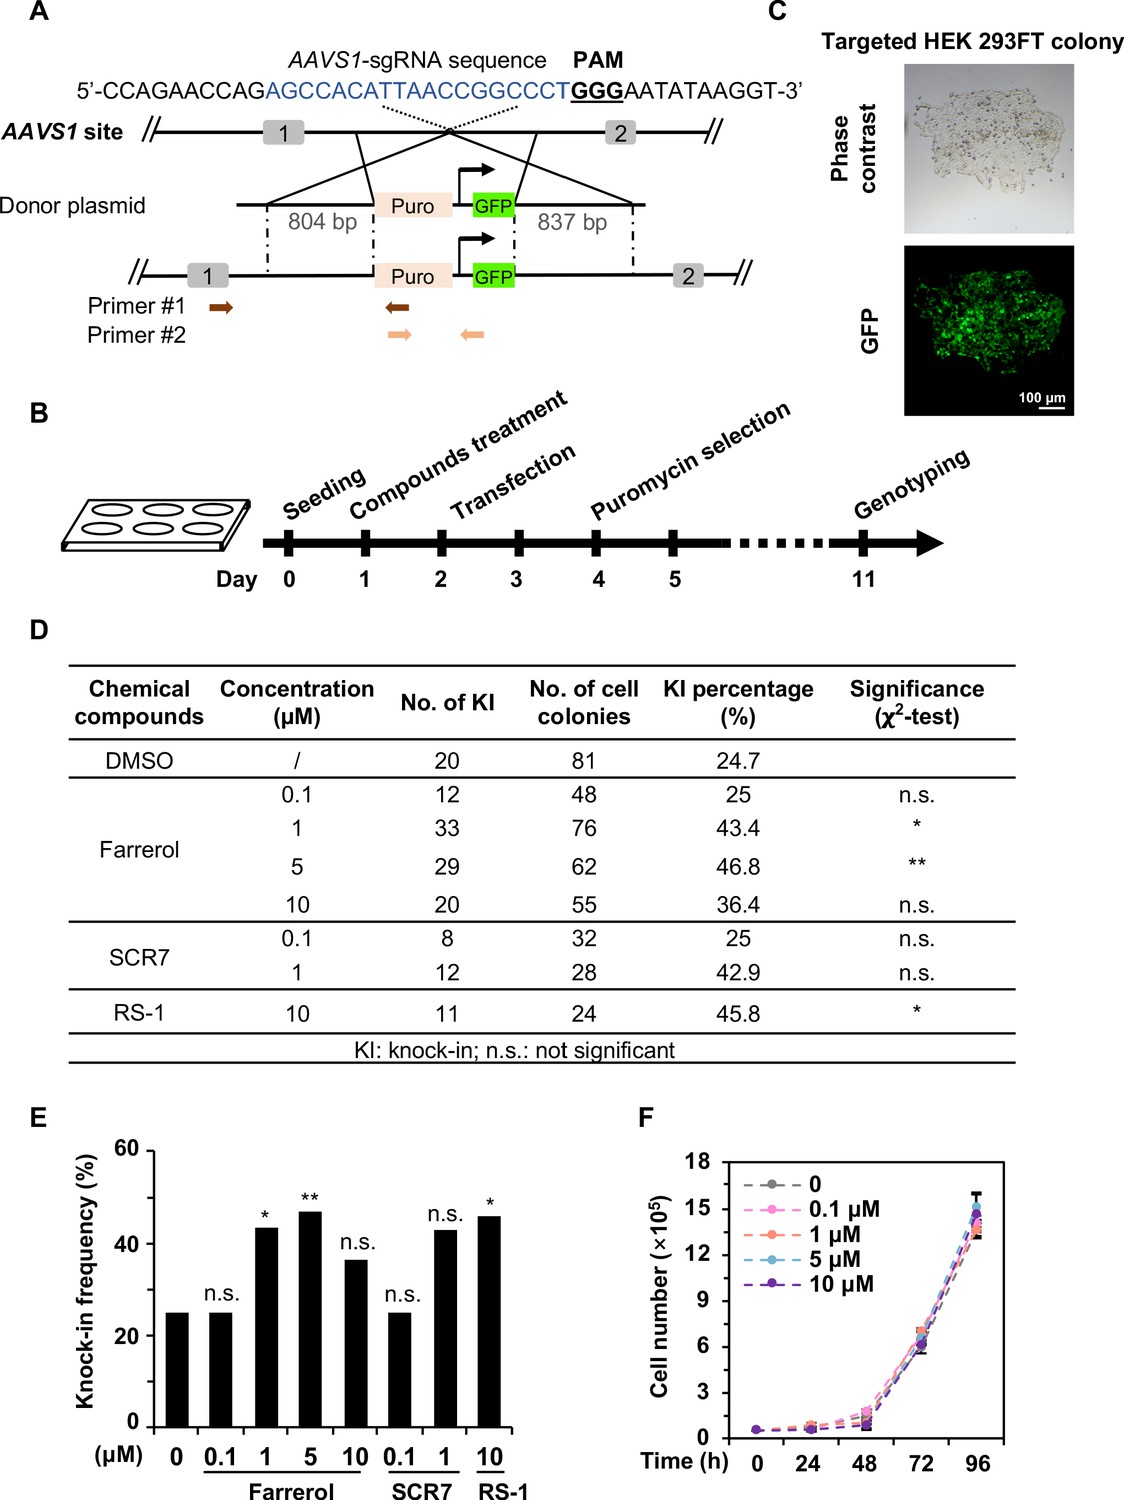
Farrerol promotes SpCRISPR/Cas9-mediated knock-in efficiency in human cells.
(A) Schematic diagram of the gene targeting strategy at the human AAVS1 locus. A donor vector containing a promoter-less p2A-puromycin and GFP gene driven by the CAG promoter was designed for targeting the AAVS1 locus. The underlined trinucleotide represents the PAM, and the sgRNA targeting site is labeled in blue. Puro stands for puromycin. Two pairs of primers used for genotyping are indicated by arrows. The length of the left and right homologous arm is 804 bp and 837 bp, respectively. Primer sequences are listed in the Table 1. (B) Workflow of gene targeting at the AAVS1 locus in HEK 293FT cells. (C) Representative microscopy images of successfully targeted GFP+ HEK 293FT cells post 1 μg/mL puromycin selection. (D–E) Effect of different small molecules on gene knock-in frequency at the human AAVS1 locus. The surviving colonies post puromycin selection were further validated by genotyping using PCR. (F) Growth curve of HEK 293FT cells treated with the indicated doses of farrerol. For (D) and (E), χ2-test was used for statistical analysis. Error bars in (F) represent the s.d. and t-test was used for statistical analysis. *p<0.05, **p<0.01, n.s., not significant. All experiments were repeated at least three times.
-
Figure 2—source data 1
Summary of knock-in efficiency in HEK 293FT cells.
- https://cdn.elifesciences.org/articles/56008/elife-56008-fig2-data1-v2.xlsx
Figure 2—figure supplement 1

The effects of small molecule treatment on knock-in efficiency at the AAVS1 locus in HEK 293FT cells.
(A) Schematic diagram of gene targeting strategy at human AAVS1 locus. Donor vector containing a promoter-less p2A-mCherry was designed for targeting the AAVS1 locus. The underlined trinucleotide represents PAM, and the sgRNA targeting site is labeled in blue. The length of the left and right homologous arm is 804 bp and 837 bp, respectively. (B–C) Effect of different small molecules treatment on gene knock-in frequency at human AAVS1 locus. The representative FACS traces are shown in (B). Knock-in frequency was indicated by the percentage of mCherry+ cells in (C). Error bars represent the s.e.m. *p<0.05, ***p<0.001, ****p<0.0001, n.s., not significant, t-test. All experiments were repeated at least three times.
Figure 3 with 2 supplements

Farrerol promotes SpCRISPR/Cas9 mediated gene targeting efficiency in mouse ESCs.
(A) Schematic diagram of the gene targeting strategy at the mouse Actb locus. A donor vector containing a promoter-less p2A-puromycin (Puro) and GFP gene driven by the CAG promoter was designed for targeting the mouse Actb locus. The underlined trinucleotide represents the PAM, and the sgRNA targeting site is labeled in red. The length of the left and right homologous arm is 801 bp and 800 bp, respectively. (B) Representative images of Coomassie blue stained puromycin resistant E14 cells which were successfully knocked in. Transfection of donor only or the mixture of sgRNA and Cas9 were set as the negative control. (C) Representative microscopy images of successfully targeted E14 cells with GFP expression. (D) Effect of different small molecules on gene targeting frequency at the Actb locus in mouse ESCs. The knock-in efficiency was measured by counting the cell colonies which were resistant to puromycin. (E) The Sanger sequencing results of the 5’ and 3’ junction regions of successfully knocked-in cells treated with farrerol. HAL stands for the left homologous arm and HAR stands for the right homologous arm. Error bars represent the s.e.m. **p<0.01, ***p<0.001, n.s., not significant, t-test. All experiments were repeated at least three times.
-
Figure 3—source data 1
Summary of knock-in efficiency in mouse ESCs.
- https://cdn.elifesciences.org/articles/56008/elife-56008-fig3-data1-v2.xlsx
Figure 3—figure supplement 1
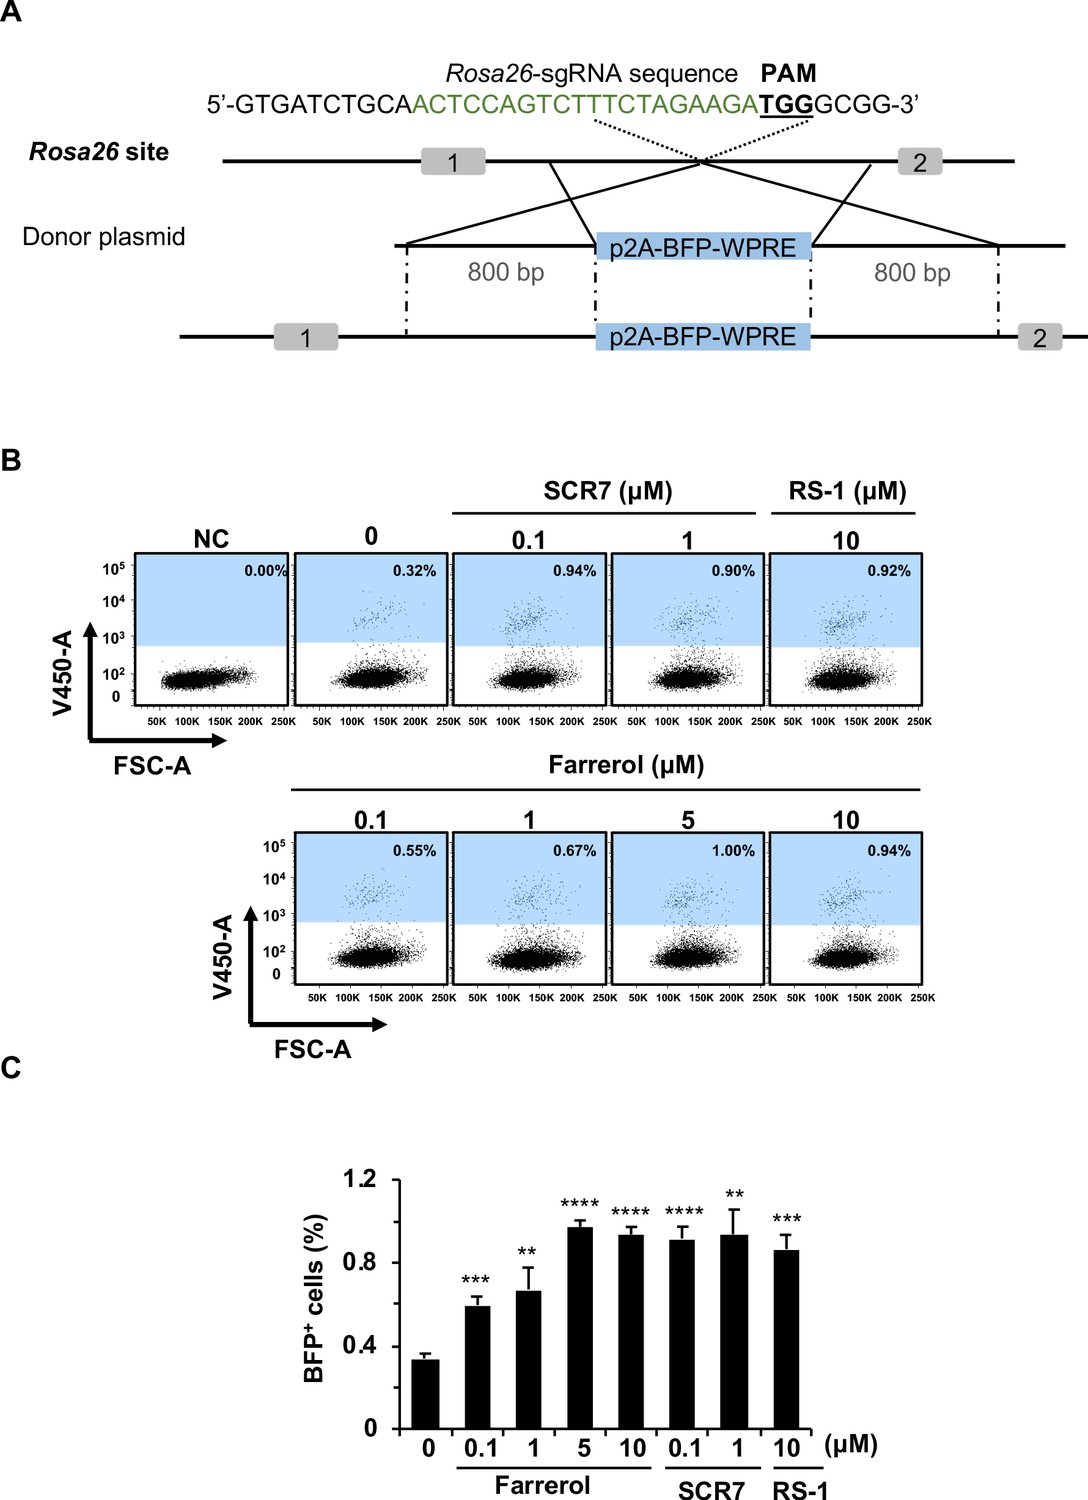
The effects of small molecule treatment on knock-in efficiency at the Rosa26 locus in mouse ESCs.
(A) Schematic diagram of gene targeting strategy at the Rosa26 locus in mouse ESCs. Donor vector containing a promoter-less p2A-BFP-WPRE was designed for targeting the mouse Rosa26 locus. The underlined trinucleotide represents PAM, and the sgRNA targeting site is labeled in green. The length of both the left and right homologous arm are 800 bp. (B–C) Effect of different small molecules treatment on gene knock-in frequency at mouse Rosa26 locus. The representative FACS traces are shown in (B). Knock-in frequency was indicated by the percentage of BFP+ cells in (C). Error bars represent the s.e.m. **p<0.01, ***p<0.001, ****p<0.0001, t-test. All experiments were repeated at least three times.
Figure 3—figure supplement 2

The effects of small molecule treatment on knock-in efficiency at the Sox2 locus in mouse ESCs.
(A) Schematic diagram of gene targeting strategy at the Sox2 locus in mouse ESCs. Donor vector containing a promoter-less p2A-mCherry was designed for targeting the mouse Sox2 locus. The underlined trinucleotide represents PAM, and the sgRNA targeting site is labeled in light brown. The length of the left and right homologous arm is 789 bp and 776 bp, respectively. (B–C) Effect of different small molecules treatment on gene knock-in frequency at mouse Sox2 locus. The representative FACS traces are shown in (B). Knock-in frequency was indicated by the percentage of mCherry+ cells in (C). Error bars represent the s.e.m. **p<0.01, ***p<0.001, ****p<0.0001, t-test. All experiments were repeated at least three times.
Figure 4 with 2 supplements

The effects of small molecule treatment on genomic stability in mouse ESCs.
(A) Representative images of γH2AX immunostaining in mouse ESC E14 treated with indicated doses of small molecules. (B) Analysis of relative intensity of γH2AX in mouse ESCs in (A). The results were normalized to those in control group. Each dot represents the relative fluorescence intensity of a single nucleus. (n ≥ 180 single nucleus). (C) Representative images of 53BP1 immunostaining in mouse ESC E14 treated with indicated doses of small molecules. (D) Quantification of 53BP1 foci numbers in (C). At least 50 cells were included for each group. (E) Representative images of alkaline comet assay of mouse ESC E14 treated with indicated doses of molecules for 24 hr (left panel). The tail moments of at least 50 cells for each group were quantified using Cometscore software (Sumerduck, VA, USA) (right panel). (F) Karyotyping analysis indicated that 48 hr farrerol treatment post spCRSIPR/Cas9 mediated editing did not greatly affect karyotypes (40, XY) of the Oct4-ΔPE-GFP transgenic C57BL/6 × PWK ESCs. Error bars in (B), (D) and (E) represent the s.e.m. Error bars in (F) represent the s.d. *p<0.05, **p<0.01, ***p<0.001, n.s., not significant, t-test.
-
Figure 4—source data 1
The genotoxicity of small compounds treatment.
- https://cdn.elifesciences.org/articles/56008/elife-56008-fig4-data1-v2.xlsx
Figure 4—figure supplement 1
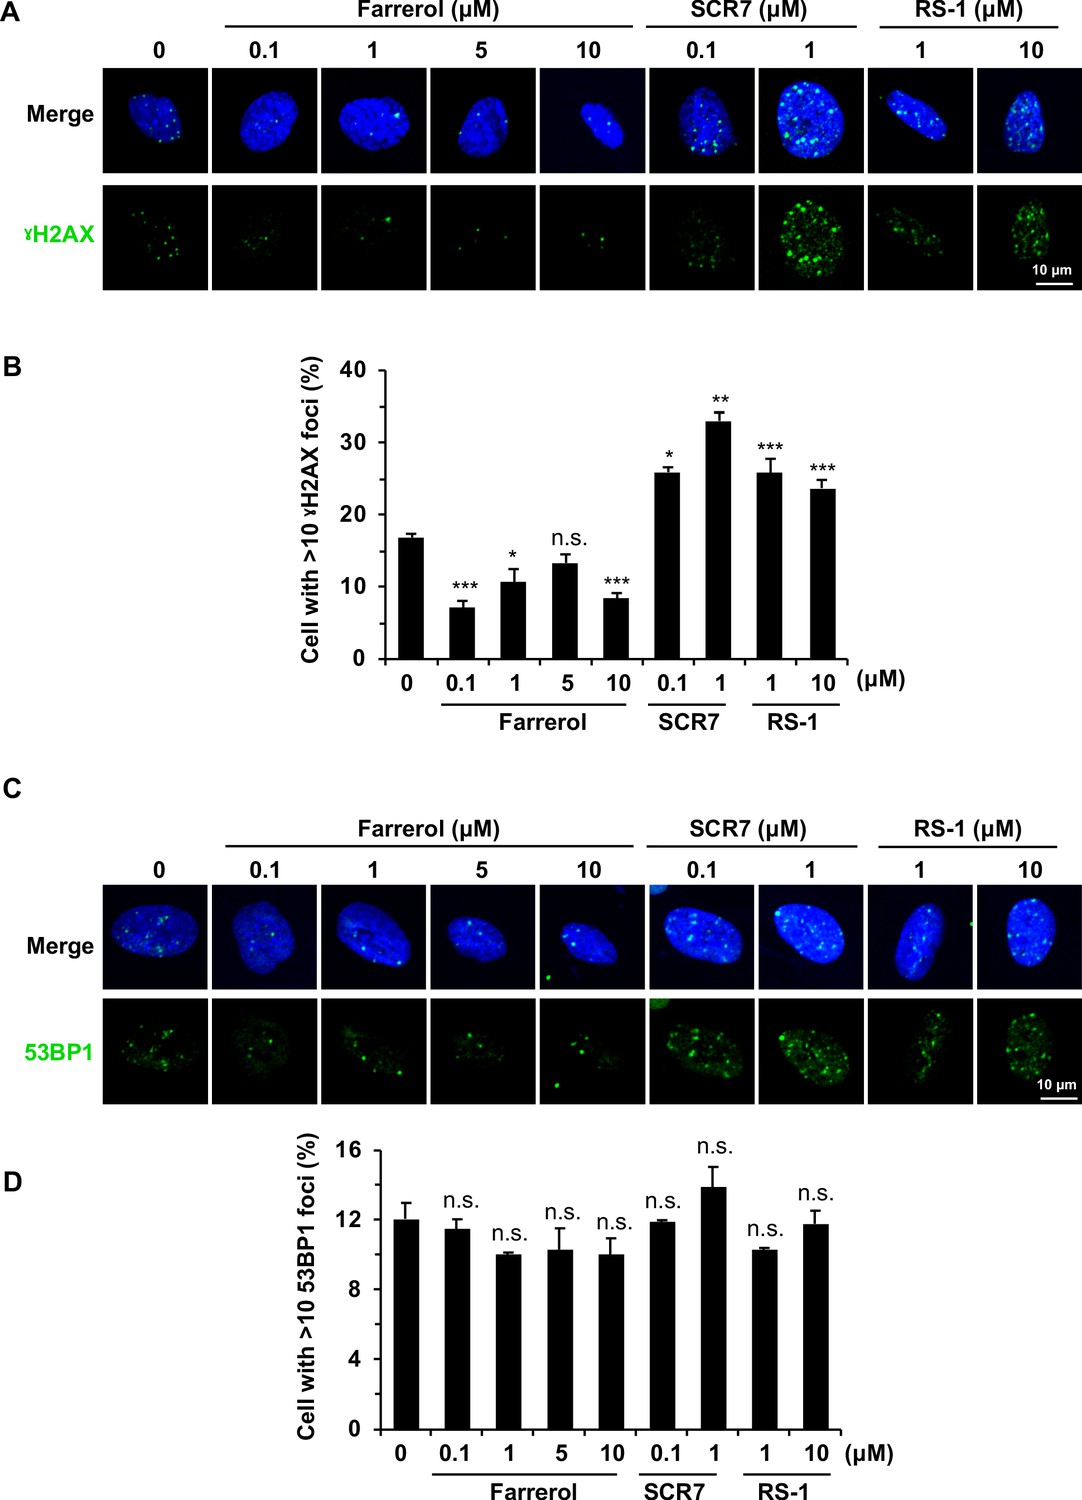
The effects of small molecule treatment on genomic stability in HCA2-hTERT cells.
(A) Representative images of γH2AX immunostaining in HCA2-hTERT cells treated with indicated doses of small molecules. (B) Quantification of the percentage of cells with more than 10 γH2AX foci per nucleus in (A). At least 50 cells were included for each group. (C) Representative images of 53BP1 immunostaining in HCA2-hTERT cells treated with indicated doses of small molecules. (D) Quantification of the percentage of cells with more than 10 53BP1 foci per nucleus in (C). At least 50 cells were included for each group. Error bars represent the s.d. *p<0.05, **p<0.01, ***p<0.001, n.s., not significant, t-test.
Figure 4—figure supplement 2
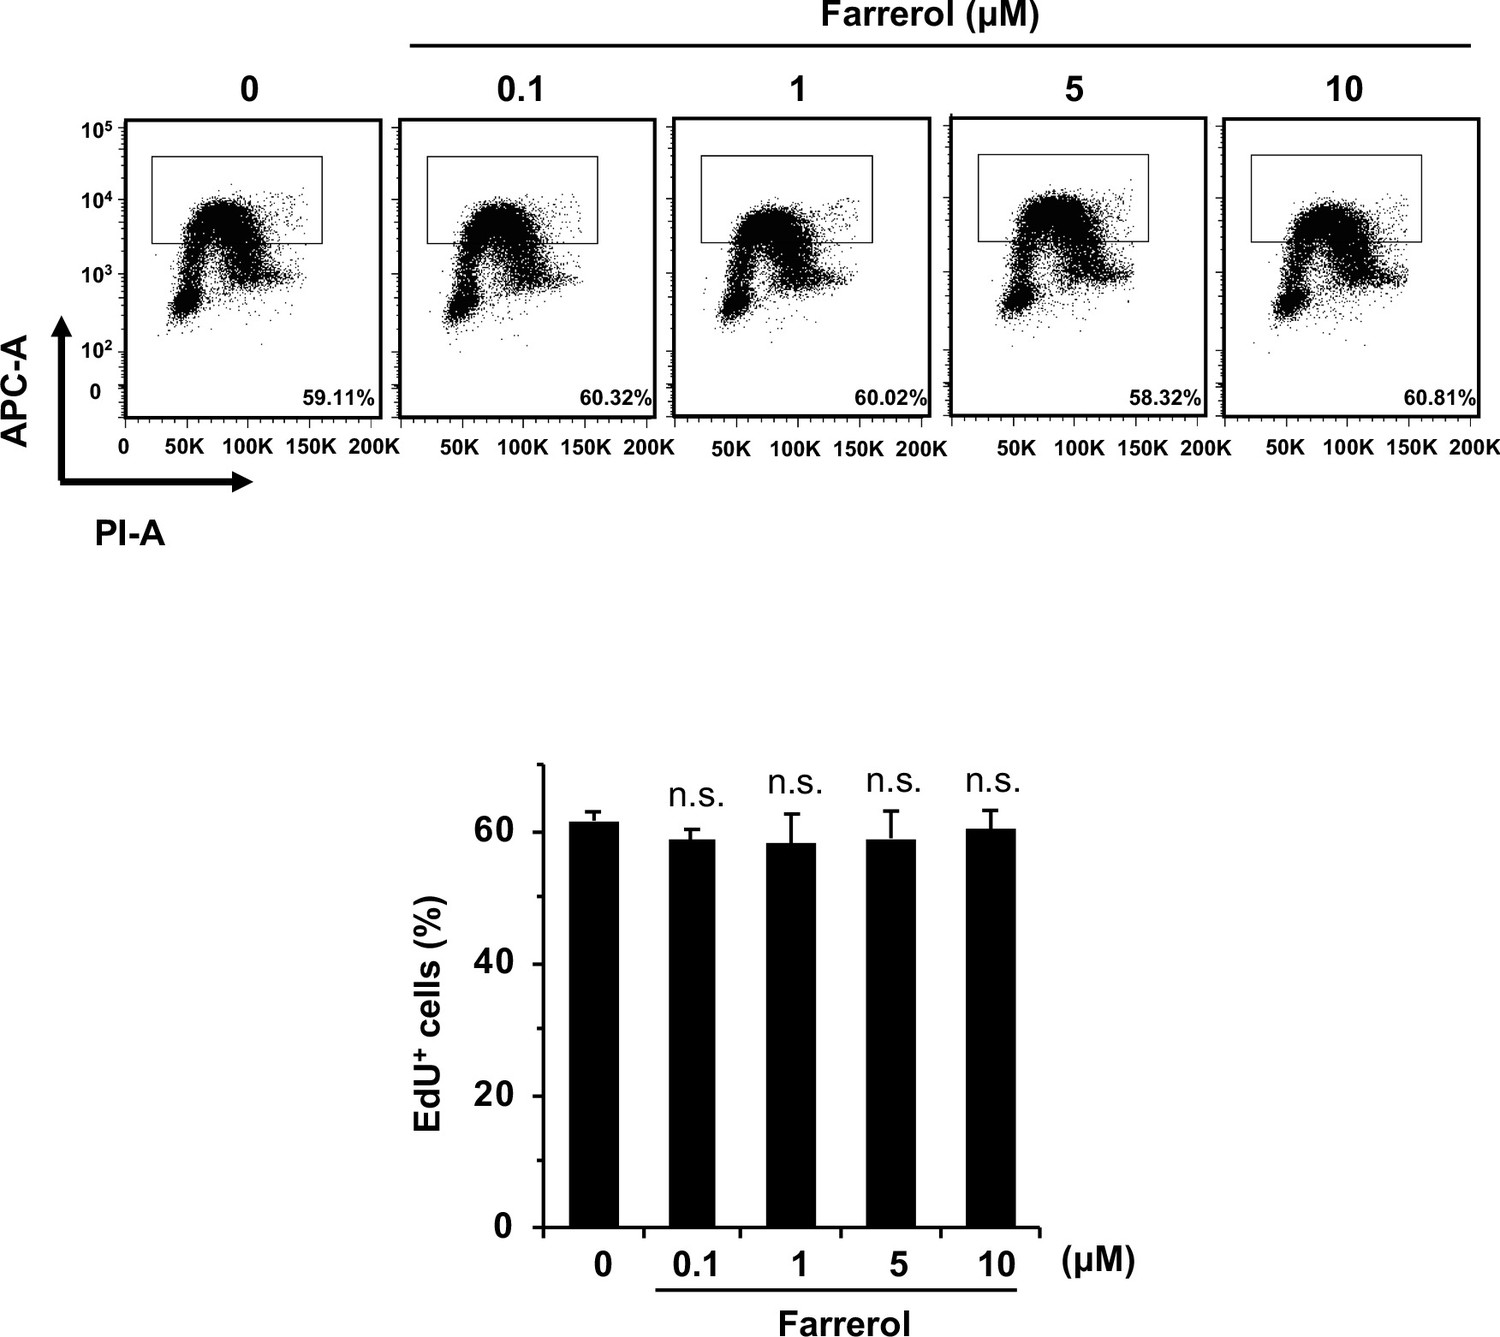
The effects of small molecule treatment on cell proliferation.
Proliferation of mouse ESC E14 treated with indicated doses of molecules was analyzed using EdU incorporation assay. Error bars represent the s.d., n.s., not significant, t-test.
Figure 5 with 1 supplement

Farrerol promotes gene targeting in mouse embryos.
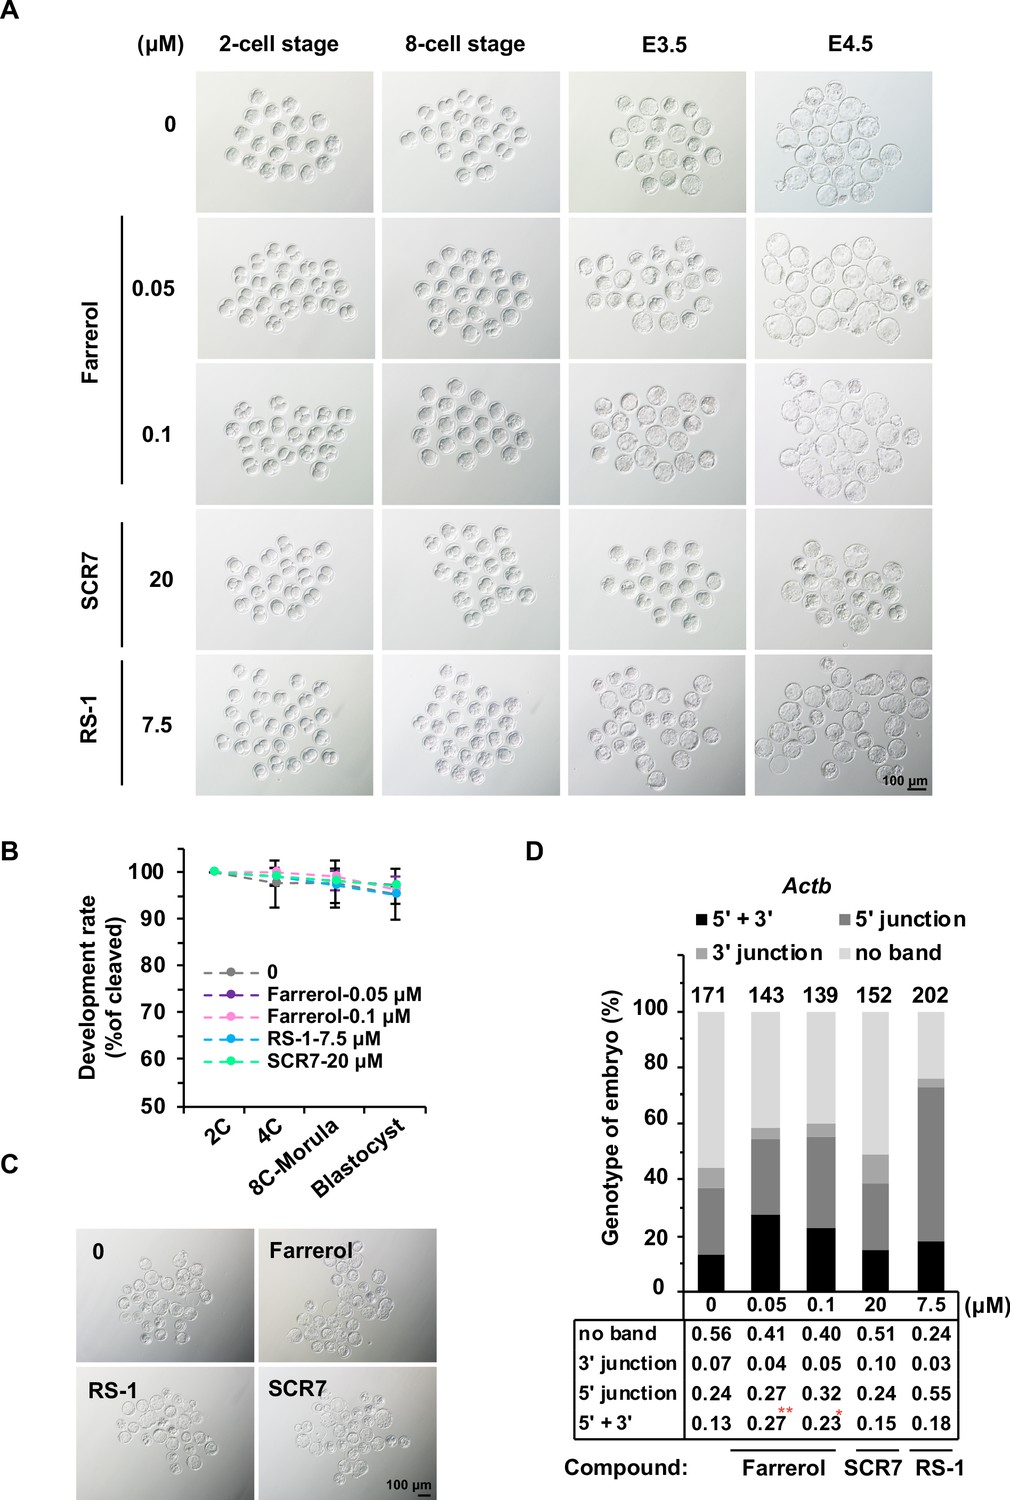
(A) In vitro development potential of mouse embryos treated with indicated doses of compounds during the whole embryonic stages. (B) The development rate of hatching blastocysts at E4.5 treated with indicated doses of compounds. The data is related to (A). (C) Effect of compounds treatment for 24 hr on in vitro development potential of mouse embryos upon DSBs were induced by Cas9 mRNA and sgRNA targeting the Cdx2 locus. (D) Schematic diagram of the gene targeting strategy at the Actb locus in mouse embryos. A donor vector containing a promoter-less p2A-mCherry was designed for targeting the Actb locus. The underlined trinucleotide represents the PAM, and the sgRNA targeting site is labeled in red. The length of the left and right homologous arm is 801 bp and 800 bp, respectively. (E) Diagram of the methods for gene targeting efficiency analysis in mouse blastocysts. (F) Representative fluorescence images of gene-edited mouse embryos at the Actb locus at the blastocyst stage. (G–H) Effect of indicated small compounds on gene knock-in frequencies at the Actb locus. Knock-in frequency was indicated by the percentage of mCherry+ blastocysts in (G), and was confirmed by PCR genotyping analysis using primers amplifying the flanks of the Actb site in (H). Number above each bar, total blastocysts analyzed. Error bars in (A), (B) and (C) represent the s.d. and t-test was used for statistical analysis. For (G) and (H), χ2-test was used for statistical analysis. *p<0.05, **p<0.01, n.s., not significant.
-
Figure 5—source data 1
Summary of knock-in efficiency in blastocysts.
- https://cdn.elifesciences.org/articles/56008/elife-56008-fig5-data1-v2.xlsx
Figure 5—figure supplement 1
The effects of small molecule treatment on embryo development.
(A) Representative images of in vitro cultured mouse embryos treated with indicated compounds until E4.5. (B) In vitro development potential of mouse embryos with short-period treatment of indicated compounds till late 2 cell stage. (C) Representative images of mouse embryos with short-period treatment of indicated compounds upon DSBs were induced with Cas9 mRNA and sgRNA targeting the Cdx2 locus. (D) Analysis of knock-in frequencies at the Actb locus in mouse blastocysts treated with indicated doses of compounds by genotyping analysis. The blastocysts were lysed for genomic DNA extraction, then the 5’ and 3’ junction at the Actb locus were amplified for Sanger sequencing. Error bars in (B) represent the s.d., t-test. For (D), χ2-test was used for statistical analysis. *p<0.05, **p<0.01.
Figure 6 with 2 supplements
Farrerol promotes the generation of gene-targeted mice with germline transmission.
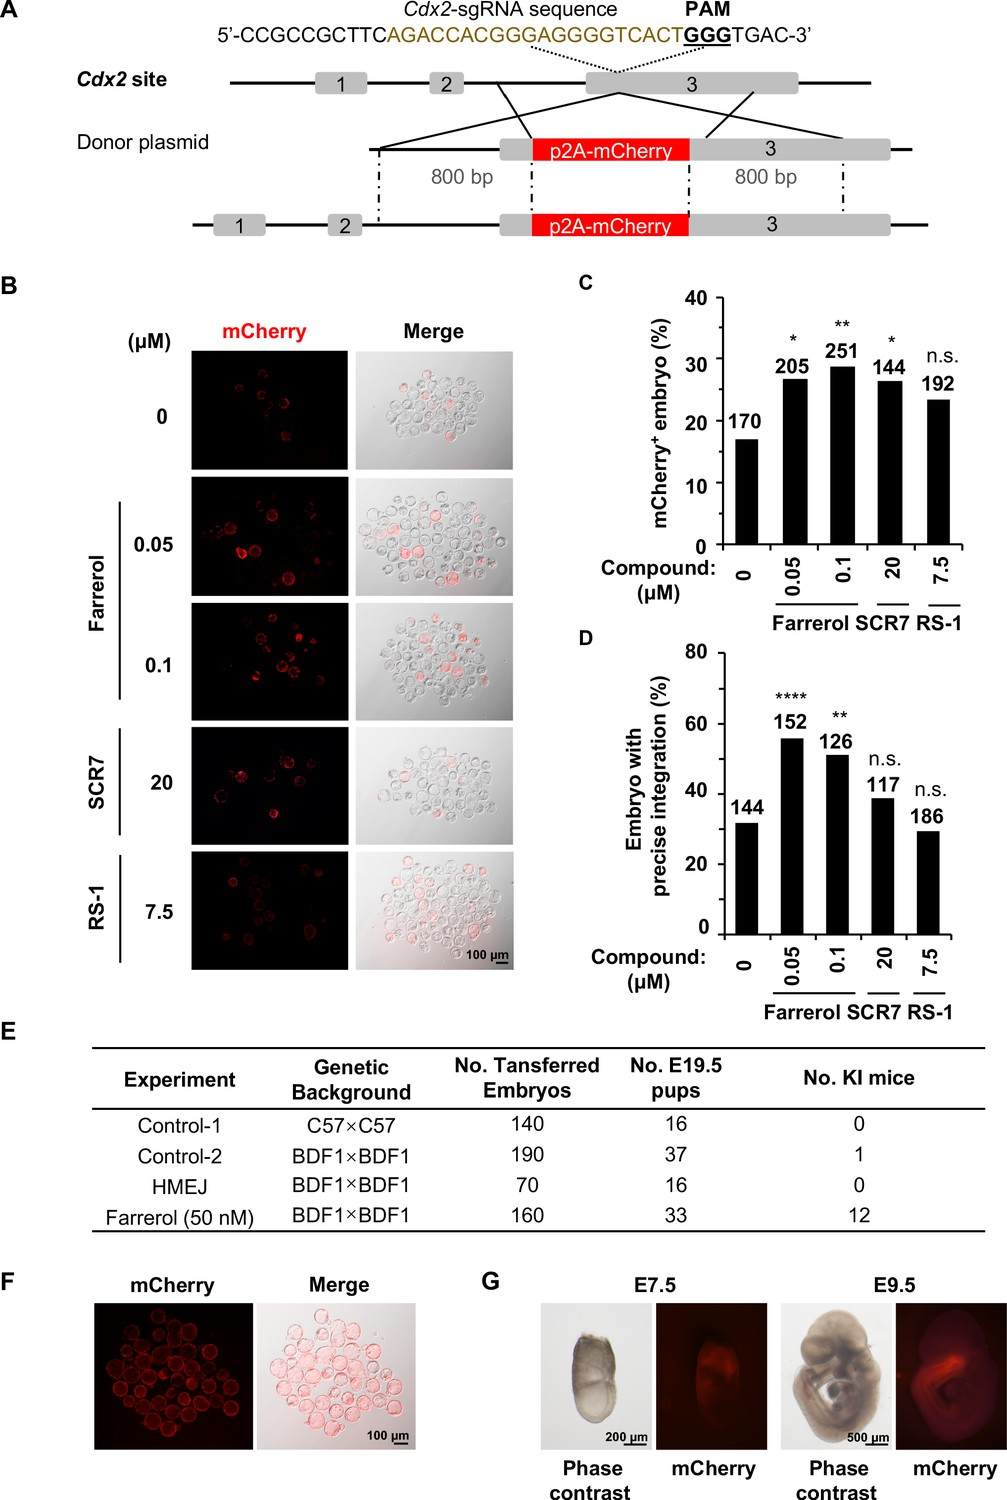
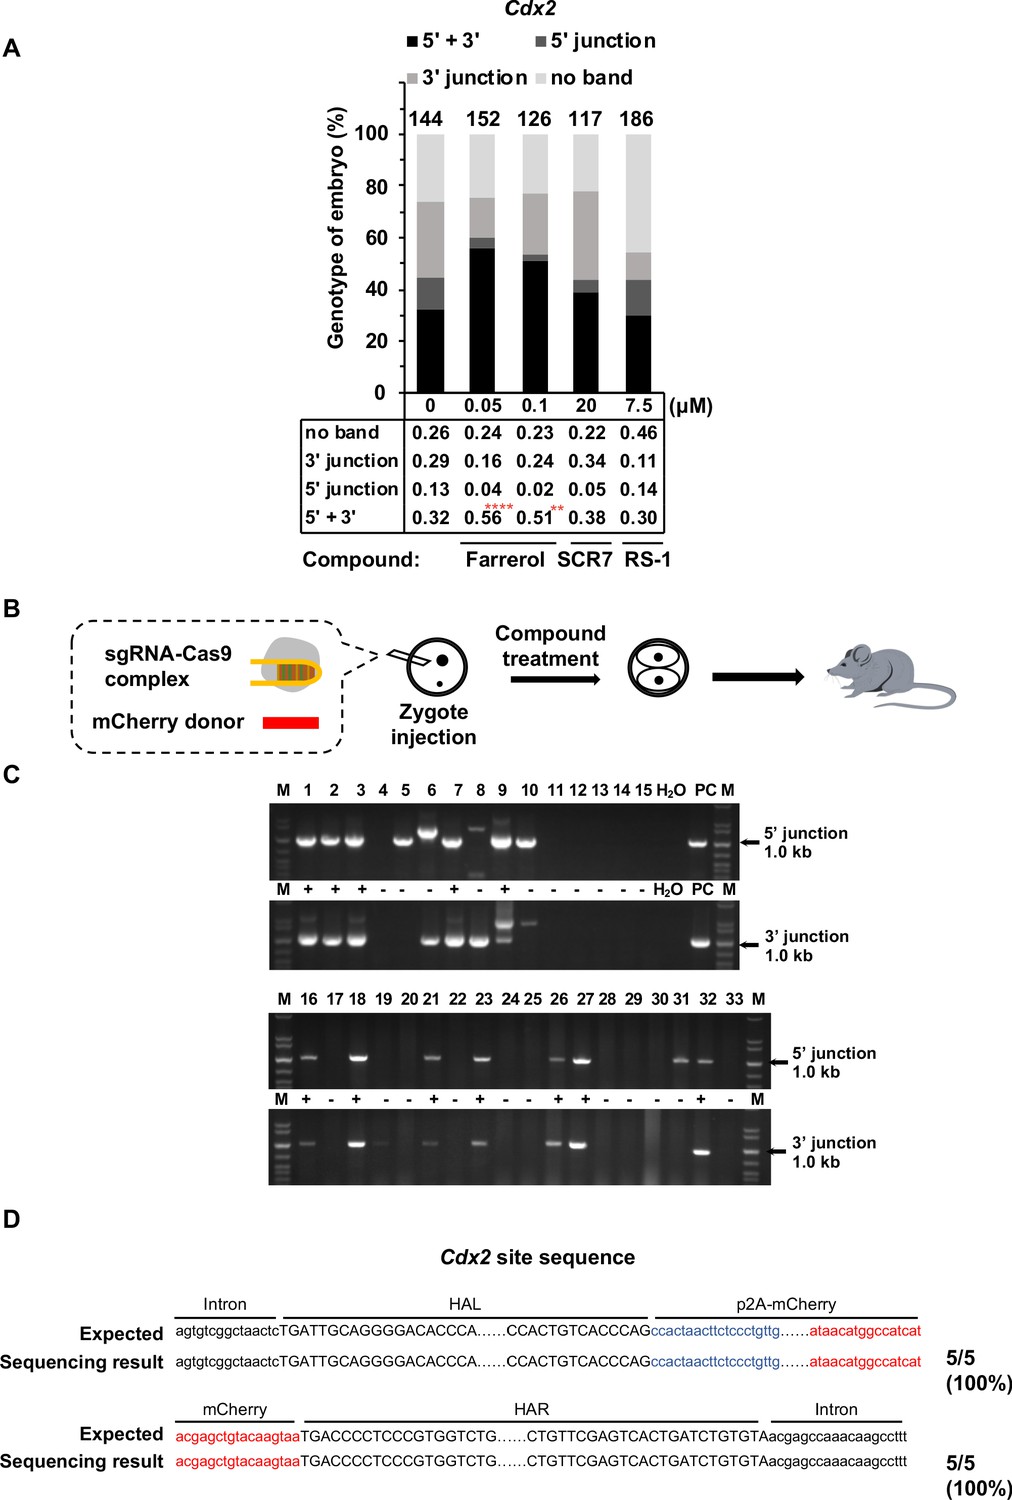
(A) Schematic diagram of the gene targeting strategy at the Cdx2 locus in mouse embryos. A donor vector containing a promoter-less p2A-mCherry was designed for targeting the Cdx2 locus. The underlined trinucleotide represents the PAM, and the sgRNA targeting site is labeled in brown. The length of both the left and right homologous arm are 800 bp. (B) Representative fluorescence images of gene-edited mouse embryos at the Cdx2 locus at the blastocyst stage. (C–D) Effect of different small molecules treatment on gene knock-in frequency at the Cdx2 locus. Knock-in frequency was indicated by the percentage of mCherry+ blastocysts in (C), and was confirmed by PCR genotyping analysis using primers amplifying the flanks of the Cdx2 site in (D). Number above each bar, total blastocysts analyzed. (E) Effect of different knock-in strategies on generation of gene-targeting mice. The microinjected 2 cell stage embryos with or without farrerol treatment was transplanted into the pseudo-pregnant mice. The HMEJ mediated knock-in assay was applied as a control. The founder mice were genotyped for gene-targeting frequency analysis. The germline transmission abilities of founder mice were also validated. (F) Representative fluorescence images of blastocysts from homozygous Cdx2-mCherry mice. (G) Representative fluorescence images of Cdx2 mCherry signals in embryos at the stage of E7.5 and E9.5 after homozygous Cdx2-mCherry mice mating with wild-type mice. *p<0.05, **p<0.01, ****p<0.0001, n.s., not significant, χ2-test.
-
Figure 6—source data 1
Generation of gene-targeted mice with germline transmission.
- https://cdn.elifesciences.org/articles/56008/elife-56008-fig6-data1-v2.xlsx
Figure 6—figure supplement 1
Farrerol promotes precise integration in blastocysts and founder mice.
(A) Analysis of knock-in frequencies at the Cdx2 locus in mouse blastocysts treated with indicated doses of molecules by genotyping analysis. The blastocysts were lysed for genomic DNA extraction, then the 5’ and 3’ junction at the Cdx2 locus were amplified for Sanger sequencing. (B) Experimental scheme for targeted Cdx2-p2A-mCherry knock-in founder mouse. (C) Genotyping analysis of gene-targeting mice. Genomic DNA were prepared from mouse tail tips, then the 5’ and 3’ junction at the Cdx2 locus were amplified. H2O is set as negative control. For positive control (PC), the gDNA of mouse blastocysts which has been successfully knocked-in at Cdx2 site using the same sgRNA and donor, was used as the template for PCR. (D) Precise in-frame integration was further confirmed by Sanger sequencing in the five gene-targeting mice in farrerol treatment group. HAL stands for the left homologous arm and HAR stands for the right homologous arm. **p<0.01, ****p<0.0001, χ2-test.
Figure 6—figure supplement 2
The effects of small molecule intra-cytoplasmic injection on knock-in efficiency.
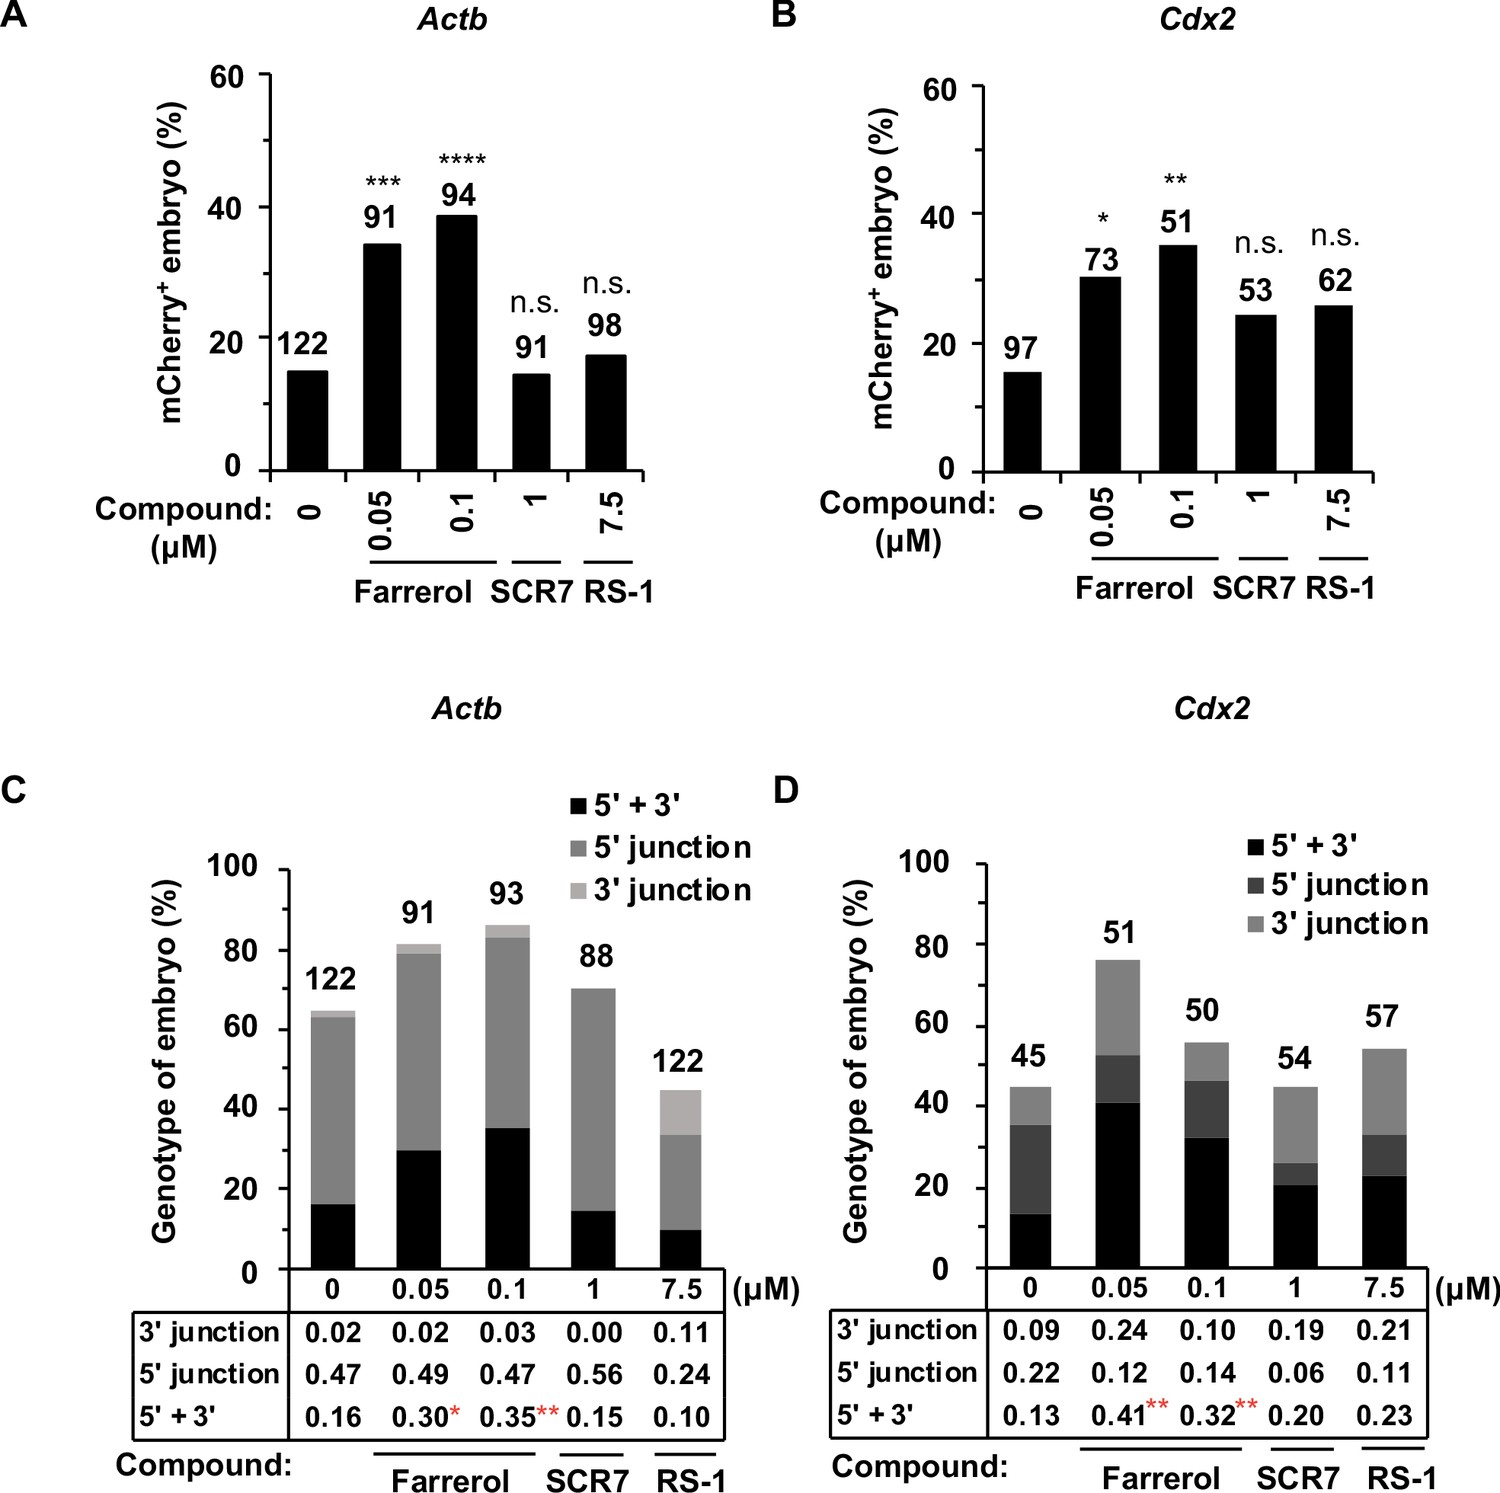
(A–D) The knock-in efficiencies at the Actb and Cdx2 locus were analyzed in mouse blastocysts. Knock-in frequency was indicated by the percentage of mCherry+ cells at the Actb locus in (A) and at the Cdx2 locus in (B), and was indicated by PCR genotyping analysis using primers amplifying the flanks of Actb site in (C) and Cdx2 site in (D). Number above each bar, total blastocysts analyzed. *p<0.05, **p<0.01, ***p<0.001, ****p<0.0001, n.s., not significant, χ2-test.
Tables
Table 1
PCR primer sequences.
| Target name | Primer name | Sequence (5'>3') | Description | Reference |
|---|---|---|---|---|
| AAVS1 | HR-AAVS1-F | gccgtctctctcctgagt | Primer 1# | PMID:23287722 |
| AAVS1 | HR-Puro-R | gtgggcttgtactcggtcat | ||
| AAVS1 | GFP-F | acgtaaacggccacaagttc | Primer 2# | This paper |
| AAVS1 | GFP-R | gaactccagcaggaccatgt | ||
| Actb | mActb-HR-F | ccatctacgagggctatgct | 5' junction | This paper |
| Actb | mActb-HR-R | gtgggcttgtactcggtcat | ||
| Actb | 3' Actb-puro-F | gtgtctctcactcggaaggac | 3' junction | |
| Actb | 3'inner-R | gcctaggtttctggaggagt | ||
| Actb | 5'outer-F | ccctgagtgtttcttgtggc | 5' junction | PMID:28524166 |
| Actb | 5'outer-R | tggagccgtacatgaactga | ||
| Actb | 5'inner-F | ccatctacgagggctatgct | ||
| Actb | 5'inner-R | tgaagcgcatgaactccttg | ||
| Actb | 3'outer-F | gccccgtaatgcagaagaag | 3' junction | |
| Actb | 3'outer-R | aggtagtgttagtgcaggcc | ||
| Actb | 3'inner-F | ctacgacgctgaggtcaaga | ||
| Actb | 3'inner-R | gcctaggtttctggaggagt | ||
| Cdx2 | 5'outer-F | acttggacagagaaagagcgatt | 5' junction | PMID:28524166 |
| Cdx2 | 5'outer-R | tccatgtgcaccttgaagc | ||
| Cdx2 | 5'inner-F | aacaaaggtccagtctacgcat | ||
| Cdx2 | 5'inner-R | ggccatgttatcctcctcgc | ||
| Cdx2 | 3'outer-F | gacggccccgtaatgcagaa | 3' junction | |
| Cdx2 | 3'outer-R | tagcttgcaaccagagaagatgt | ||
| Cdx2 | 3'inner-F | ctacgacgctgaggtcaaga | ||
| Cdx2 | 3'inner-R | cgacttcccttcaccatacaac |
-
Table 1—source data 1
PCR primer sequences.
- https://cdn.elifesciences.org/articles/56008/elife-56008-table1-data1-v2.xlsx
Key resources table
| Reagent type (species) or resource | Designation | Source or reference | Identifiers | Additional information |
|---|---|---|---|---|
| Genetic reagent (M. musculus) | C57BL/6n | Beijing Vital River Laboratory | Stock No.: 213 | |
| Genetic reagent (M. musculus) | ICR | Beijing Vital River Laboratory | Stock No.: 201 | |
| Genetic reagent (M. musculus) | BDF1 | This paper | / | The BDF1 hybrid mice were obtained from mating female C57BL/6n mice with male DBA/2 mice. |
| Genetic reagent (M. musculus) | DBA/2 | Beijing Vital River Laboratory | Stock No.: 214 | |
| Genetic reagent (M. musculus) | PWK/PhJ | Jackson Laboratory | Stock No.: 003715 | |
| Gene (Homo sapiens) | AAVS1 | GenBank | GeneID: 54776 | |
| Gene (M. musculus) | Actb | GenBank | GeneID: 11461 | |
| Gene (M. musculus) | Sox2 | GenBank | GeneID: 20674 | |
| Gene (M. musculus) | Rosa26 | GenBank | GeneID: 14910 | |
| Gene (M. musculus) | Cdx2 | GenBank | GeneID: 12591 | |
| Strain, strain background (Escherichia coli) | Trans109 | TransGen Biotech | CD301 | Competent cells |
| Cell line (Homo sapiens) | HCA2-hTERT | Gorbunova et al., 2002 (doi: 10.1074/jbc.M202671200) | Human fibroblast | |
| Cell line(Homo sapiens) | HEK 293FT | ATCC | RRID:CVCL_6911 | |
| Cell line (M. musculus) | E14 | ATCC | RRID:CVCL_C320 | Mouse ES cell line |
| Cell line (M. musculus) | Oct4-ΔPE-GFP transgenic C57BL/6 × PWK ESC | This paper | Mouse ES cell line | |
| Antibody | Anti-RPA2 (Rabbit polyclonal) | Abclonal | A2189 RRID:AB_2764207 | WB (1:1000) |
| Antibody | Anti-NBS1 (Rabbit) | Cell Signaling Technology | 3002 RRID:AB_331499 | WB (1:1000) |
| Antibody | Anti-RAD50 (Rabbit polyclonal) | Abclonal | A3078 RRID:AB_2764881 | WB (1:1000) |
| Antibody | Anti-RAD51 (Mouse polyclonal) | Abcam | ab88572 RRID:AB_2042762 | IF (1:500), WB (1:1000) |
| Antibody | Anti-MRE11 (Rabbit polyclonal) | Abclonal | A2559 RRID:AB_2764447 | WB (1:1000) |
| Antibody | Anti-53BP1 (Rabbit polyclonal) | Cell Signaling Technology | 4937S RRID:AB_10694558 | IF (1:100), WB (1:1000) |
| Antibody | Anti-CtIP (Rabbit polyclonal) | Abcam | ab70163 RRID:AB_1209429 | WB (1:1000) |
| Antibody | Anti-BRCA1 (Rabbit polyclonal) | Abclonal | A0212 RRID:AB_2757026 | WB (1:1000) |
| Antibody | Anti-EXO1 (Rabbit polyclonal) | Abclonal | A6810 RRID:AB_2767391 | WB (1:1000) |
| Antibody | Anti-XRCC2 (Rabbit polyclonal) | Abclonal | A1800 RRID:AB_2763839 | WB (1:1000) |
| Antibody | Anti- TUBULIN (Rabbit polyclonal) | Abmart | M20005 | WB (1:2000) |
| Antibody | Anti-gamma H2AX (Rabbit polyclonal) | Cell Signaling Technology | 9718S RRID:AB_2118009 | IF (1:500) |
| Recombinant DNA reagent | sgRNA-Cas9 plasmid | PMID:28524166 | Kind gift from Hui Yang lab | |
| Commercial assay or kit | Click-iT EdU Assay Kit | Invitrogen | C10634 | |
| Commercial assay or kit | Comet assay | Trevigen | Cat. # 4250–050 K | |
| Chemical compound, drug | Farrerol | Sigma Aldrich | SML1389 | 0.05, 0.1, 1, 5, 10 μM |
| Chemical compound, drug | RS-1 | ApexBio | C3357 | 1, 7.5, 10 μM |
| Chemical compound, drug | SCR7 | Selleck | S7742 | 0.1, 1, 20 μM |
| Software, algorithm | ImageJ software | ImageJ (http://imagej.nih.gov/ij/) | RRID:SCR_003070 | |
| Software, algorithm | GraphPad Prism software | GraphPad Prism (http://graphpad.com) | RRID:SCR_015807 | Version 6.0 |
| Software, algorithm | CASPLab software | CASPLab http://casp.sourceforge.net | RRID:SCR_007249 | |
| Other | DAPI stain | Abcam | ab104939 |
Additional files
Download links
A two-part list of links to download the article, or parts of the article, in various formats.
Downloads (link to download the article as PDF)
Open citations (links to open the citations from this article in various online reference manager services)
Cite this article (links to download the citations from this article in formats compatible with various reference manager tools)
A high-throughput small molecule screen identifies farrerol as a potentiator of CRISPR/Cas9-mediated genome editing
eLife 9:e56008.
https://doi.org/10.7554/eLife.56008


