PrkA controls peptidoglycan biosynthesis through the essential phosphorylation of ReoM
- FG11 - Division of Enteropathogenic bacteria and Legionella, Robert Koch Institute, Germany
- Institute for Cell and Molecular Biosciences, Medical School, University of Newcastle, United Kingdom
- Department of General Microbiology, GZMB, Georg-August-Universität Göttingen, Germany
- Newcastle Drug Discovery, Northern Institute for Cancer Research, United Kingdom
- ZBS 4 - Advanced Light and Electron Microscopy, Robert Koch Institute, Germany
Figures
Figure 1 with 2 supplements
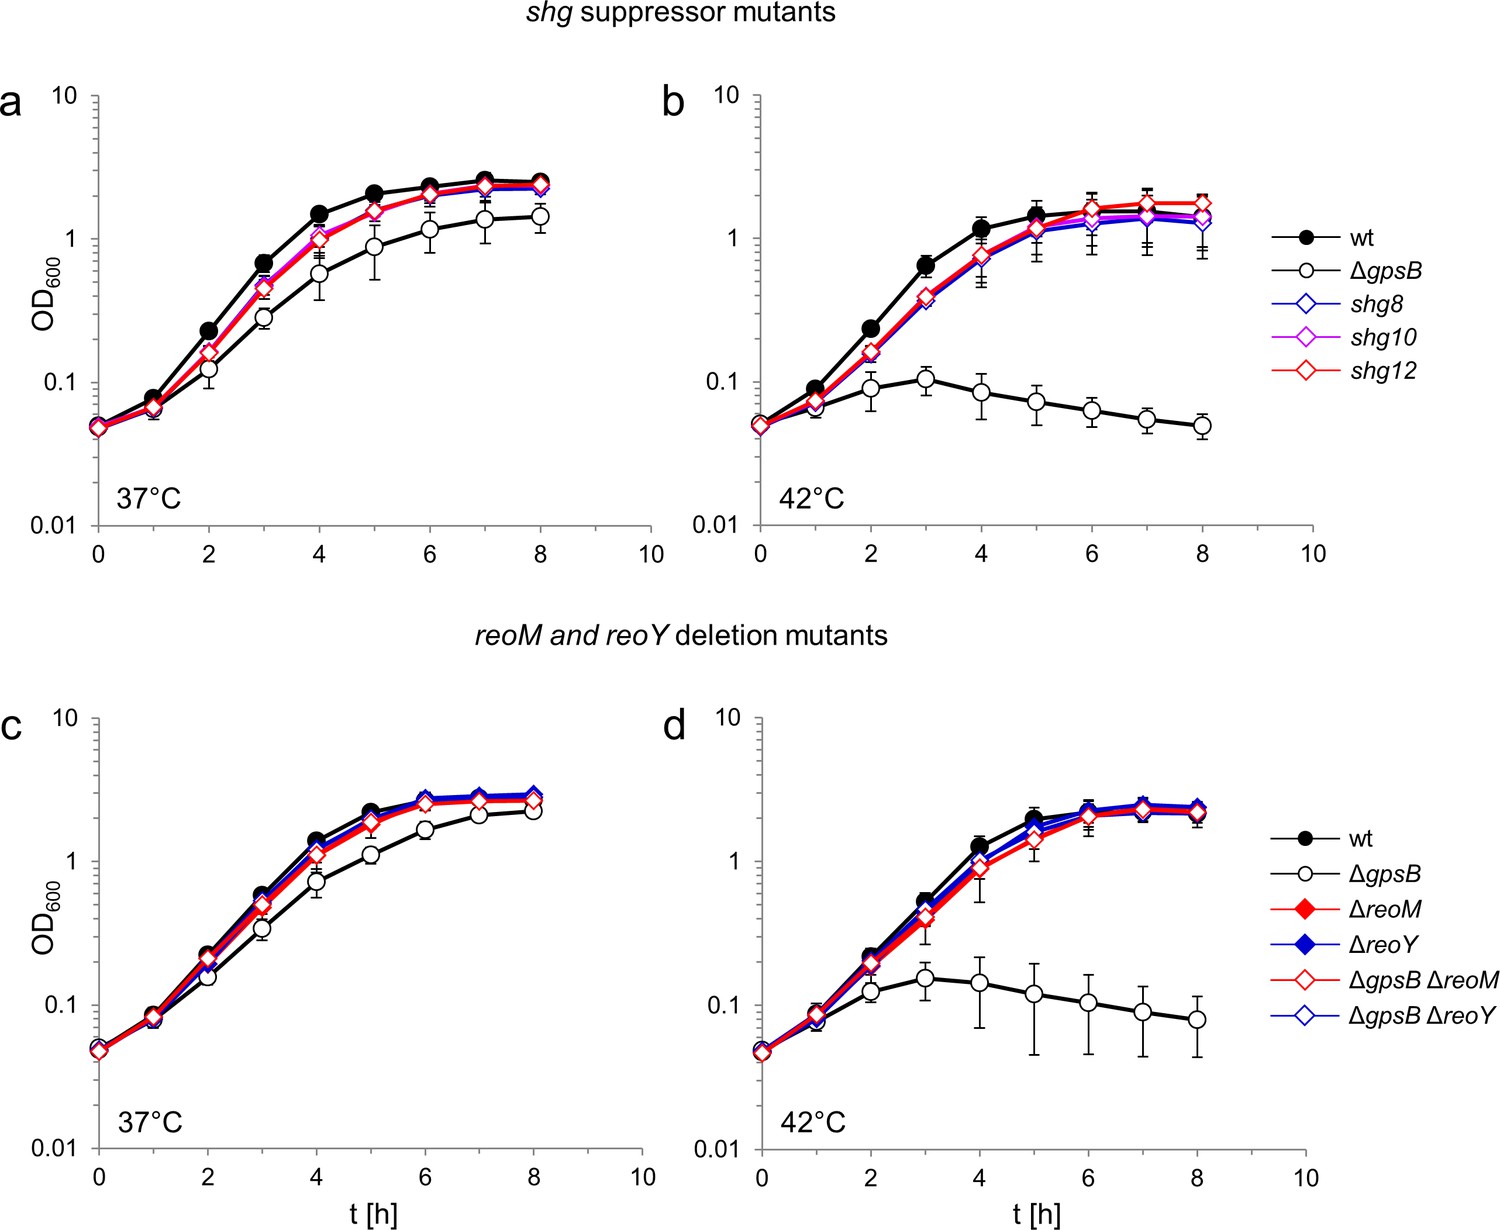
Suppression of the growth defects of a L. monocytogenes ΔgpsB mutant by reoM and reoY mutations.
(A–B) Effect of suppressor mutations on growth of the ΔgpsB mutant. Growth of L. monocytogenes strains EGD-e (wt), LMJR19 (ΔgpsB), shg8 (ΔgpsB reoY H87Y), shg10 (ΔgpsB reoY TAA74) and shg12 (ΔgpsB reoM RBS mutation) in BHI broth at 37°C (A) and 42°C (B). (C–D) Effect of ΔreoM and ΔreoY deletions on growth of L. monocytogenes. Growth of L. monocytogenes strains EGD-e (wt), LMJR19 (ΔgpsB), LMSW30 (ΔreoM), LMSW32 (ΔreoY), LMJR137 (ΔgpsB ΔreoM) and LMJR120 (ΔgpsB ΔreoY) in BHI broth was recorded at 37°C (C) and 42°C (D). All growth experiments were performed three times and average values and standard deviations are shown.
Figure 1—figure supplement 1

Overexpression of reoM but not reoY affects growth of the L. monocytogenes ΔgpsB mutant.
(A) Growth of L. monocytogenes strains EGD-e (wt), LMJR19 (ΔgpsB) and LMJR106 (ΔgpsB+reoY) in BHI broth containing 1 mM IPTG at 37°C. (B) Growth of strains EGD-e (wt), LMJR19 (ΔgpsB), LMJR102 (wt+reoM) and LMJR96 (ΔgpsB+reoM) in BHI broth containing 1 mM IPTG at 37°C. The experiments were performed twice and one representative result is shown.
Figure 1—figure supplement 2
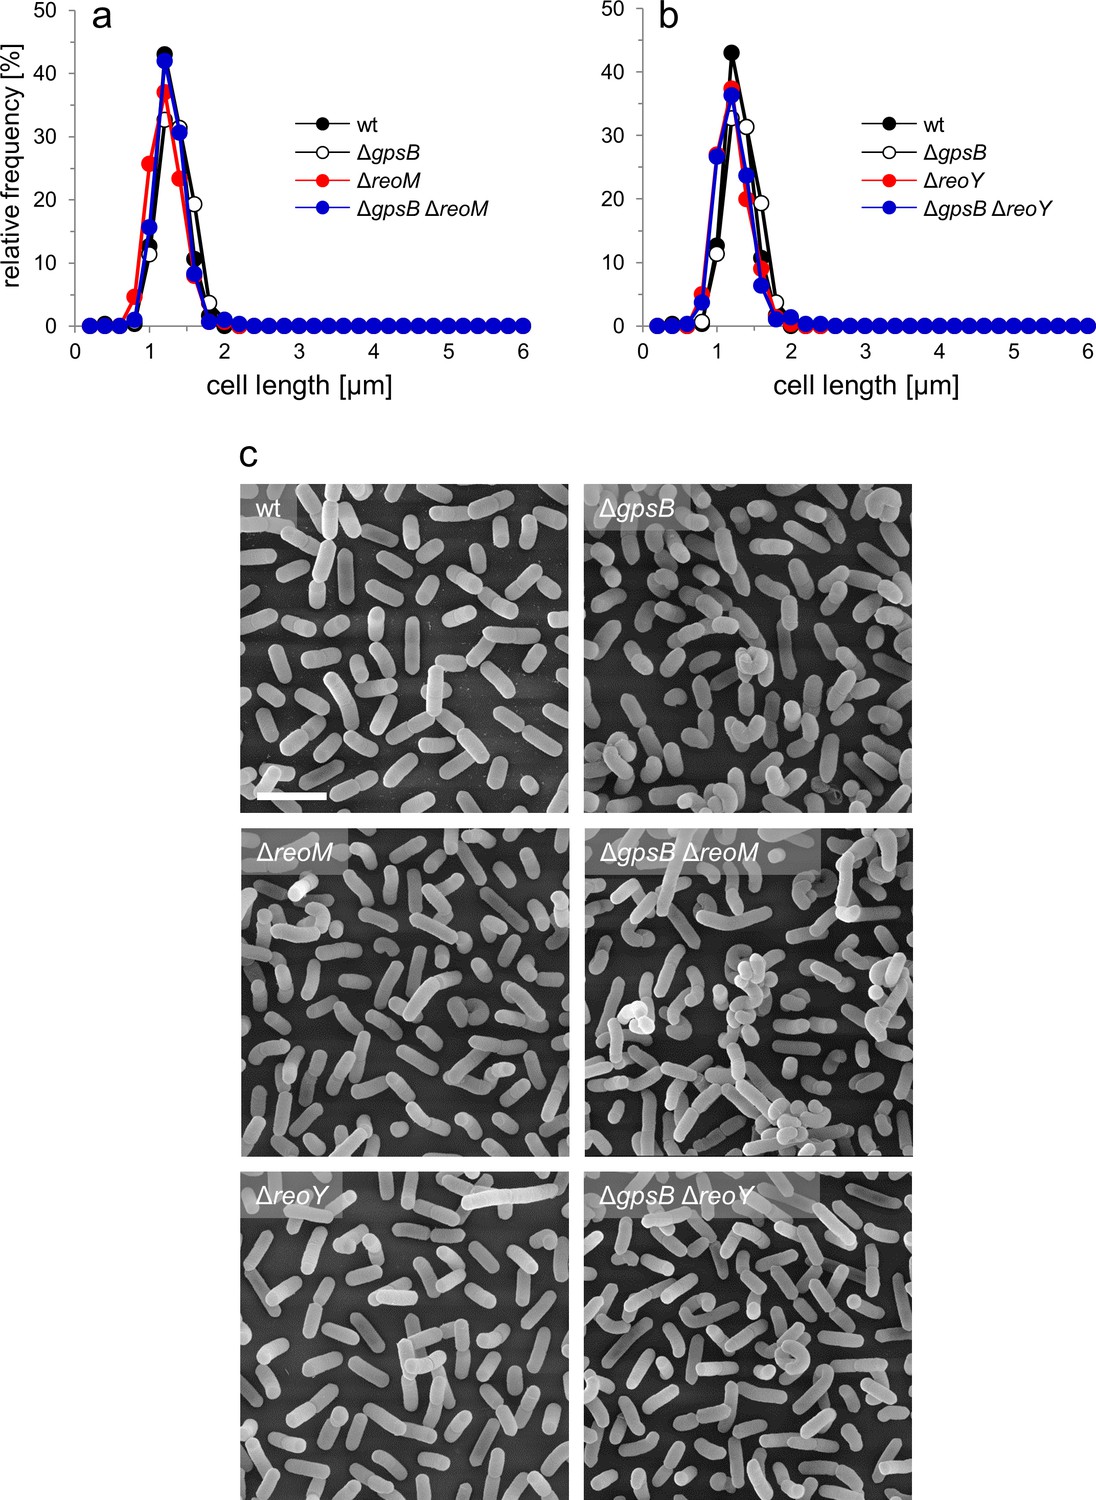
Effect of reoM and reoY deletions on cell morphology.
Strains EGD-e (wt), LMJR19 (ΔgpsB), LMSW30 (ΔreoM), LMSW32 (ΔreoY), LMJR137 (ΔgpsB ΔreoM), and LMJR120 (ΔgpsB ΔreoY) were grown in BHI broth at 37°C to mid-logarithmic growth phase and cell lengths were measured after nile red staining and fluorescence microscopy. Diagrams show the effect of reoM (A) and reoY (B) deletions on cell lengths of wild type and ΔgpsB mutant cells as cell length frequency distributions determined on 300 cells per strain from a single culture. Results of one out of three experiments are shown. (C) Scanning electron microscopy of the same strains as in panel A and B. Strains were grown to mid-logarithmic growth phase in BHI at 37°C and subjected to chemical fixation and subsequent electron microscopy as described in the experimental procedures section. Scale bar: 2 µm.
Figure 2 with 3 supplements
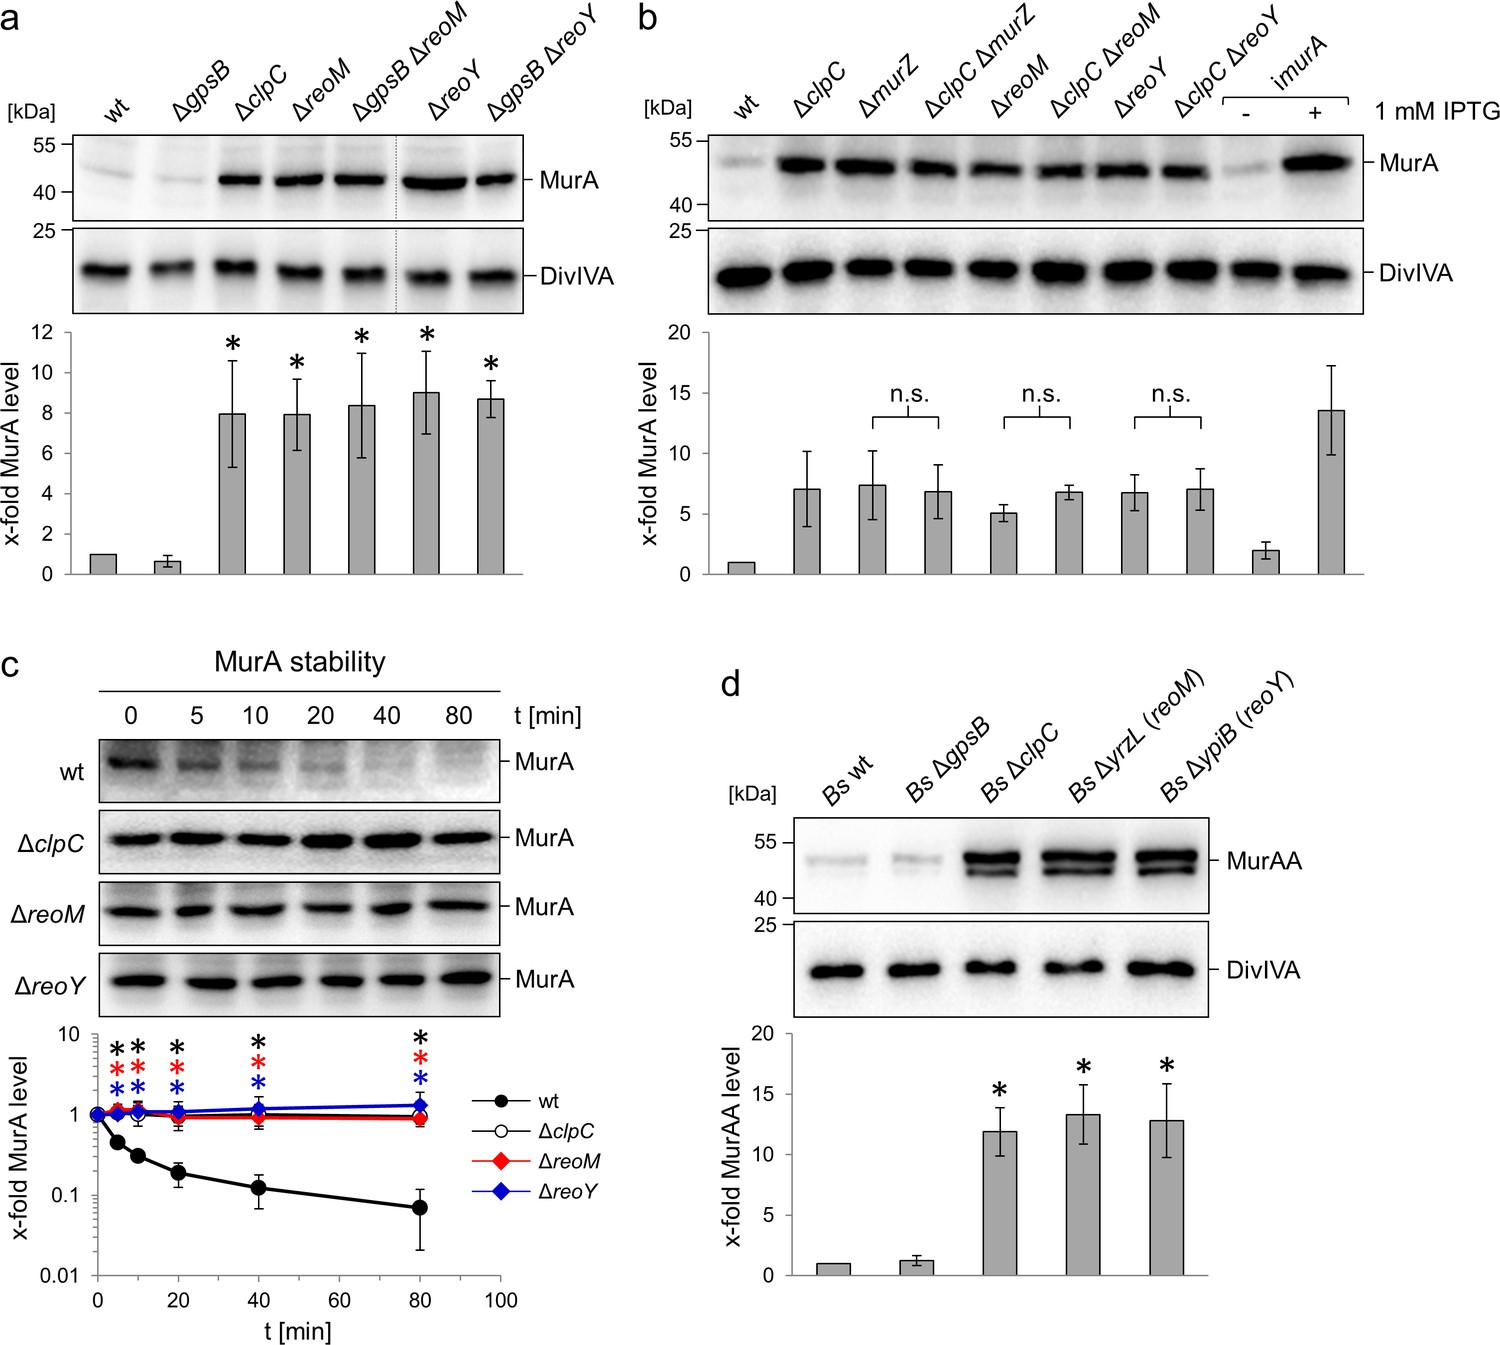
Effect of the reoM, reoY and clpC genes on levels of MurA in L. monocytogenes and MurAA in B. subtilis.
(A) Effect of reoM and reoY deletions (single or when combined with gpsB deletion) on MurA (above) and DivIVA levels (middle) in L. monocytogenes strains EGD-e (wt), LMJR19 (ΔgpsB), LMSW30 (ΔreoM), LMSW32 (ΔreoY), LMJR137 (ΔgpsB ΔreoM) and LMJR120 (ΔgpsB ΔreoY) and quantification of MurA levels (below). Strain LMJR138 (ΔclpC) was included for comparison. Non-relevant lanes were excised from the blots (dotted lines). Average values ± standard deviations were shown (n = 3). Statistically significant differences compared to wild type are marked by asterisks (p<0.05, t-test). (B) Effect of reoM, reoY and murZ deletions when combined with clpC deletion on MurA (above) and DivIVA levels (middle) in L. monocytogenes strains EGD-e (wt), LMJR138 (ΔclpC), LMJR104 (∆murZ), LMJR171 (ΔclpC ΔmurZ), LMSW30 (ΔreoM), LMSW50 (ΔclpC ΔreoM), LMSW32 (ΔreoY) and LMSW51 (ΔclpC ΔreoY) and quantification of MurA levels (below). Strain LMJR123 (imurA, i - is used to denote IPTG-dependent alleles) grown in the presence or absence of IPTG was included for comparison. Average values and standard deviations were shown (n = 3) and n. s. means not significant (p<0.05, t-test). (C) Western blots following MurA degradation in vivo. L. monocytogenes strains EGD-e (wt), LMJR138 (ΔclpC), LMSW30 (ΔreoM) and LMSW32 (ΔreoY) were grown to an OD600 of 1.0 and 100 µg/ml chloramphenicol was added. Samples were taken before chloramphenicol addition and after several time intervals to analyse MurA levels. MurA signals were quantified by densitometry and average values and standard deviations are shown (n = 3). Statistically significant differences are marked with asterisks (p<0.05, t-test). (D) Effect of the reoM and reoY homologues yrzL and ypiB, respectively, on MurAA (above) and DivIVA levels (middle) of B. subtilis and quantification of MurAA levels (below). Strains BKE00860 (ΔclpC), BKE22180 (ΔgpsB), BKE22580 (ΔypiB/reoY) and BKE27400 (ΔyrzL/reoM) were grown to mid-logarithmic growth phase before total cellular proteins were isolated. B. subtilis 168 (wt) was included as control. That MurAA is detected in two isoforms had been observed earlier but the reasons for this are not known (Kock et al., 2004). Average values and standard deviations were shown (n = 3). Asterisks indicate statistically significant differences compared to wild type (p<0.05, t-test).
Figure 2—figure supplement 1
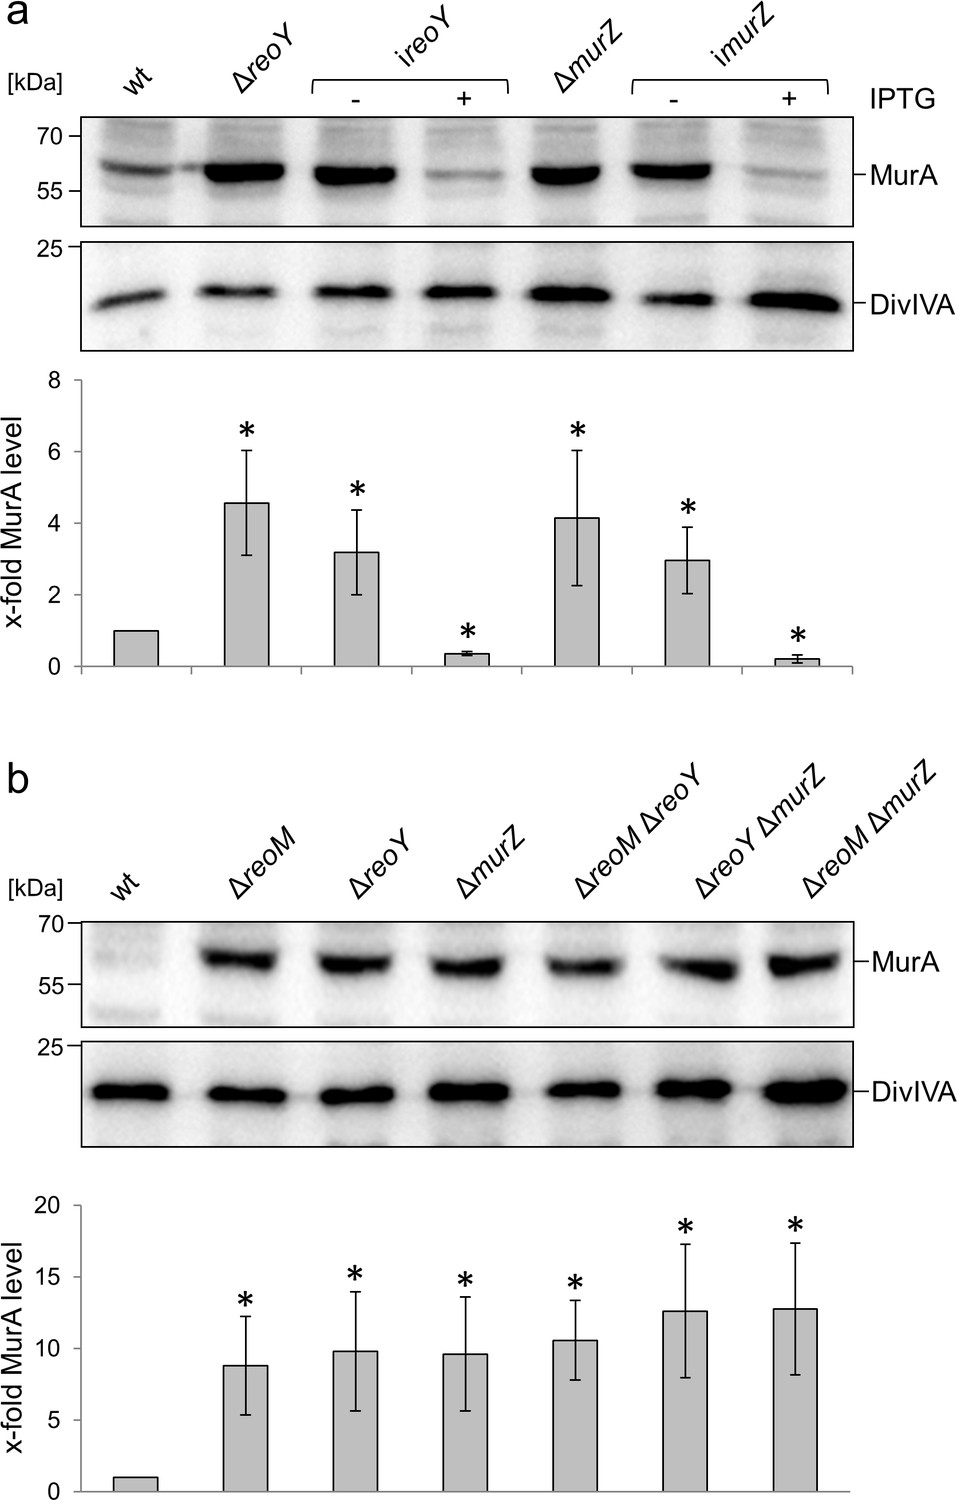
Complementation and epistasis experiments.
(A) Complementation of ΔreoY and ΔmurZ mutants. Western blot showing MurA amounts in L. monocytogenes strains EGD-e (wt), LMSW32 (ΔreoY), LMSW138 (ireoY), LMJR104 (ΔmurZ) and LMSW139 (imurZ, top). A parallel western blot using an α-DivIVA antiserum was used as loading control (middle panel). Quantification of MurA signals by densitometry (bottom). (B) ReoM, ReoY and MurZ operate in the same pathway. Western blot showing MurA amounts in L. monocytogenes strains EGD-e (wt), LMSW30 (ΔreoM), LMSW32 (ΔreoY), LMJR104 (ΔmurZ), LMSW117 (ΔreoM ΔreoY), LMSW118 (ΔreoY ΔmurZ) and LMSW119 (ΔreoM ΔmurZ, top). A parallel western blot using an α-DivIVA antiserum was used as loading control (middle panel). Quantification of MurA signals by densitometry (bottom). Strains were grown in BHI (±1 mM IPTG) at 37°C to mid-logarithmic growth phase for isolation of cellular proteins. Average values and standard deviations were calculated from three independent experiments. Asterisks indicate statistically significant differences compared to wild type (p<0.05, t-test).
Figure 2—figure supplement 2

DivIVA stability in L. monocytogenes ΔclpC, ΔreoM and ΔreoY mutants.
Western blots following DivIVA levels after chloramphenicol treatment. L. monocytogenes strains EGD-e (wt), LMJR138 (ΔclpC), LMSW30 (ΔreoM) and LMSW32 (ΔreoY) were grown to an OD600 of 1.0 and 100 µg/ml chloramphenicol was added to block protein biosynthesis. Samples were taken before chloramphenicol addition and after several time intervals to analyse DivIVA levels. DivIVA signals were quantified by densitometry and average values and standard deviations are shown (n = 3).
Figure 2—figure supplement 3

Effect of reoM and reoY deletions on accumulation of other ClpC substrates in B. subtilis.
(A) Western blot showing GlmS amounts in B. subtilis strains 168 (wt), BKE00860 (ΔclpC), BKE27400 (ΔyrzL/reoM) and BKE22580 (ΔypiB/reoY, top). Strains were grown to mid-logarithmic growth phase for isolation of cellular proteins. Quantification of GlmS signals by densitometry (bottom). (B) Western blot showing IlvB amounts in the same set of strains as in panel A (top). Quantification of IlvB signals by densitometry (bottom). Average values and standard deviations calculated from three independent experiments are shown. Asterisks indicate statistically significant differences (p<0.05, t-test). A loading control is shown in Figure 2C.
Figure 3 with 1 supplement
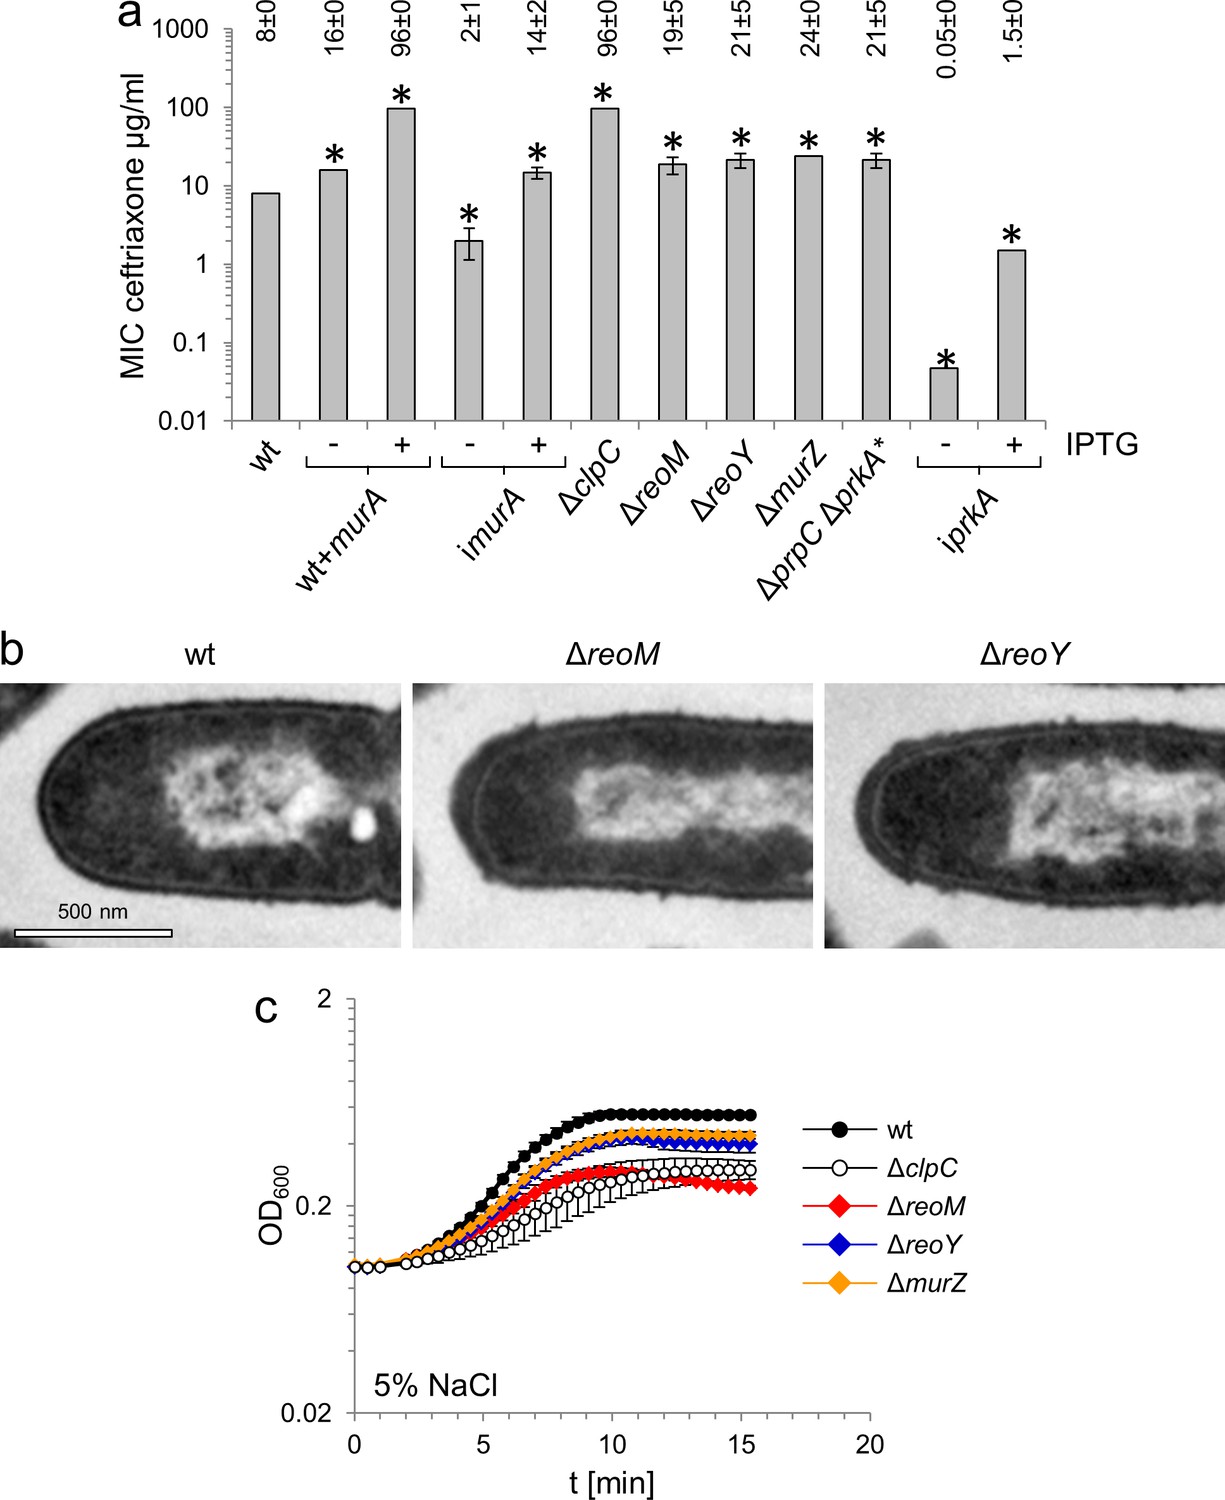
MurA accumulation affects peptidoglycan biosynthesis and salt sensitivity.
(A) Minimal inhibitory concentrations (MIC) for ceftriaxone of mutants with altered MurA accumulation. Average values and standard deviations are calculated from three independent experiments and given above the panel. Asterisks indicate statistically significant differences compared to wild type (p<0.05, t-test). Please note that the iprkA strain showed residual growth on BHI agar plates not containing IPTG, even though it required IPTG for growth in BHI broth. (B) Transmission electron microscopy of ultrathin sections of fixed whole cells of L. monocytogenes wildtype, ΔreoM and ΔreoY mutants. L. monocytogenes strains EGD-e (wt), LMSW30 (ΔreoM) and LMSW32 (ΔreoY) were grown to mid-logarithmic growth phase in BHI broth at 37°C and subjected to chemical fixation and subsequent electron microscopy as described in the experimental procedures section. (C) Salt sensitive growth of mutants with altered MurA accumulation. L. monocytogenes strains EGD-e (wt), LMJR138 (ΔclpC), LMSW30 (ΔreoM), LMSW32 (ΔreoY) and LMJR104 (∆murZ) were grown in BHI broth containing 5% NaCl at 37°C. Average values and standard deviations are calculated from three independent experiments.
Figure 3—figure supplement 1
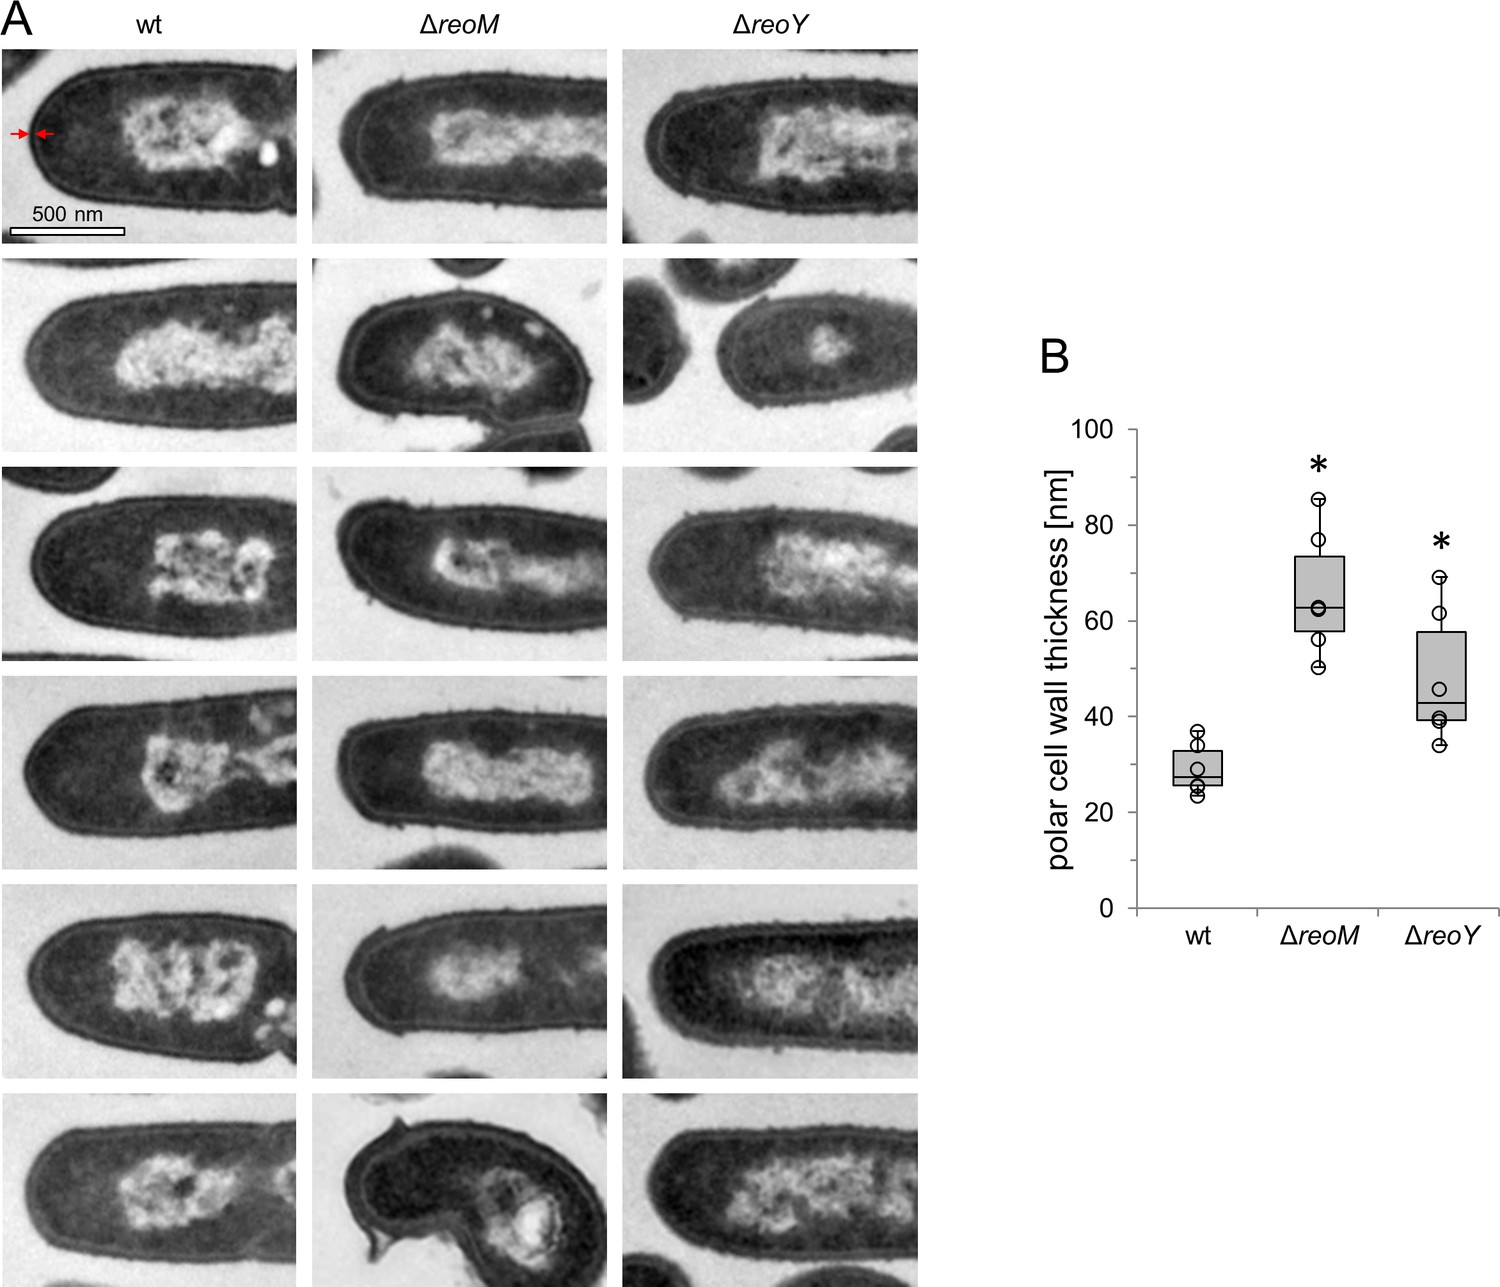
ReoM and ReoY affect thickness of polar peptidoglycan.
(A) Representative micrographs from transmission electron microscopy images of ultrathin sections of fixed whole cells of L. monocytogenes wildtype, ΔreoM and ΔreoY mutants. (B) Quantification of peptidoglycan (PG) thickness at cell poles. Thickness of the PG layer at the longitudinal axis of the cell was measured as indicated by the red arrows in panel A. The boxplot shows results from 6 cells per strain. Asterisks mark statistically significant differences (P<0.05, t-test).
Figure 4 with 4 supplements
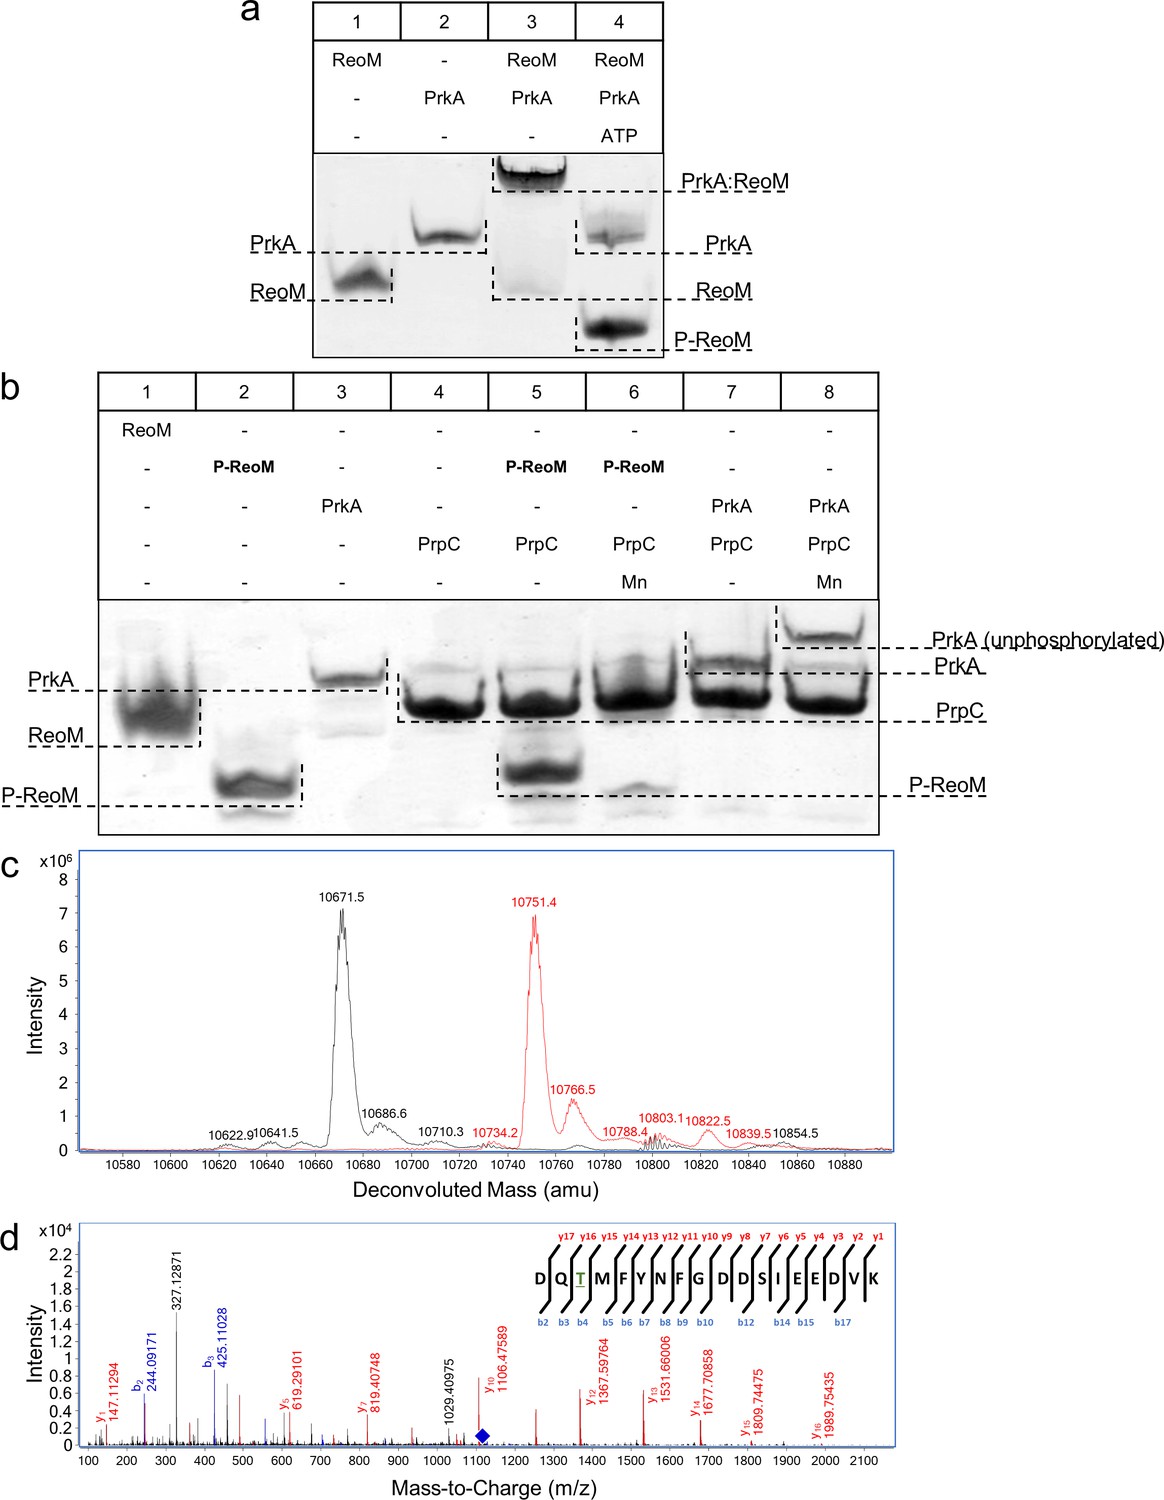
The PrkA/PrpC pair controls the phosphorylation status of ReoM.
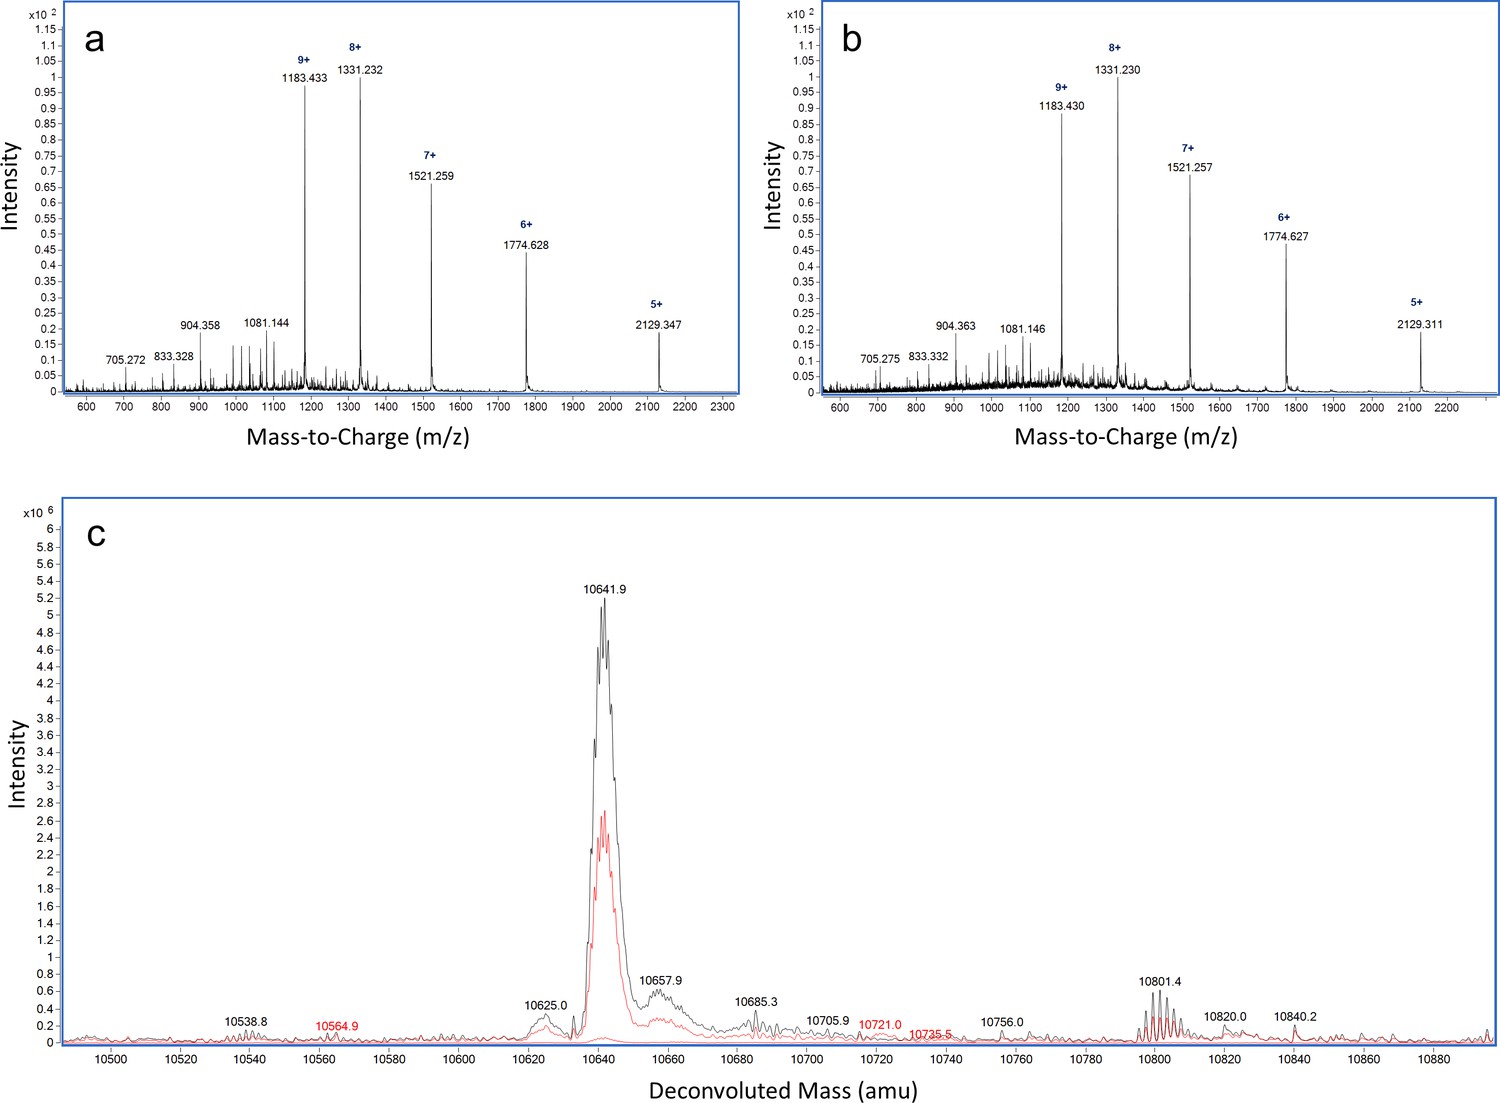
(A–B) Non-denaturing, native PAGE analysis of the phosphorylation (A) and dephosphorylation (B) of ReoM in vitro. The components of each lane in the Coomassie-stained gel are annotated above the image and the position and identity of relevant bands is marked to the side. (C) LC-MS analysis of intact ReoM. The deconvoluted mass spectrum for non-phosphorylated ReoM (black) is overlaid over the equivalent spectrum for mono-phosphorylated ReoM, P-ReoM (red). (D) LC-MS/MS was used to perform peptide mapping analysis that revealed that Thr7 is the sole phosphosite of ReoM. The MS/MS fragmentation spectra of the phosphorylated peptide encompassing Asp5-Lys22 is presented with b-ion fragmentation in blue and y-ion fragmentation shown in red, whilst the precursor ion (m/z 1116.86, z = 2+) is represented by a blue diamond.
Figure 4—figure supplement 1
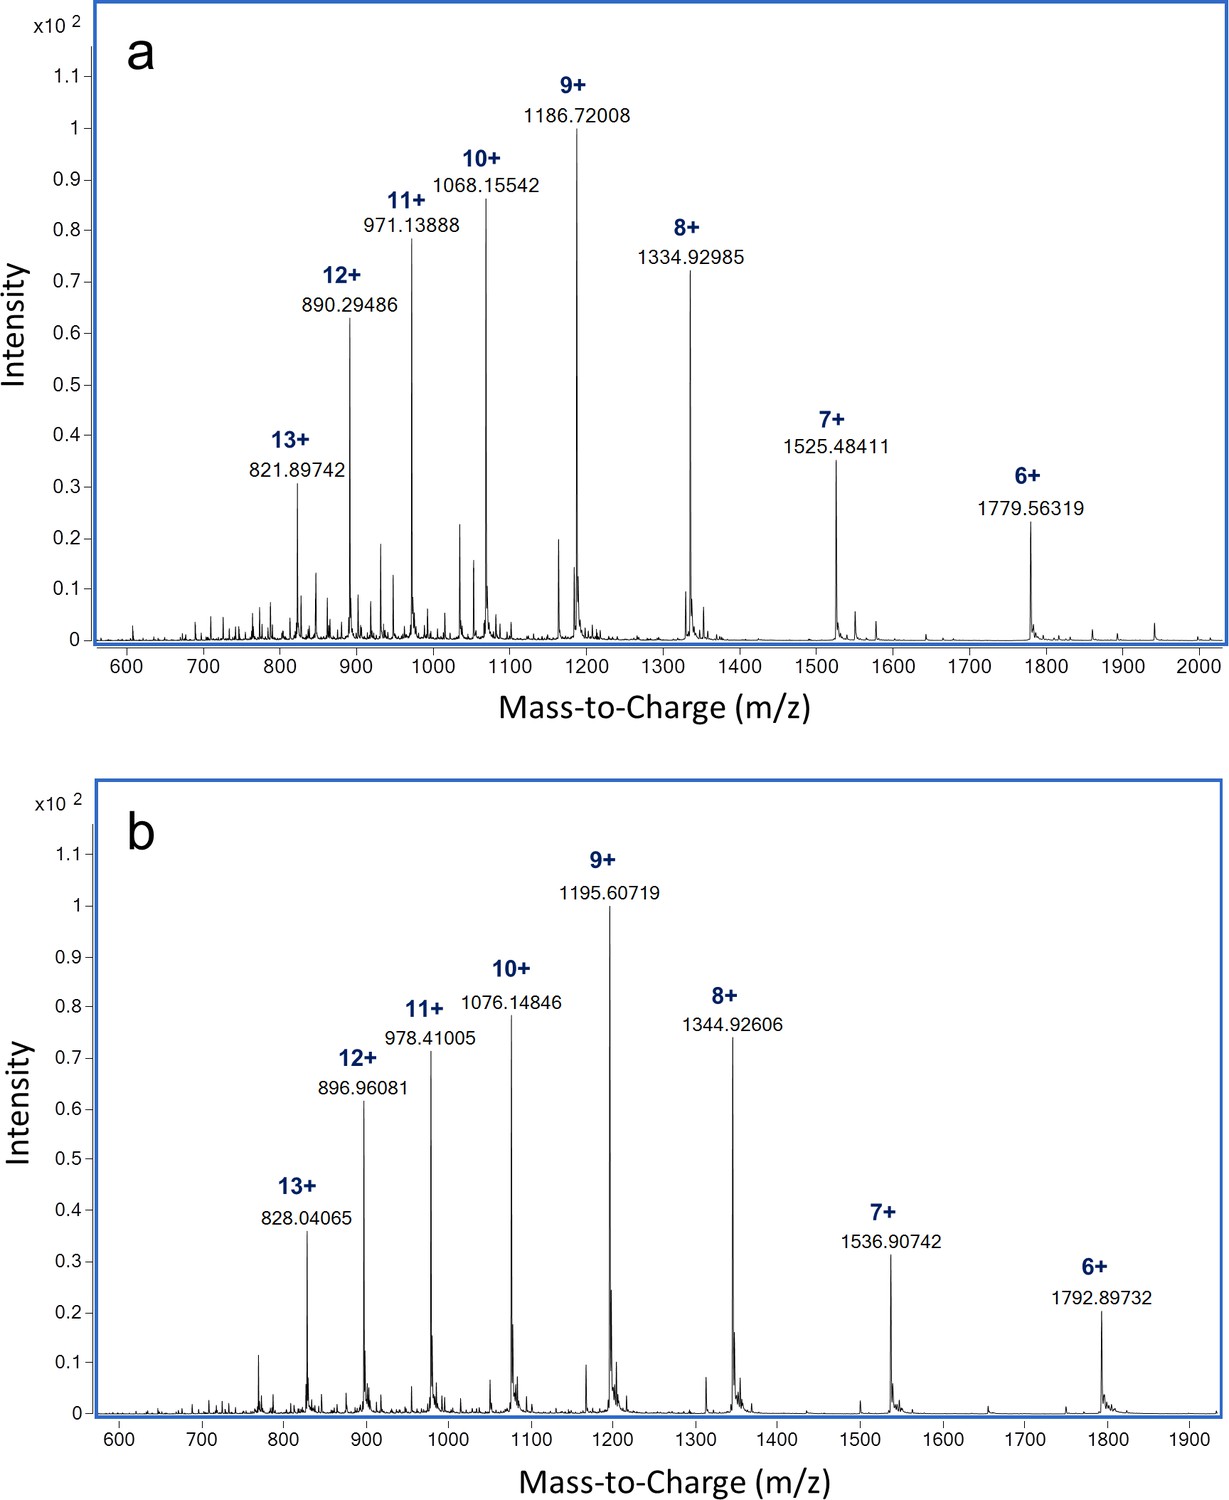
LC-MS analysis of intact ReoM.
ESI-QTOF raw data for (A) unmodified ReoM and (B) mono-phosphorylated ReoM.
Figure 4—figure supplement 2
LC-MS analysis of ReoM T7A.
ESI-QTOF raw data for (A) unmodified ReoM T7A and (B) ReoM T7A following incubation with PrkA-KD. (C) Overlaid deconvoluted mass spectrum demonstrating the lack of phosphorylation of ReoM T7A in the absence (black) and presence of PrkA-KD (red).
Figure 4—figure supplement 3

Dephosphorylation of P-ReoM by PrpC.
LC-MS analysis of ReoM after PrpC incubation in the presence of manganese. (A) ESI-QTOF raw data and (B) deconvoluted mass spectrum demonstrating the presence of non-phosphorylated ReoM.
Figure 4—figure supplement 4

Dephosphorylation of P-PrkA-KD by PrpC.
LC-MS analysis of intact PrkA-KD following incubation with PrpC (A) ESI-QTOF raw data and (B) deconvoluted mass spectrum indicating the presence of non-phosphorylated PrkA-KD.
Figure 5
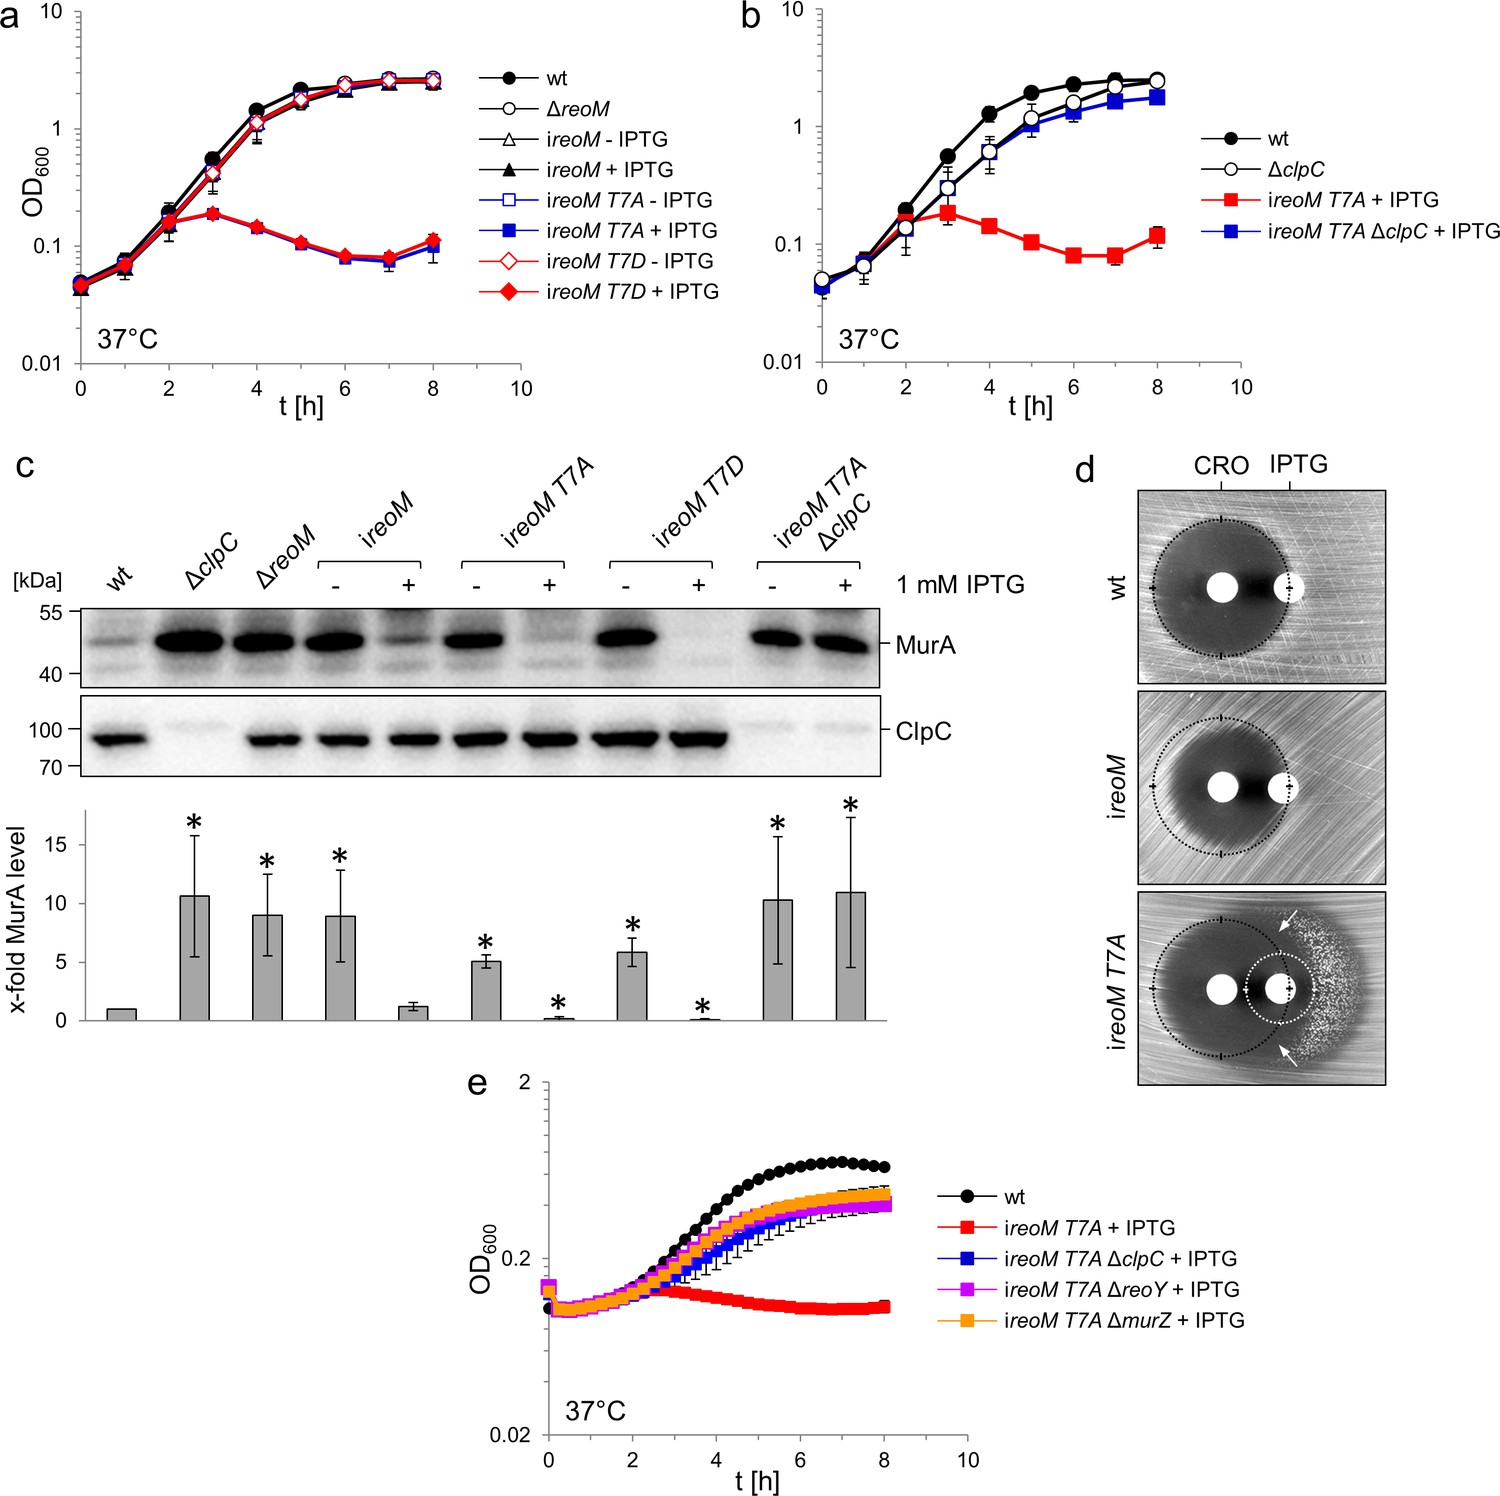
A ReoM T7A exchange affects growth and MurA levels in a ClpC-dependent manner.
(A) Lethality of the reoM T7A and reoM T7D mutations in L. monocytogenes. L. monocytogenes strains EGD-e (wt), LMSW30 (ΔreoM), LMSW57 (ireoM), LMSW52 (ireoM T7A) and LMSW53 (ireoM T7D) were grown in BHI broth ±1 mM IPTG at 37°C. The experiment was repeated three times and average values and standard deviations are shown. (B) Suppression of reoM T7A lethality by deletion of clpC. L. monocytogenes strains EGD-e (wt), LMJR138 (ΔclpC), LMSW52 (ireoM T7A) and LMSW72 (ireoM T7A ΔclpC) were grown in BHI broth ±1 mM IPTG at 37°C. The experiment was repeated three times and average values and standard deviations are shown. (C) Western blot showing cellular levels of MurA (top) and ClpC (middle) in the strains included in panels A and B. For this experiment, strains were grown in BHI broth not containing IPTG at 37°C. IPTG (1 mM) was added to the cultures at an OD600 of 0.2 and the cells were collected 2 hr later. Quantification of MurA signals by densitometry is shown below the western blots. Average values and standard deviations calculated from three independent experiments are shown. Asterisks indicate statistically significant differences (p<0.05, t-test). (D) ReoM T7A expression sensitises L. monocytogenes against ceftriaxone. Synergism between ceftriaxone and IPTG in the ireoM T7A strain LMSW52 in a disc diffusion assay with filter discs containing 50 mg/ml ceftriaxone (CRO, left) and 1 mM IPTG (right). For comparison, wild type levels of growth inhibition by ceftriaxone are marked with black circles. Zone of growth inhibition by IPTG in the ireoM T7A mutant is marked with a white circle. Please note that strain LMSW52 shows hetero-resistance against IPTG (two zones of growth inhibition with different resistance levels). Arrows mark the zones of synergism between ceftriaxone and IPTG. (E) Contribution of ReoY and MurZ to the lethal reoM T7A phenotype. L. monocytogenes strains EGD-e (wt), LMSW52 (ireoM T7A), LMSW72 (ireoM T7A ΔclpC), LMSW123 (ireoM T7A ΔreoY) and LMSW124 (ireoM T7A ΔmurZ) were grown in BHI broth containing 1 mM IPTG and growth at 37°C was recorded in a microplate reader. Average values and standard deviations were calculated from an experiment performed in triplicate.
Figure 6 with 3 supplements

Crystal structure of ReoM.
(A) The structure of ReoM depicted as a cartoon with each protomer in the dimer coloured separately (cyan and orange). The secondary structure elements are numbered according to their position in the amino acid sequence. Thr7 and some of the key amino acids in the dimer interface and the hydrophobic core are drawn as stick figures. (B) Sequence alignment of ReoM (Lmo) and its homologues from Bacillus subtilis (Bsu), Streptococcus pneumoniae (Spn), Clostridium difficile (Cdi) and Staphylococcus aureus (Sau) with the sequence of IreB from Enterococcus faecalis (Efa) underneath. Amino acid sequence numbers pertain to ReoM and the site of phosphorylation in ReoM (Thr7) and the twin phosphorylations in IreB (minor site: Thr4; major site: Thr7) are highlighted. Invariant amino acids are shaded black, residues in the ReoM dimer interface have an asterisk above, and the secondary structure elements are defined by cylinders above the alignment. Arginine residues mutated in this study are indicated by a hashtag above the alignment. (C) The final 2Fobs-Fcalc electron density map, contoured at a level of 0.42 e-/Å3, of the N-terminal region in the immediate vicinity of Thr7 in chain A of the ReoM dimer indicates that the protein model could be built with confidence even though this region contains no secondary structure elements.
Figure 6—figure supplement 1

ReoM and P-ReoM have the same oligomeric state.
Size exclusion chromatography of ReoM and P-ReoM showed that phosphorylation of ReoM does not alter its oligomeric state. Both ReoM (solid) and P-ReoM (dashed) had an elution volume at 14.6 mL.
Figure 6—figure supplement 2
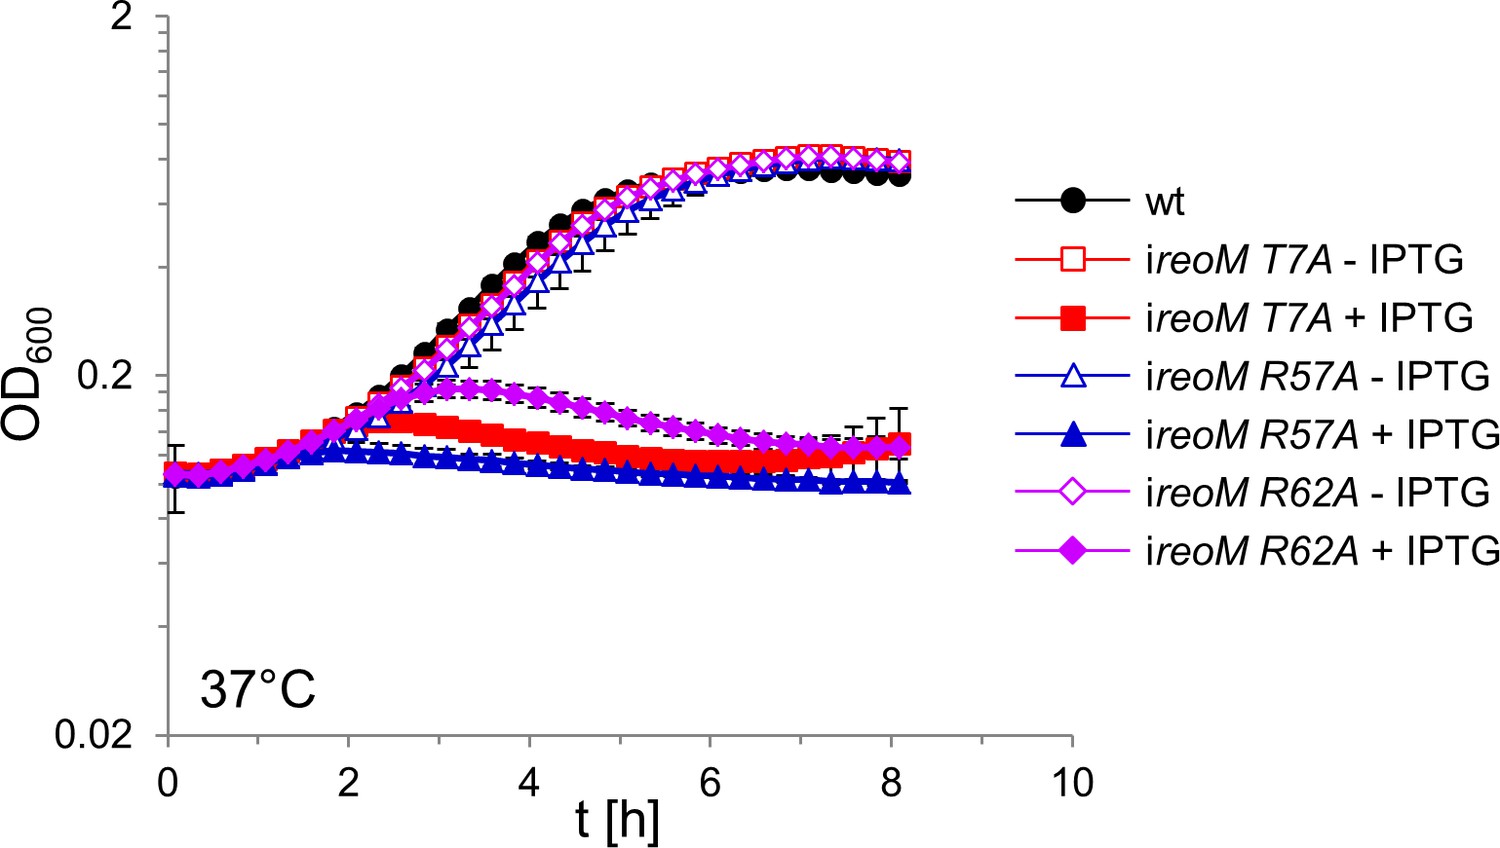
Lethality of ReoM R57A and R62A substitutions.
L. monocytogenes strains EGD-e (wt), LMSW52 (ireoM T7A), LMSW125 (ireoM R57A), and LMSW126 (ireoM R62A) were grown in BHI broth ±1 mM IPTG at 37°C. The experiment was repeated three times and average values and standard deviations are shown.
Figure 6—figure supplement 3
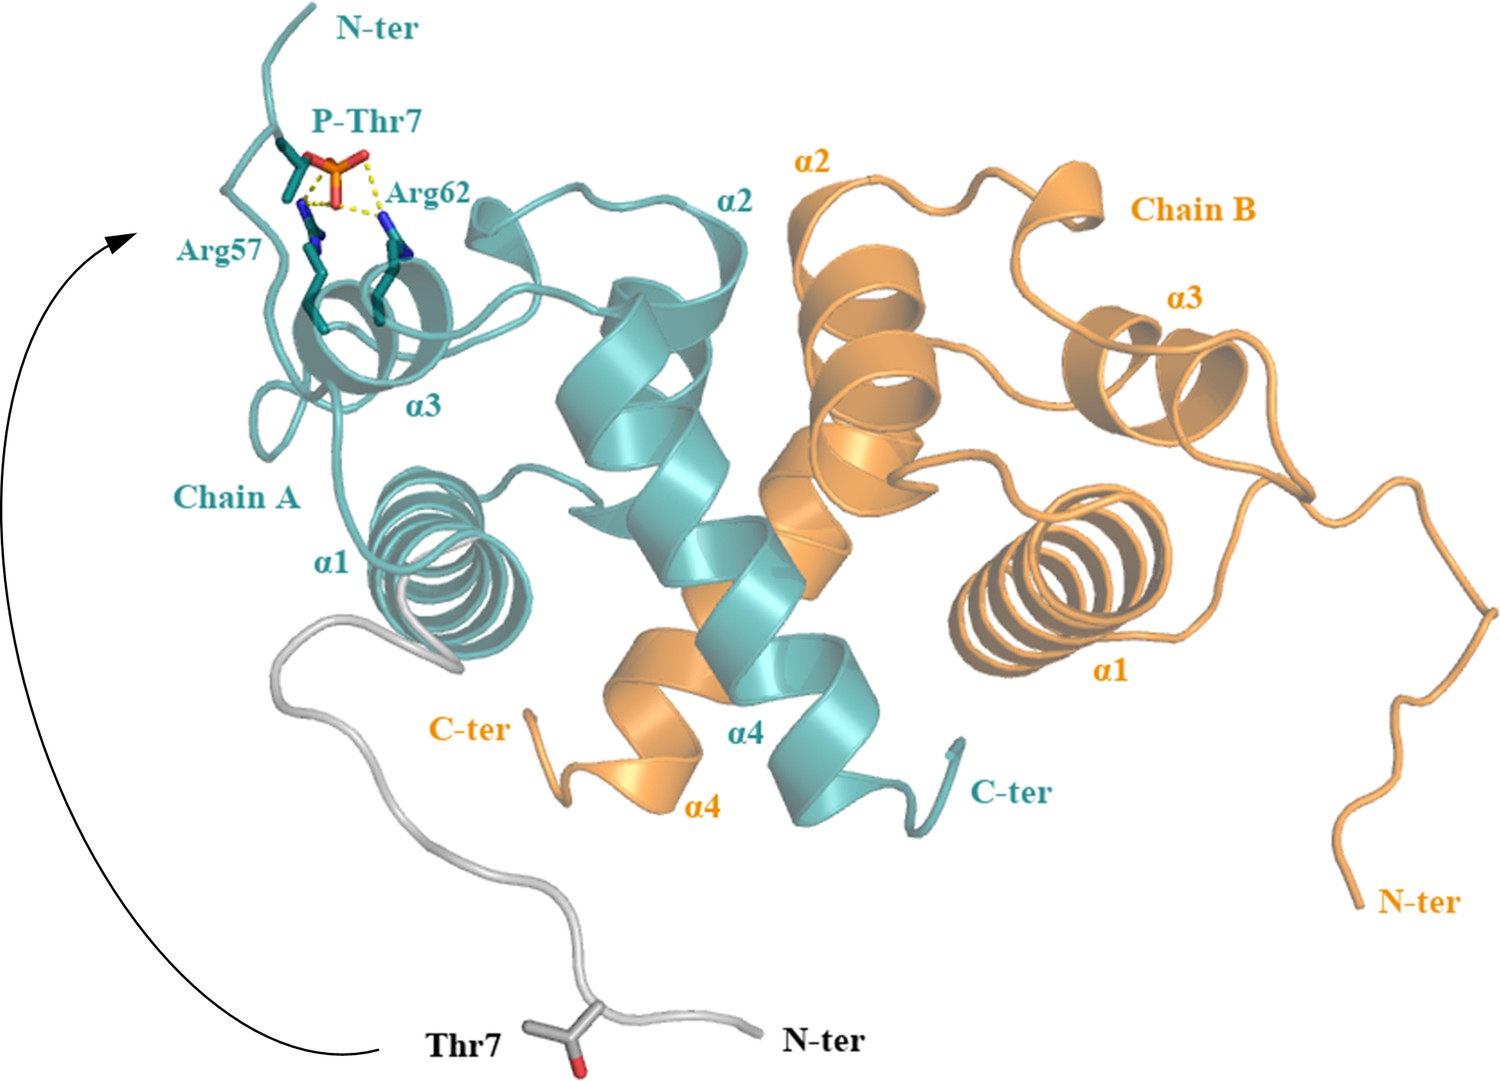
A possible conformational change of the flexible ReoM N-terminus induced by phosphorylation.
The N-terminus of ReoM might undergo a substantial movement after phosphorylation that would be stabilised in its new conformation by electrostatic interactions between the negatively charged phosphate of Thr7 ~P and the positively charged Arg57/Arg62 pair.
Figure 7
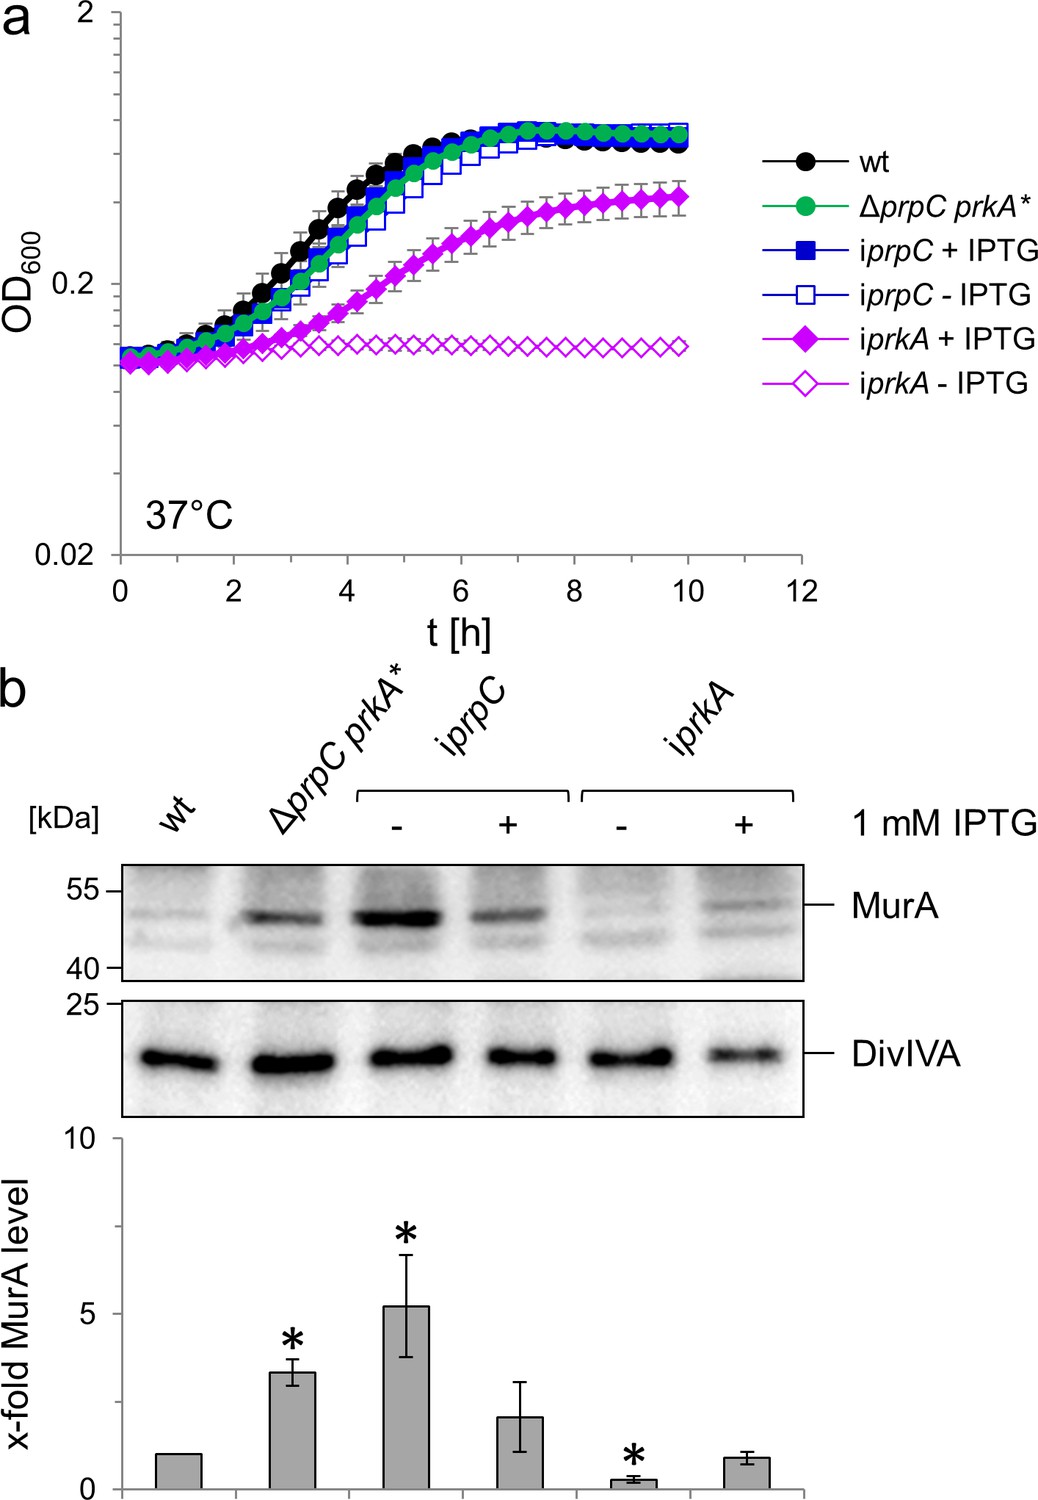
Effect of prkA and prpC mutations on growth and MurA levels of L. monocytogenes.
(A) Contribution of PrkA and PrpC to L. monocytogenes growth. L. monocytogenes strains EGD-e (wt), LMSW76 (ΔprpC prkA*), LMSW83 (iprpC) and LMSW84 (iprkA) were grown in BHI broth ±1 mM IPTG at 37°C in a microtiter plate reader. The experiment was repeated three times and average values and standard deviations are shown. (B) Contribution of PrkA and PrpC to MurA stability. Western blots showing cellular levels of MurA (top) and DivIVA (middle) in the same set of strains as in panel A and quantification of MurA signals by densitometry (below). Average values and standard deviations calculated from three independent experiments are shown. Asterisks indicate statistically significant differences (p<0.05, t-test).
Figure 8 with 1 supplement

PrkA essentiality depends on reoM, reoY and clpC.
(A) Effect of reoM, reoY and clpC deletions on prkA essentiality. L. monocytogenes strains EGD-e (wt), LMSW84 (iprkA), LMSW89 (iprkA ΔreoM), LMSW90 (iprkA ΔreoY) and LMSW91 (iprkA ΔclpC) were grown in BHI broth ±1 mM IPTG at 37°C in a microtiter plate reader. The experiment was repeated three times and average values and standard deviations are shown. (B) clpC, reoM and reoY deletions overcome MurA degradation in PrkA-depleted cells. Western blot showing MurA levels in L. monocytogenes strains EGD-e (wt), LMJR138 (ΔclpC), LMSW30 (ΔreoM), LMSW32 (ΔreoY), LMSW84 (iprkA), LMSW89 (iprkA ΔreoM), LMSW90 (iprkA ΔreoY) and LMSW91 (iprkA ΔclpC, top). A parallel DivIVA western blot was used as loading control (middle). Quantification of MurA signals by densitometry (below). Average values and standard deviations calculated from three independent experiments are shown. Asterisks indicate statistically significant differences (p<0.05, t-test).
Figure 8—figure supplement 1
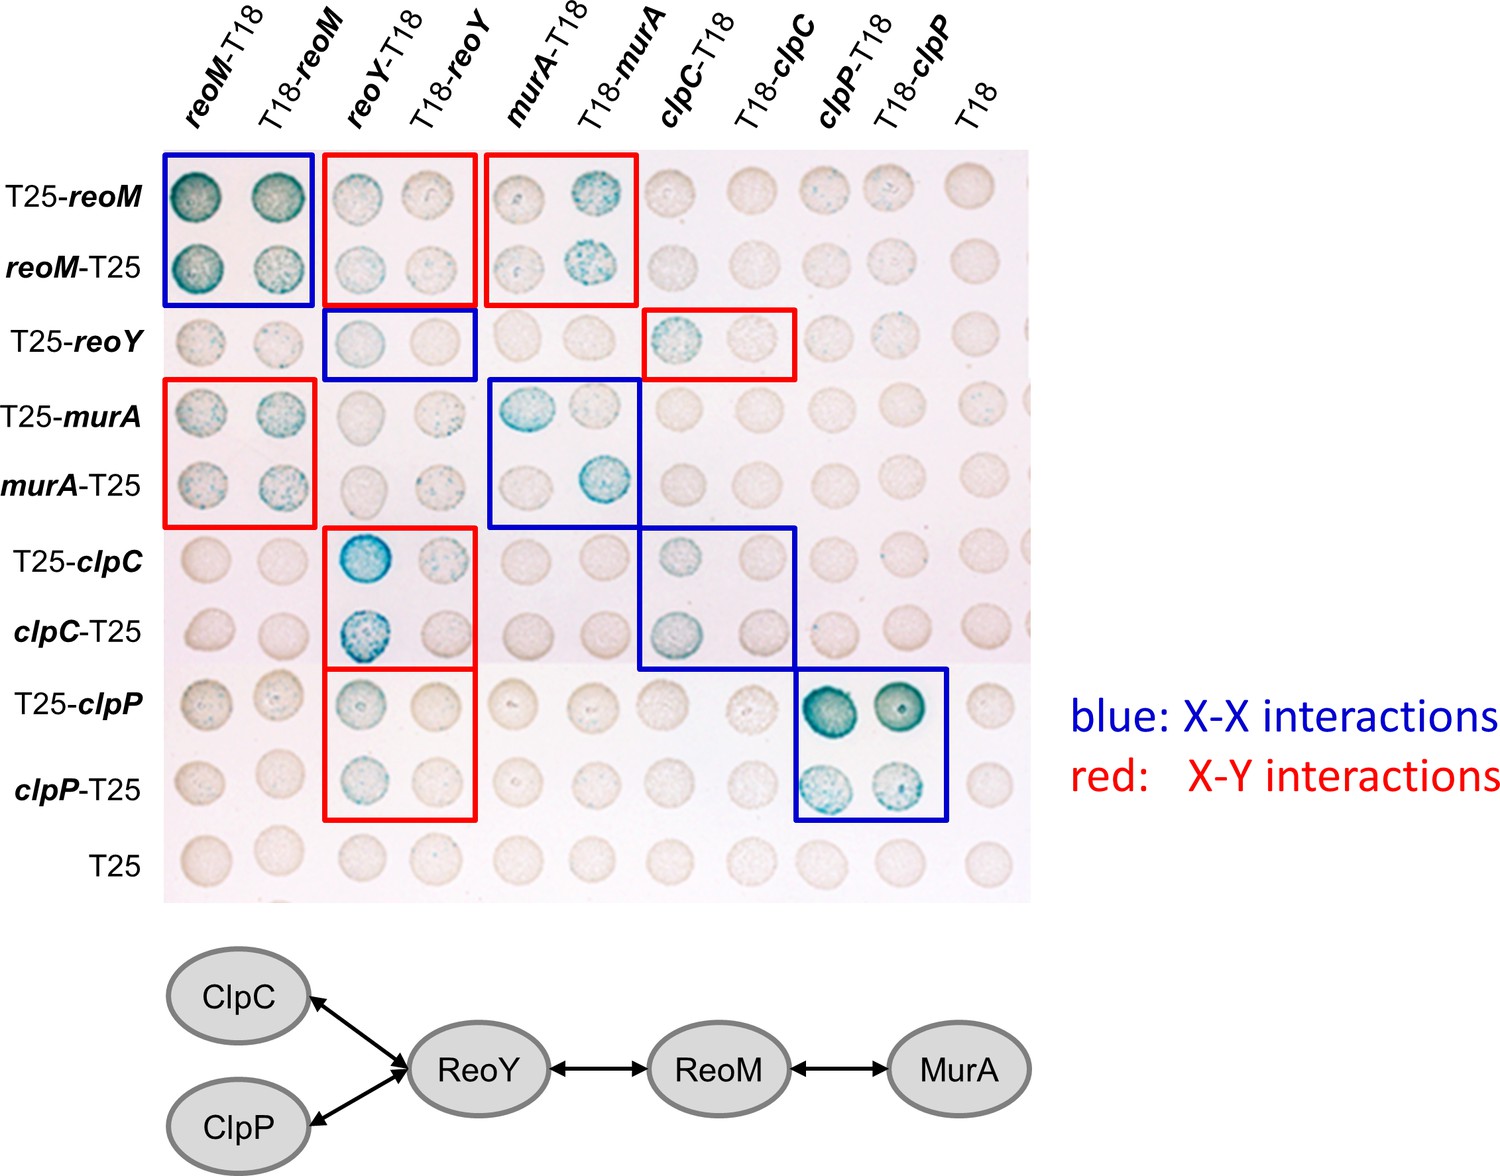
Bacterial two hybrid experiment showing interactions between MurA, ReoM, ReoY, ClpC and ClpP.
Plasmids carrying fusions of the T18- and T25-fragments of Bordetella pertussis adenylate cyclase fused to MurA, ReoM, ReoY, ClpC and ClpP of L. monocytogenes were cotransformed into E. coli BTH101 and plated on selective LB agar plates containing X-Gal. Formation of blue colonies indicates interaction between the tested proteins. An illustration summarising all detected protein-protein interactions is shown below. Please note that all murZ fusions and the reoY-T25 fusion were not functional and were therefore not included.
Figure 9
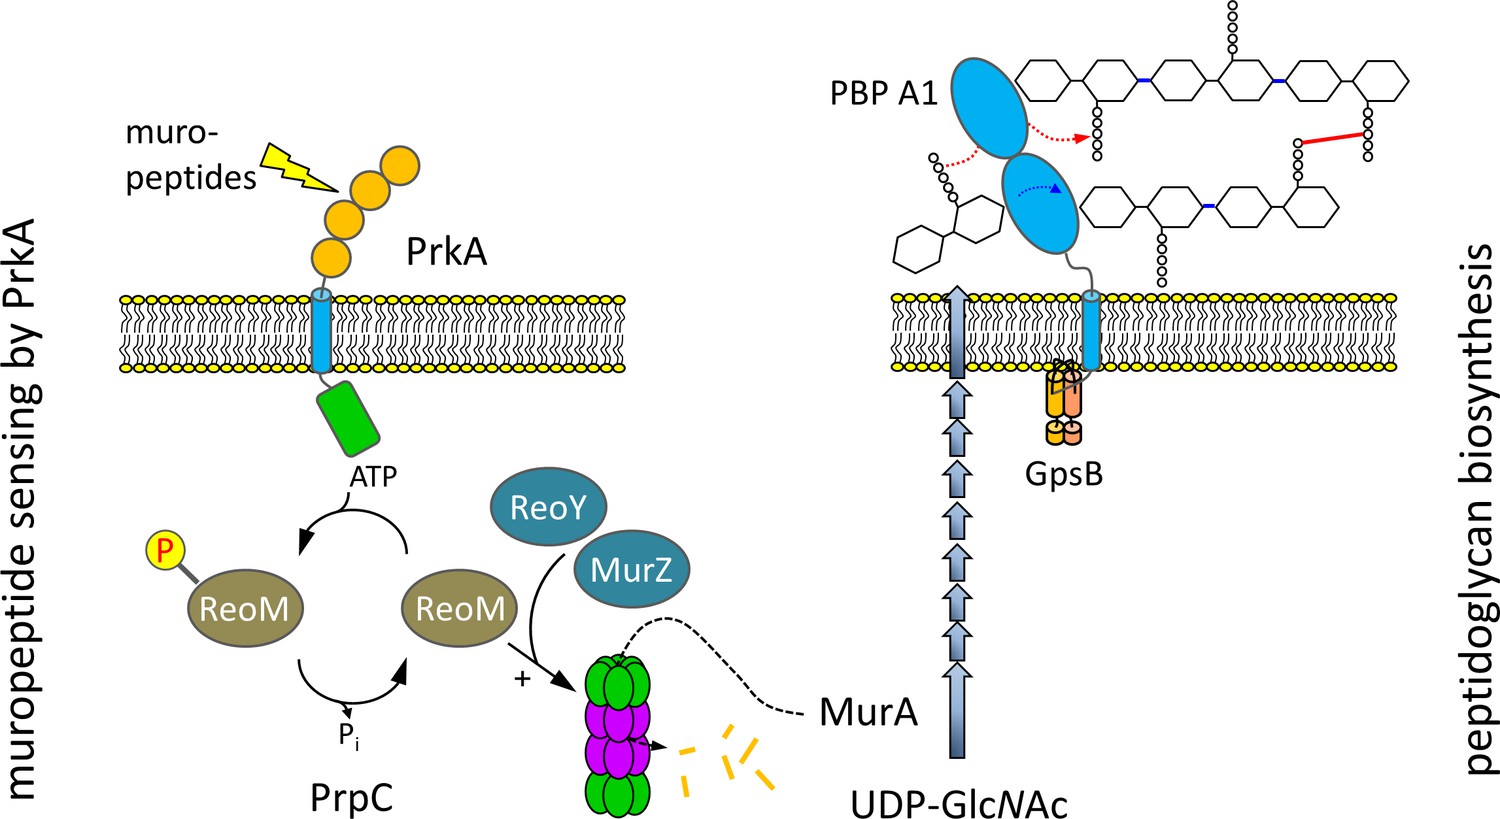
ReoM links PrkA-dependent muropeptide sensing with peptidoglycan biosynthesis.
Model illustrating the role of ReoM as substrate of PrkA and as regulator of ClpCP. PrkA recognises free muropeptides, which activate PrkA to phosphorylate ReoM. In its unphosphorlyated form, ReoM is an activator of ClpCP-dependent degradation of MurA, the first enzyme of peptidoglycan biosynthesis, and ReoY and MurZ contribute to this process. By phosphorylating ReoM, PrkA prevents ClpCP-dependent MurA degradation so that MurA accumulates and peptidoglycan biosynthesis can occur. Please note that there is a lesser degree of conservation in the fourth PASTA domain of PrkA.
Tables
Table 1
Summary of the data collection and refinement statistics for ReoM.
| Data collection | |
|---|---|
| Beamline | Diamond I03 |
| Wavelength (Å) | 0.976 |
| Resolution (Å) | 74.45–1.60 (1.63–1.60)* |
| Space group | P 21 21 21 |
| a, b, c (Å) | 38.79, 58.62, 74.45 |
| α, β, γ (°) | 90, 90, 90 |
| Rpim | 0.064 (0.533) |
| CC (1/2) (%) | 98.6 (62.0) |
| <I>/<σ(I)> | 8.2 (2.2) |
| Completeness (%) | 99.8 (99.8) |
| Redundancy | 4.8 (4.9) |
| Total observations | 111229 (5581) |
| Unique reflections | 23059 (1129) |
| Refinement | |
| Rwork (%) | 15.3 |
| Rfree (%) | 21.4 |
| Solvent content (%) | 38.0 |
| # atoms | |
| Protein | 1399 |
| Ligand/ion | 20 |
| Water | 94 |
| B-factors (Å2) | |
| Protein | 26.4 |
| Ligand/ion | 50.5 |
| Water | 37.7 |
| R.m.s deviations | |
| Bonds (Å) | 0.015 |
| Angles (°) | 1.79 |
-
*Where values in parentheses refer to the highest resolution shell.
Table 2
Plasmids and strains used in this study.
| Name | Relevant characteristics | Source*/reference |
|---|---|---|
| Plasmids | ||
| pIMK3 | Phelp-lacO lacI neo | Monk et al., 2008 |
| pMAD | bla erm bgaB | Arnaud et al., 2004 |
| pUT18 | bla Plac-cya(T18) | Karimova et al., 1998 |
| pUT18C | bla Plac-cya(T18) | Karimova et al., 1998 |
| pKT25 | kan Plac-cya(T25) | Karimova et al., 1998 |
| p25-N | kan Plac-cya(T25) | Claessen et al., 2008 |
| pJR127 | bla erm bgaB ΔclpC (lmo0232) | Rismondo et al., 2017 |
| pSH246 | bla erm bgaB ΔgpsB (lmo1888) | Rismondo et al., 2016 |
| pJR68 | bla erm bgaB ΔmurZ (lmo2552) | Rismondo et al., 2017 |
| pJR71 | Phelp-lacO-murZ lacI neo | Rismondo et al., 2017 |
| pJR65 | Phelp-lacO-reoM lacI neo | this work |
| pJR70 | Phelp-lacO-reoY lacI neo | this work |
| pJR83 | bla erm bgaB ∆reoY (lmo1921) | this work |
| pJR101 | kan Plac-cya(T25)-reoM | this work |
| pJR102 | kan Plac-reoM-cya(T25) | this work |
| pJR103 | bla Plac-reoM-cya(T18) | this work |
| pJR104 | bla Plac-cya(T18)-reoM | this work |
| pJR109 | kan Plac-cya(T25)-reoY | this work |
| pJR111 | bla Plac-cya(T18)-reoY | this work |
| pJR116 | kan Plac-cya(T25)-murA | this work |
| pJR117 | kan Plac-murA-cya(T25) | this work |
| pJR118 | bla Plac-murA-cya(T18) | this work |
| pJR119 | bla Plac-cya(T18)-murA | this work |
| pJR121 | bla Plac-reoY-cya(T18) | this work |
| pJR126 | bla erm bgaB ∆reoM (lmo1503) | this work |
| pSW29 | Phelp-lacO-reoM T7A lacI neo | this work |
| pSW30 | Phelp-lacO-reoM T7D lacI neo | this work |
| pSW36 | bla erm bgaB ΔprkA (lmo1820) | this work |
| pSW37 | bla erm bgaB ΔprpC (lmo1821) | this work |
| pSW38 | Phelp-lacO-prkA lacI neo | this work |
| pSW39 | Phelp-lacO-prpC lacI neo | this work |
| pSW43 | kan Plac-cya(T25)-clpC | this work |
| pSW44 | kan Plac-cya(T25)-clpP | this work |
| pSW45 | kan Plac- clpC-cya(T25) | this work |
| pSW46 | kan Plac-clpP-cya(T25) | this work |
| pSW47 | bla Plac-clpC-cya(T18) | this work |
| pSW48 | bla Plac-clpP-cya(T18) | this work |
| pSW49 | bla Plac-cya(T18)-clpC | this work |
| pSW50 | bla Plac-cya(T18)-clpP | this work |
| pSW55 | Phelp-lacO-reoM R66A lacI neo | this work |
| pSW56 | Phelp-lacO-reoM R70A lacI neo | this work |
| pSW58 | Phelp-lacO-reoM R57A lacI neo | this work |
| pSW59 | Phelp-lacO-reoM R62A lacI neo | this work |
| B. subtilis strains | ||
| 168 | wild type, lab collection | |
| BKE00860 | ΔclpC | Koo et al., 2017 |
| BKE22180 | ΔgpsB | Koo et al., 2017 |
| BKE22580 | ΔypiB (reoY) | Koo et al., 2017 |
| BKE27400 | ΔyrzL (reoM) | Koo et al., 2017 |
| L. monocytogenes strains | ||
| EGD-e | wild-type, serovar 1/2a strain | Glaser et al., 2001 |
| LMJR19 | ΔgpsB (lmo1888) | Rismondo et al., 2016 |
| LMJR104 | ∆murZ (lmo2552) | Rismondo et al., 2017 |
| LMJR116 | attB::Phelp-lacO-murA lacI neo | Rismondo et al., 2017 |
| LMJR123 | ΔmurA (lmo2526) attB::Phelp-lacO-murA lacI neo | Rismondo et al., 2017 |
| LMJR138 | ΔclpC (lmo0232) | Rismondo et al., 2017 |
| shg8 | ΔgpsB reoY H87Y | this work |
| shg10 | ΔgpsB reoY TAA74 | this work |
| shg12 | ΔgpsB reoM RBS mutation | this work |
| LMJR96 | ∆gpsB attB::Phelp-lacO-reoM lacI neo | pJR65 → LMJR19 |
| LMJR102 | attB::Phelp-lacO-reoM lacI neo | pJR65 → EGD-e |
| LMJR106 | ∆gpsB attB::Phelp-lacO-reoY lacI neo | pJR70 → LMJR19 |
| LMJR120 | ΔgpsB ΔreoY | pJR83 ↔ LMJR19 |
| LMJR137 | ΔgpsB ΔreoM | pJR126 ↔ LMJR19 |
| LMJR171 | ΔclpC ΔmurZ | pJR127 ↔ LMJR104 |
| LMSW30 | ΔreoM (lmo1503) | pJR126 ↔ EGD-e |
| LMSW32 | ΔreoY (lmo1921) | pJR83 ↔ EGD-e |
| LMSW50 | ΔclpC ΔreoM | pJR127 ↔ LMSW30 |
| LMSW51 | ΔclpC ΔreoY | pJR127 ↔ LMSW32 |
| LMSW52 | ΔreoM attB::Phelp-lacO-reoM T7A lacI neo | pSW29 → LMSW30 |
| LMSW53 | ΔreoM attB::Phelp-lacO-reoM T7D lacI neo | pSW30 → LMSW30 |
| LMSW57 | ΔreoM attB::Phelp-lacO-reoM lacI neo | pJR65 → LMSW30 |
| LMSW72 | ΔreoM attB::Phelp-lacO-reoM T7A lacI neo ΔclpC | pJR127 ↔ LMSW52 |
| LMSW76 | ΔprpC prkA* | pSW37 ↔ EGD-e |
| LMSW80 | attB::Phelp-lacO-prkA lacI neo | pSW38 → EGD-e |
| LMSW81 | attB::Phelp-lacO-prpC lacI neo | pSW39 → EGD-e |
| LMSW83 | ΔprpC attB::Phelp-lacO-prpC lacI neo | pSW37 ↔ LMSW81 |
| LMSW84 | ΔprkA attB::Phelp-lacO-prkA lacI neo | pSW36 ↔ LMSW80 |
| LMSW89 | ΔprkA attB::Phelp-lacO-prkA lacI neo ΔreoM | pJR126 ↔ LMSW84 |
| LMSW90 | ΔprkA attB::Phelp-lacO-prkA lacI neo ΔreoY | pJR83 ↔ LMSW84 |
| LMSW91 | ΔprkA attB::Phelp-lacO-prkA lacI neo ΔclpC | pJR127 ↔ LMSW84 |
| LMSW117 | ΔreoM ΔreoY | pJR126 ↔ LMSW32 |
| LMSW118 | ΔreoY ΔmurZ | pJR68 ↔ LMSW32 |
| LMSW119 | ΔreoM ΔmurZ | pJR68 ↔ LMSW30 |
| LMSW120 | ΔreoM attB::Phelp-lacO-reoM R66A lacI neo | pSW55 → LMSW30 |
| LMSW121 | ΔreoM attB::Phelp-lacO-reoM R70A lacI neo | pSW56 → LMSW30 |
| LMSW123 | ΔreoM attB::Phelp-lacO-reoM T7A lacI neo ΔreoY | pSW29 → LMSW117 |
| LMSW124 | ΔreoM attB::Phelp-lacO-reoM T7A lacI neo ΔmurZ | pSW29 → LMSW119 |
| LMSW125 | ΔreoM attB::Phelp-lacO-reoM R57A lacI neo | pSW58 → LMSW30 |
| LMSW126 | ΔreoM attB::Phelp-lacO-reoM R62A lacI neo | pSW59 → LMSW30 |
| LMSW138 | ΔreoY attB::Phelp-lacO-reoY lacI neo | pJR70 → LMSW32 |
| LMSW139 | ΔmurZ attB::Phelp-lacO-murZ lacI neo | pJR71 → LMJR104 |
-
*The arrow (→) stands for a transformation event and the double arrow (↔) indicates gene deletions obtained by chromosomal insertion and subsequent excision of pMAD plasmid derivatives (see experimental procedures for details).
Table 3
Oligonucleotides used in this study.
| Name | Sequence (5´→3´) |
|---|---|
| JR163 | GCGCCCATGGCTAAGGCATCCATTTCAATAGACGAGAAG |
| JR164 | GCGCGTCGACTTATTCTTTTTCCGTATCCATTTGCTGTA |
| JR169 | GCGCCCATGGATTCAAAAGATCAAACAATGTTTTACAACTTC |
| JR170 | GCGCGTCGACTCATTTCTCACCAATTTCGTTATTTTTCAG |
| JR197 | GCGCGGATCCCAATTATTTCGAATGGTGCGGTGTC |
| JR198 | TCCTTATTCGTCGACCATCTTTCCTCAGTCCCTTCCTG |
| JR199 | GGAAAGATGGTCGACGAATAAGGAATAAATCCTAGTTAGTAGGG |
| JR200 | CGCGCGAATTCCCAAGACTCAACCTCTTTCACTC |
| JR249 | GCGCCTGCAGAAAAAATTATTGTACGCGGTGGAAAAC |
| JR250 | GCGCGGTACCGCGAATAAAGACGCTAAGTTTGTTACATCG |
| JR253 | GCGCTCTAGAAAAGGCATCCATTTCAATAGACGAG |
| JR254 | GCGCGGTACCTCTTTTTCCGTATCCATTTGCTG |
| JR255 | GCGCTCTAGATTCAAAAGATCAAACAATGTTTTACAAC |
| JR256 | GCGCGGTACCTTCTCACCAATTTCGTTATTTTTCAG |
| JR257 | GCGCCTGCAGGGAAAAAATTATTGTACGCGGTGGAAAAC |
| JR264 | GCGCAGATCTGGCAAATACAGCATTGAACTATGTG |
| JR265 | GCGCGGATCCAATCGAAGCACCTCATTCCTTC |
| JR266 | GCGCGGATCCATGAGAATAATGGGTTTAGATGTCGGC |
| JR267 | GCGCGTCGACGCTAGGAATGTAGCAAGGATTTCTTC |
| SHW815 | GATCTATCGATGCATGCCATGGGCTAAATGACCAAGGAATTACCG |
| SHW816 | CGCGTCGGGCGATATCGGATCCTTTCTTCCGCGTTTTGGTAACG |
| SHW817 | CAATCATCATTTTAAAAGCACCTCACTATTTTTCAG |
| SHW818 | TGCTTTTAAAATGATGATTGGTAAGCGATTAAGC |
| SHW819 | GATCTATCGATGCATGCCATGGAGATAGAGGCAGAATAAGACATC |
| SHW820 | CGCGTCGGGCGATATCGGATCCGGTATTTACAACCACTACGTCG |
| SHW821 | CGTTCTTATTTCATGAAGCATCCCTCCCTTTC |
| SHW822 | TGCTTCATGAAATAAGAACGGAGGAAATGTGCTG |
| SHW830 | GCGCGCTCTAGATGGACGATTTACGCAAAGAGCTCAG |
| SHW831 | GCGCGCGGTACCTTAGCTTTTACTTTTTTAGAGGTTGTTTTC |
| SHW832 | GCGCGCTCTAGAAATTCCAACAGTAATTGAACAAACTAGC |
| SHW833 | GCGCGCGGTACCCCTTTTAAGCCAGATTTATTAATGATAATATC |
| SW77 | GTAAAACATTGCTTGATCTTTTGAATCCATGGGTTTCAC |
| SW78 | GATCAAGCAATGTTTTACAACTTCGGCGATGATTC |
| SW79 | GTAAAACATGTCTTGATCTTTTGAATCCATGGGTTTCAC |
| SW80 | GATCAAGACATGTTTTACAACTTCGGCG ATGATTC |
| SW110 | GCGCGCGGATCCATGCATGCAGAATTTAGAACAGATAG |
| SW111 | GCGCGCGTCGACTCATGAAGCATCCCTCCCTTTC |
| SW112 | GCGCGCGGATCCATGATGATTGGTAAGCGATTAAGCG |
| SW113 | GCGCGCGTCGACTTAATTTGGATAAGGGACTGTACCTTC |
| SW136 | CTAAACGAGCTATCATACTTCTAGCATCCTTGTGAC |
| SW137 | GTATGATAGCTCGTTTAGAACGAGATGAAATTATCGAG |
| SW138 | AATTTCATCTGCTTCTAAACGACGTATCATACTTCTAGC |
| SW139 | GTTTAGAAGCAGATGAAATTATCGAGGAACTTGTCAAAG |
| SW144 | CCTTGTGAGCAGGAATATAAGCAGGATCGCCTG |
| SW145 | TATATTCCTGCTCACAAGGATGCTAGAAGTATGATAC |
| SW146 | GTATCATACTTGCAGCATCCTTGTGACGAGGAATATAAG |
| SW147 | GGATGCTGCAAGTATGATACGTCGTTTAGAACGAG |
| Lmo1503F | GCTATACCATGGATTCAAAAGATCAAACAATGTTTTACAAC |
| Lmo1503R | CGATATCTCGAGTCATTTCTCACCAATTTCGTTATTTTTCAG |
| PrkAF | GCTATACCATGGCAATGATGATTGGTAAGCGATTAAGCG |
| PrkAR | CGATATCTCGAGTCATTTTTTCTTTTTCTTATCTTTTTTCTCCTCAGG |
| PrpCF | GCTATACCATGGCAATGCATGCAGAATTTAGAACAGATAGAG |
| PrpCR | CGATATCTCGAGTCATGAAGCATCCCTCCCTTTC |
Additional files
-
Supplementary file 1
Key resources table.
- https://cdn.elifesciences.org/articles/56048/elife-56048-supp1-v2.docx
-
Transparent reporting form
- https://cdn.elifesciences.org/articles/56048/elife-56048-transrepform-v2.docx
Download links
A two-part list of links to download the article, or parts of the article, in various formats.
Downloads (link to download the article as PDF)
Open citations (links to open the citations from this article in various online reference manager services)
Cite this article (links to download the citations from this article in formats compatible with various reference manager tools)
PrkA controls peptidoglycan biosynthesis through the essential phosphorylation of ReoM
eLife 9:e56048.
https://doi.org/10.7554/eLife.56048


