Population coupling predicts the plasticity of stimulus responses in cortical circuits
- Department of Bioengineering, Imperial College London, United Kingdom
Figures
Figure 1 with 1 supplement
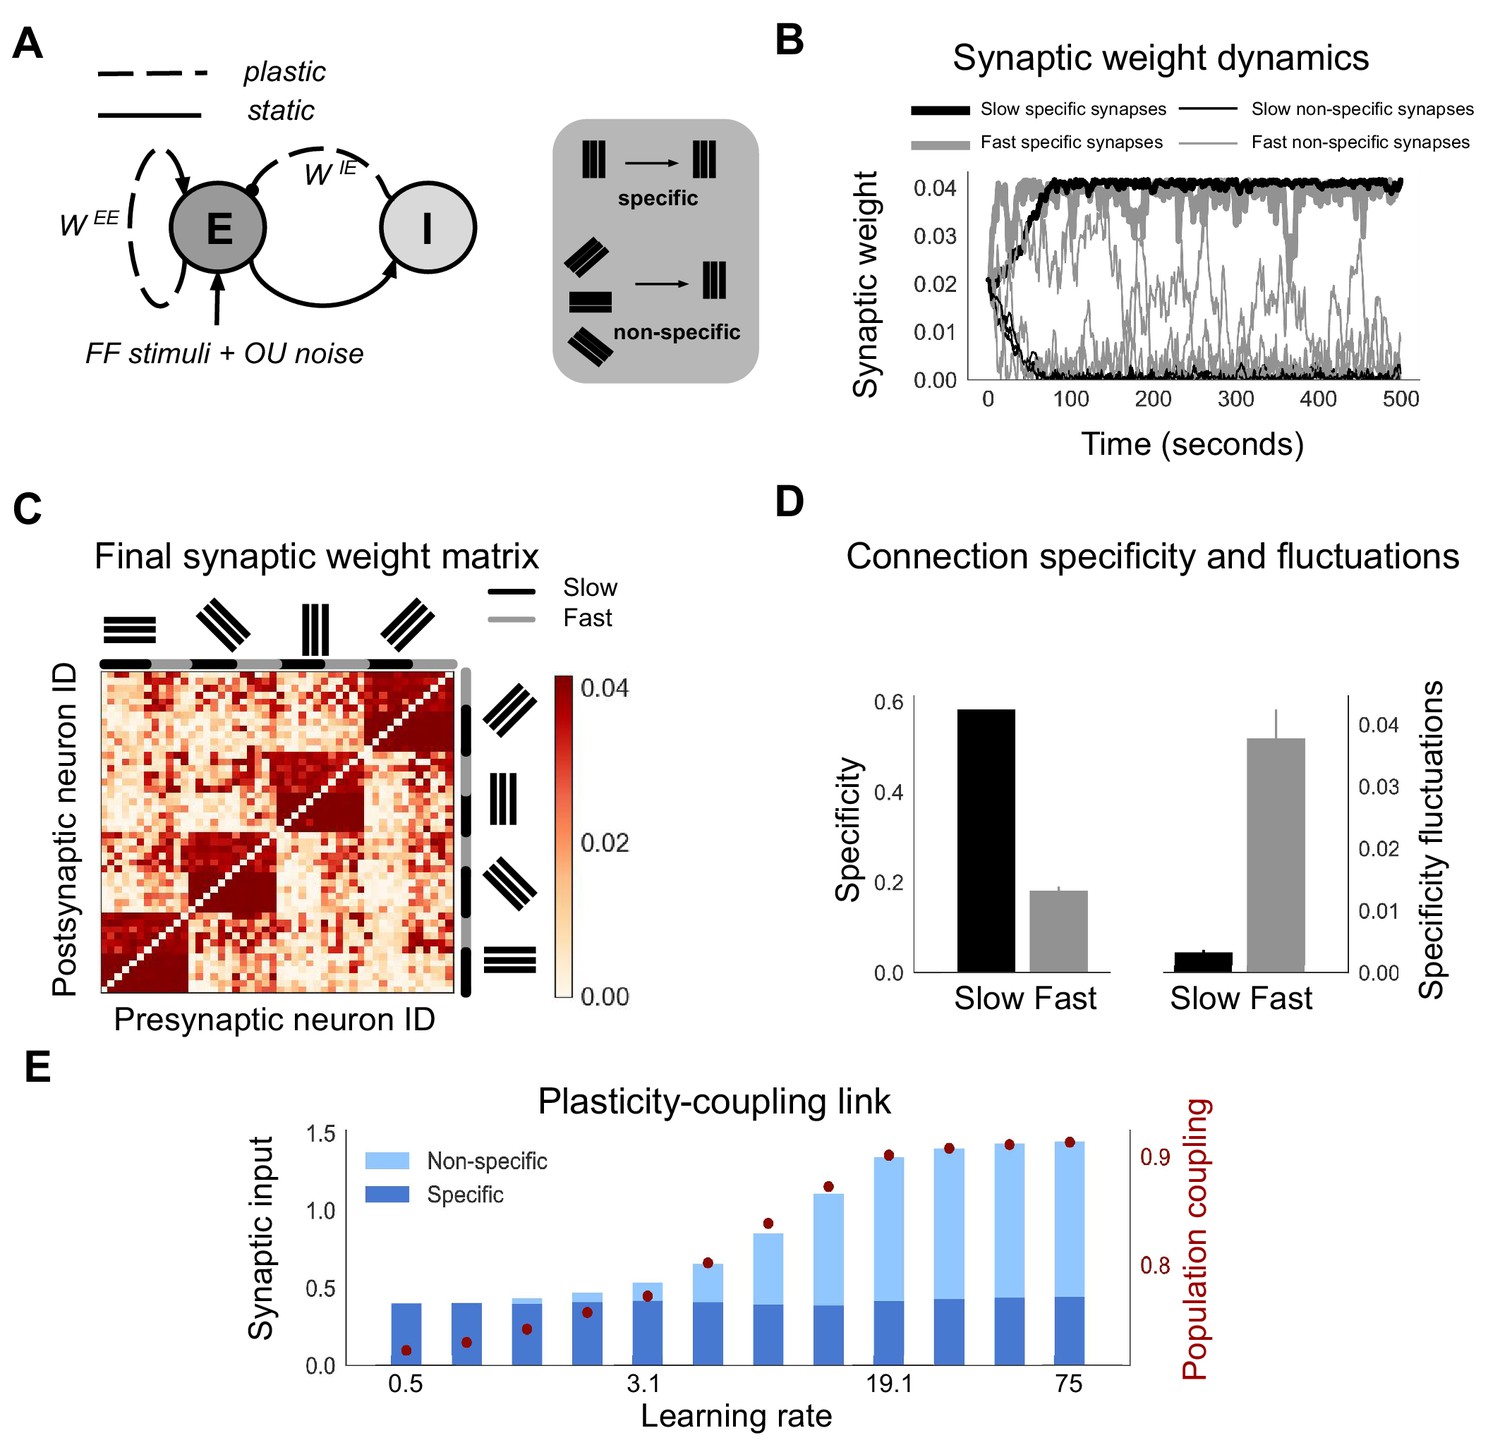
Neurons with fast learning rates develop more non-specific connections, and higher population coupling, than neurons with slow learning rates.
(A) Connection diagram of the recurrent network model with excitatory (E) and inhibitory (I) neurons. Dashed lines denote plastic synapses and solid lines denote static synapses. (B) Synaptic weight dynamics during presentation of random sequences of stimuli to the network. Synaptic inputs onto slow neurons (, gray) and onto fast neurons (, black). Synapses between neurons which share the same feedforward stimulus preference (specific) have solid lines, and synapses between neurons which have different feedforward stimulus preference (non-specific) have dashed lines. (C) Excitatory synaptic weight matrix of the recurrent network after synaptic plasticity. Neuron IDs are organised by feedforward stimulus preference. For each of the four stimulus groups the first six neurons are slow () and the next six neurons are fast (). (D) Connection specificity (ratio of specific to non-specific synaptic input strength) after synaptic plasticity for slow and fast neurons (left), and the standard deviation over time of the connection specificity for slow and fast neurons (right). (E) Amount of non-specific (light blue) and specific (dark blue) synaptic input for neurons in a network with diverse learning rates, as the learning rate of the postsynaptic neuron is varied along a logarithmic scale. Population coupling of neurons with different learning rates (red points).
Figure 1—figure supplement 1
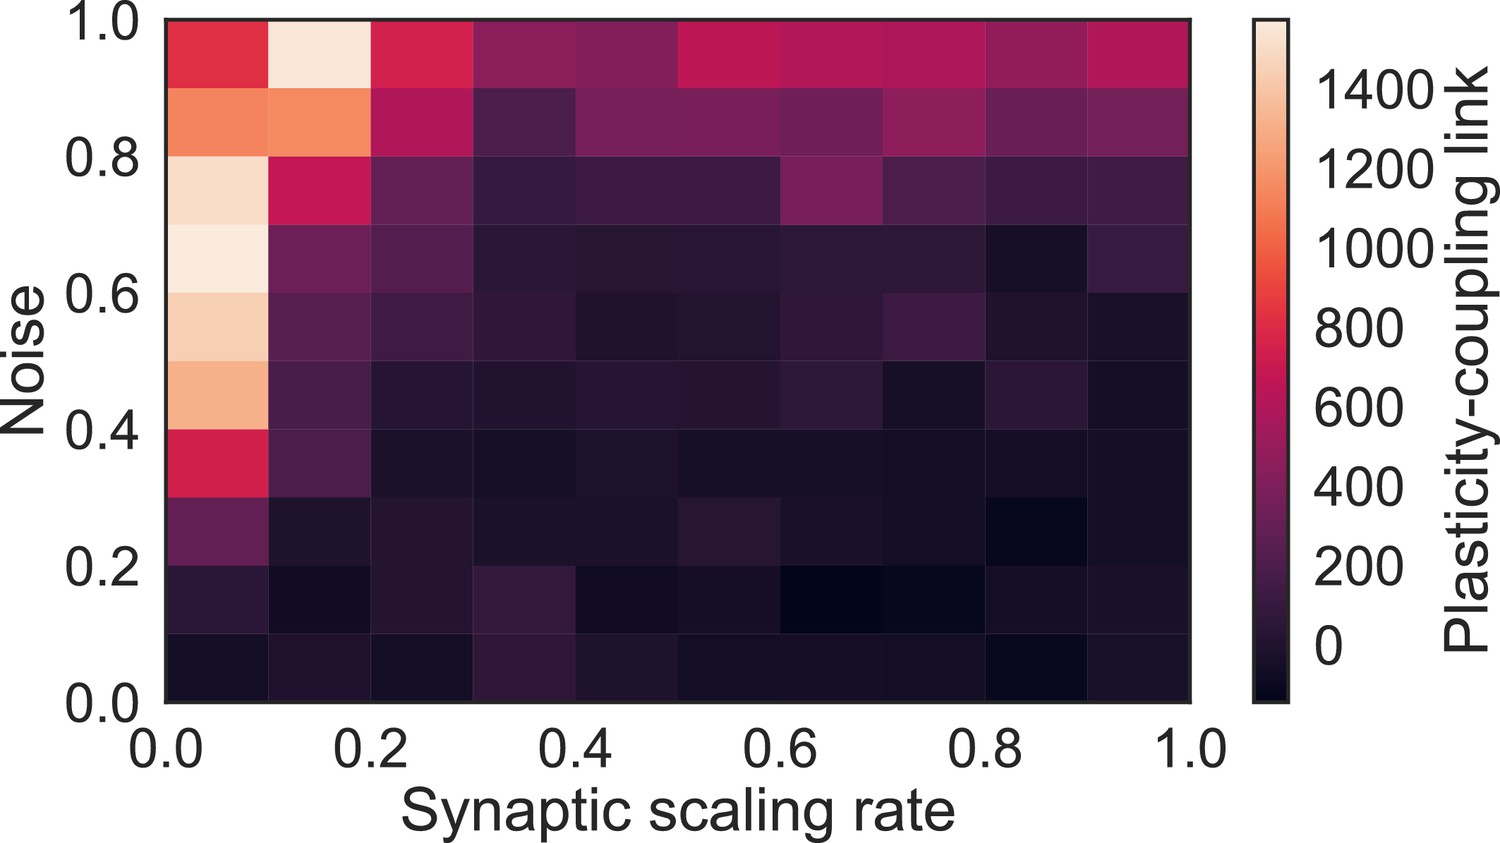
Plasticity-coupling link requires moderate noise and slow synaptic scaling.
The slope of the linear dependence between and population coupling within a network with diverse , for different values of the synaptic scaling rate () and injected noise (). The presence of noise introduces transient correlations across the network which lead to fluctuations of both specific and non-specific synaptic weights. This ensures that non-specific synaptic weights do not all tend towards zero. Likewise, if synaptic scaling is too fast compared with Hebbian plasticity - contrary to experimentally observed timescales (Turrigiano et al., 1998) - then only specific synapses, which share highly correlated inputs, can sustain strong weights while non-specific synapses tend towards zero.
Figure 2 with 1 supplement
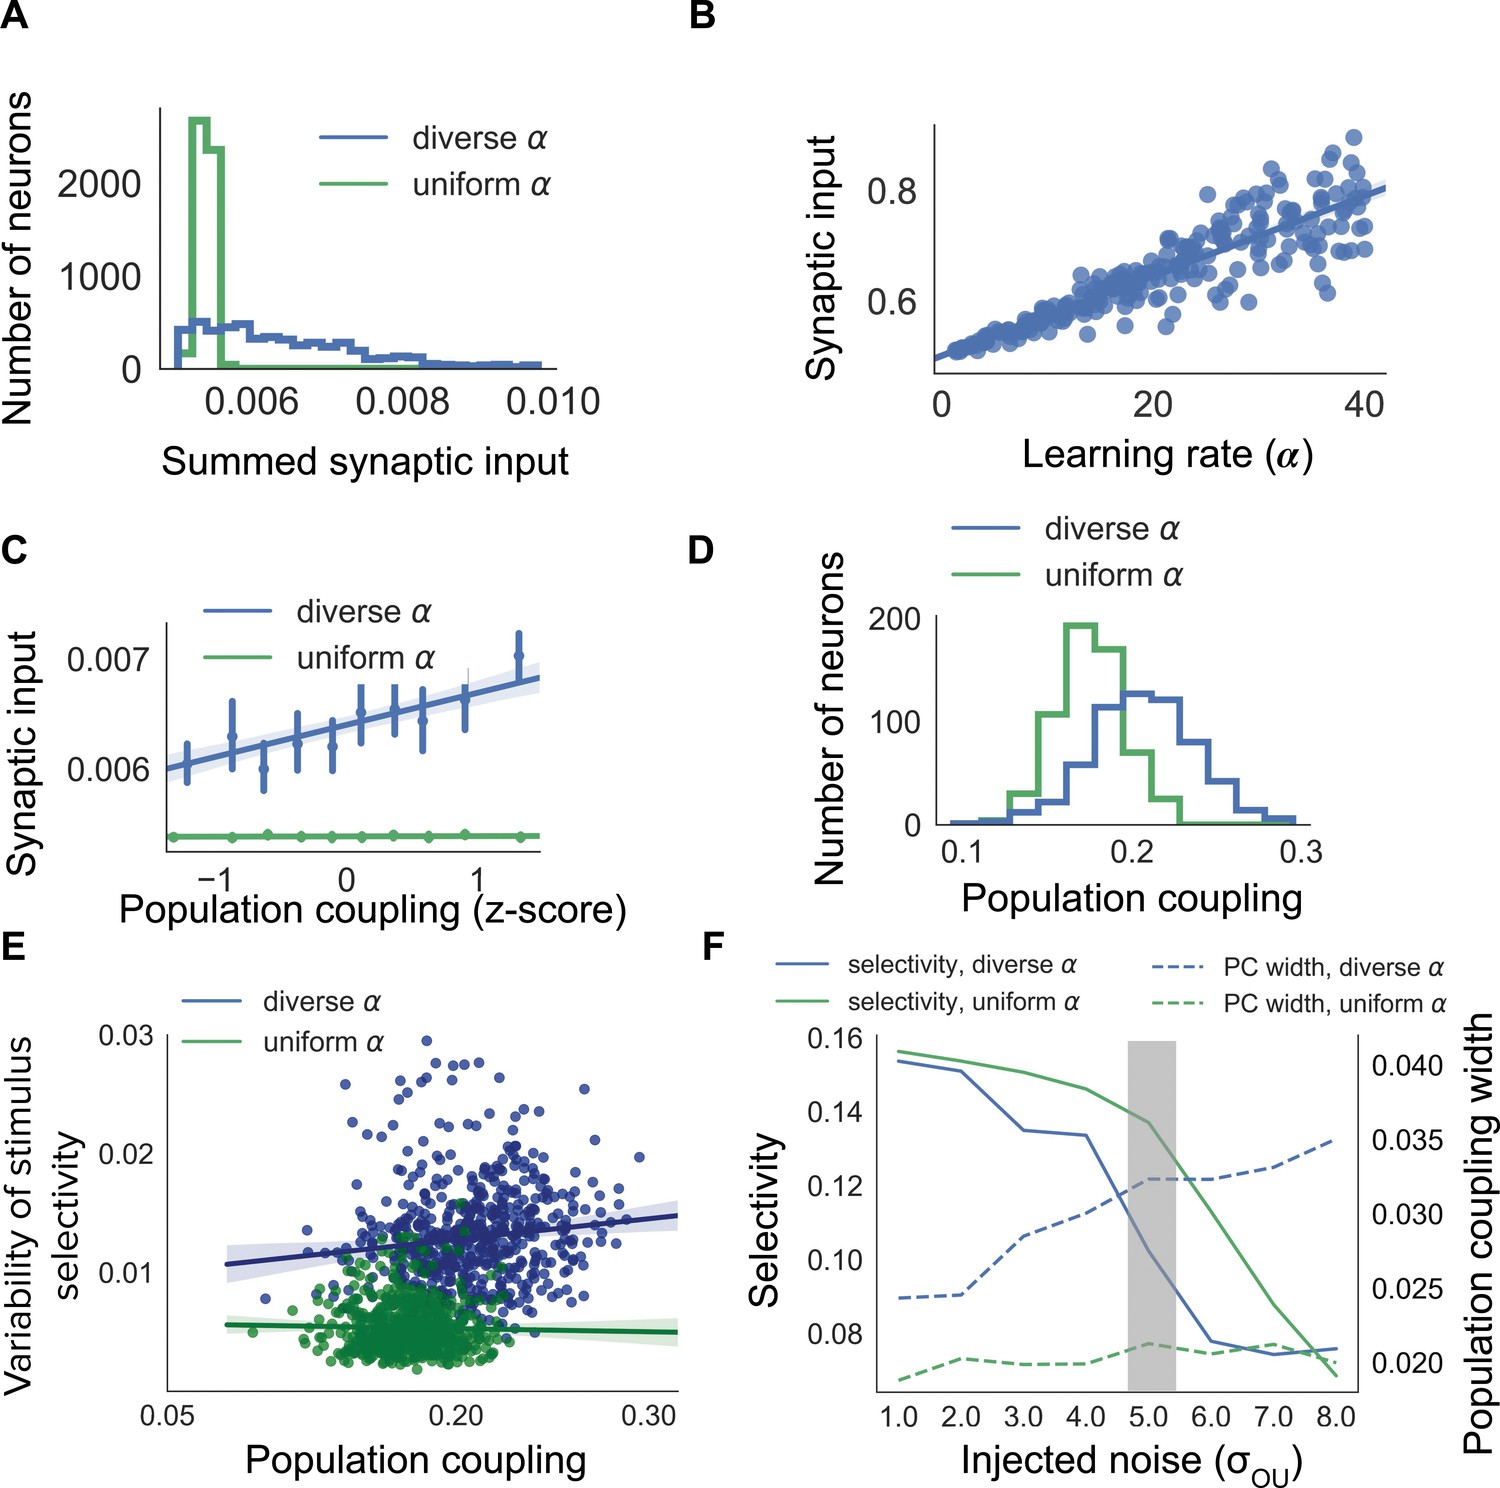
Diverse population coupling from diverse learning rates in a cortical network model.
(A) Distribution of summed synaptic input onto each neuron in networks with diverse learning rates (blue), and networks with uniform learning rates (green) (B) Mean recurrent excitatory synaptic input received by a neuron correlates with its learning rate, . (C) The population coupling of a neuron is correlated with the amount of recurrent synaptic input it receives for the network with diverse learning rates (blue), as opposed to the network with uniform learning rates (green). Error bars for each bin show 95% confidence interval. Lines show linear regression fit for all datapoints (shaded coloured area indicates 95% confidence interval) (D) Diverse population coupling occurs in our recurrent network model. The population coupling distribution is wider for networks with diverse learning rates (blue) compared to networks with uniform learning rates (green, p<1e-5, Levene test). (E) The variability of stimulus selectivity is correlated with population coupling in networks with diverse learning rates (blue, r = 0.18, p=1e-5, Spearman correlation), but not in networks with uniform learning rates (green, p=0.4, Spearman correlation). Lines show linear regression fit for all datapoints (shaded coloured area indicates 95% confidence interval) (F) Dependence of network properties on the amplitude of injected noise (). Stimulus selectivity decreases with increasing for networks with both diverse and uniform learning rates (blue and green lines, respectively). The distribution of population coupling broadens with increasing noise for networks with diverse learning rates, but not for networks with uniform learning rates (blue and green dashed lines, respectively). Panel A-E use (shaded gray area).
Figure 2—figure supplement 1
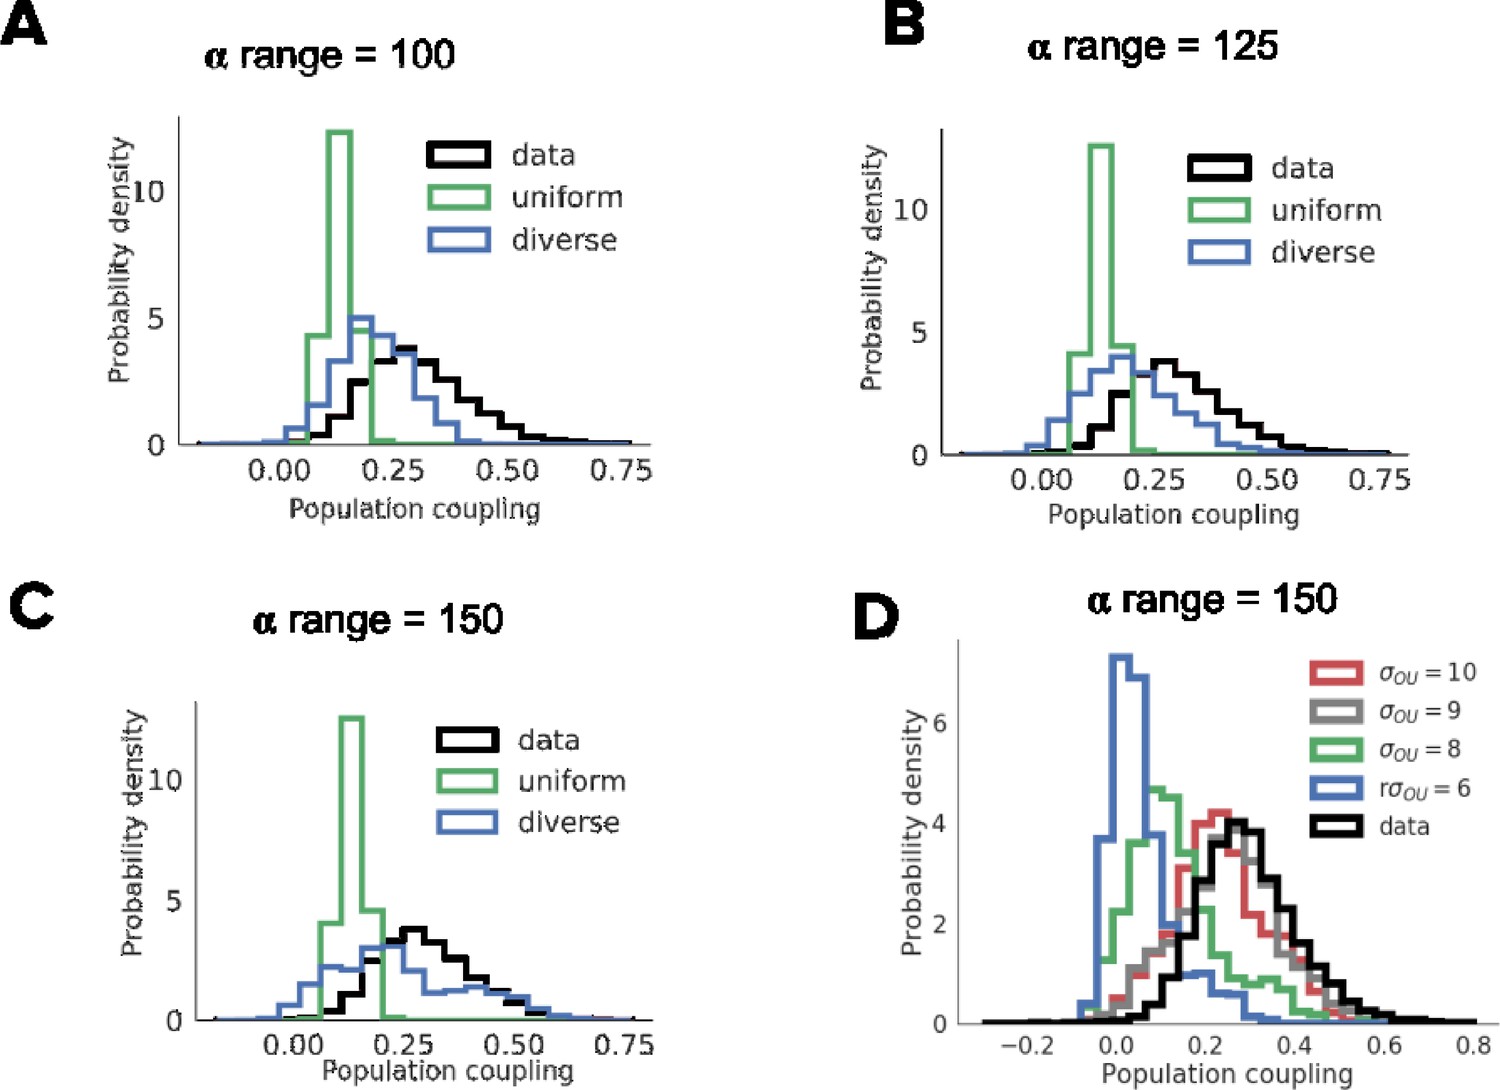
Dependence of the distribution of population coupling on the range of learning rate (A-C) and the amplitude of injected noise (D).
Figure 3 with 4 supplements
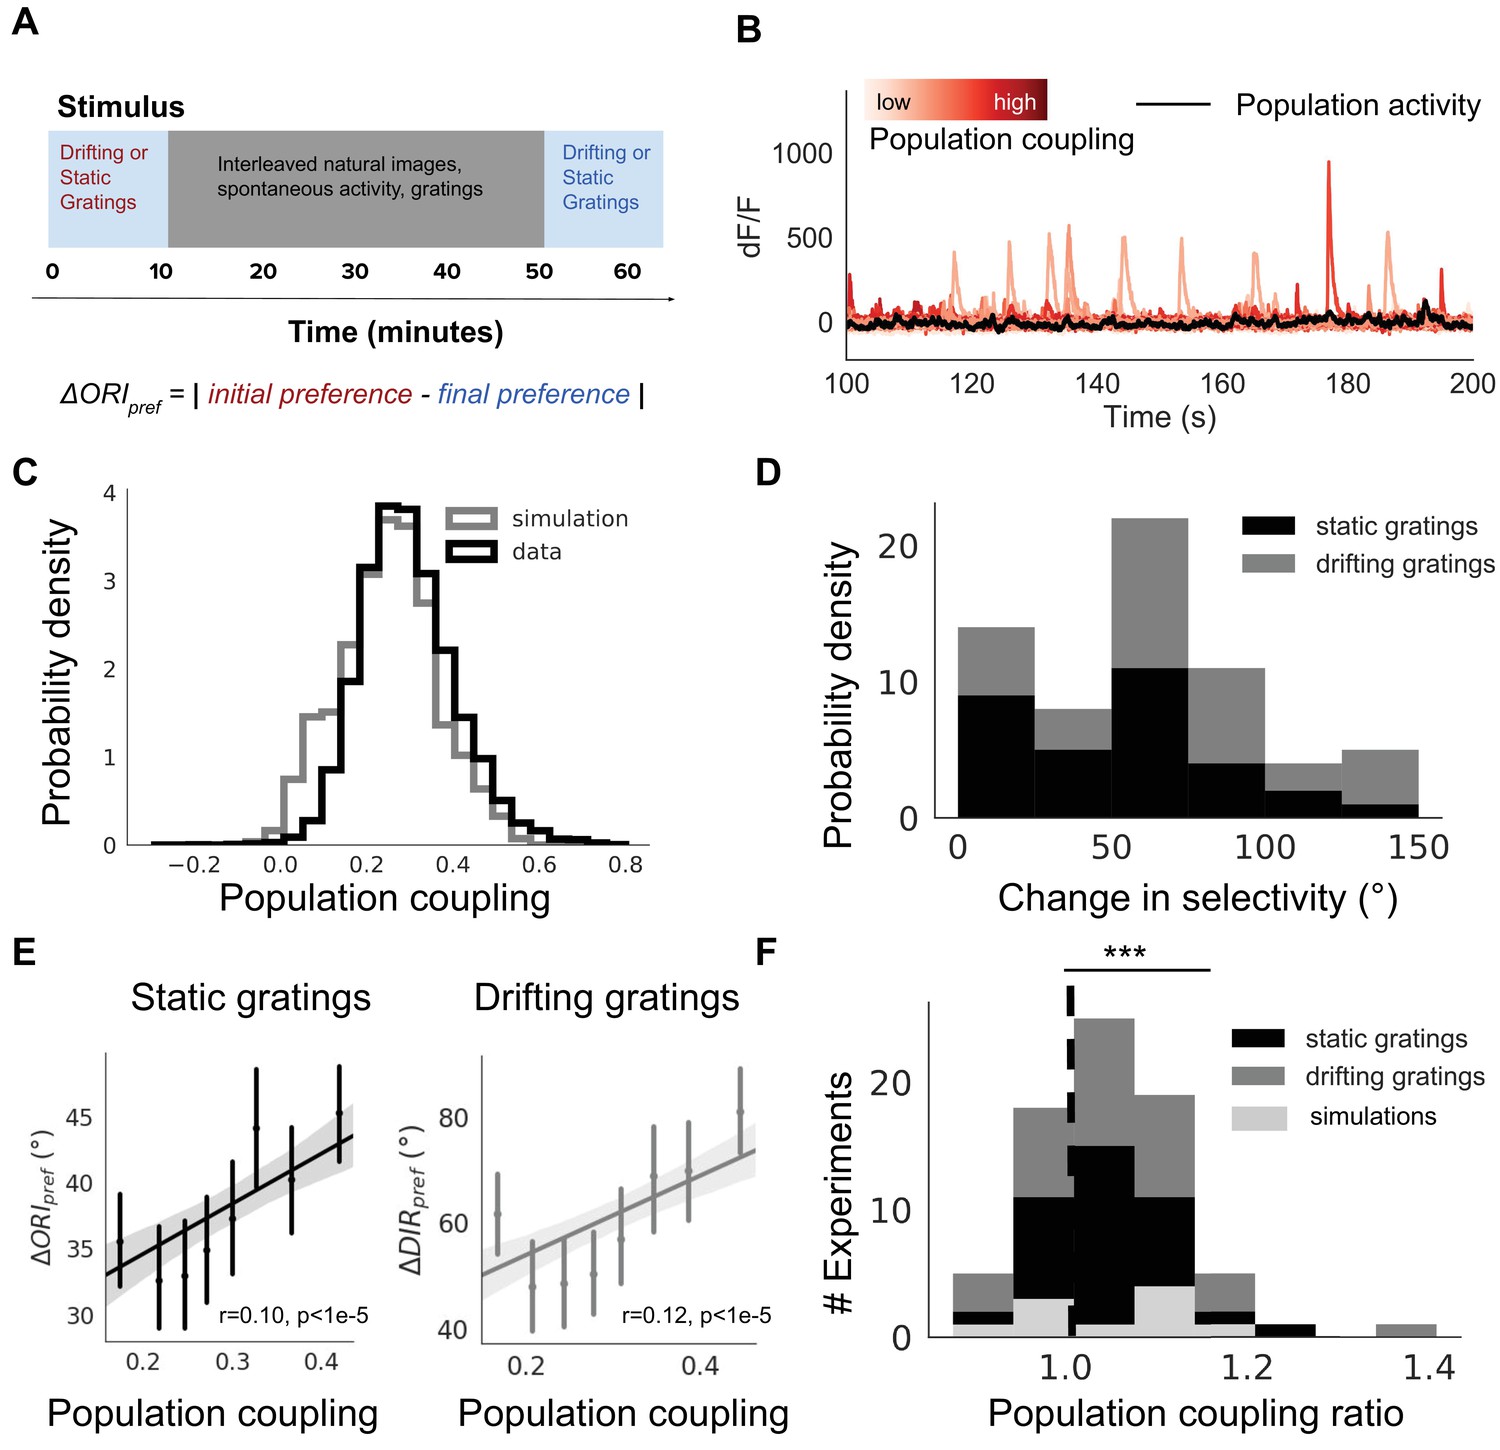
Population coupling is correlated with stimulus response variability in mouse visual cortex in vivo.
(A) Diagram of stimulus and data analysis protocol (B) dF/F calcium fluorescence traces of neurons (red traces) in an example experiment from the Allen Brain Observatory. Mean activity is shown in black, and the population coupling of each neuron is indicated by its colour changing from light to dark red with increased population coupling. (C) The population coupling distribution of all neurons across all experiments (black, 64 experiments, 15,281 neurons) and in simulations (gray, 15 experiments, 3750 neurons). (D) Absolute difference in preferred orientation (black, static gratings, ) and preferred direction (gray, drifting gratings, ) between the beginning and the end of the recording session. (E) (left, black, static gratings) and (right, gray, drifting gratings) are correlated with population coupling. Data shown for all neurons with reliable stimulus responses across all experiments, binned by population coupling. Error bars for each bin show 95% confidence interval. Linear regression fit for all datapoints (shaded gray area indicates 95% confidence interval). (F) Distribution of ratios of the mean population coupling of neurons that change their preferred orientation () or preferred direction () versus mean population coupling of neurons that conserve their preferred orientation () or preferred directions (), for each individual static grating experiment (black), drifting grating (gray) experiment, or network simulation (light gray). Dashed vertical line indicates expected value if a neuron’s orientation or direction preference variability is not dependent on its population coupling (*** p<0.001, one sample t-test).
Figure 3—figure supplement 1
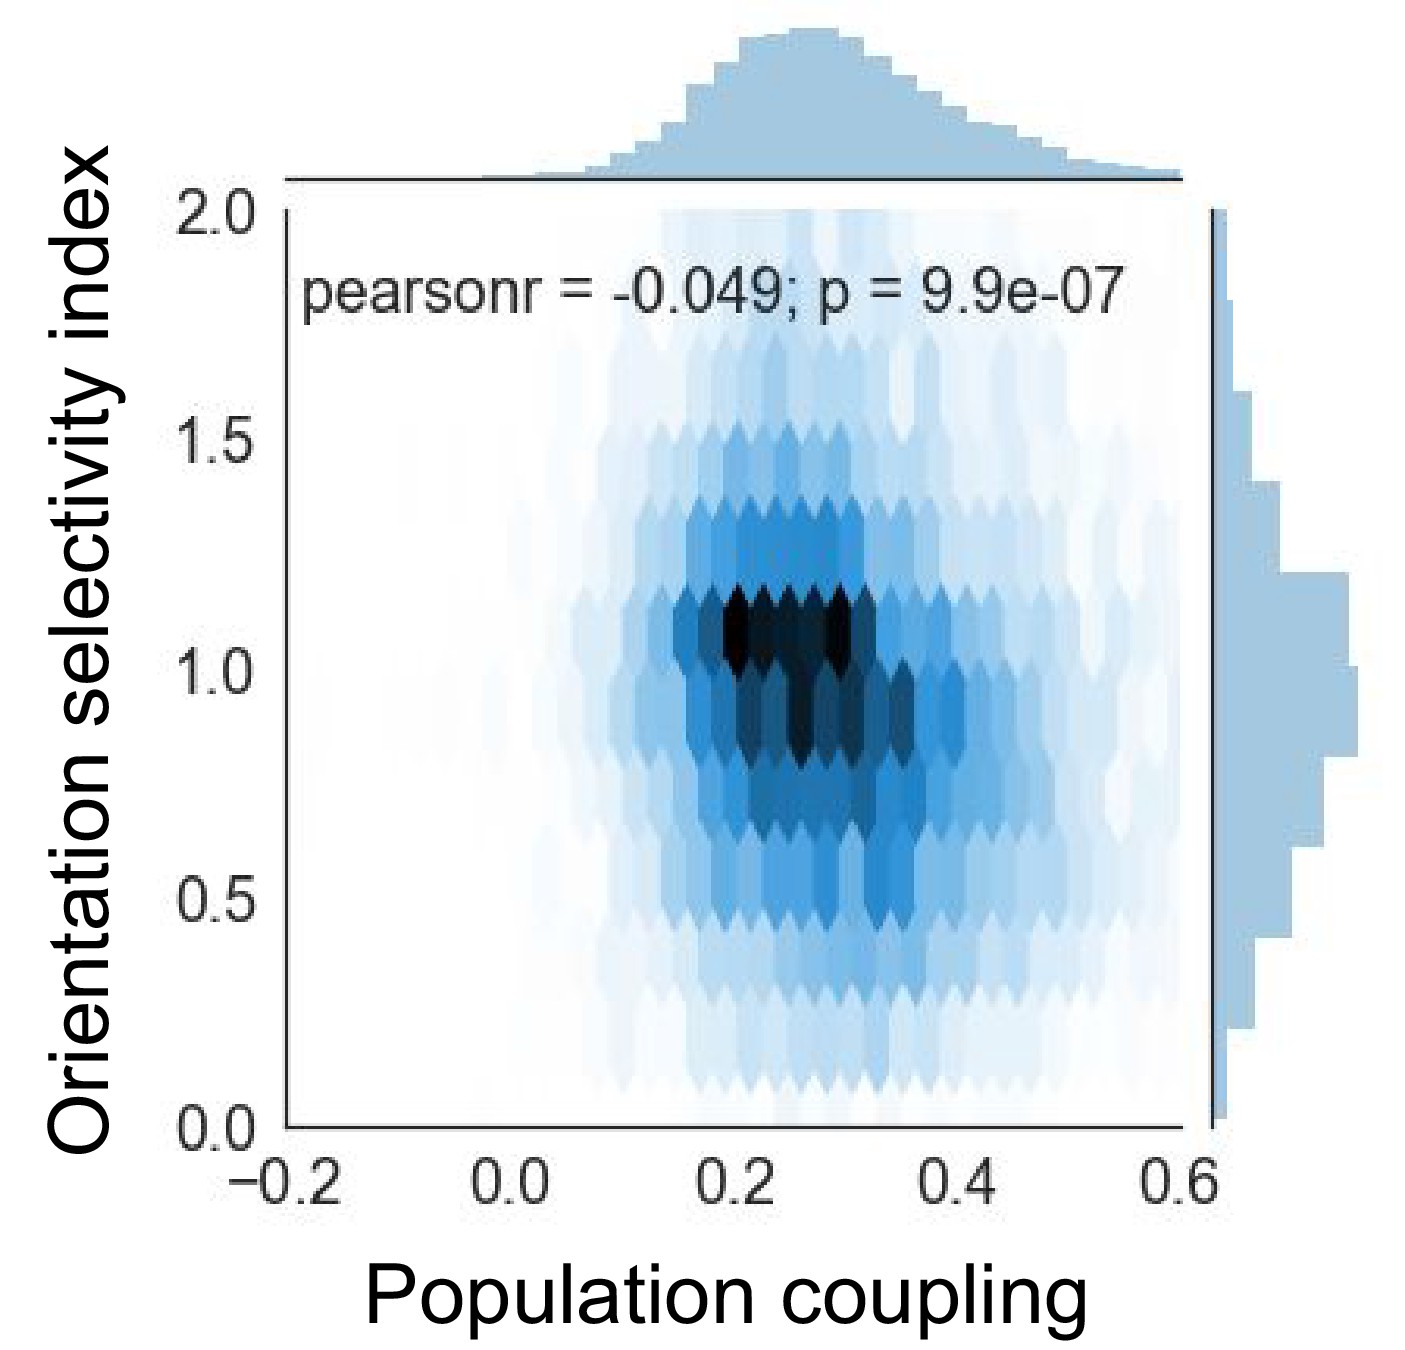
Orientation selectivity index is anti-correlated with population coupling.
Figure 3—figure supplement 2
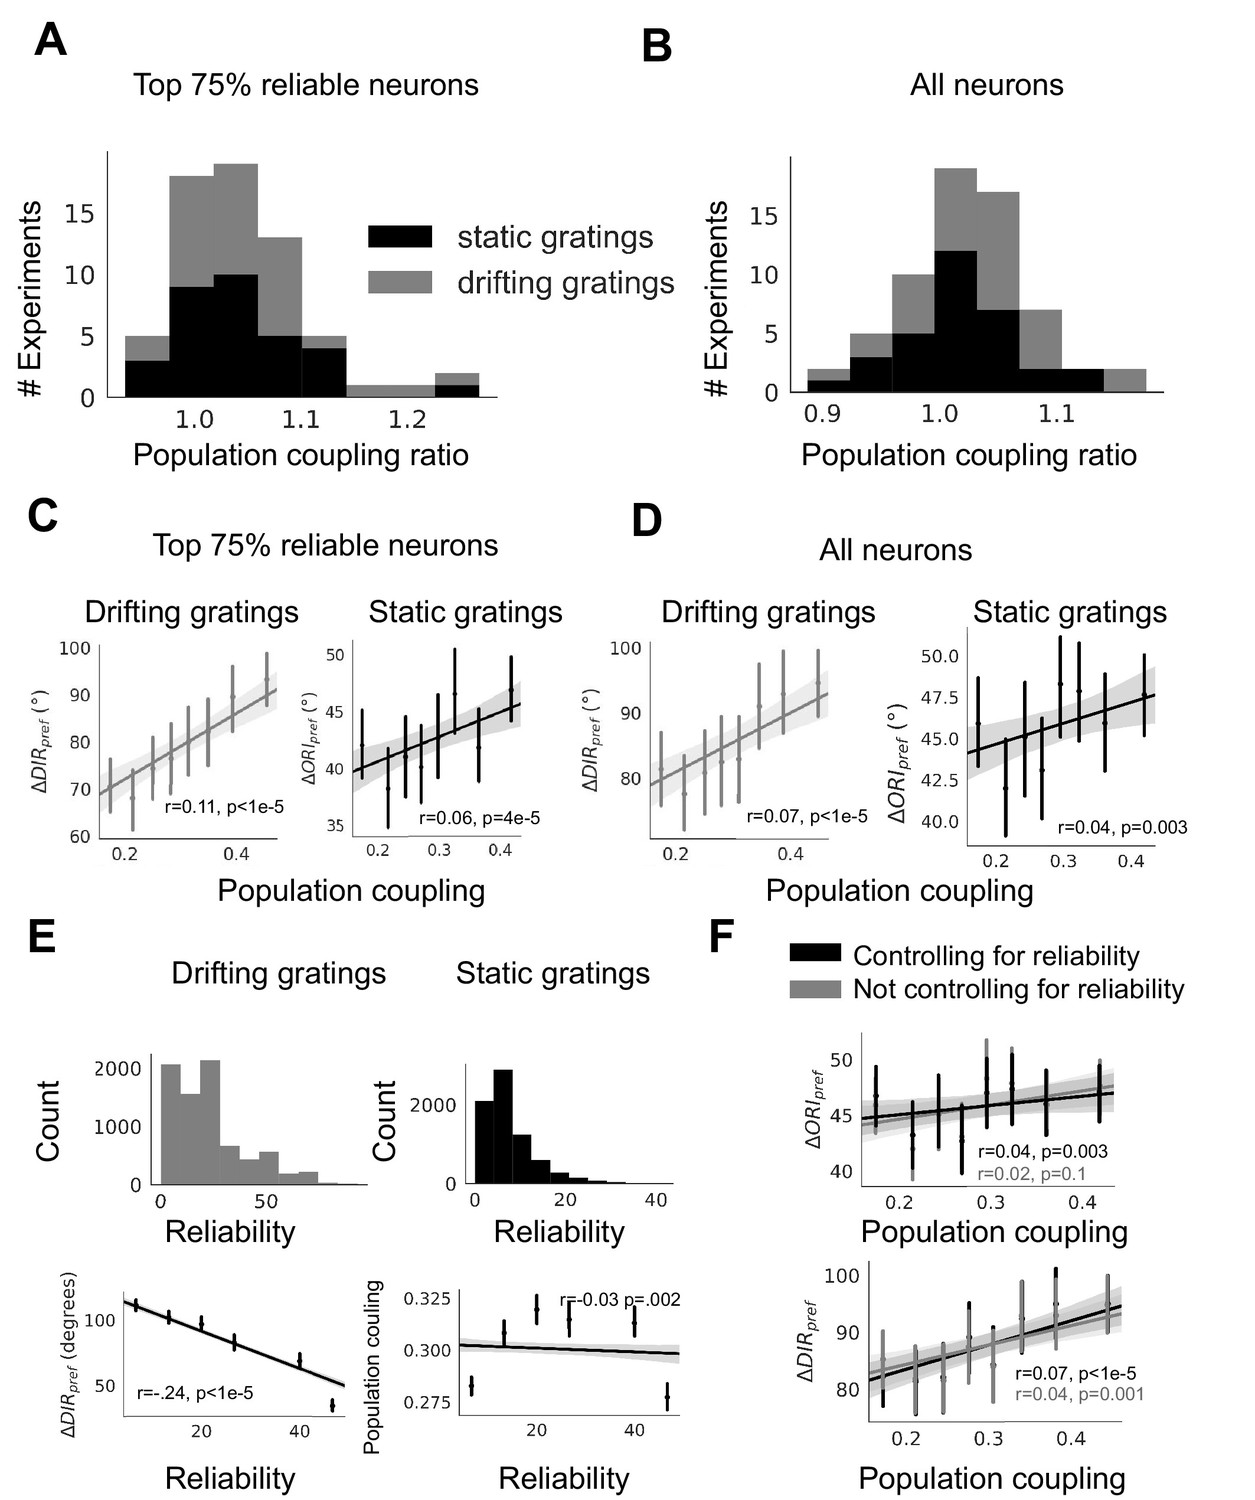
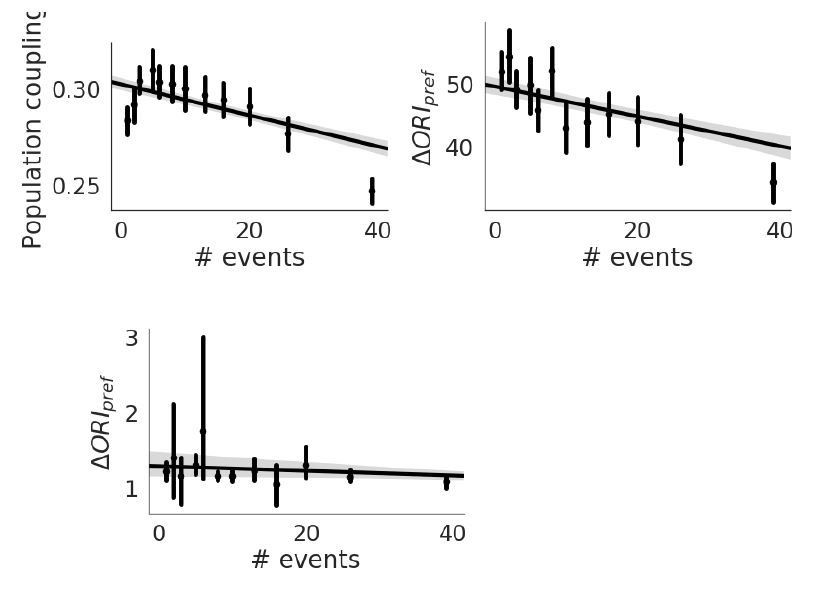
Dependence of plasticity-coupling link on response reliability in ABI experimental data.
(A-B) Ratios of the mean population coupling of neurons that change their preferred orientation or preferred direction versus mean population coupling of neurons that conserve their preferred orientation or preferred directions, for each individual static grating experiment (black) and drifting grating (gray) experiment, for neurons with the top 75% most reliable neurons (A), or for all neurons (B). (C-D) (left, gray, static gratings) and (right, black, drifting gratings) are correlated with population coupling. Data shown for the neurons with the top 75% of stimulus response reliability (C) or for all neurons (D), binned by population coupling. Linear regression fit for all datapoints (shaded gray area indicates 95% confidence interval). (E) (top) Distribution of response reliability for all neurons across all drifting grating (gray, left) and static grating (black, right) experiments. (bottom) Relationship between response reliability and change in direction selectivity () (left) and population coupling (right). (F) Relationship between population coupling and (top) or (bottom), when response reliability is regressed out as a potentially confounding factor.
Figure 3—figure supplement 3
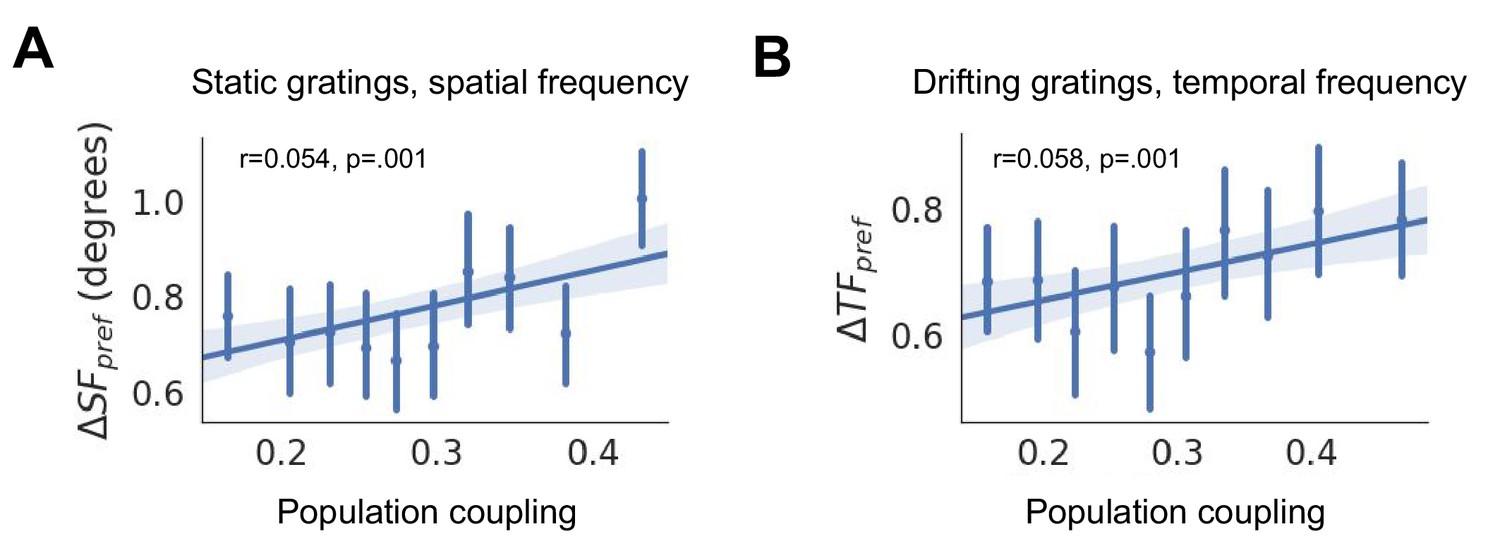
Changes in spatial frequency selectivity (, (A)) and temporal frequency selectivity (, (B)) are correlated with population coupling.
Figure 3—figure supplement 4

Potentially confounding factor.
(A) Changes in direction selectivity versus direction selectivity index (DSI). (B) Population coupling versus direction selectivity index (DSI). (C) Changes in direction selectivity versus mean calcium fluorescence. (D) Changes in direction selectivity versus peak calcium fluorescence. (E) Relationship between population coupling and (blue), and when DSI is regressed out as a potentially confounding factor (black). (F) Relationship between population coupling and (blue), and when peak calcium fluorescence is regressed out as a potentially confounding factor (black).
Figure 4
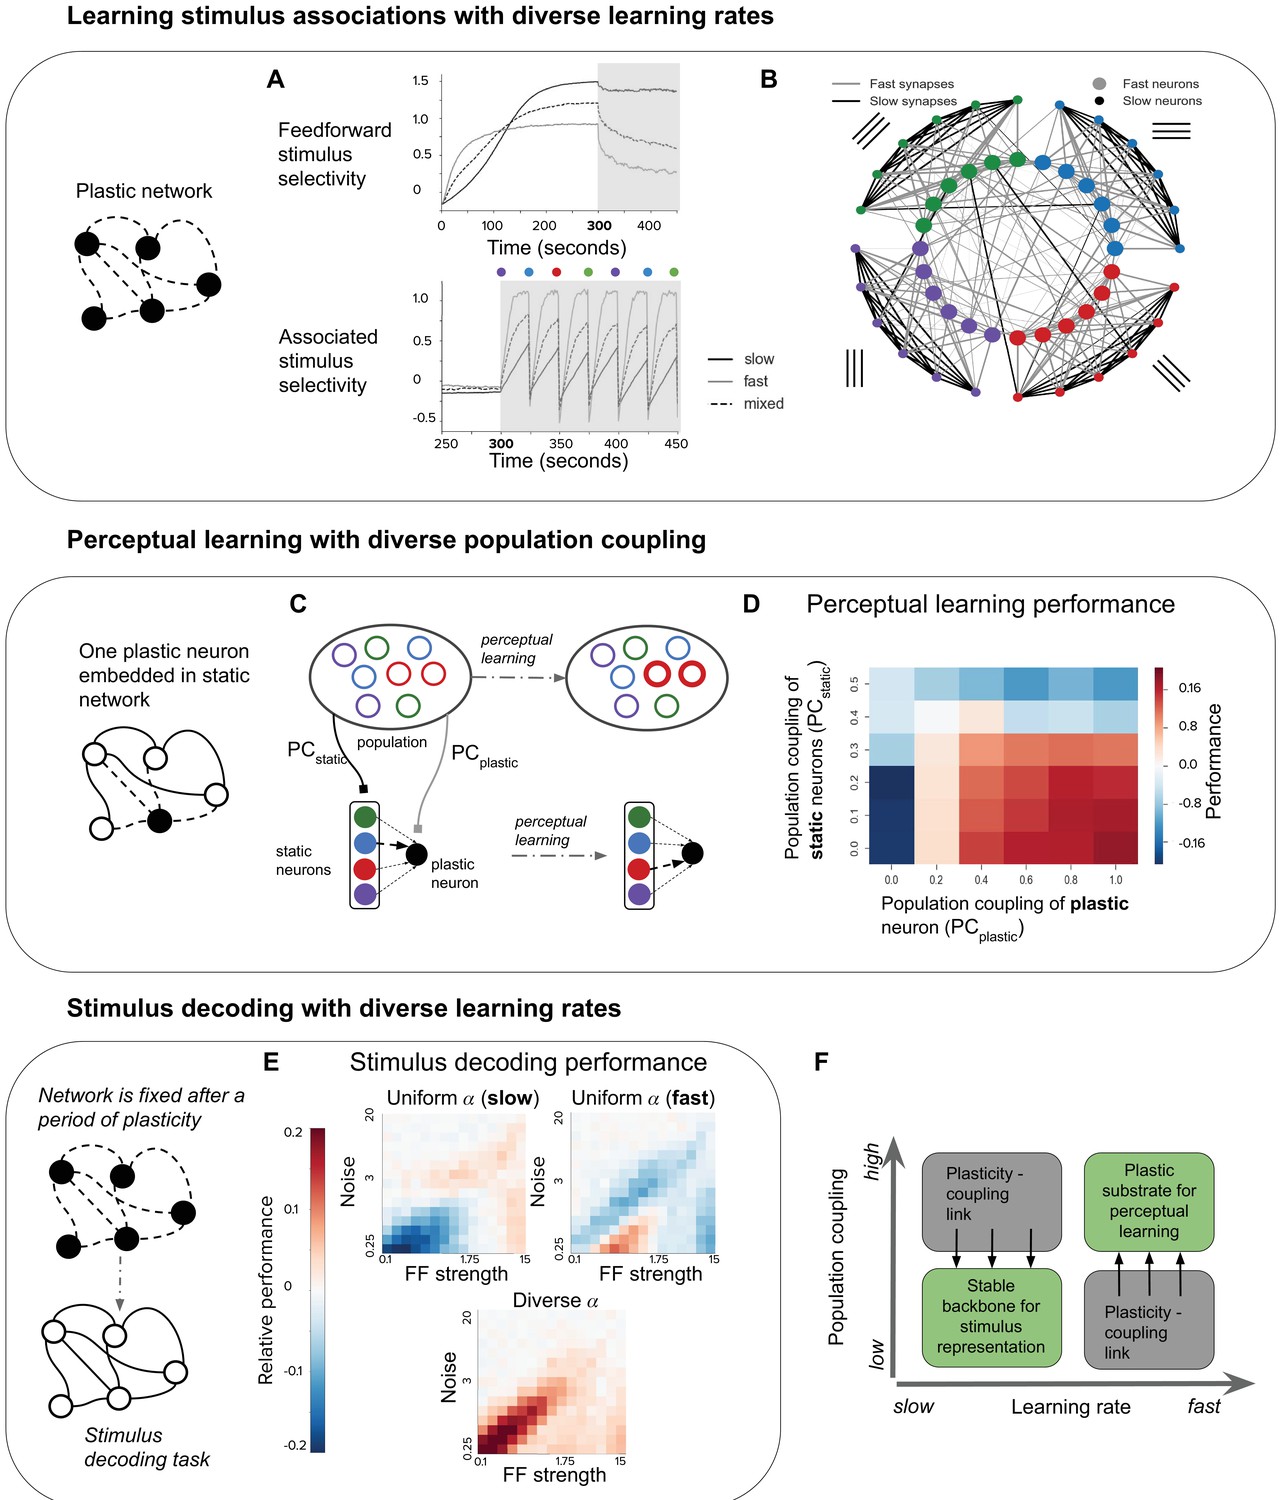
Plasticity-coupling link enables both robust stimulus representation and a flexible substrate for perceptual learning.
(A) The evolution of mean selectivity to the feedforward stimulus (top) and a stimulus associated with an additional external input (bottom) in networks composed either entirely of neurons with slow (black), fast (gray), or a mix of both fast and slow (dashed black). Shaded gray region indicates when the additional external input is present, and the coloured circles indicate the stimulus the external input is associated with at that time (this switches every 25 s) (B) Synaptic connectivity after plasticity for a network of neurons with slow (small circles) or fast (large circles) learning rates. Neurons in the network receive input selective to 1 of 4 possible stimuli (colour denotes stimulus preference). Synaptic inputs onto fast neurons and slow neurons are coloured gray and black respectively. The spatial organisation of neurons is for visualisation purposes only. (C–D) Investigating the impact of population coupling on perceptual learning. (C) Coupling of either the plastic neuron or static neurons to the population is set by adjusting and respectively. Perceptual learning is simulated through an additional external input whenever the preferred stimulus of the red neurons is present. This leads to the predominant synaptic weight onto the plastic neuron (black) switching from the neuron with the same original preferred stimulus (blue) to the neuron with the associated preferred stimulus (red). (D) Amount of perceptual learning which occurs at the plastic neuron, as the population coupling of either the plastic neuron (, x-axis) or static (, y-axis) is varied. Perceptual learning is quantified by the ratio of the red synaptic weight (associated stimulus) to the blue synaptic weight (original preferred stimulus of the plastic neuron) after plasticity. Red regions () indicate successful perceptual learning, and occur only when is high and is low. (E) Relative stimulus decoding performance of fixed recurrent networks after a period of plasticity in order to develop the network. Networks were developed using either entirely neurons with fast learning rates, slow learning rates, or a 50/50 mix of both learning rates. The feedforward stimulus strength (x-axes) and noise (y-axes) were varied along a logarithmic scale. (F) Illustration of the synergistic effect of the plasticity-coupling link on perceptual learning. The plasticity-coupling link ensures that slow neurons have low population coupling and fast neurons have high population coupling, which panel D demonstrates is necessary for perceptual learning.
Author response image 1
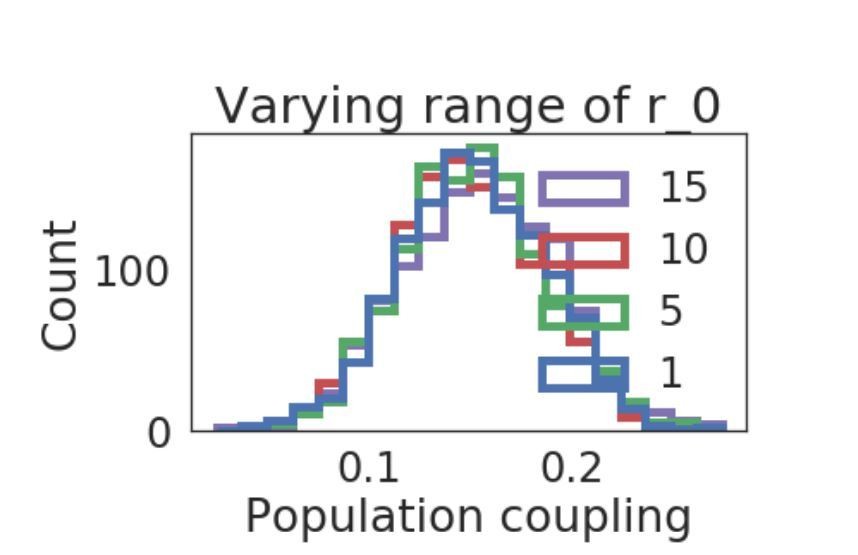
Distribution of population coupling in network simulations as we vary the range of the uniform baseline firing rate distribution, from 1 to 15.
Author response image 2
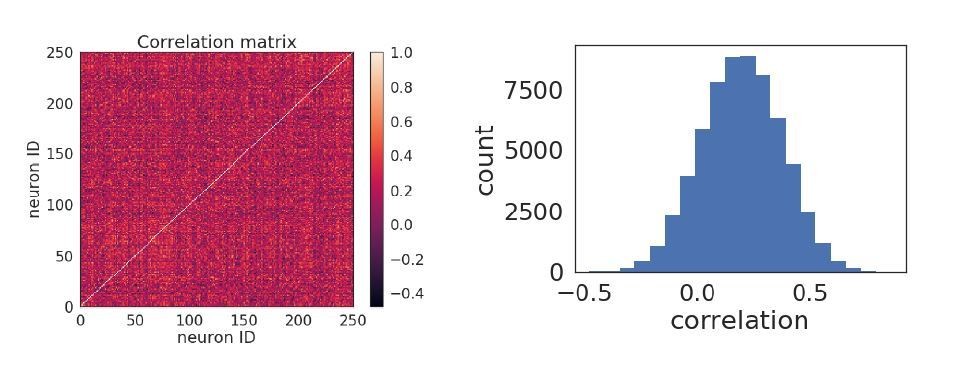
Pairwise correlations.
Author response image 3
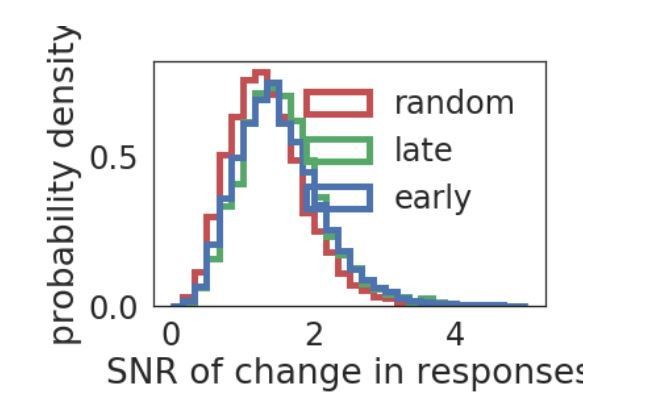
Distribution of SNR.
Author response image 4
Population Coupling.
Tables
Table 1
Simulation Parameters.
| 8.0 | 1.0 | 20.0 | 5.0 | ||||
| Hz | Hz | Hz | |||||
| 0.042 | 50 | 0.75 | |||||
| 1 | 10 ms | 0.5wmax | 0.2 |
Additional files
Download links
A two-part list of links to download the article, or parts of the article, in various formats.
Downloads (link to download the article as PDF)
Open citations (links to open the citations from this article in various online reference manager services)
Cite this article (links to download the citations from this article in formats compatible with various reference manager tools)
Population coupling predicts the plasticity of stimulus responses in cortical circuits
eLife 9:e56053.
https://doi.org/10.7554/eLife.56053


