The palmitoyl acyltransferase ZDHHC14 controls Kv1-family potassium channel clustering at the axon initial segment
- Shriners Hospitals Pediatric Research Center, Lewis Katz School of Medicine at Temple University, United States
- Department of Physiology and Neurobiology, University of Connecticut, United States
- Department of Anatomy and Cell Biology, Lewis Katz School of Medicine at Temple University, United States
Figures
Figure 1 with 4 supplements
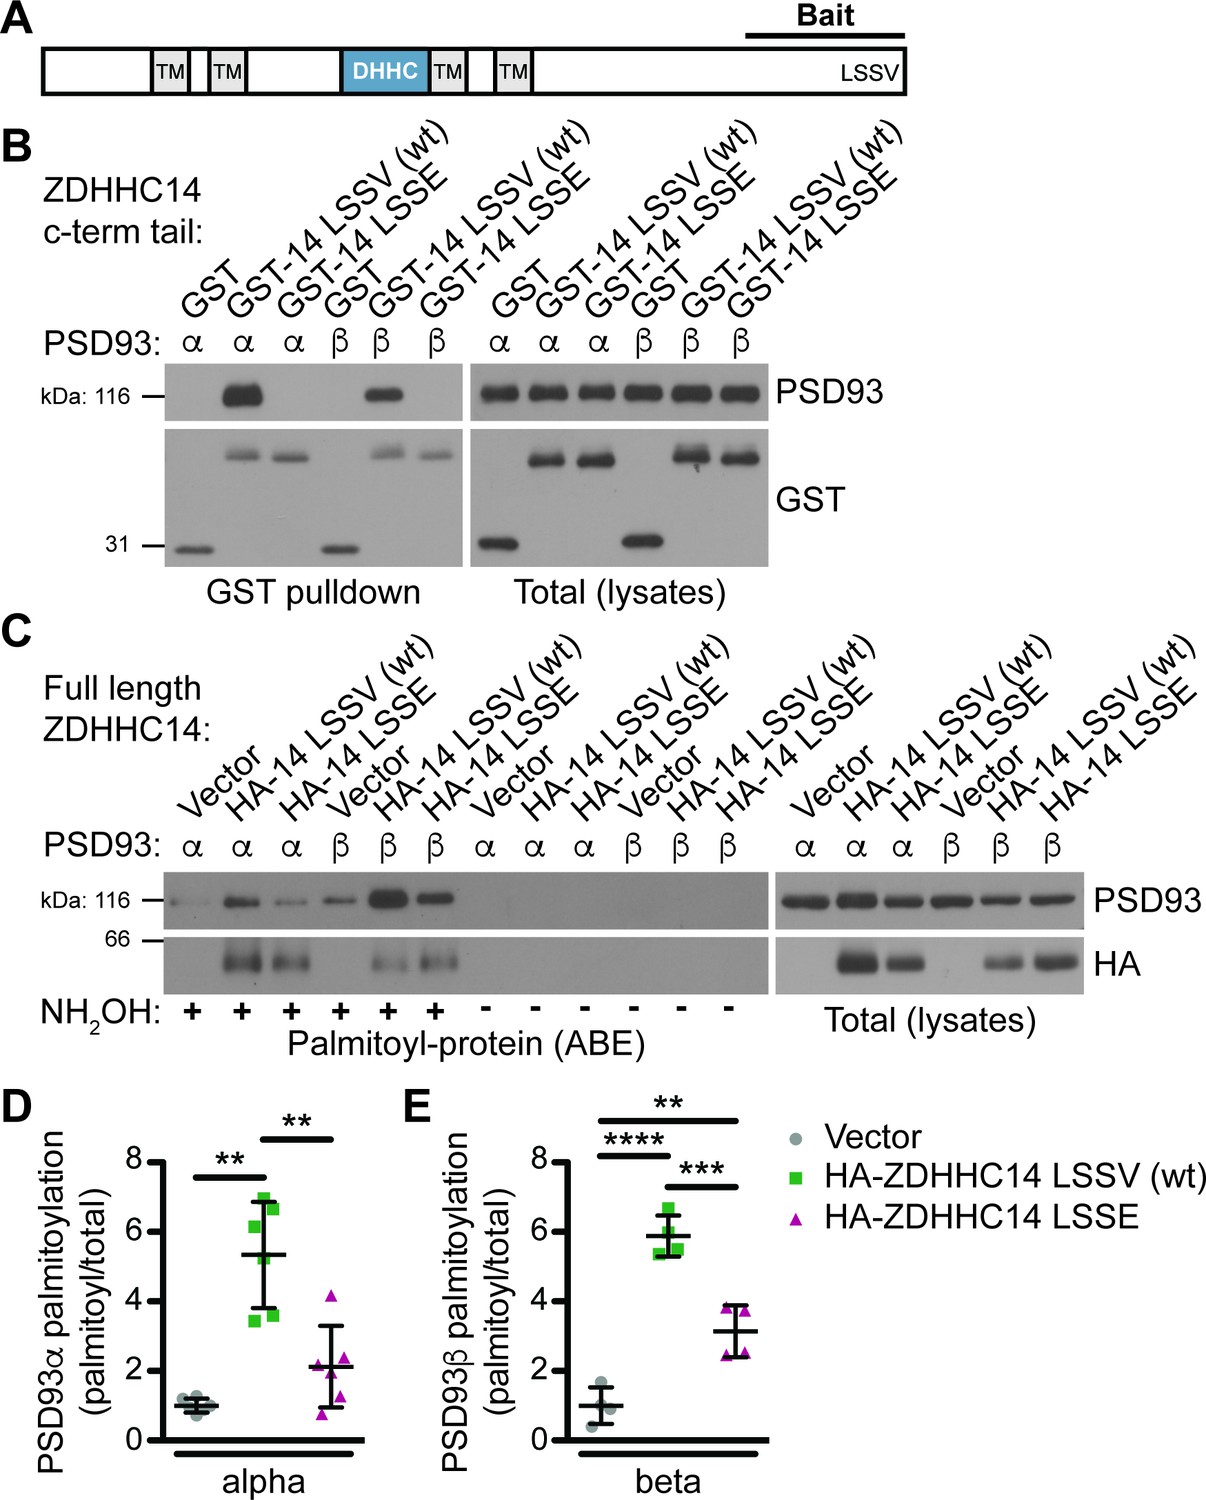
ZDHHC14 interacts with and palmitoylates both palmitoylated isoforms of PSD93 but more robustly palmitoylates PSD93β.
(A) Schematic of ZDHHC14 showing predicted transmembrane domains (TM, gray boxes), DHHC cysteine rich catalytic domain (blue box) and the C-terminal region used for yeast 2-hybrid screening (Bait), including the LSSV motif. (B) HEK293T cells were transfected with the indicated constructs and lysates subjected to GST-pulldown. Eluates from pulldowns were immunoblotted to detect GST (bottom, left) and PSD93 (top, left). Total expression levels of GST-tagged proteins (bottom, right) and PSD93 (top, right) in parent lysates were also determined. Images are representative of three independent experiments. (C) HEK293T cells were transfected with the indicated constructs and palmitoyl-proteins (isolated by ABE; left panels) and total protein levels (in parent lysates; right panels) were assessed by western blotting with the indicated antibodies. Parallel samples processed in the absence of the key ABE reagent hydroxylamine (NH2OH) confirm the specificity of the ABE assay. (D) Quantified PSD93α palmitoyl:total levels from C, normalized to the empty vector condition (Welch’s 1-way ANOVA p=0.0008, W(2,6.98) = 23.80, N = 6; Dunnett’s T3 multiple comparison post hoc test **p<0.01, 95% CI vector versus wtZDHHC14 [−6.91,–1.77], vector versus ZDHHC14 LSSE [−3.10, 0.86], and wtZDHHC14 versus ZDHHC14 LSSE [0.60, 5.83]). (E) Quantified PSD93β palmitoyl:total levels from C, normalized to the empty vector condition (1-way ANOVA p<0.0001, F(2,9)=60.69, N = 4; Bonferroni post hoc test **p<0.01, ***p<0.001, ****p<0.0001, 95% CI vector versus wtZDHHC14 [−6.18,–3.56], vector versus ZDHHC14 LSSE [−3.44,–0.84], and wtZDHHC14 versus ZDHHC14 LSSE [1.44, 4.04]). Uncropped western blot images are in Figure 1—figure supplement 4.
-
Figure 1—source data 1
Source data for Figure 1D and Figure 1—figure supplement 3.
- https://cdn.elifesciences.org/articles/56058/elife-56058-fig1-data1-v2.xlsx
Figure 1—figure supplement 1
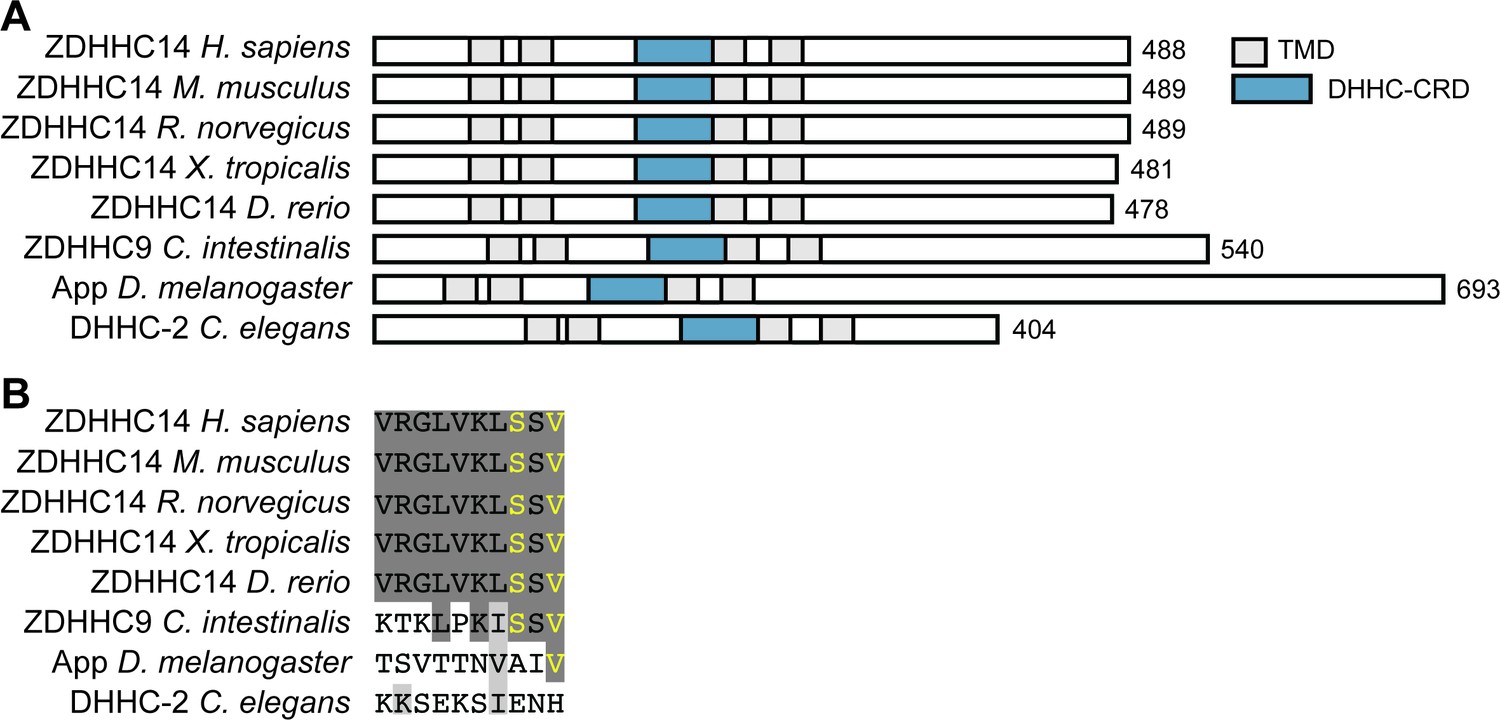
The PDZ ligand of ZDHHC14 is highly conserved in vertebrates.
(A) Schematics of domain organization of ZDHHC14 orthologs, including human ZDHHC14 (Homo sapiens; NP_078906.2), mouse ZDHHC14 (Mus musculus; NP_666185.3), rat ZDHHC14 (Rattus norvegicus; NP_001034432.1), western clawed frog ZDHHC14 (Xenopus tropicalis; XP_004914695.1), Zebrafish ZDHHC14 (Danio rerio; XP_005160409.1), sea squirt ZDHHC9 (Ciona intestinalis; XP_002127630.1), fruit fly Approximated (App; Drosophila melanogaster; NP_001137937.1) and roundworm DHHC-2 (Caenorhabditis elegans; NP_0493007.2). Predicted transmembrane domains are shown in gray boxes (TMD) and the DHHC cysteine-rich catalytic domain is shown in a blue box (DHHC-CRD). (B) Sequence alignment of the 10 C-terminal amino acids of ZDHHC14 orthologs from A reveals a PDZ ligand only in vertebrates and simple chordate lineages. PDZ-ligand consensus amino acids are in yellow, completely conserved amino acids are highlighted in dark gray, and functionally conserved amino acids in light gray. C. intestinalis and C. elegans orthologs were identified based on homology of their respective DHHC-CRDs with mammalian ZDHHC14. A more limited version of this alignment was shown in Thomas and Hayashi, 2013a.
Figure 1—figure supplement 2
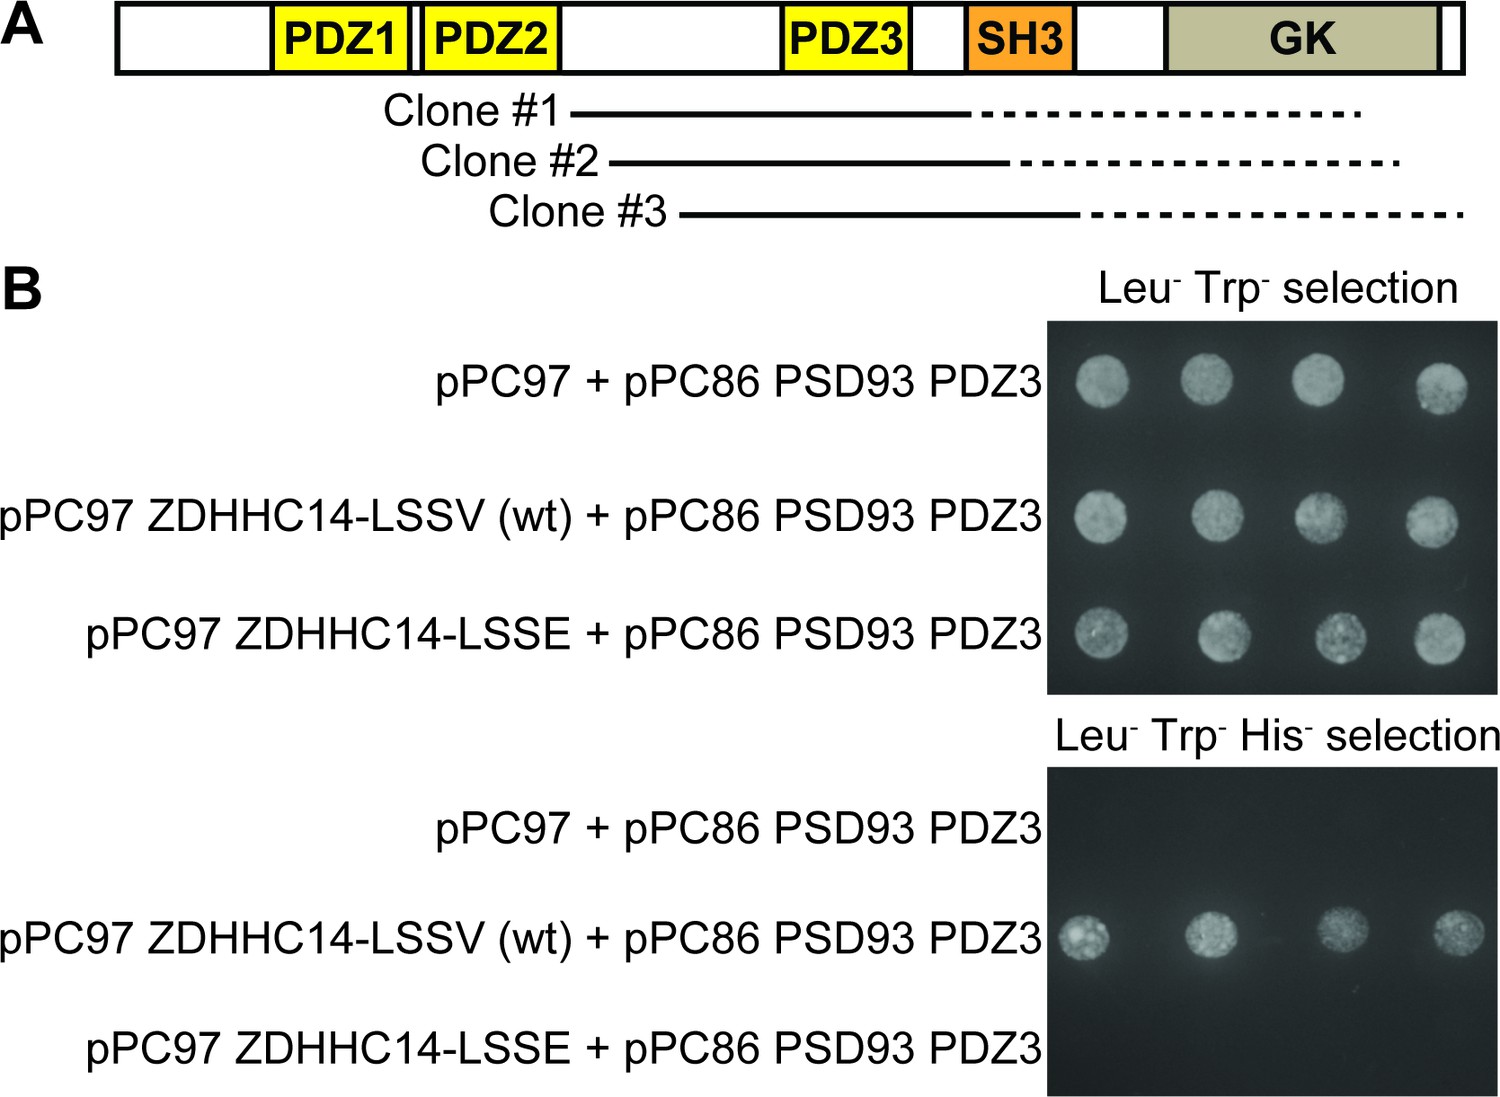
Further Yeast Two-Hybrid analysis suggests that the ZDHHC14 C-terminus binds the third PDZ domain of PSD93.
(A) Schematic of the domain organization of PSD93 showing PDZ domains (yellow boxes), SH3 domain (orange box), and guanylate kinase (GK) domain (light brown). Solid lines: regions of the three unique ‘hit’ PSD93 cDNA clones confirmed by DNA sequencing. Restriction digest analysis suggested that each ‘hit’ insert was approx.1.5kb in length and thus likely extended into the GK region of PSD93. (B) Growth of four re-spotted individual yeast colonies on media selecting for presence of ‘bait’ (pPC97) and ‘prey’ (pPC86) plasmids (Leu- Trp-, upper panel) or presence of ‘bait’ and ‘prey’ plasmids and ‘bait’-‘prey’ protein–protein interaction (Leu- Trp- His-, lower panel), after HF7C yeast were back-transformed with the indicated ‘bait’ vectors and a ‘prey’ vector containing the third PDZ domain (PDZ3) of PSD93. Wild type ZDHHC14 directly interacts with PSD93-PDZ3 but a ZDHHC14 with a mutated PDZ ligand (LSSE) does not.
Figure 1—figure supplement 3
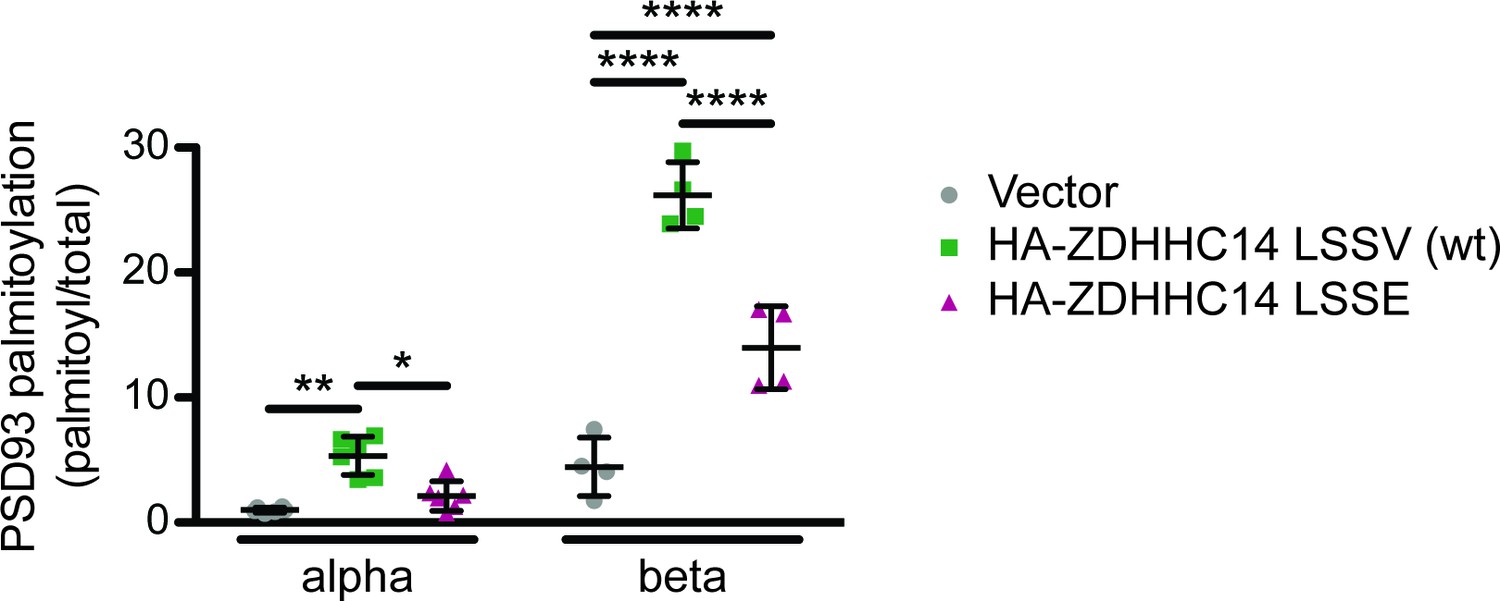
Further analysis of palmitoylation:total levels of PSD93α and PSD93β with or without wt or LSSE ZDHHC14 from Figure 1C.
Quantified PSD93 palmitoyl:total levels from Figure 1C, normalized to the PSD93α empty vector condition (2-way ANOVA: ZDHHC14 p<0.0001 [F(2)=111], isoform p<0.0001 [F(1)=281.7], interaction p<0.0001 [F(2)=48.88]; N = 4–6; Bonferroni post hoc test *p<0.05, **p<0.01, ****p<0.0001; 95% confidence intervals vector versus ZDHHC14 PSD93α [1.14, 7.54], vector versus ZDHHC14 PSD93β [17.81, 25.65], vector vs ZDHHC14 LSSE PSD93α [−2.08, 4.32], vector versus ZDHHC14 LSSE PSD93β [5.62, 13.45], ZDHHC14 versus ZDHHC14 LSSE PSD93α [−6.42,–0.020], ZDHHC14 versus ZDHHC14 LSSE PSD93β [−16.11,–8.28]). In this Figure supplement, data from all HEK cell ABE experiments for ZDHHC14/PSD93 are plotted and analyzed together, while in Figure 1D and E data for the PSD93 alpha and beta subunits are analyzed separately where the N are equal across all conditions (N = 6 and N = 4, respectively).
Figure 1—figure supplement 4
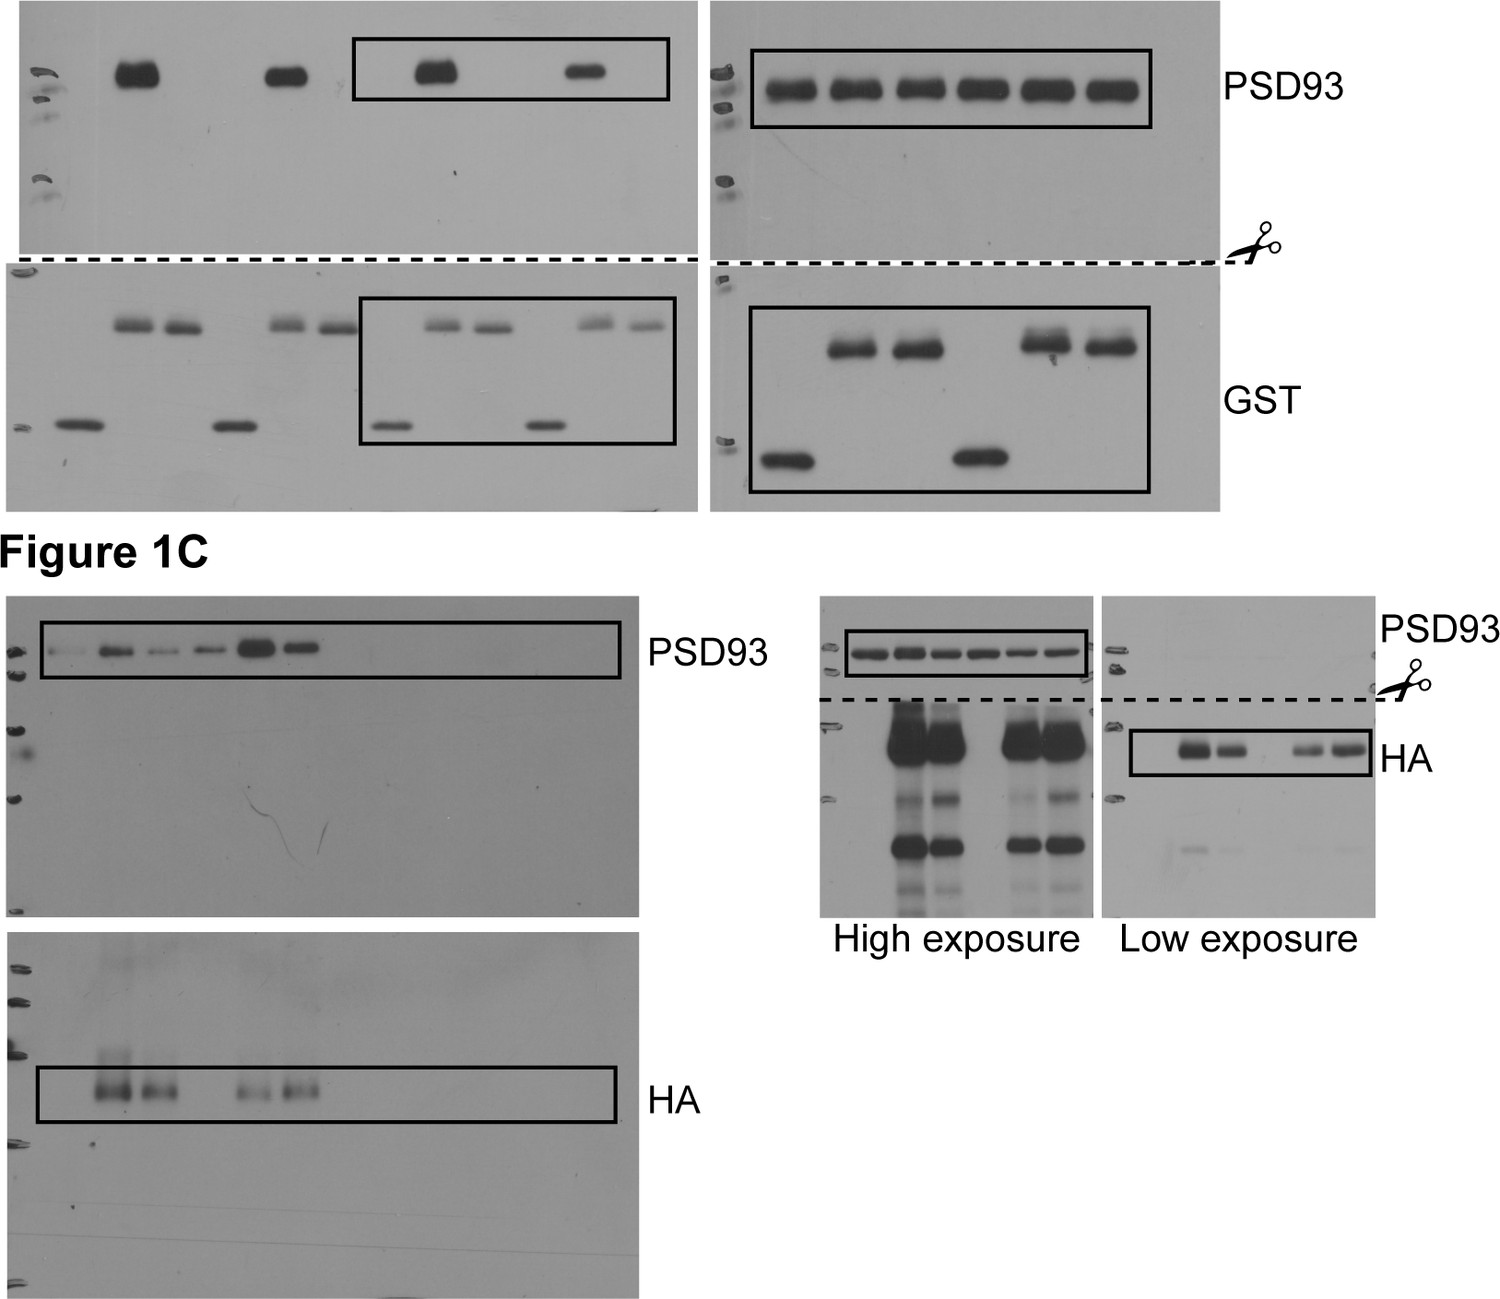
Uncropped Western blot images for Figure 1.
Bold titles indicate the figure that the uncropped images correspond to, boxes indicate cropped regions, and dashed lines and scissors indicate where membranes were cut prior to immunoblotting.
Figure 2 with 2 supplements

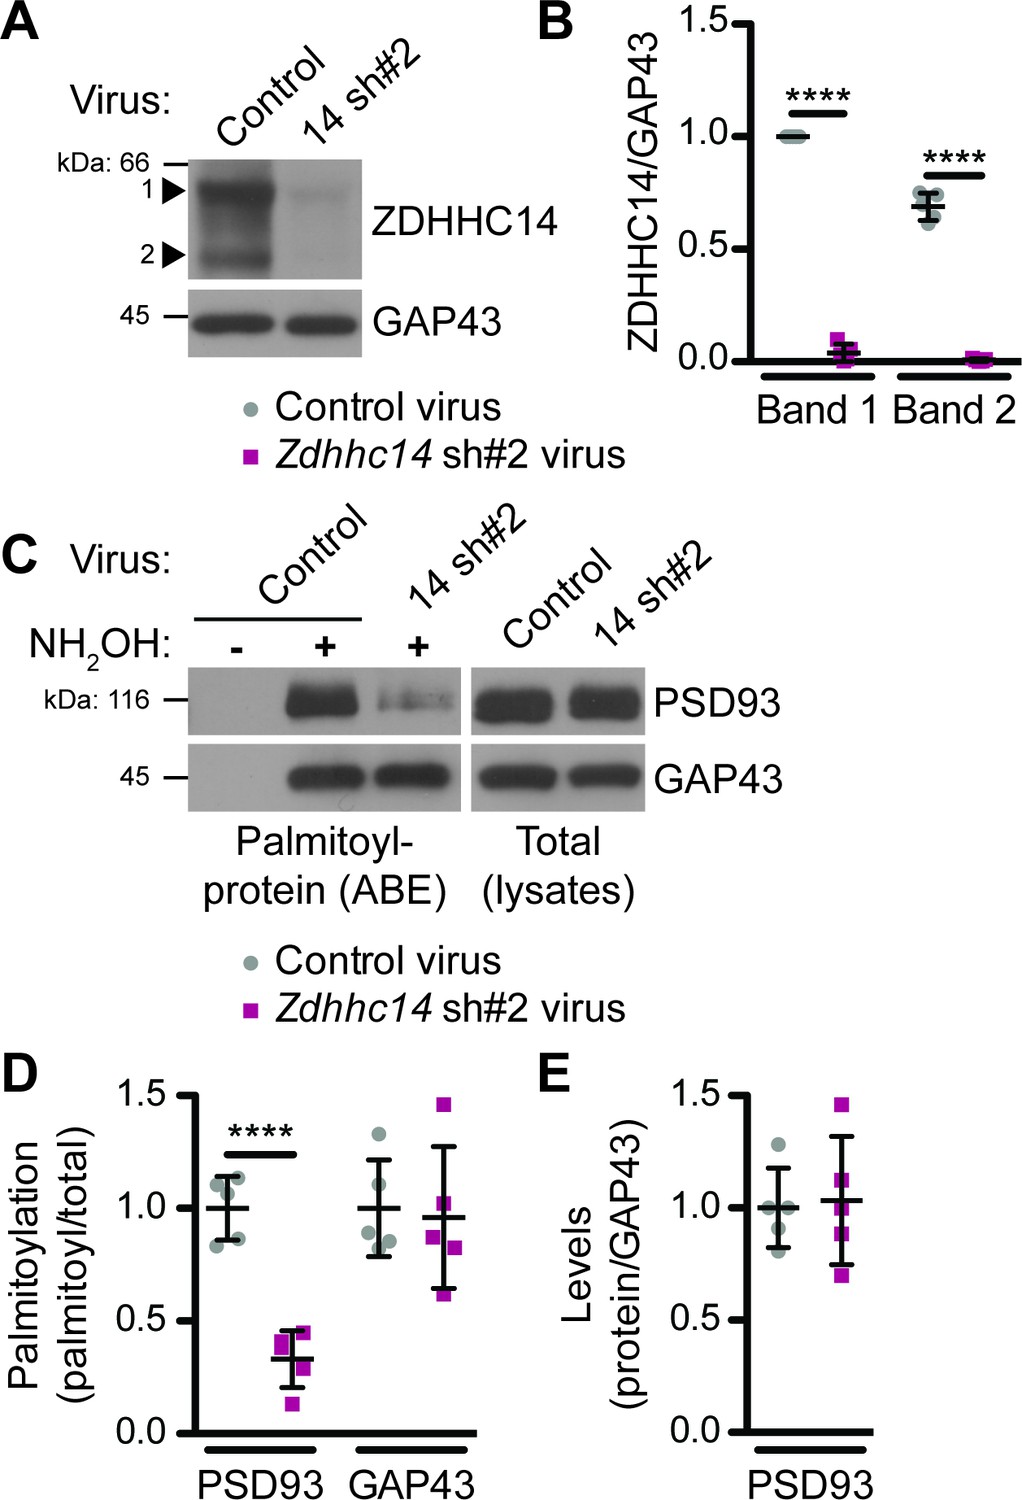
ZDHHC14 palmitoylates PSD93 in hippocampal neurons.
(A) Cultured hippocampal neurons were transduced with the indicated lentiviruses on day in vitro (DIV) nine and lysed on DIV16. Lysates were blotted with the indicated antibodies. Two ZDHHC14 bands were identified (indicated by arrow heads ‘1’ and ‘2’). (B) Quantified intensities of the indicated ZDHHC14 bands from A, normalized to band ‘1’ in the control virus condition (2-way ANOVA: Virus p<0.0001 [F(1)=618.7], band p<0.0001 [F(1)=72.17], interaction p<0.0001 [F(1)=51.64]; N = 5; Bonferroni posthoc test ****p<0.0001; 95% CI control versus 14sh#1 band 1 [–1.01,–0.81], control versus 14sh#1 band 2 [–0.60,–0.40]). (C) Cultured hippocampal neurons were lentivirally infected and lysed as in A and palmitoyl-proteins (isolated by ABE; left panels) and total protein levels in parent lysates (right panels) were assessed by western blotting with antibodies against PSD93 (top panel), GAP43 (middle panel, positive control palmitoylated protein), and Erk1/2 (bottom, negative control non-palmitoylated protein). (D) Quantified data from C, showing PSD93 (left) and GAP43 (right) palmitoyl/total levels, normalized to the control virus condition (PSD93: unpaired Student’s t-test ****p<0.0001, N = 12, 95% CI [0.44, 0.78]; GAP43: unpaired Student’s t-test p=0.40, N = 12, 95% CI [−0.063, 0.15]). (E) Quantified data from C, showing total PSD93 levels normalized to the control virus condition (unpaired Student’s t-test **p=0.0034, N = 12, 95% CI [0.12, 0.52]). Uncropped western blot images are in Figure 2—figure supplement 2.
-
Figure 2—source data 1
Source data for Figure 2B,D and E and for Figure 2—figure supplement 1B,D and E.
- https://cdn.elifesciences.org/articles/56058/elife-56058-fig2-data1-v2.xlsx
Figure 2—figure supplement 1
Additional Evidence that ZDHHC14 palmitoylates endogenous PSD93 in hippocampal neurons.
(A) Hippocampal neurons were transduced with control or Zdhhc14 shRNA#2 (14 sh#2) lentivirus to knockdown Zdhhc14 on day in vitro (DIV) 9. Cultures were harvested on DIV16 and levels of ZDHHC14 (two bands, indicated by arrowheads) and GAP43 (loading control) were determined by western blotting. (B) Quantified intensity of the two ZDHHC14 bands from A, normalized to band ‘1’ in the control virus condition (2-way ANOVA: Virus p<0.0001 [F(1)=2614.0], band p<0.0001 [F(1)=114.3], interaction p<0.0001 [F(1)=75.41]; N = 5; Bonferroni post hoc test ****p<0.0001; 95% CI control versus 14sh#2 band 1 [–1.02,–0.90], control versus 14sh#2 band 2 [–0.74,–0.63]). (C) Palmitoyl-proteins (isolated by ABE; left panels) and total protein levels (in parent lysates; right panels) of PSD93 and GAP43, assessed by western blotting with the respective specific antibodies. (D) Quantifications of palmitoylation of PSD93 (left) and GAP43 (right) from C, normalized to the control virus condition (PSD93: unpaired Student’s t-test ****p<0.0001, N = 5, 95% CI [0.47, 0.86]; GAP43: unpaired Student’s t-test p=0.82, N = 5, 95% CI [−0.35, 0.43]). (E) Quantified PSD93 total levels from C, normalized to the control virus condition (unpaired Student’s t-test p=0.83, N = 5, 95% CI [−0.38, 0.31]). Uncropped western blot images are in Figure 2—figure supplement 2.
Figure 2—figure supplement 2
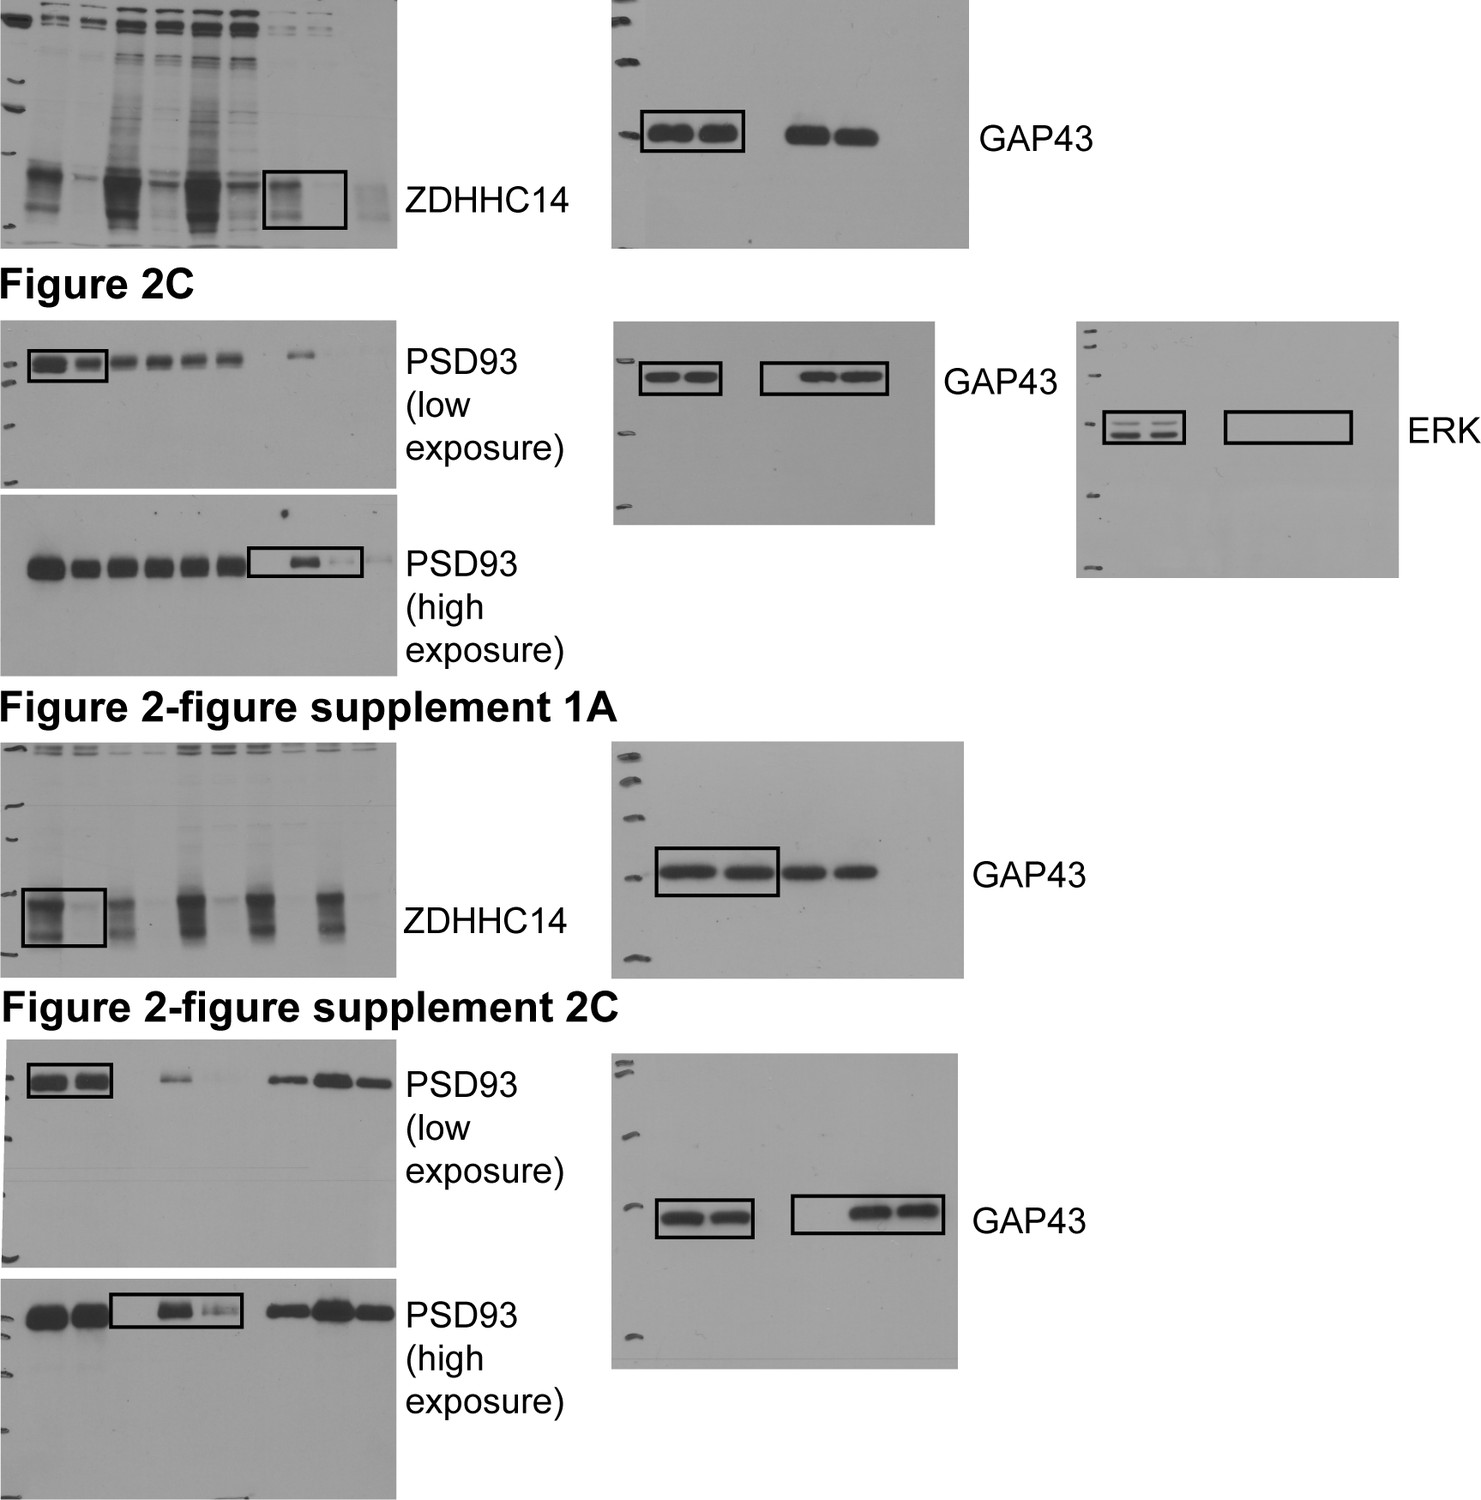
Uncropped Western blot images for Figure 2 and Figure 2—figure supplement 1.
Bold titles indicate the figure that the uncropped images correspond to, boxes indicate cropped regions.
Figure 3 with 3 supplements

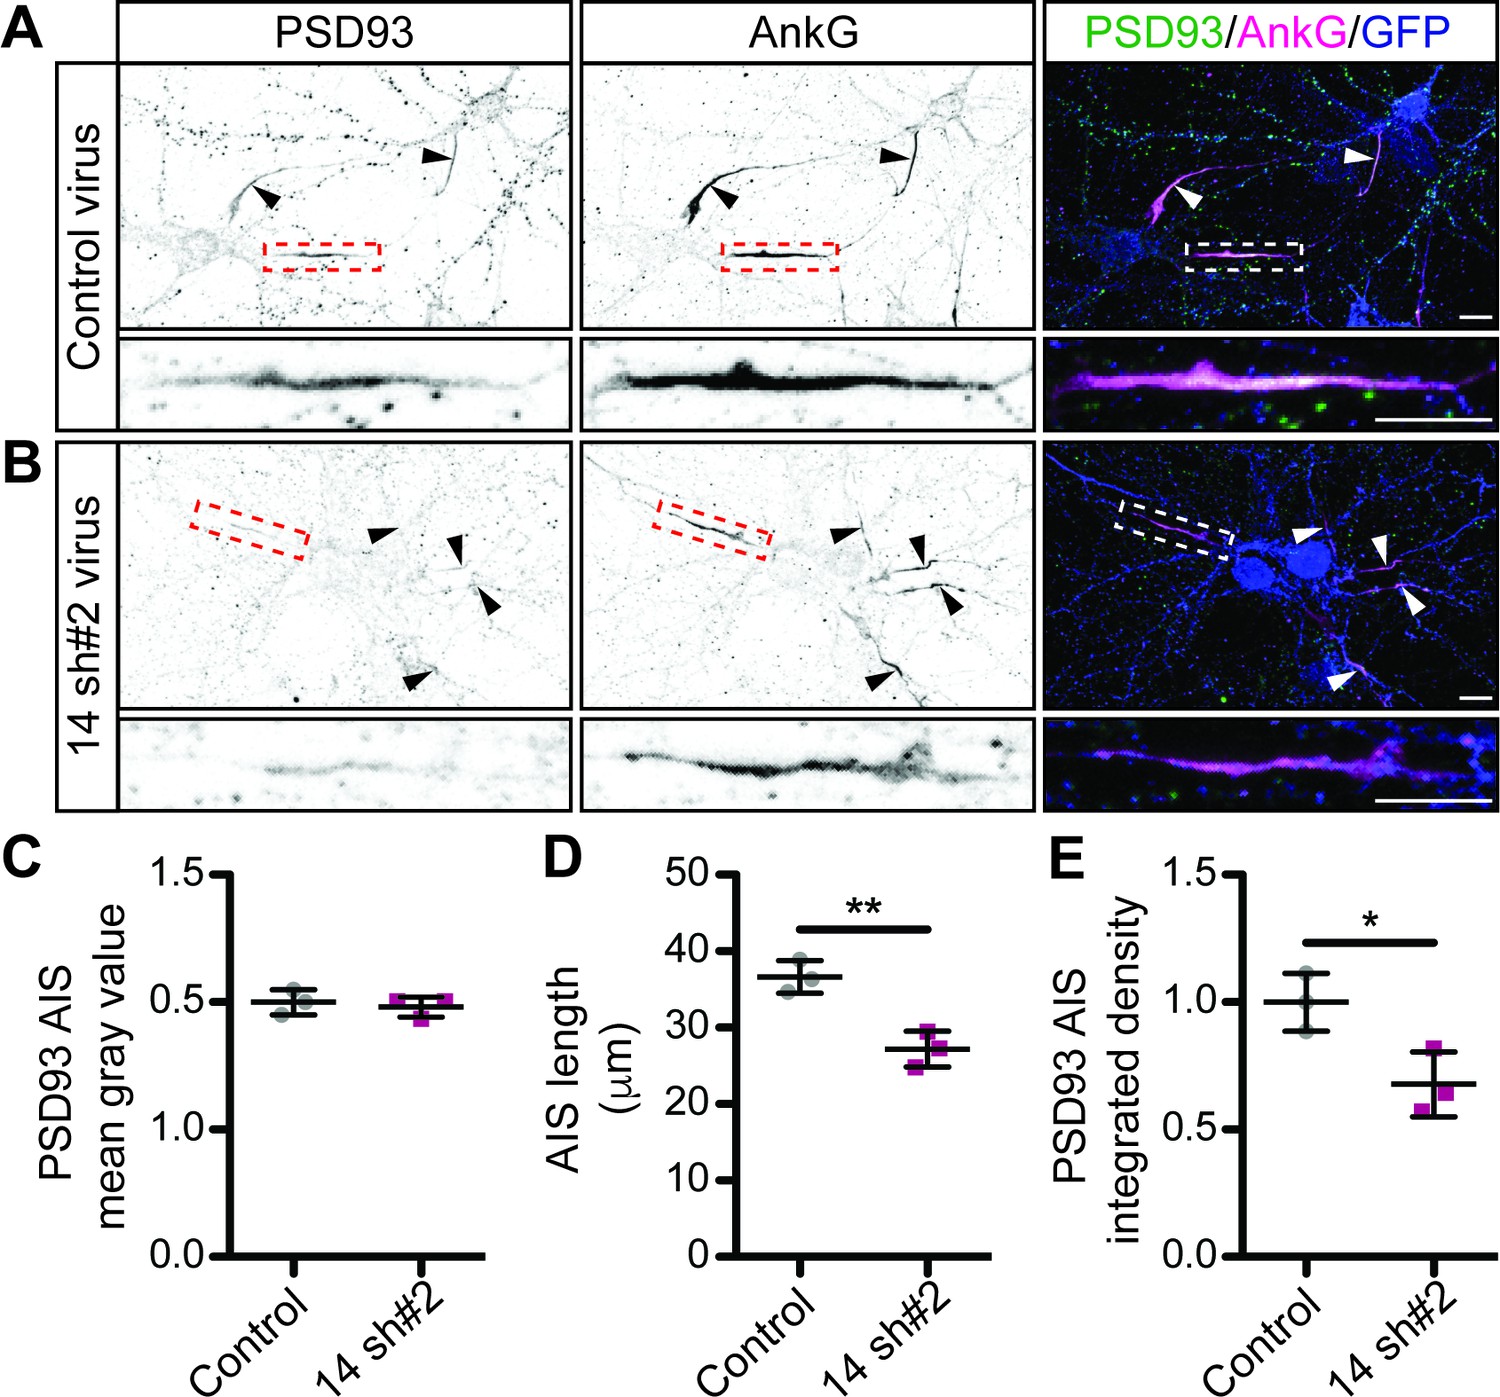
ZDHHC14 is required for PSD93 targeting to the AIS in hippocampal neurons.
Hippocampal neurons transduced with lentivirus to express GFP alone (A; ‘Control’), or together with Zdhhc14 shRNA #1 (B; ‘14 sh#1’) were fixed and immunostained with antibodies against PSD93 (left column and green in merged images on right), AnkG (AIS marker, middle column and magenta in merged images on right), and GFP (marker of infected neurons, blue in merged images, right column). Lower panel images are magnified views of dashed red or white boxed area of top row images and arrowheads indicate additional non-magnified AISs in image. (C) Mean gray value of PSD93 signal within AnkG-defined AIS, normalized to control condition (unpaired Student’s t-test ****p=0.012, N = 3 independent cultures, 95% CI [0.072, 0.32]). (D) Quantified AIS lengths (defined by AnkG staining; unpaired Student’s t-test **p=0.0026, N = 3 independent cultures, 95% CI [8.42, 20.39]). (E) Integrated density of PSD93 signal within AnkG-defined AIS, normalized to control condition (Student’s t-test ***p=0.0008, N = 3 independent cultures, 95% CI [0.32, 0.60]). Scale bar in full and magnified views: 10 μm. Additional example images are provided in Figure 3—figure supplement 3.
-
Figure 3—source data 1
Source data for Figure 3C–E and for Figure 3—figure supplement 2C–E.
- https://cdn.elifesciences.org/articles/56058/elife-56058-fig3-data1-v2.xlsx
Figure 3—figure supplement 1
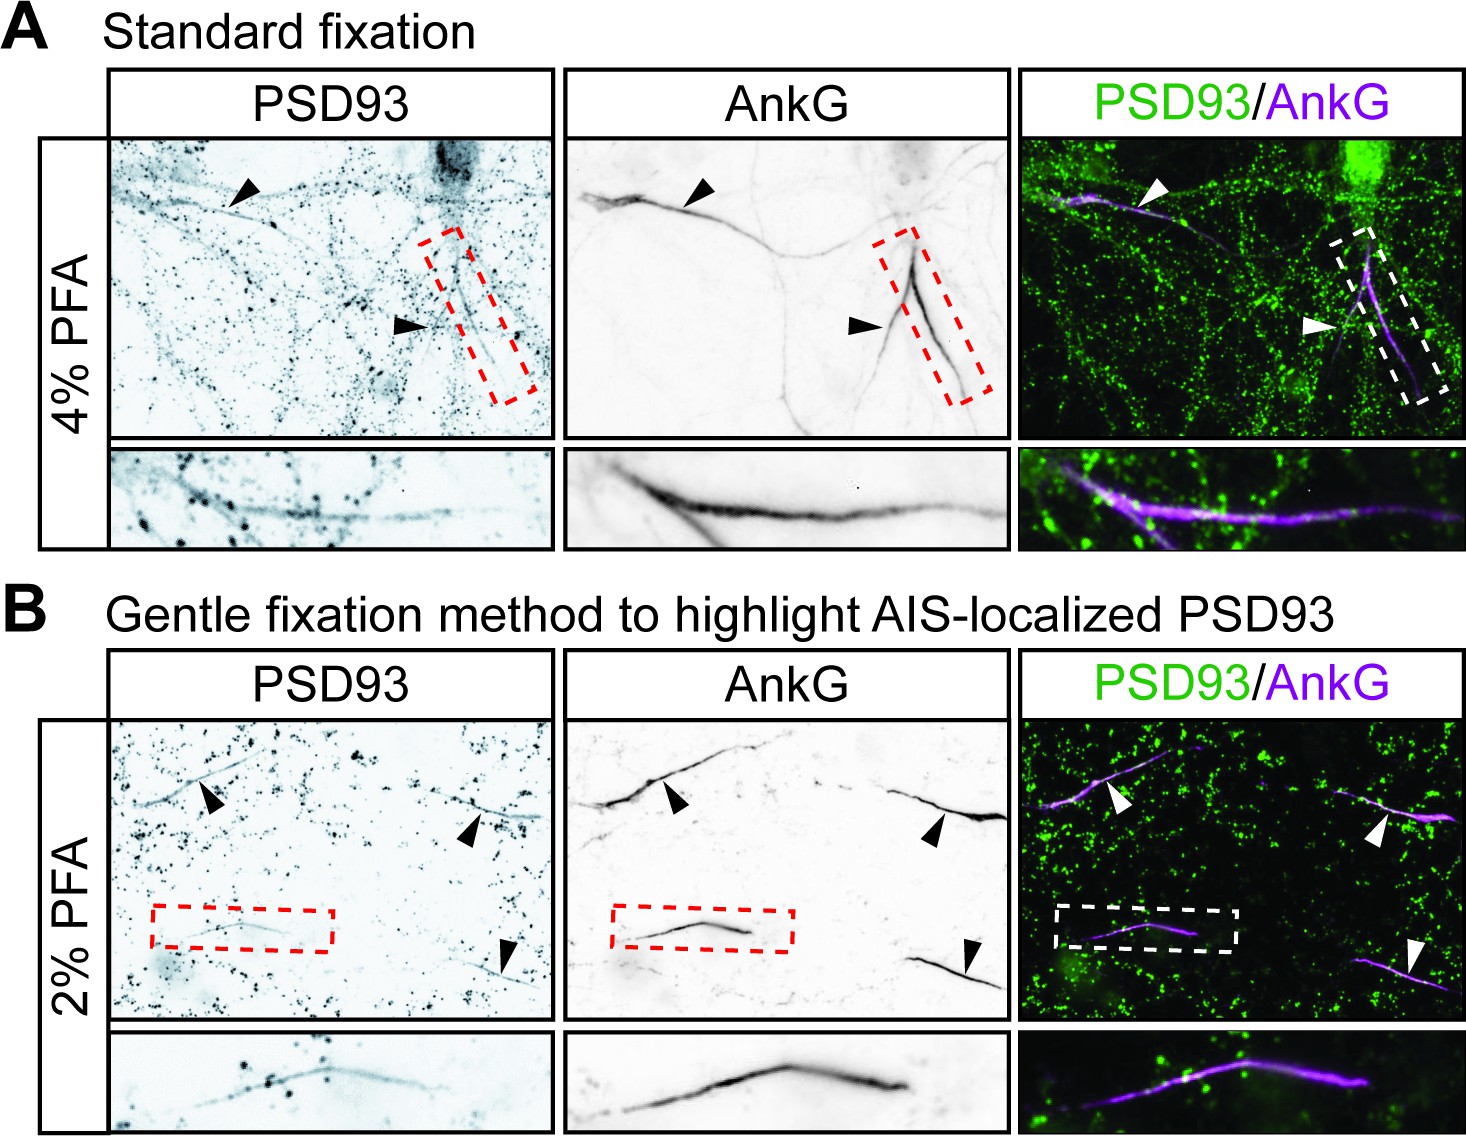
A gentle fixation method highlights AIS-localized PSD93 in hippocampal neurons.
Hippocampal neurons were fixed using a standard fixation method (A) or with a previously reported gentle fixation method (Ogawa et al., 2008) (B) and immunostained with antibodies against PSD93 (left column and green in merged images on right) and AnkG (AIS marker, middle column and magenta in merged images on right). Lower panel images are magnified views of dashed red or white boxed area of top row images and arrowheads indicate additional non-magnified AISs in image. Under standard fixation, PSD93 is visible at the AIS and at presumptive synapses, but gentle fixation highlights AIS-localized PSD93.
Figure 3—figure supplement 2
Additional Evidence that ZDHHC14 is required for PSD93 targeting to the AIS in hippocampal neurons.
Hippocampal neurons were transduced with (A) control or (B) Zdhhc14 sh#2-expressing lentiviruses on DIV9 and fixed on DIV18 to determine PSD93 targeting to the AIS. Neurons were immunostained with antibodies against PSD93 (left column and green in merged images on right), AnkG (AIS marker, middle column and magenta in merged images on right), and GFP (marker of infected neurons, blue in merged images, right column). Lower panel images are magnified views of dashed red or white boxed area of top row images. Arrowheads indicate additional non-magnified AISs in image. (C) Mean gray value of PSD93 signal within AnkG-defined AIS, normalized to control condition (Mann Whitney p=0.99; N = 3 independent cultures, U = 4.00). (D) Quantified AIS lengths (defined by AnkG staining; unpaired Student’s t-test **p=0.0068, N = 3 independent cultures, 95% CI [4.35, 14.55]). (E) Integrated density of PSD93 signal within AnkG-defined AIS, normalized to control condition (unpaired Student’s t-test *p=0.030; N = 3 independent cultures, 95% CI [0.50, 0.59]). Scale bar in full and magnified views: 10 μm. Additional example images are provided in Figure 3—figure supplement 3.
Figure 3—figure supplement 3
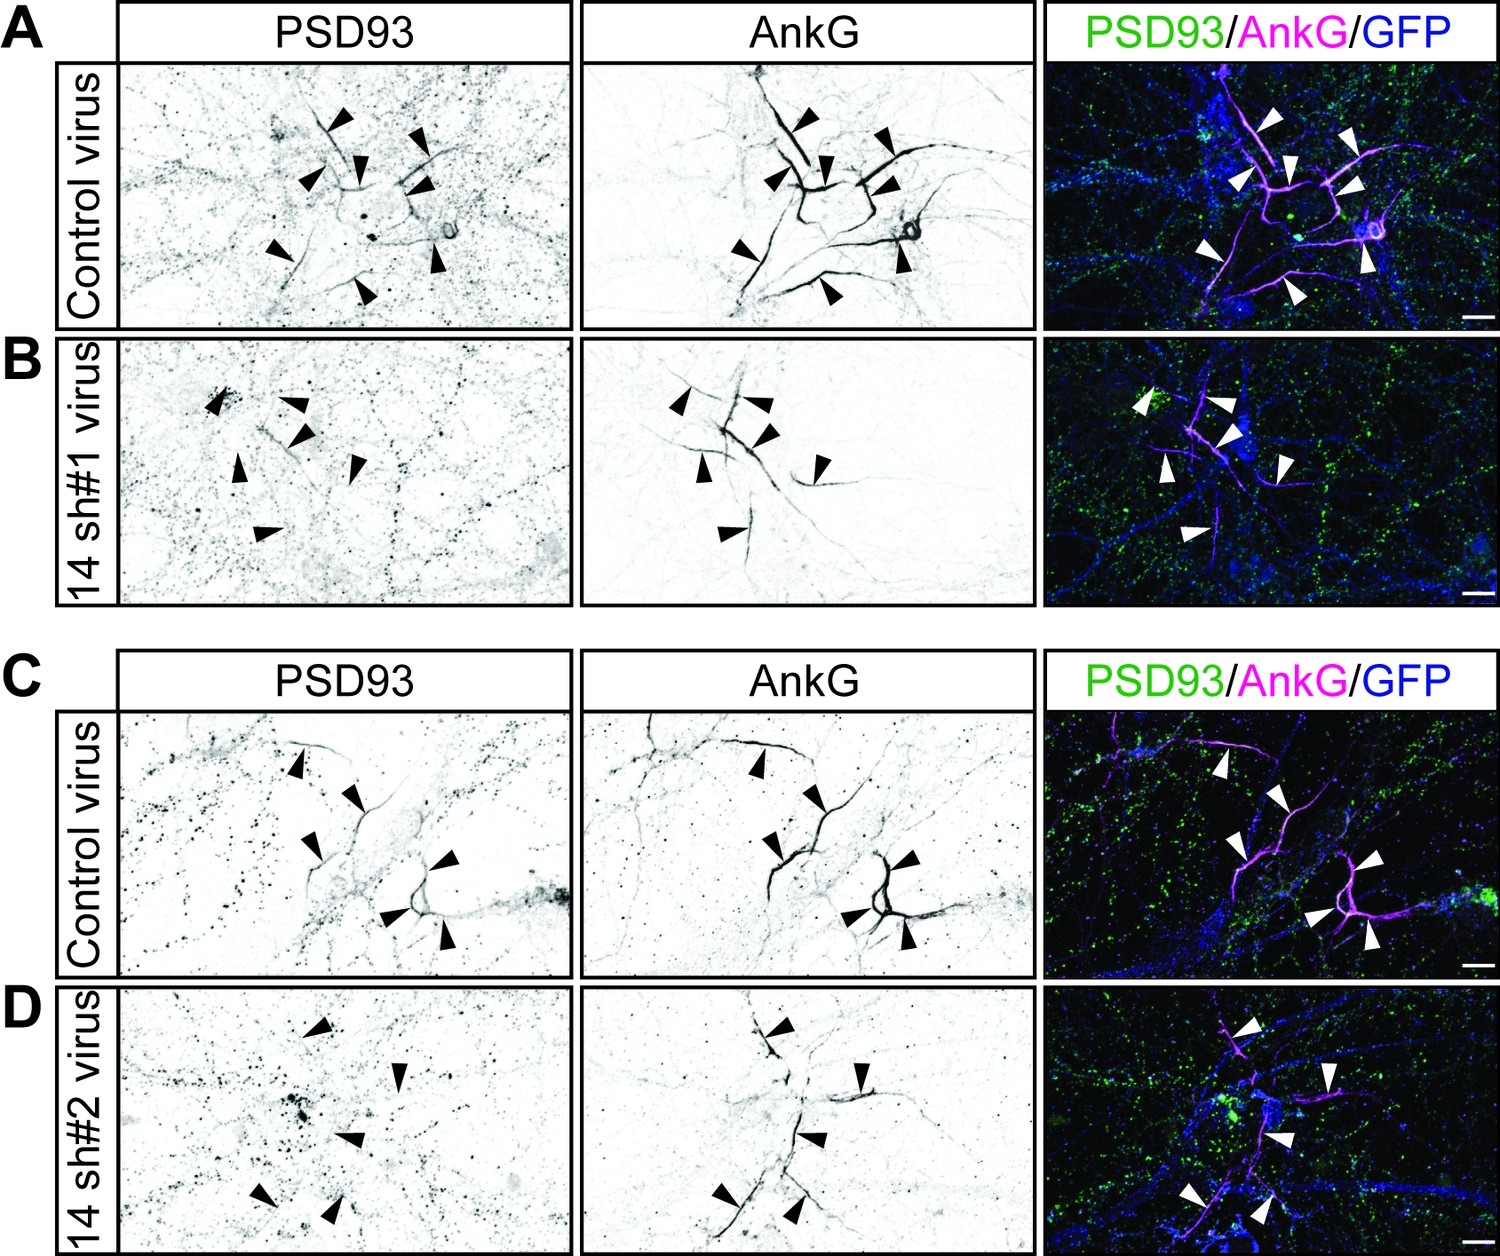
Additional example images confirm that ZDHHC14 is required for PSD93 targeting to the AIS in hippocampal neurons.
Hippocampal neurons transduced with lentivirus to express GFP alone (A and C; ‘Control’), or GFP together with Zdhhc14 shRNA #1 (B; ‘14 sh#1’) or Zdhhc14 shRNA #2 (D; ‘14 sh#2’) were fixed and immunostained with antibodies against PSD93 (left column and green in merged images on right), AnkG (AIS marker, middle column, and magenta in merged images on right), and GFP (marker of infected neurons, blue in merged images, right column). Arrowheads indicate AISs in image. Scale bar: 10 μm.
Figure 4 with 2 supplements

Contribution of direct palmitoylation to AIS targeting of PSD93β in hippocampal neurons.
Hippocampal neurons were transfected to express GFP and wtPSD93β-Myc (A) or PSD93β−5CS-Myc (B). Neurons were fixed and immunostained with antibodies against Myc (left column and green in merged images), AnkG (AIS marker, second column and magenta in merged images), and GFP (marker of infected neurons, blue in merged images, right column). Magnified views of dashed red or white boxed areas of top row images are shown below and arrowheads indicate the start and end of the AIS. Neurons were scored for Myc distribution in the axon, delineated by the presence of an AnkG-positive AIS, as diffuse axonal distribution (Diffuse) or AIS enriched/restricted distribution (AIS-enriched). (C) Quantified data for axonal images for 10 neurons per condition per experiment transfected as in A-B, from three independent cultures expressed as a percentage per culture (N = 3 independent cultures). Scale bar in full and magnified views: 10 μm.
-
Figure 4—source data 1
Source data for Figure 4C and for Figure 4—figure supplement 1C.
- https://cdn.elifesciences.org/articles/56058/elife-56058-fig4-data1-v2.xlsx
Figure 4—figure supplement 1

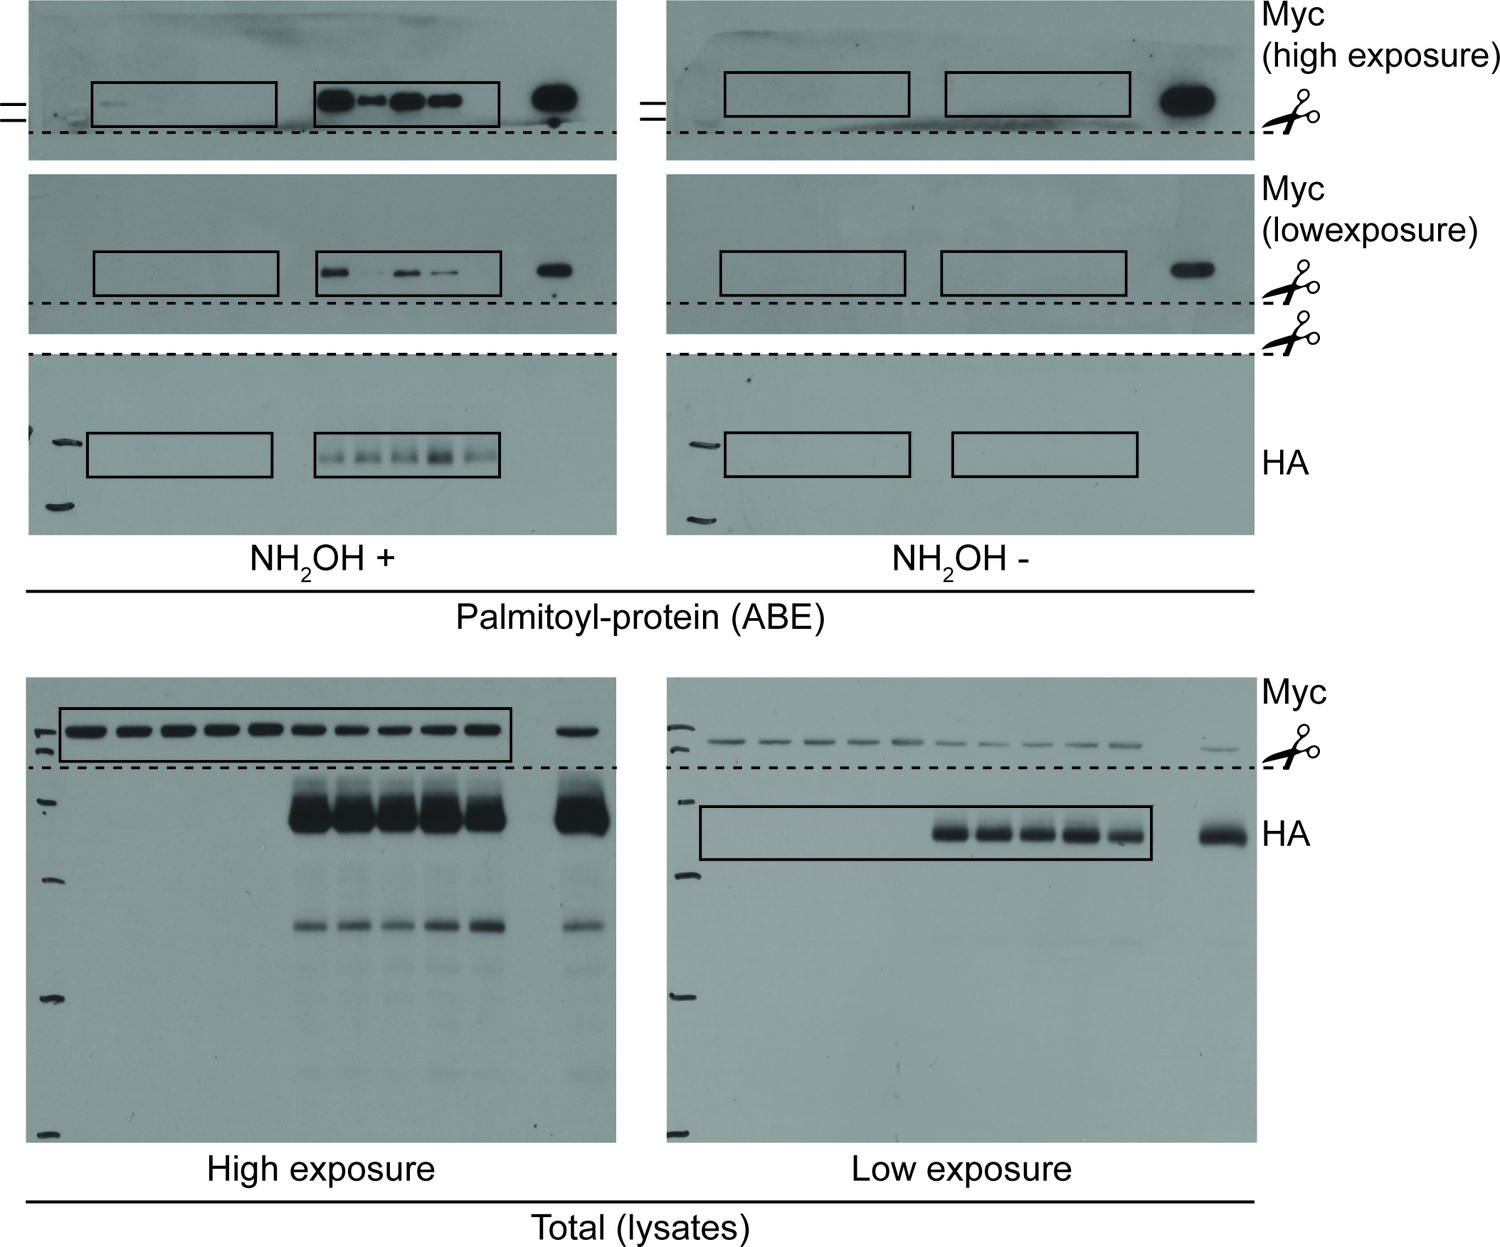
ZDHHC14 palmitoylates PSD93β on all five N-terminal cysteine residues.
(A) Schematic of PSD93 with expanded N-terminal amino acid sequence unique to the β isoform. Cysteine residues within this N-terminal region are in red. Downstream PDZ (yellow boxes), SH3 (orange box), and guanylate kinase (GK, tan box) domains are marked (B) HEK293T cells were transfected with the indicated constructs and palmitoyl-proteins (isolated by ABE; top set of panels) were assessed by western blotting with Myc (top two panels, high and low exposures, respectively) and HA (third panel) antibodies. Bottom two panels: total protein levels in parent lysates from B, determined by western blotting with the indicated antibodies. The two left panels (all +NH2OH lanes) are a composite from the same western blot image and the two right panels (all −NH2OH lanes) are a composite from another single western blot image. (C) Quantified intensity of low exposure Myc signals from B, normalized to the wtPSD93β plus HA-ZDHHC14 condition (1-way ANOVA p<0.0001, F(4,10)=20.84, N = 3; Bonferroni post hoc test *p<0.05, ***p<0.001, ****p<0.0001, 95% CI WT versus C10S [0.52, 1.23], WT versus C16,18S [0.062, 0.78], WT versus C10,16,18S [0.35, 1.06], WT versus 5CS [0.64, 1.35]). Uncropped western blot images are in Figure 4—figure supplement 2.
Figure 4—figure supplement 2
Uncropped western blot images for Figure 4—figure supplement 1.
Bold titles indicate the figure that the uncropped images correspond to, boxes indicate cropped regions, and dashed lines and scissors indicate where membranes were cut prior to immunoblotting.
Figure 5 with 2 supplements
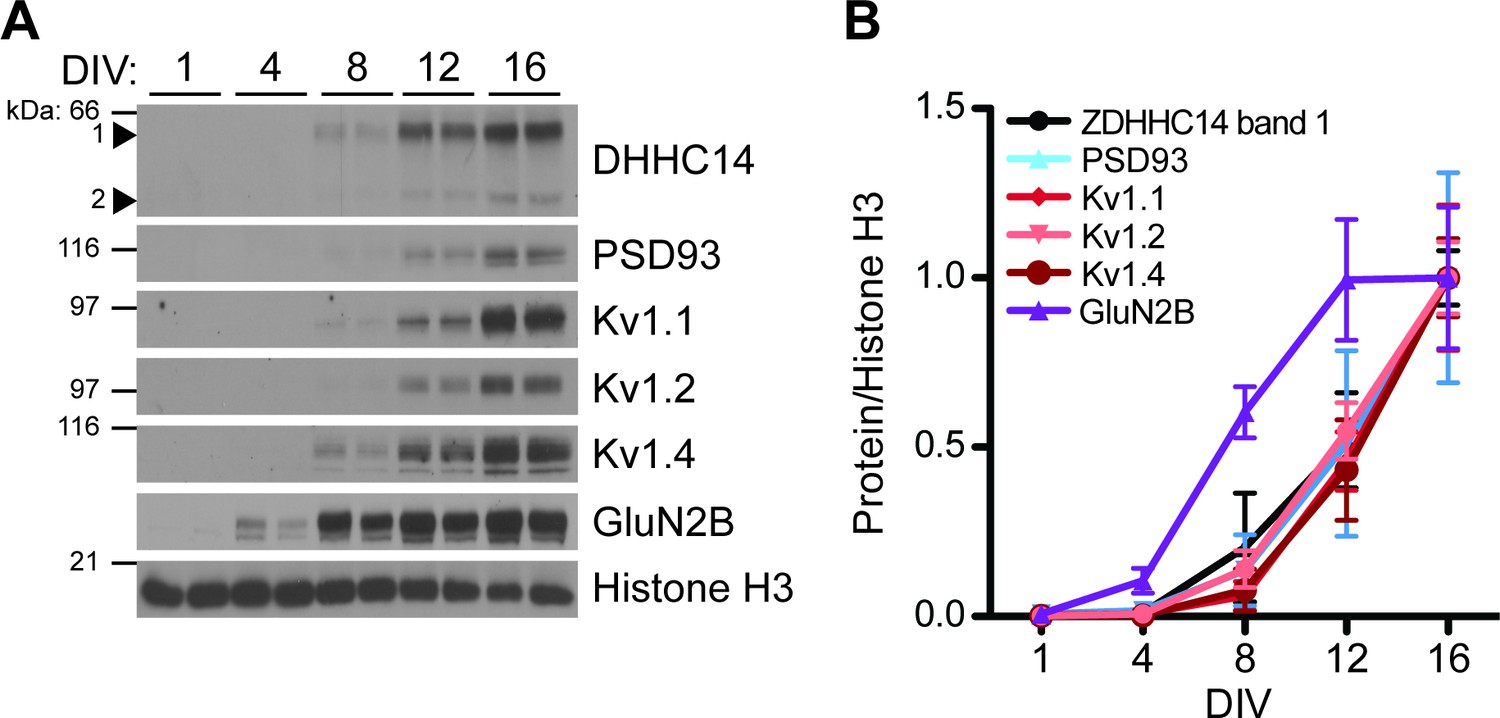
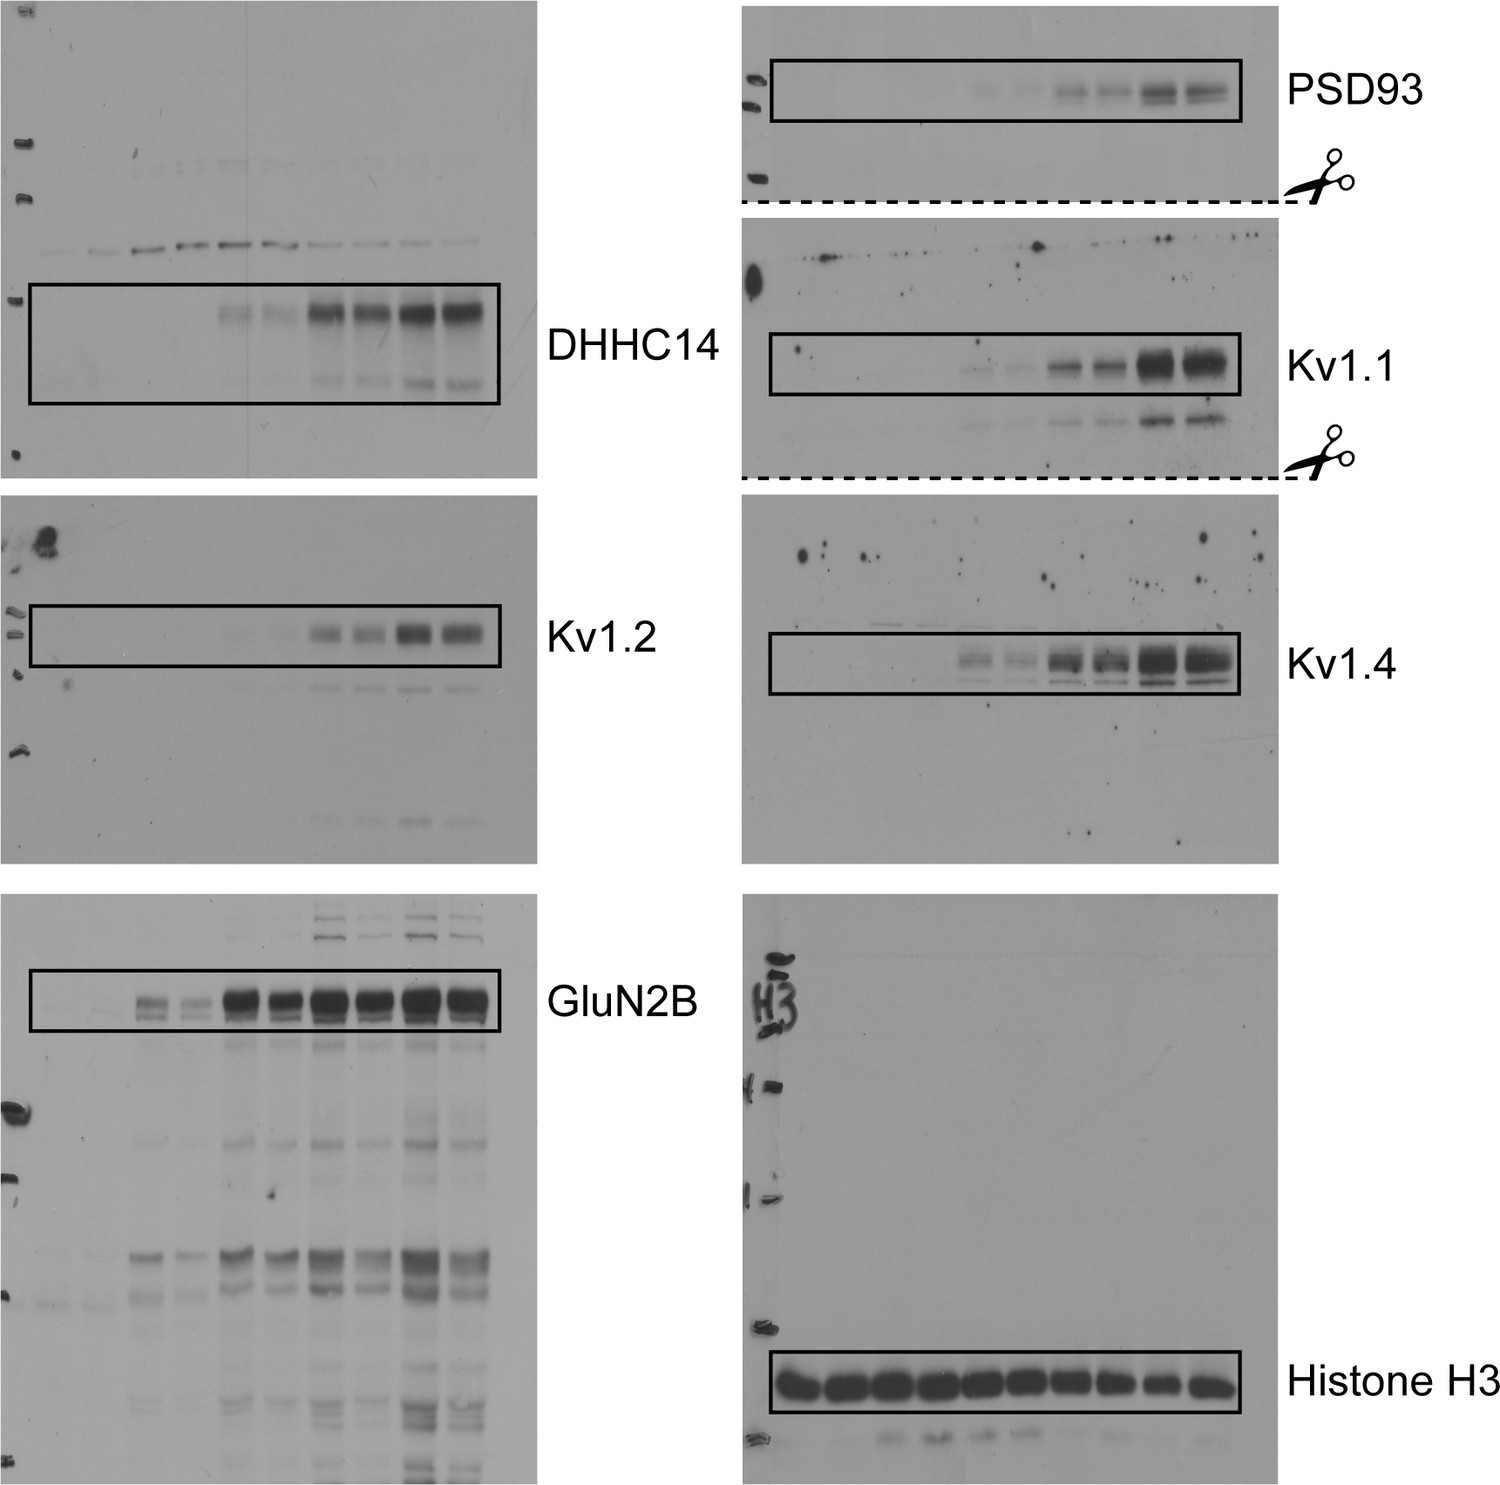
Developmental expression of ZDHHC14 mirrors that of PSD93 and Kv1-type potassium ion channels in cultured hippocampal neurons.
(A) Hippocampal neurons were harvested at the indicated days in vitro (DIV) and lysates were western blotted with the indicated antibodies. (B) Quantified levels of the indicated proteins from A, relative to Histone H3 and normalized to DIV16 condition, plotted as a function of DIV (N = 3–4). Uncropped western blot images are in Figure 5—figure supplement 2.
-
Figure 5—source data 1
Source data for Figure 5B.
- https://cdn.elifesciences.org/articles/56058/elife-56058-fig5-data1-v2.xlsx
Figure 5—figure supplement 1
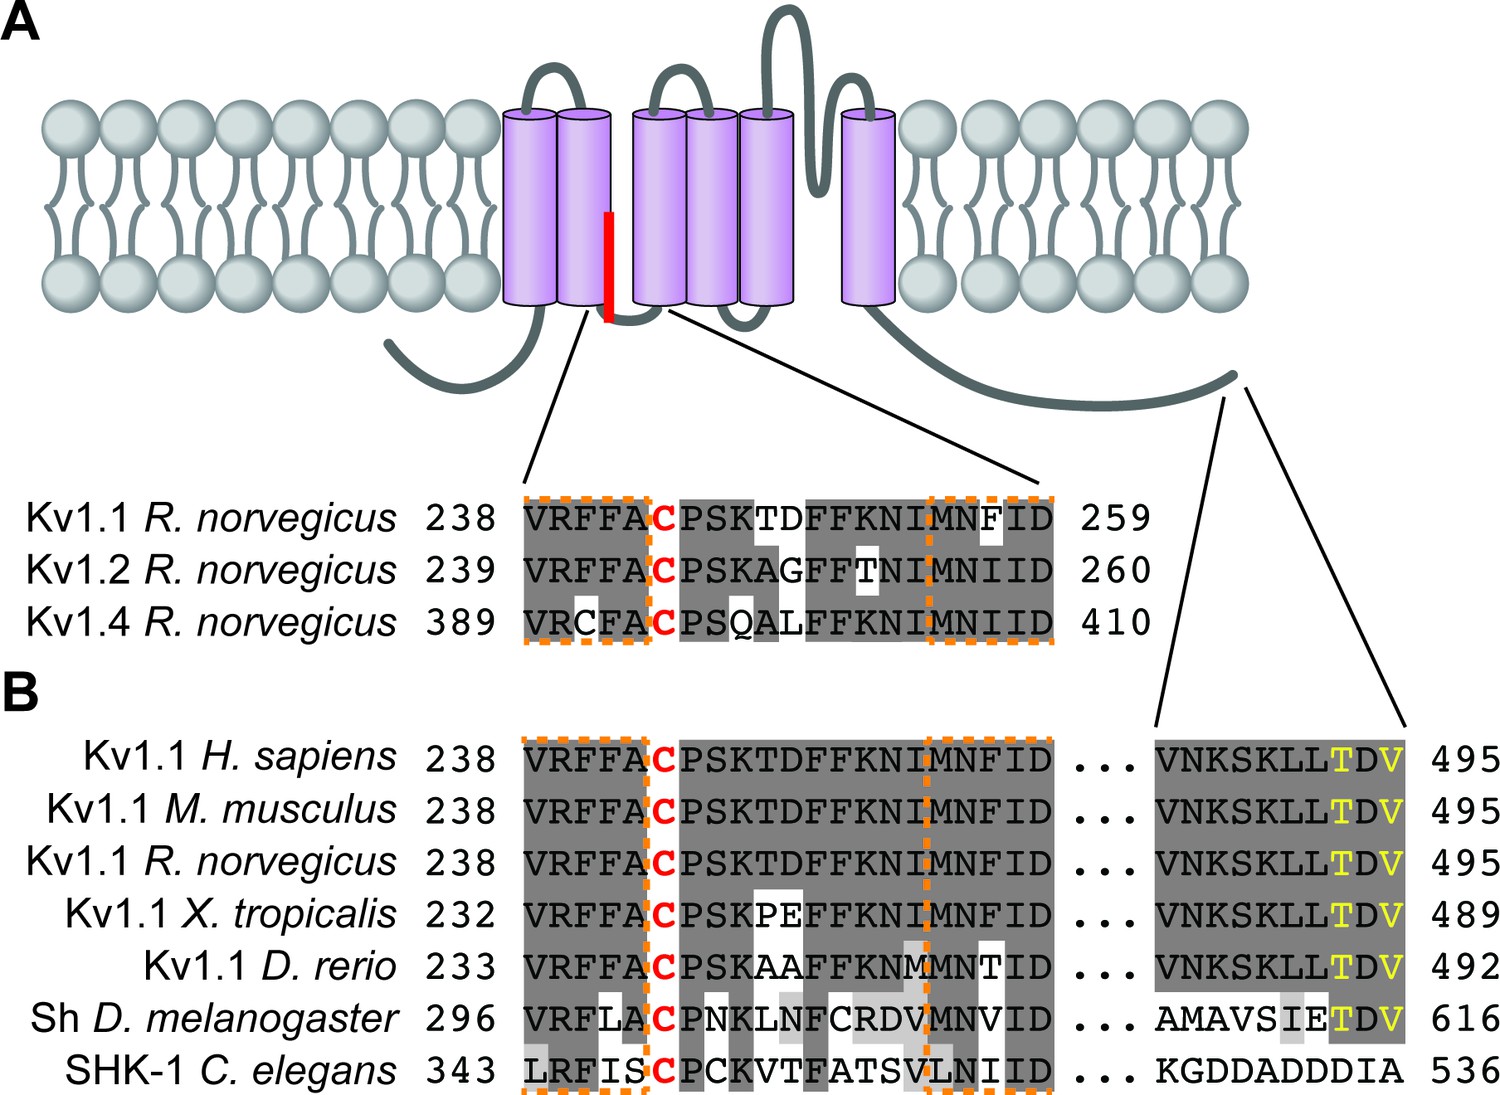
Kv1 channel palmitoylated cysteine residues and surrounding regions are conserved.
(A) Schematic of a generic Kv1 channel subunit with transmembrane domains (purple) and palmitate attached to the palmitoyl-cysteine between transmembrane domains two and three. Residue numbers are indicated for the regions surrounding the palmitoyl-cysteine from rat Kv1.1 (top [Gubitosi-Klug et al., 2005], NP_775118.1). Corresponding regions of rat Kv1.2 and Kv1.4 are shown below (NP_037102.1 and NP_037103.1, respectively). (B) Residue numbers, indicated for the regions surrounding the palmitoyl-cysteine and the 10 C-terminal amino acids from Kv1.1 orthologs, including human Kv1.1 (H. sapiens; NP_000208.2), mouse Kv1.1 (M. musculus; NP_034725.3), rat Kv1.1 (R. norvegicus; NP_775118.1), western clawed frog Kv1.1 (X. tropicalis; XP_004912858.1), Zebrafish Kv1.1 (D. rerio; XP_005163101.1), fruit fly Shaker (Sh; D. melanogaster; NP_523393.3) and roundworm SHK-1 (C. elegans; NP_871935.1). In A and B conserved residues are highlighted in dark gray, functionally conserved residues are in light gray, transmembrane domain residues are outlined in dashed orange lines, and the palmitoyl-cysteine is red. In B PDZ-ligand consensus amino acids are in yellow.
Figure 5—figure supplement 2
Uncropped western blot images for Figure 5.
Bold titles indicate the figure that the uncropped images correspond to, boxes indicate cropped regions, and dashed lines and scissors indicate where membranes were cut prior to immunoblotting.
Figure 6 with 1 supplement
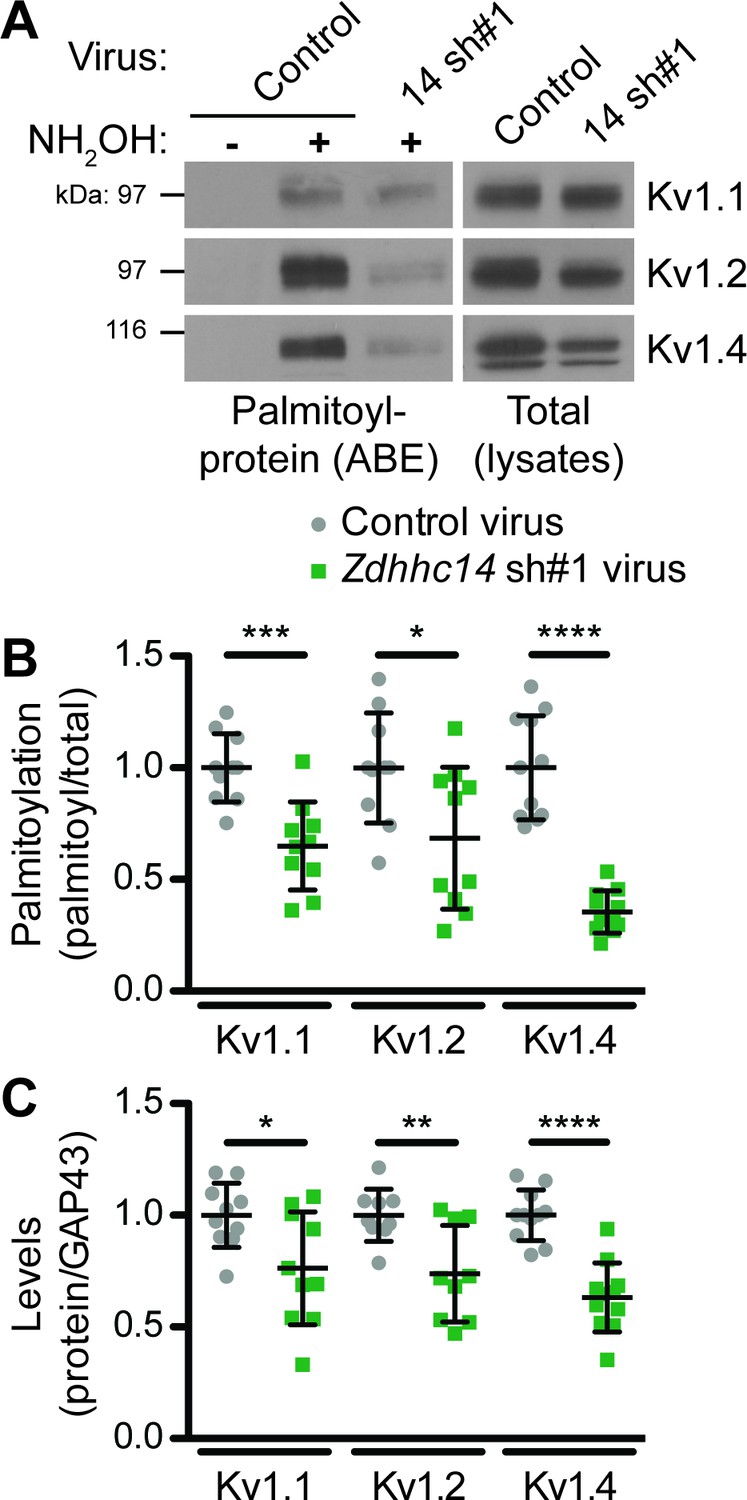
ZDHHC14 palmitoylates Kv1-type potassium channels in hippocampal neurons.
(A) Hippocampal neurons were transduced with the indicated lentiviruses on DIV9 and harvested on DIV16 to assess Kv1 channel palmitoylation by ABE. Palmitoyl-proteins (isolated by ABE; left panels) and total protein levels (in parent lysates; right panels) were assessed by western blotting with the indicated antibodies. (B) Quantified palmitoyl:total levels of Kv1.1, Kv1.2, and Kv1.4 from A, normalized to the control virus condition (Kv1.1: unpaired Student’s t-test ***p=0.0003, N = 10, 95% CI [0.18, 0.52]; Kv1.2: unpaired Student’s t-test *p=0.024, N = 10, 95% CI [0.047, 0.58]; Kv1.4: Mann Whitney test ****p<0.0001, N = 11, U = 0.0). (C) Quantified total levels of Kv1.1 (left), Kv1.2 (middle), and Kv1.4 (right) from A, normalized to the control virus condition (Kv1.1: unpaired Student’s t-test *p=0.019, N = 10, 95% CI [0.044, 0.43]; Kv1.2: unpaired Student’s t-test **p=0.0058, N = 9, 95% CI [0.087, 0.43]; Kv1.4: unpaired Student’s t-test ****p<0.0001, N = 11, 95% CI [0.25, 0.49]). Uncropped western blot images are in Figure 6—figure supplement 1.
-
Figure 6—source data 1
Source data for Figure 6B,C.
- https://cdn.elifesciences.org/articles/56058/elife-56058-fig6-data1-v2.xlsx
Figure 6—figure supplement 1
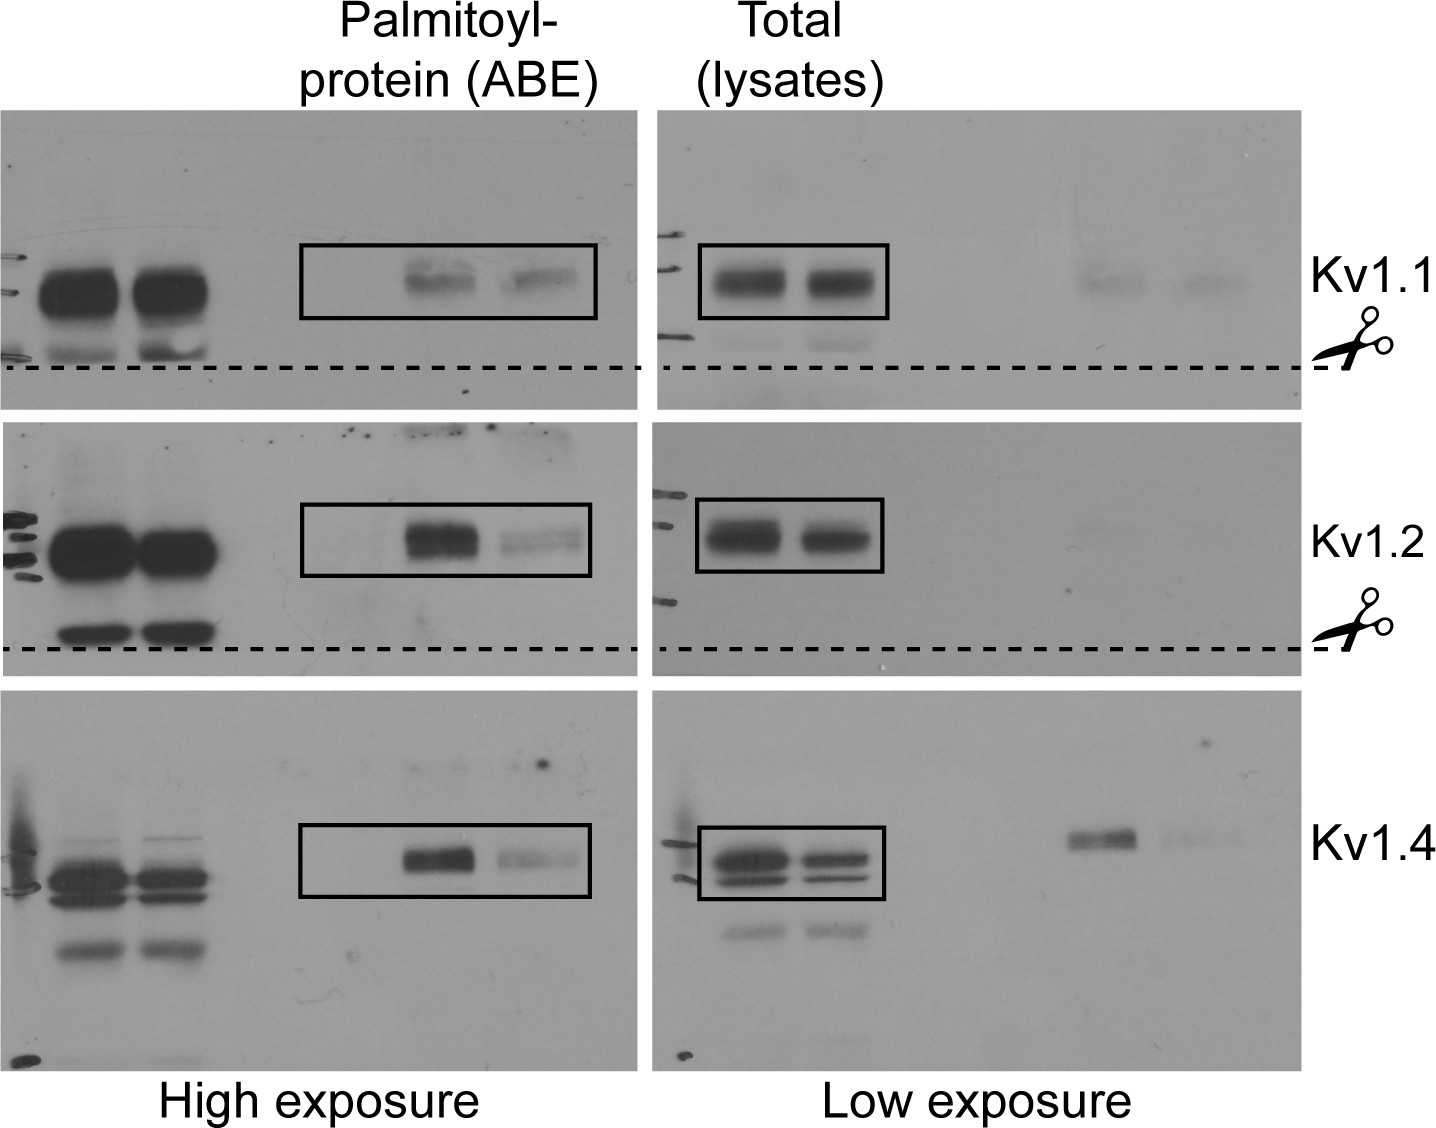
Uncropped western blot images for Figure 6.
Bold titles indicate the figure that the uncropped images correspond to, boxes indicate cropped regions, and dashed lines and scissors indicate where membranes were cut prior to immunoblotting.
Figure 7 with 1 supplement

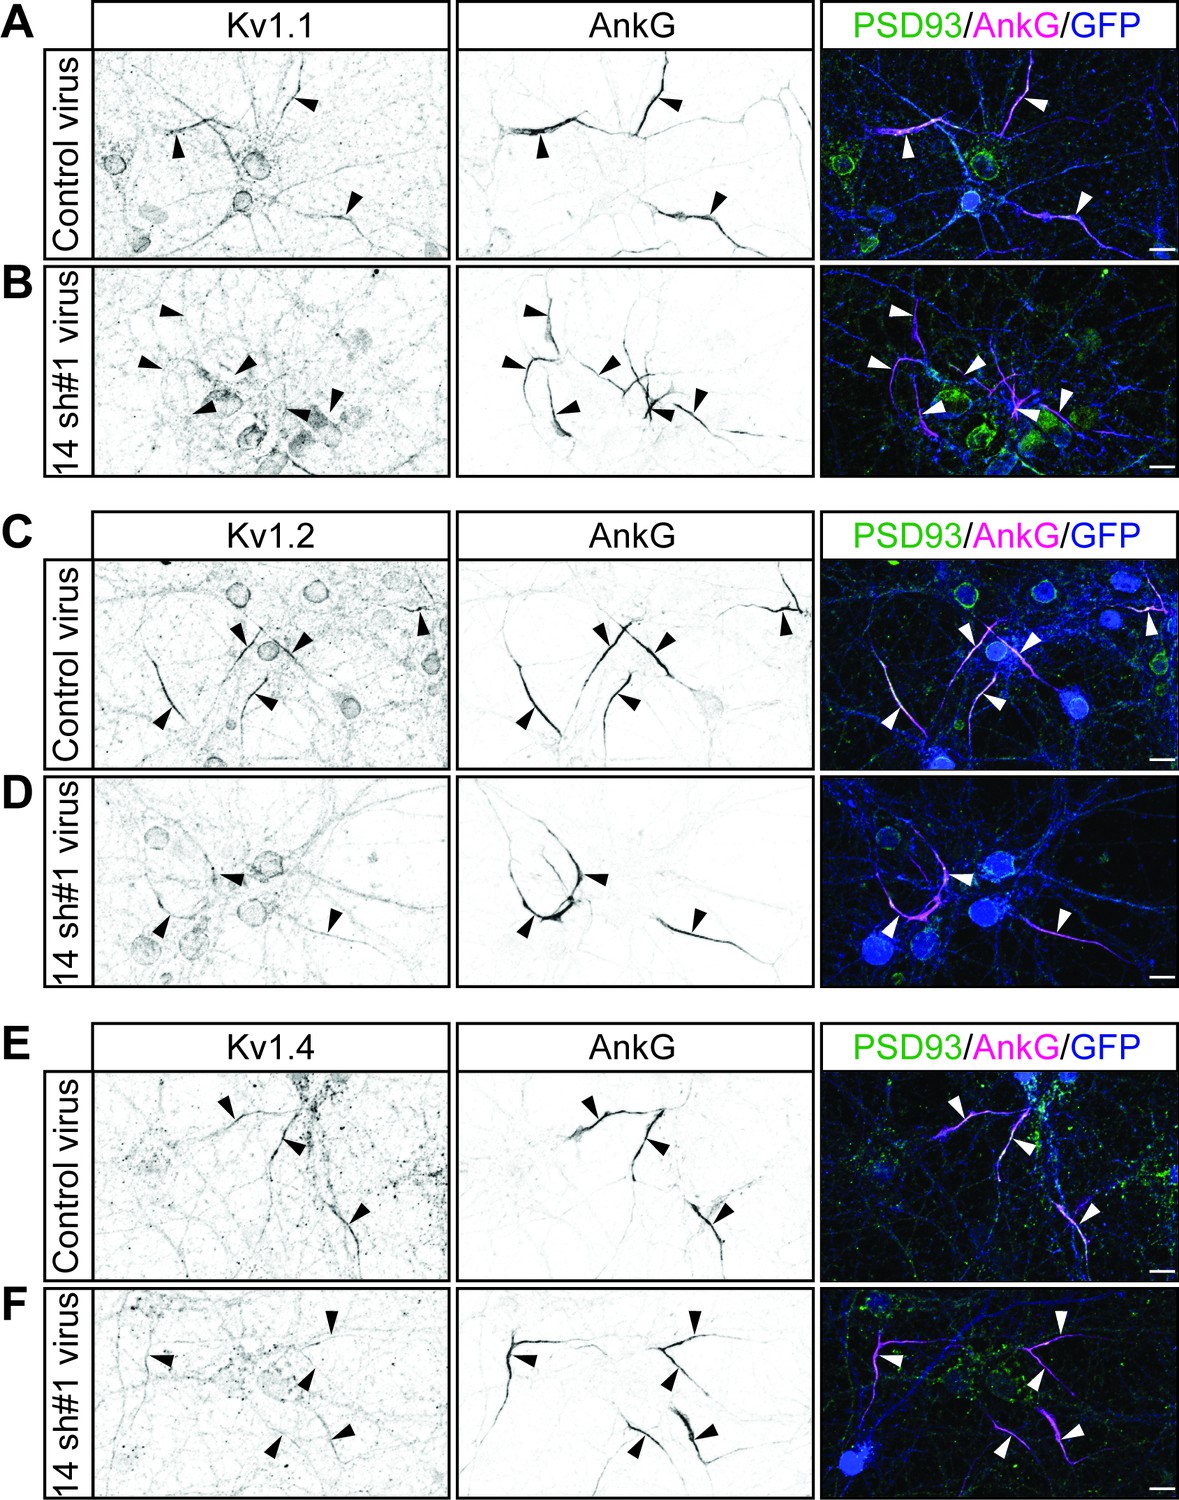
ZDHHC14 is required for Kv1-type potassium channel targeting to the AIS in hippocampal neurons.
Hippocampal neurons were transduced on DIV9 with lentiviruses to express GFP without (Control; A) or with Zdhhc14 shRNA#1 (B) and fixed on DIV16 to detect Kv1.1 (left column and green in merged images on right), AnkG (AIS marker, middle column and magenta in merged images on right) and GFP (marker of infected neurons, blue in merged images, right column). Lower panels show magnified view of red or white dashed boxed area in upper panels. (C and D) integrated density and mean gray value, respectively, of Kv1.1 signal within AnkG-defined AIS from images from A, normalized to control condition (C: Mann Whitney test *p=0.020, N = 3 independent cultures, U = 1.00). (D: Mann Whitney test *p=0.020, N = 3 independent cultures, U = 1.00). (E and F) as in A and B, except that antibodies were used to detect Kv1.2, AnkG, and GFP. (G and H) as in C and D but for Kv1.2 AIS targeting from images from E and F (G: Mann Whitney test p=0.029, N = 4 independent cultures, U = 0.00; H: Mann Whitney test p=0.45, N = 4 independent cultures, U = 5.00). (I and J) as in A and B, except that antibodies were used to detect Kv1.4, AnkG, and GFP. (K and L) as in C and D but for Kv1.4 AIS targeting from images from I and J (K: Mann Whitney test *p=0.029, N = 3 independent cultures, U = 0.0; L: Mann Whitney test *p=0.029, N = 3 independent cultures, U = 0.0). Scale bar in full and magnified views: 10 μm. Arrowheads in all panels indicate additional non-magnified AISs in the image. An additional set of example images is provided in Figure 7—figure supplement 1.
-
Figure 7—source data 1
Source data for Figure 7C,D,G,H,K and L.
- https://cdn.elifesciences.org/articles/56058/elife-56058-fig7-data1-v2.xlsx
Figure 7—figure supplement 1
Additional example images showing that ZDHHC14 is required for Kv1-type potassium channel targeting to the AIS in hippocampal neurons.
Hippocampal neurons transduced with lentivirus to express GFP alone (Control; A) or with Zdhhc14 shRNA#1 (B) and fixed on DIV16 to detect Kv1.1 (left column and green in merged images on right), AnkG (AIS marker, middle column and magenta in merged images on right) and GFP (marker of infected neurons, blue in merged images, right column). (C and D) as in A and B, except that antibodies were used to detect Kv1.2, AnkG, and GFP. (E and F) as in A and B, except that antibodies were used to detect Kv1.4, AnkG, and GFP. Arrowheads indicate AISs in image. Scale bar: 10 μm.
Figure 8
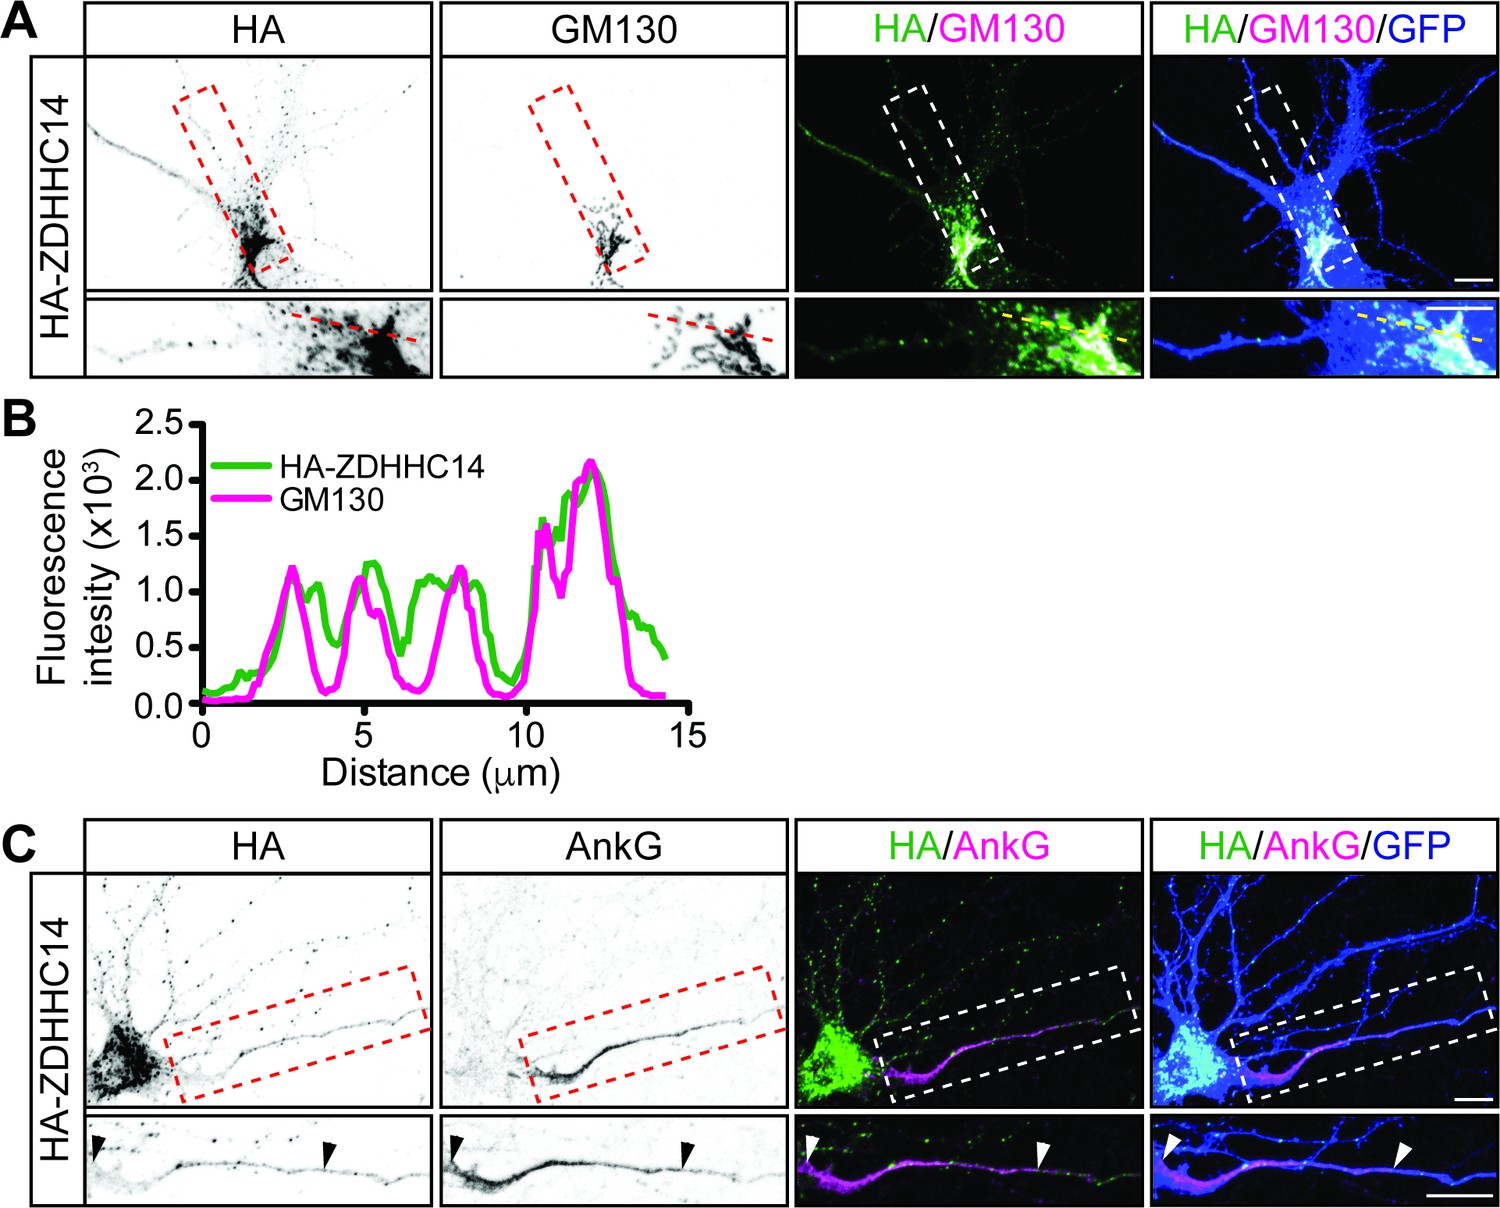
ZDHHC14 predominantly localizes to the Golgi.
(A) Hippocampal neurons were transfected to express GFP and HA-ZDHHC14. Neurons were then fixed and immunostained with antibodies against HA (left column and green in merged images), GM130 (Golgi marker, second column and magenta in merged images), and GFP (marker of infected neurons, blue in merged, right column). Magnified views of red or white dashed boxed area of top row images are shown below. (B) Graph of the fluorescent intensity profiles of HA-ZDHHC14 (green) and GM130 (red) along the red or yellow dotted line indicated in the lower panels of A. (C) Neurons transfected as in A were immunostained with antibodies against HA (left column and green in merged images), AnkG (AIS marker, second column and magenta in merged images), and GFP (marker of infected neurons, blue in merged, right column). Magnified views of boxed area of top row images are shown below and arrowheads indicate the start and end of the AIS. Scale bar: 10 μm.
-
Figure 8—source data 1
Source data for Figure 8B.
- https://cdn.elifesciences.org/articles/56058/elife-56058-fig8-data1-v2.xlsx
Figure 9
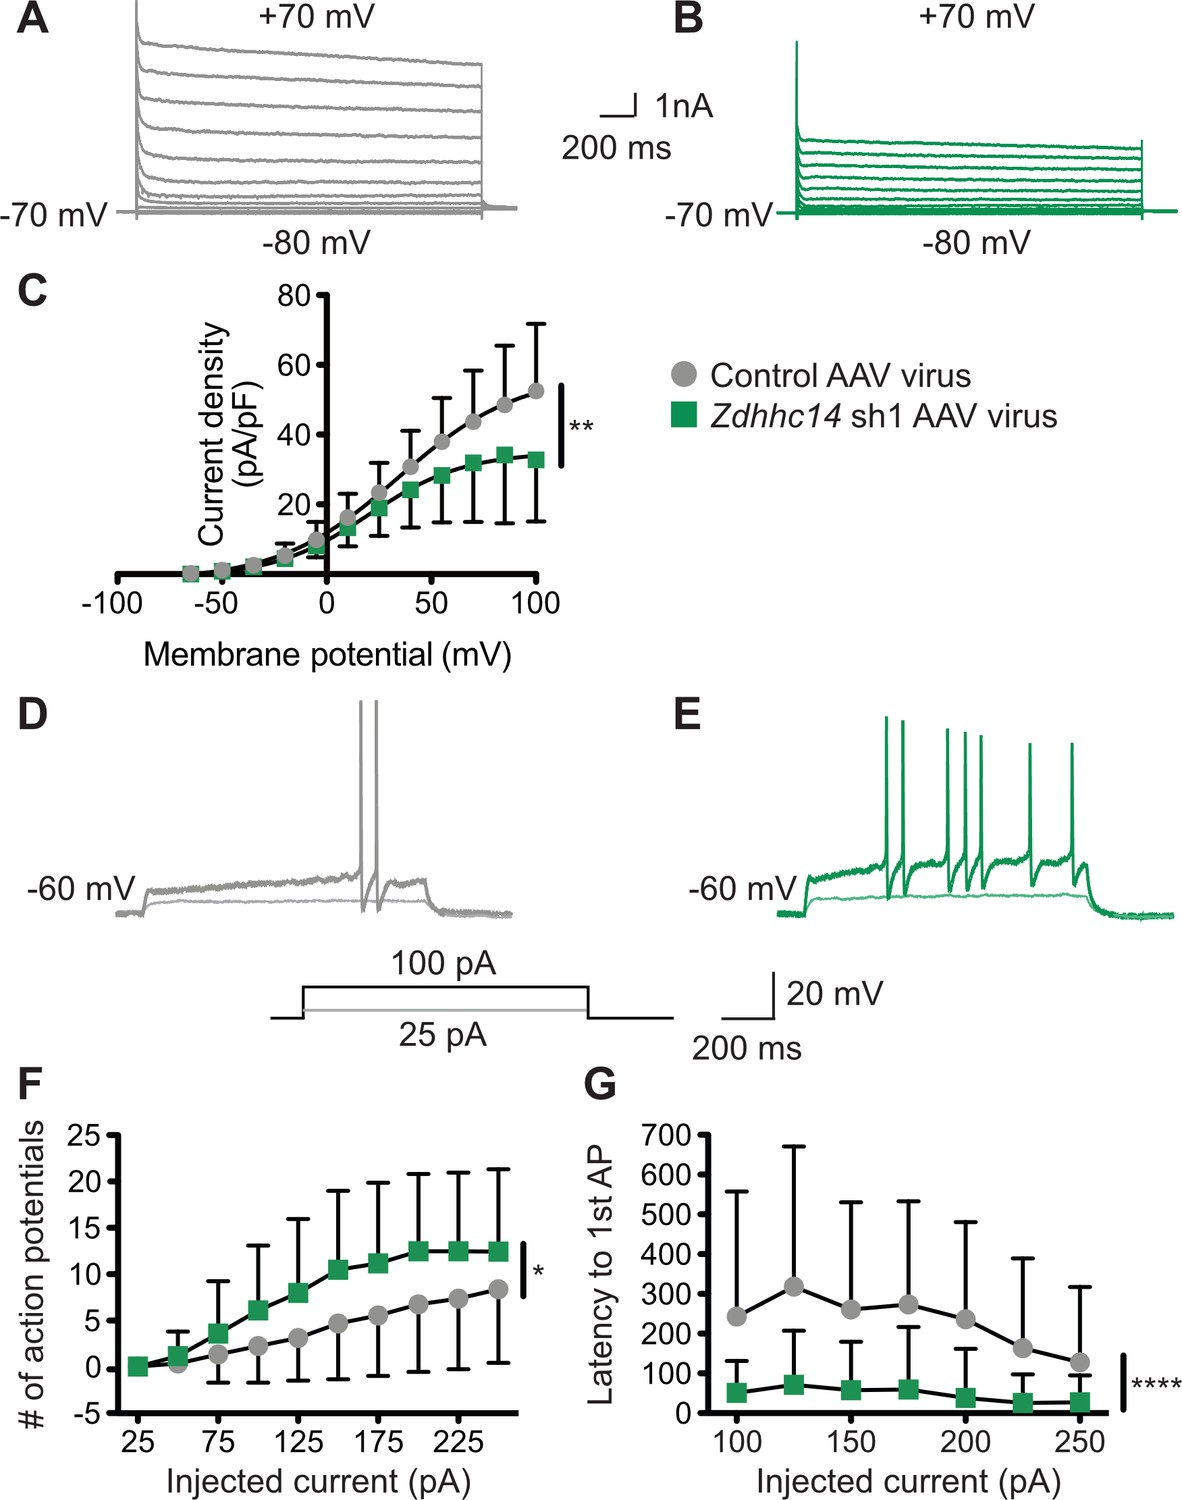
Loss of ZDHHC14 increases excitability of hippocampal neurons.
(A, B) Hippocampal neurons were transduced with AAV to express GFP alone (A) or GFP plus Zdhhc14 shRNA#1 (B) and GFP-positive cells were subjected to whole-cell patch-clamp. Representative traces showing the development of outward currents following voltage steps from −80 to +100 mV (Δ15 mV). (C) Summary graph of outward current density following steps of the indicated voltages for neurons infected with control AAV (gray circles) or Zdhhc14 sh#1 AAV (green squares). Zdhhc14 knockdown reduces outward current density (C) Repeated Measures ANOVA, Virus p=0.18 [F(1)=2.06], membrane potential p<0.0001 [F(12)=73.14], **interaction p=0.0027 [F(12)=2.68]; (N = 7). There was also a significant difference (p<0.0001 [F(4)=8.46]) between conditions when the two curves were fitted with a Boltzmann equation. (D, E) Membrane potential was kept at −60 to −65 mV mV by injecting a small DC current through the recording pipette and voltage responses to the indicated current injection steps were measured. Representative traces from control (D) and Zdhhc14 shRNA#1 (E) transduced neurons in response to the indicated current injection steps are shown. (F, G) Summary graphs of number of action potentials fired (F) and latency to first action potential (AP, G) following injection of the indicated currents for neurons infected with control AAV (gray circles) or Zdhhc14 sh#1 AAV (green squares). Zdhhc14 knockdown increases AP firing (F: Repeated Measures ANOVA, *Virus p=0.020 [F(1)=5.84], injected current p<0.0001 [F(9)=49.31], interaction p=0.0002 [F(9)=3.64]; N = 23) and decreases latency to first AP (G: mixed effects model analysis, ****Virus p<0.0001 [F(1,43)=19.99], injected current p<0.0001 [F(3.35, 116.70)=15.18], interaction p<0.0001 [F(6, 209)=6.30]; N = 23).
-
Figure 9—source data 1
Source data for Figure 9C,F and G.
- https://cdn.elifesciences.org/articles/56058/elife-56058-fig9-data1-v2.xlsx
Tables
Table 1
Electrophysiological properties of control and Zdhhc14 sh#1 (14 sh#1) AAV- infected hippocampal neurons.
| Control AAV | 14sh#1 AAV | p-value | |
|---|---|---|---|
| Vhold (mV) | −63.14 +/− 1.53 | −63.13 +/− 1.30 | 0.67MW |
| Rheobase (mA) | 140.22 +/− 75.84 | 86.96 +/− 39.07 | **0.0052MW |
| Peak amplitude (mV) | 103.33 +/− 7.66 | 87.41 +/− 10.00 | ****0.00000028 |
| Half width (ms) | 2.68 +/− 0.50 | 3.02 +/− 0.94 | 0.18MW |
| Max rise slope (mV/ms) | 154.15 +/− 49.03 | 89.76 +/− 44.78 | ****<0.0001MW |
| Max decay scope (mV/ms) | −42.21 +/− 8.39 | −33.16 +/−9.90 | **0.0017 |
| Input resistance: −25 pA | 324.86 +/− 144.03 | 393.27 +/− 189.20 | 0.17 |
| −50 pA | 326.76 +/− 146.95 | 409.55 +/− 160.52 | 0.075 |
| −75 pA | 319.91 +/− 132.03 | 411.04 +/− 163.64 | *0.044 |
| −100 pA | 304.48 +/− 113.12 | 397.83 +/− 160.32 | *0.027 |
| Peak dV/dt | 133.62 +/− 40.47 | 85.45 +/− 41.07 | ***0.0002 |
| Anti-peak dV/dt | −37.62 +/− 7.99 | −32.11 +/− 9.56 | *0.038 |
| Resting membrane potential (mV) | −60.51 +/− 8.08 | −54.79 +/− 8.31 | *0.022 |
-
Mean +/− SD is shown; N = 23; data were analyzed using unpaired Student’s t-test unless otherwise indicated: MW=Mann Whitney test.
-
Table 1—source data 1
Source data for Table 1.
- https://cdn.elifesciences.org/articles/56058/elife-56058-table1-data1-v2.xlsx
Key resources table
| Reagent type (species) or resource | Designation | Source or reference | Identifiers | Additional information |
|---|---|---|---|---|
| Other | ZDHHC14 | GenBank | NP_078906.2 | Protein (Homo sapiens) |
| Other | ZDHHC14 | GenBank | NP_666185.3 | Protein (Mus musculus) |
| Other | ZDHHC14 | GenBank | NP_001034432.1 | Protein (Rattus norvegicus) |
| Other | ZDHHC14 | GenBank | XP_004914695.1 | Protein (Xenopus tropicalis) |
| Other | ZDHHC14 | GenBank | XP_005160409.1 | Protein (Danio rerio) |
| Other | ZDHHC14 | GenBank | XP_002127630.1 | Protein (Ciona intestinalis) |
| Other | app (approximated) | GenBank | NP_001137937.1 | Protein (Drosophila melanogaster) |
| Other | DHHC-2 | GenBank | NP_0493007.2 | Protein (Caenorhabditis elegans) |
| Other | PSD93β (Dlg2 gene product) | GenBank | XP_017445141.1 | Protein (R. norvegicus) |
| Other | PSD93β | GenBank | NP_001338205.1 | Protein (H. sapiens) |
| Other | Kv1.1 | GenBank | NP_775118.1 | Protein (R. norvegicus) |
| Other | Kv1.2 | GenBank | NP_037102.1 | Protein (R. norvegicus) |
| Other | Kv1.4 | GenBank | NP_037103.1 | Protein (R. norvegicus) |
| Other | Kv1.1 | GenBank | NP_000208.2 | Protein (H. sapiens) |
| Other | Kv1.1 | GenBank | NP_034725.3 | Protein (M. musculus) |
| Other | Kv1.1 | GenBank | XP_004912858.1 | Protein (X. tropicalis) |
| Other | Kv1.1 | GenBank | XP_005163101.1 | Protein (D. rerio) |
| Other | Sh (Shaker) | GenBank | NP_523393.3 | Protein (D. melanogaster) |
| Other | SHK-1 | GenBank | NP_871935.1 | Protein (C. elegans) |
| Recombinant DNA reagent | FEW-PSD93α-myc | This paper | Source: Thomas Lab | Lentiviral construct to transfect (HEK293 cells and rat neurons) and express R. norvegicus cDNA |
| Recombinant DNA reagent | FEW-PSD93β-myc | This paper | Source: Thomas Lab | Lentiviral construct to transfect (HEK293 cells and rat neurons) and express R. norvegicus cDNA |
| Recombinant DNA reagent | FEW-PSD93β-myc C10S | This paper | Source: Thomas Lab | Lentiviral construct to transfect (HEK293 cells and rat neurons) and express R. norvegicus cDNA |
| Recombinant DNA reagent | FEW-PSD93β-myc C16,18S | This paper | Source: Thomas Lab | Lentiviral construct to transfect (HEK293 cells and rat neurons) and express R. norvegicus cDNA |
| Recombinant DNA reagent | FEW-PSD93β-myc C10,16,18S | This paper | Source: Thomas Lab | Lentiviral construct to transfect (HEK293 cells and rat neurons) and express R. norvegicus cDNA |
| Recombinant DNA reagent | FEW-PSD93β-myc 5CS | This paper | Source: Thomas Lab | Lentiviral construct to transfect (HEK293 cells and rat neurons) and express R. norvegicus cDNA |
| Recombinant DNA reagent | FEW-HA-Zdhhc14 | This paper | Source: Thomas Lab | Lentiviral construct to transfect (HEK293 cells and rat neurons) and express M. musculus cDNA |
| Recombinant DNA reagent | FEW-HA-Zdhhc14 LSSE | This paper | Source: Thomas Lab | Lentiviral construct to transfect (HEK293 cells and rat neurons) and express M. musculus cDNA |
| Recombinant DNA reagent | FUGW | Addgene | Cat #14883 (RRID:Addgene_14883) | Lentiviral construct to transduce rat neurons and express Human UbC-driven EGFP |
| Recombinant DNA reagent | FUGW H1-Zdhhc14sh#1 | This paper | Source: Thomas Lab | Lentiviral construct to transduce rat neurons and express Human UbC-driven EGFP and H1-driven shRNA (sequence: GCATTCAGAGCACCAAATTCGT) |
| Recombinant DNA reagent | FUGW H1-Zdhhc14sh#2 | This paper | Source: Thomas Lab | Lentiviral construct to transduce rat neurons and express Human UbC-driven EGFP and H1-driven shRNA (sequence: GCCACACTCTCAGACATTAT) |
| Recombinant DNA reagent | pAAV-GFP-Zdhhc14sh#1 | This paper | Source: Thomas Lab | AAV construct to transduce rat neurons and express EGFP and shRNA Backbone Addgene plasmid #26937 |
| Recombinant DNA reagent | pPC97 | Dong et al., 1997 | ||
| Recombinant DNA reagent | pPC97 wild type Zdhhc14 C-term tail | This paper | Source: Thomas Lab | Zdhhc14 M. musculus gene fragment |
| Recombinant DNA reagent | pPC97 Zdhhc14 C-term tail LSSE | This paper | Source: Thomas Lab | Zdhhc14 M. musculus gene fragment |
| Recombinant DNA reagent | pPC86 | Dong et al., 1997 | ||
| Recombinant DNA reagent | pPC86 PSD93 PDZ3 | This paper | Source: Thomas Lab | Dlg2 (Psd93) M. musculus gene fragment |
| Recombinant DNA reagent | pCIS GST-Zdhhc14 C-term tail | This paper | Source: Thomas Lab | Zdhhc14 M. musculus gene fragment transfected in HEK293T cells |
| Recombinant DNA reagent | pCIS GST-Zdhhc14 C-term tail LSSV | This paper | Source: Thomas Lab | Zdhhc14 M. musculus gene fragment transfected in HEK293T cells |
| Recombinant DNA reagent | pMDLg | Addgene | Cat #12251 (RRID:Addgene_12251) | Lentiviral Gag and Pol expressing plasmid |
| Recombinant DNA reagent | pRSV-Rev | Addgene | Cat #12253 (RRID:Addgene_12253) | Lentiviral Rev expressing plasmid |
| Recombinant DNA reagent | pMD2.G | Addgene | Cat #12259 (RRID:Addgene_12259) | Lentiviral VSV-G envelope expressing plasmid |
| Recombinant DNA reagent | pHelper | Agilent | Cat #240071 | |
| Recombinant DNA reagent | pAAV-RC | Agilent | Cat #240071 | |
| Strain, strain background (S. cerevisiae) | PJ69 | James et al., 1996 | ||
| Strain, strain background (S. cerevisiae) | HF7C | Feilotter et al., 1994 | ||
| Biological sample (R. norvegicus) | Primary hippocampal neurons | Charles River | Freshly isolated from embryonic day 18 hippocampi | |
| Antibody | Anti-PSD93 (mouse monoclonal IgG1) | NeuroMab | Cat #75–057 (RRID:AB_2277296) | WB (1:500) IF (1:100) |
| Antibody | Anti-Kv1.1 (mouse IgG2b) | NeuroMab | Cat #75–105 (RRID:AB_2128566) | WB (1:500) IF (1:100) |
| Antibody | Anti-Kv1.2 (mouse monoclonal IgG2b) | NeuroMab | Cat #75–008 (RRID:AB_2296313) | WB (1:500) IF (1:100) |
| Antibody | Anti-Kv1.4 (mouse monoclonal IgG1) | NeuroMab | Cat #75–010 (RRID:AB_2249726) | WB (1:500) IF (1:100) |
| Antibody | Anti-GluN2B (mouse monoclonal IgG2b) | NeuroMab | Cat #75–101 (RRID:AB_2232584) | WB (1:200) |
| Antibody | Anti-AnkG (mouse monoclonal IgG2a) | NeuroMab | Cat #75–146 (RRID:AB_10673030) | IF (1:200) |
| Antibody | Anti-GST (rabbit polyclonal) | Bethyl Laboratories | Cat #A190-122A (RRID:AB_67419) | WB (1:5000) |
| Antibody | Anti-HA tag (rabbit monoclonal) | Cell Signaling Technologies | Cat #3724 (RRID:AB_1549585) | WB (1:5000) |
| Antibody | Anti-Erk1/2 (rabbit monoclonal) | Cell Signaling Technologies | Cat #4696 (RRID:AB_390780) | WB (1:1000) |
| Antibody | Anti-Histone H3 (rabbit monoclonal) | Cell Signaling Technologies | Cat #4499 (RRID:AB_10544537) | WB (1:1000) |
| Antibody | Anti-Myc tag (rabbit monoclonal) | Cell Signaling Technologies | Cat #2278 (RRID:AB_490778) | WB (1:5000) IF (1:500) |
| Antibody | Anti-GAP43 (rabbit polyclonal) | Novus Biologicals | Cat #NB300-143 (RRID:AB_10001196) | WB (1:5000) |
| Antibody | Anti-GFP (chicken polyclonal) | Millipore-Sigma | Cat #AB16901 (RRID:AB_90890) | IF (1:500) |
| Antibody | Anti-GFP (rabbit polyclonal) | Thermo-Fisher Scientific | Cat #A-11122 | IF (1:1000) |
| Antibody | Sheep anti-mouse HRP-linked polyclonal | Millipore-Sigma | Cat #NA931 | WB (1:5000) |
| Antibody | Donkey anti-rabbit HRP-linked polyclonal | Jackson Immunoresearch | Cat #711–0350152 | WB (1:5000) |
| Antibody | AlexaFluor 488 goat anti-chicken polyclonal | Thermo Fisher Scientific | Cat #A-11039 (RRID:AB_142924) | IF (1:500) |
| Antibody | AlexaFluor 488 goat anti-rabbit polyclonal | Thermo Fisher Scientific | Cat #A-11032 (RRID:AB_2534091) | IF (1:500) |
| Antibody | AlexaFluor 568 goat anti-rabbit polyclonal | Thermo Fisher Scientific | Cat #A-11011 (RRID:AB_143157) | IF (1:500) |
| Antibody | AlexaFluor 568 goat anti-IgG2a polyclonal | Thermo Fisher Scientific | Cat #A-21134 (RRID:AB_2535773) | IF (1:500) |
| Antibody | AlexaFluor 647 goat anti-IgG2a polyclonal | Thermo Fisher Scientific | Cat #A-21241 (RRID:AB_141698) | IF (1:500) |
| Antibody | AlexaFluor 647 goat anti-IgG1 polyclonal | Thermo Fisher Scientific | Cat #A-21240 (RRID:AB_141658) | IF (1:500) |
| Antibody | AlexaFluor 647 goat anti-IgG2b polyclonal | Thermo Fisher Scientific | Cat #A-21242 (RRID:AB_2535811) | IF (1:500) |
| Antibody | Anti-ZDHHC14 rabbit polyclonal | This paper | Source: Thomas Lab | Immunogen: CDSLHEDSVRGLVKLSSV WB (1:200) |
| Chemical compound, drug | MMTS | Thermo Fisher Scientific | Cat #23011 | |
| Chemical compound, drug | Hydroxylamine | Thermo Fisher Scientific | Cat #26103 | |
| Chemical compound, drug | Biotin-HPDP | Soltec Ventures | Cat #B106 | |
| Chemical compound, drug | CNQX | Abcam | Cat #Ab1200017 | |
| Chemical compound, drug | D-AP5 | Abcam | Cat #Ab120003 | |
| Chemical compound, drug | Picrotoxin | Abcam | Cat #Ab120315 | |
| Commercial assay or kit | Pierce BCA Protein assay | Thermo Fisher Scientific | #23225 | |
| Other | High capacity Neutravidin-conjugated beads | Thermo Fisher Scientific | #29202 | |
| Other | Glutathione Sepharose | GE Healthcare | #17075601 | |
| Other | Lipofectamine 2000 | Thermo Fisher Scientific | #11668030 | |
| Software, algorithm | ImageJ Fiji | Schindelin et al., 2012; Schneider et al., 2012 | (RRID:SCR_003070) | |
| Software, algorithm | Clampfit 10 | Molecular Devices | RRID:SCR_011323 | |
| Software, algorithm | Axograph X version 1.6.4 | AxoGraph Scientific | https://axograph.com/ | |
| Software, algorithm | Prism version 8 | GraphPad | RRID:SCR_002798 | |
| Cell line (H. sapiens) | HEK293T | ATCC | Cat #CRL-3216 (RRID:CVCL_0063) | The identity of the cell line used in this study was authenticated by ATCC using STR profiling and was found to be an exact match to CRL-3216 (HEK293T) in the ATCC STR database. The cells have been tested for mycoplasma nd are negative. |
| Cell line (H. sapiens) | AAV-Pro HEK293T | Takara Bio | Cat #632273 |
Additional files
Download links
A two-part list of links to download the article, or parts of the article, in various formats.
Downloads (link to download the article as PDF)
Open citations (links to open the citations from this article in various online reference manager services)
Cite this article (links to download the citations from this article in formats compatible with various reference manager tools)
The palmitoyl acyltransferase ZDHHC14 controls Kv1-family potassium channel clustering at the axon initial segment
eLife 9:e56058.
https://doi.org/10.7554/eLife.56058


