Long-term implicit memory for sequential auditory patterns in humans
- UCL Ear Institute, University College London, United Kingdom
- School of Electronic Engineering and Computer Science, Queen Mary University of London, United Kingdom
- Department of Clinical Medicine, Aarhus University, Denmark
Figures
Figure 1
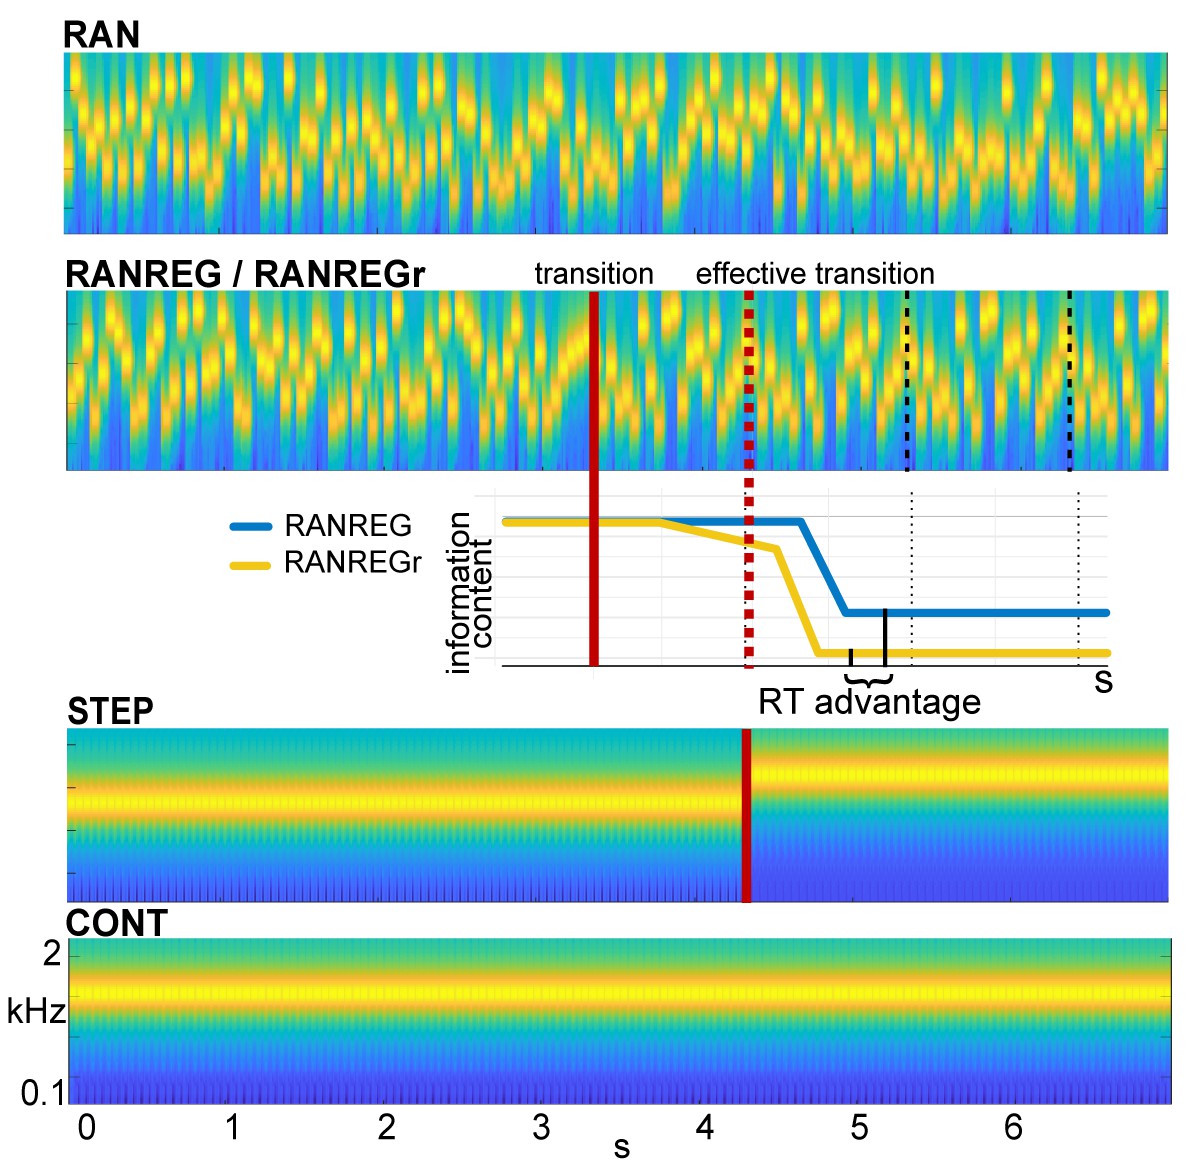
Example stimuli.
Sequences were generated anew on each trial from a pool of 20 tone-pips of 50 ms duration each. RAN sequences were generated by randomly sampling from the full pool with replacement; RANREG sequences contained a transition from a random (RAN) to a regularly repeating cycles of 20 tone-pips (REG, cycles are marked with dashed lines). Therefore, the transition was manifested as a change in pattern only, whilst maintaining the same long-term first-order statistics. The transition (randomized between 3 and 4 s post onset) is indicated by a red line; the red dashed line marks the ‘effective’ transition – the point at which the pattern starts repeating and hence becomes statistically detectable. Participants were instructed to respond to such transitions (50% of trials) as soon as possible. STEP stimuli, containing a step change in frequency, (and their ‘no change’ control, CONT) were also included in the stimulus set for the purpose of estimating simple reaction time. Three (six in Exp. 4 and Exp. S1 in Appendix 1) particular regular patterns (REGr) were presented identically across three trials within a block (RANREGr). Reoccurrences were spaced ~3 min apart. Different REGr were used for each participant. A schematic representation of outputs from the observer model is provided to illustrate how pattern reoccurrence might affect reaction time. For each tone in a sequence, the model outputs information content (IC) as a measure of its unexpectedness, given the preceding context. After the transition from a RAN to REG pattern, the IC drops over a few consecutive tones, reflecting the discovery of the REG. The brain is hypothesized to be sensitive to this change in IC, and once sufficient evidence has been accumulated, the emergent regularity ‘pops out’ perceptually. Therefore, RTs to onset of regularities can be used to quantify the amount of sensory information (number of tone-pips), required to detect the increasing predictability within the unfolding sequence. The black solid lines indicate the crossing of this putative evidence threshold (when the information content becomes clearly distinguishable from the RAN baseline). For novel patterns (blue line), this typically occurs within the second cycle. For reoccurring patterns (yellow line), IC is expected to show an earlier drop, and therefore lead to faster RT (‘RT advantage’).
Figure 2 with 3 supplements
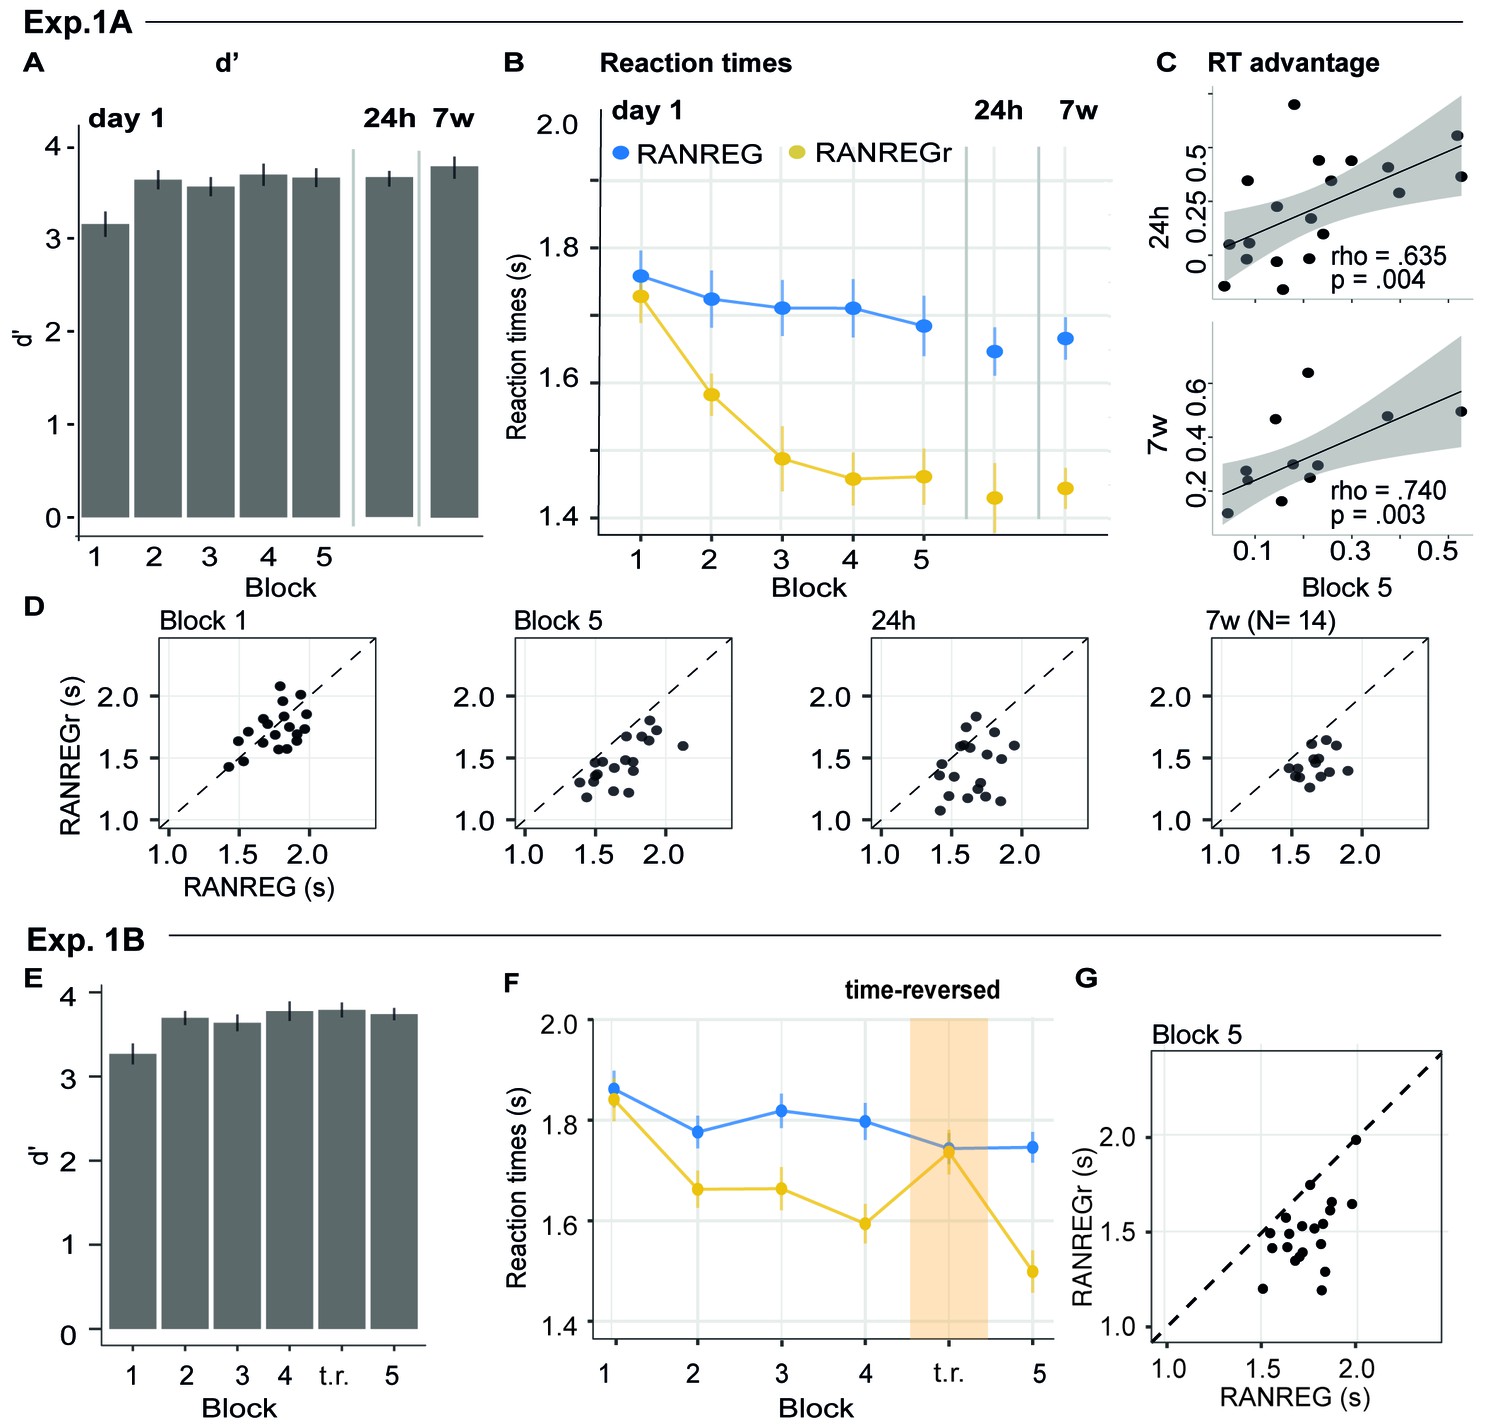
Experiment 1A (N = 19), 1B (N = 20): implicit long-lasting memory for three reoccurring patterns and specificity to sequential structure.
(A–D) Exp. 1A (three reoccurring targets). (A) Sensitivity to emergence of regularity (d') across blocks during the first session, as well as after 24 hr and after 7 weeks. Error bars indicate 1 s.e.m. (B) RT to the transition from random to regular pattern in RANREG and RANREGr conditions, across blocks. Error bars indicate 1 s.e.m. ‘Figure 2—figure supplement 1 plots the RT advantage for each intra-block presentation. (C) Correlations between RT advantage at the end of the first day – block 5 – and after 24 hr (upper plot) and after 7 weeks (lower plot). Each data point represents an individual. Note N = 14 in the 7W data due to attrition. (D) The relationship between RTs for the RANREG and RANREGr conditions. Each data point represents an individual participant. Dots below the diagonal reveal faster detection of RANREGr compared with RANREG. These implicit memory effects were not linked to explicit memory. See Figure 2—figure supplement 2 for explicit recognition estimates. (E–G) Exp. 1B (time reversal): (E) Sensitivity to emergence of regularity (d’) across blocks. (F) RT to the transition from random to regular pattern in RANREG and RANREGr conditions, across blocks. The block containing time-reversed REGr is shaded in yellow. The RT advantage dropped when REGr were time reversed, and restored in block 5. Figure 2—figure supplement 3 plots the RT advantage for each intra-block presentation. (G) The relationship between RTs to the RANREG and RANREGr conditions in block 5.
Figure 2—figure supplement 1
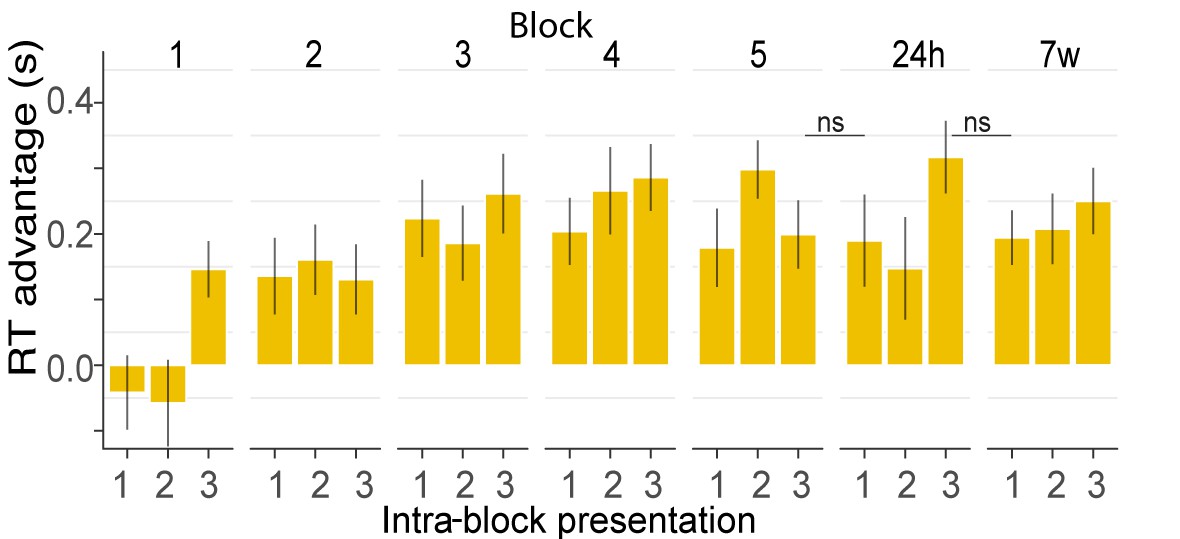
Experiment 1A. RT advantage for each intra-block presentation.
The plot depicts the progressive emergence of an RT advantage with each presentation of REGr. Plotted values correspond to the RT advantage of REGr for each intra-block presentation. RTs of 1 st, 2nd or 3rd intra-block presentations were averaged across the different REGr, and RTs to novel REG were averaged across trials which occurred at the beginning (first third), middle or end of each block. There was no significant difference between the last presentation in block 5, and the first presentation after 24 hr, or between the last presentation after 24 hr and the first presentation after 7 weeks, indicating that the formed memory trace was preserved long term. Error bars indicate 1 s.e.m. Note that the RT for REGr is computed based on three trials and the effects are therefore rather noisy.
Figure 2—figure supplement 2
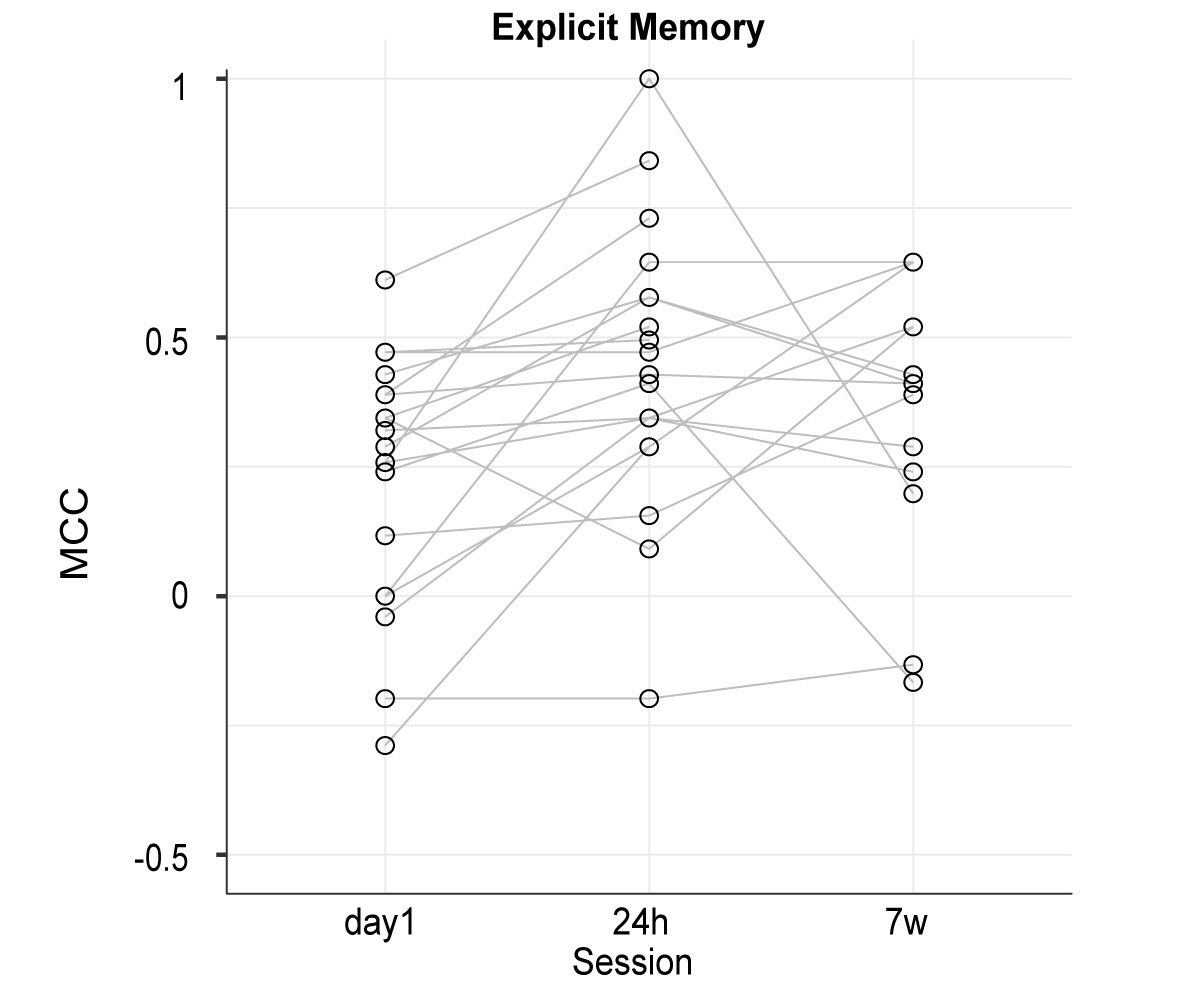
Experiment 1A. Explicit recognition estimates.
MCC coefficient (refer to Materials and methods) computed for the familiarity task performed after the regularity detection task in Exp. 1A. Each dot represents an individual participant. MCC was low overall, indicating low explicit recognition and did not correlate with the RT advantage (refer to main text).
Figure 2—figure supplement 3
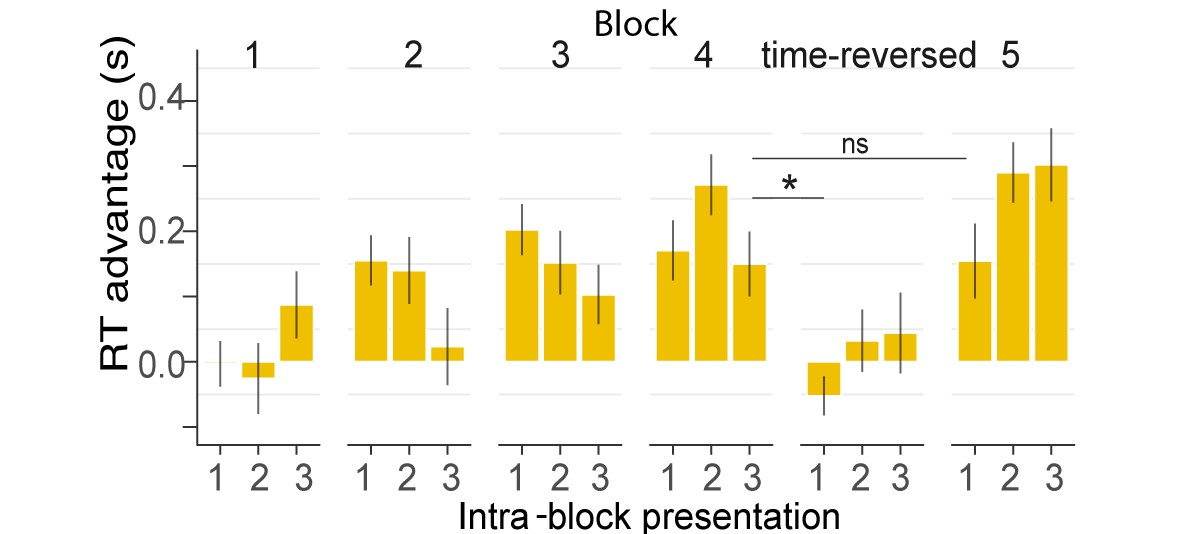
Experiment 1B. RT advantage for each intra-block presentation.
Plotted values correspond to the RT advantage of REGr for each intra-block presentation. RTs of 1 st, 2nd or 3rd intra-block presentations were averaged across the different REGr, and RTs to novel REG were averaged across trials which occurred at the beginning (first third), middle or end of each block. The RT advantage dropped when REGr were time reversed and was restored when the original REGr were re-introduced (block 5). Error bars indicate 1 s.e.m. Note that the RT for REGr is computed based on three trials and the effects are therefore rather noisy.
Figure 3
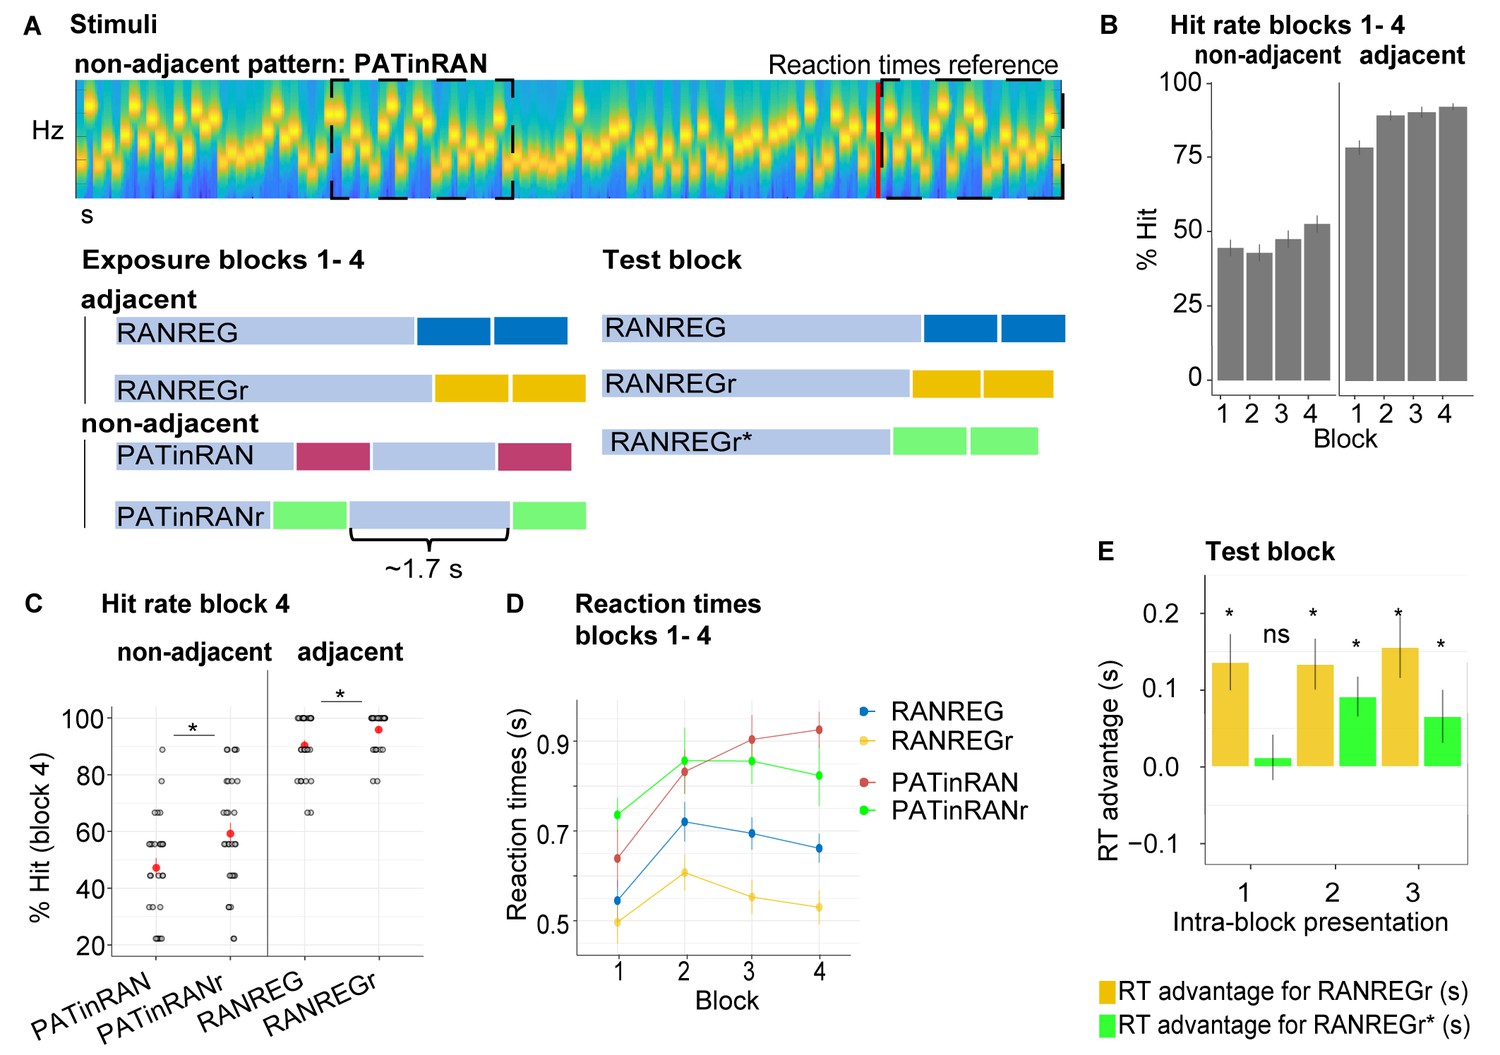
Experiment 2 (N = 30): Limited formation of memory traces of non-adjacent patterns.
(A) In blocks 1 to 4, listeners were exposed to RAN, RANREG, RANREGr, PATinRAN and PATinRANr trials. An example spectrogram for a PATinRAN stimulus is provided. The non-adjacent repetitions of the 20-tones pattern (PAT) are indicated by dashed rectangles. In block 5 (‘test' block) PATinRANr sequences were replaced by versions where the two cycles were set adjacent at the end of the trial (RANREGr*). (B) Accuracy (block 1 to 4): hit rates are computed separately for adjacent (RANREG and RANREGr) and non-adjacent (PATinRAN and PATinRANr) trials. (C) Hit rates in block 4, separately for novel and reoccurring adjacent and non-adjacent conditions. ‘*’ indicates a significant difference between conditions. (D) RT (measured relative to the onset of the second cycle; see red line in A) across blocks 1 to 4 for RANREG, RANREGr, PATinRAN and PATinRANr. Error bars indicate 1 s.e.m. Note that since RT here is computed relative to the onset of the REG repetition, to compare RANREG RT with those reported in figures aboveadd 1 s. (E) Test block: RT advantage for RANREGr (yellow) and RANREGr* (green) in each intra-block presentation. Error bars indicate 1 s.e.m. To determine the presence of a memory trace to REGr* we specifically focus on the first intra-block presentation. ‘*’ indicates a significant RT advantage, ‘ns’ indicates an RT advantage not significantly different from 0.
Figure 4
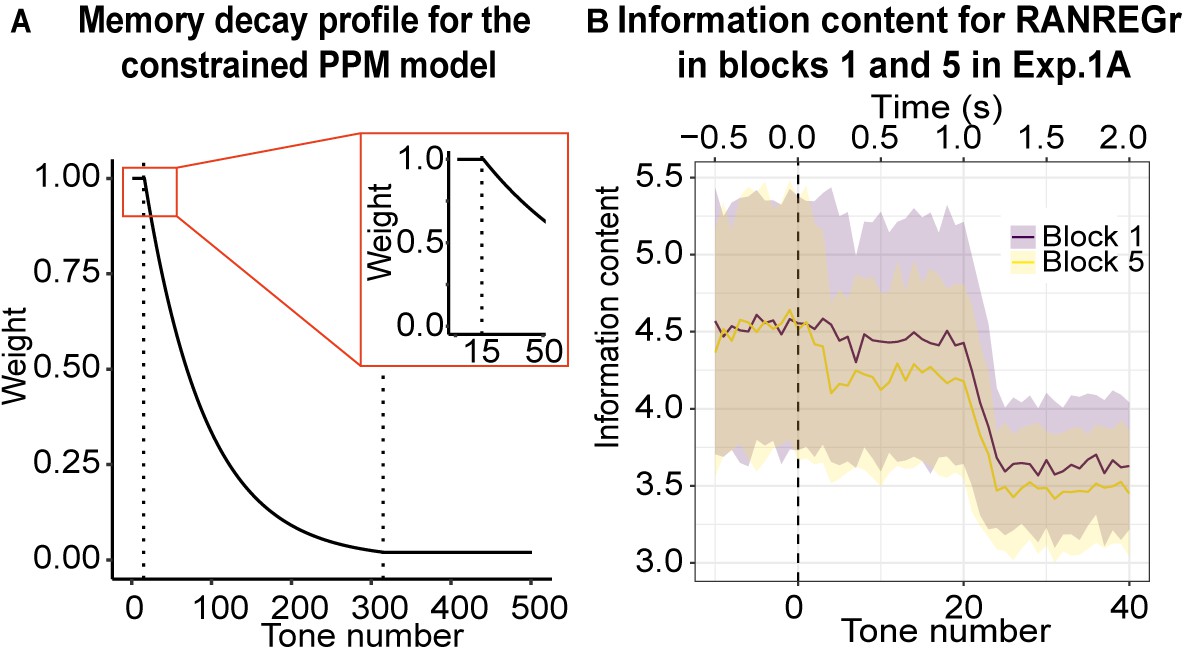
Memory constrained PPM model.
(A) Memory decay profile for the constrained PPM model. The curve describes the weight of a given n-gram observation in memory as a function of the number of consequent tones that have been presented, assuming a constant presentation rate of 20 Hz. The two dotted lines indicate transitions between the different phases of memory decay: the first, between the memory buffer and short-term memory, and the second, between short-term memory and long-term memory. The inset shows the transition from the memory buffer (of 15 tones capacity) to the fast exponential-decay phase. See Table 1 for model parameters. (B) Information content as a function of tone number for RANREGr trials in blocks 1 and 5 of Exp. 1A. Mean Information content is computed from the memory-decay PPM model, expressed in bits, and averaged over all trials. The shaded ribbons correspond to 1 STDEV. Trials are aligned such that a tone number of 0 corresponds to the first REG tone after the transition. The transition between RAN and REG phases becomes clearest after about 24 tones; however, the model detects the transition faster in block five than in block 1, because it partially recognises the REGr cycle from its previous occurrences, yielding a lower information content that is more clearly distinguishable from the RAN baseline and therefore requires less evidence accumulation time (=faster detection). However, it is obvious from the large error bars that the effects are subtle.
Figure 5

Model simulations for Experiments 1A and 2 for the unconstrained (left) vs. constrained (right) PPM model.
Overall, we demonstrate a qualitative similarity between the formal simulation of constrained memory and observed human responses. (A) Exp. 1A: the estimated RTs to the transition from random to regular patterns in RANREG and RANREGr conditions across five consecutive blocks. For RANREG trials, the REG patterns are novel for each trial and the unconstrained PPM model detects transitions after one complete cycle plus eight tones (about 1.4 s; Note that the model change point detection algorithm was configured with a strict threshold in order to achieve an appropriate Type I error rate , see Materials and methods). For RANREGr trials after the first block, the regular patterns are already familiar from previous trials. The unconstrained PPM model remembers these previous patterns perfectly and hence demonstrates an immediate drop in RT. In contrast, the constrained model readily captures human performance, whereby the RT advantage for RANREGr trials slowly grows over successive presentations of the REGr patterns. (B) Exp. 2: RT advantage in RANREGr and RANREGr* conditions for each intra-block presentation within the test block. Data are presented in the same way as in Figure 3E. The unconstrained model reveals an equal RT advantage in both conditions. In contrast, as exhibited by the human listeners, the constrained memory model does not learn the reoccurring non-adjacent patterns across blocks 1 to 4, as shown by the null RT advantage in the first intra-block presentation in the RANREGr* condition. Error bars indicate 1 s.e.m.
Figure 6 with 1 supplement
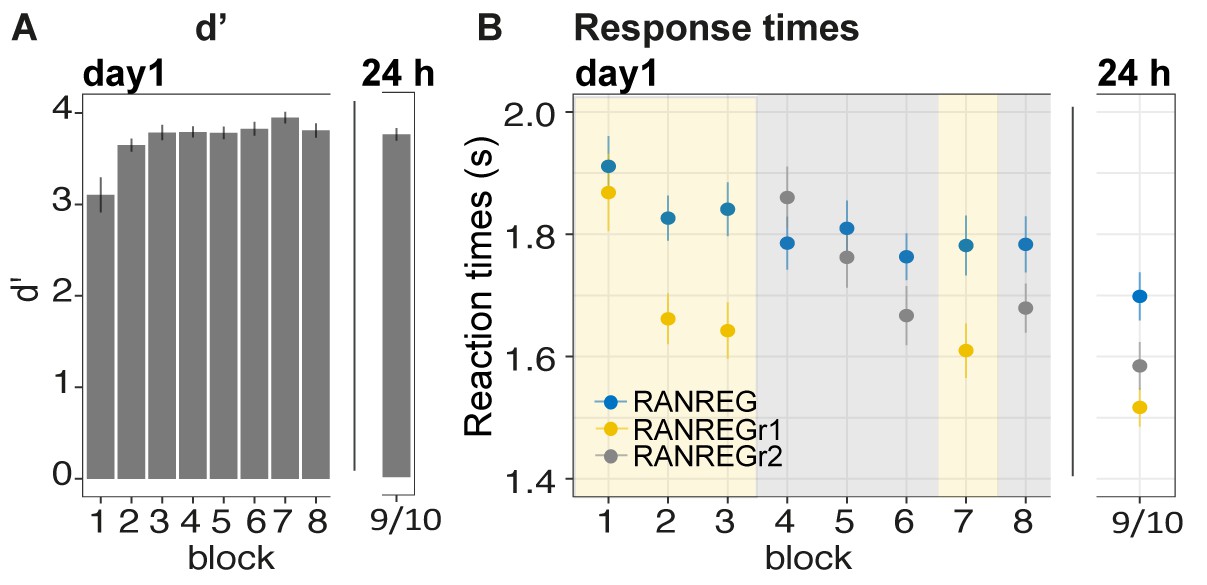
Experiment 3 (N = 29): memories of a set of reoccurring regularities are not overwritten by subsequent memorization of another set.
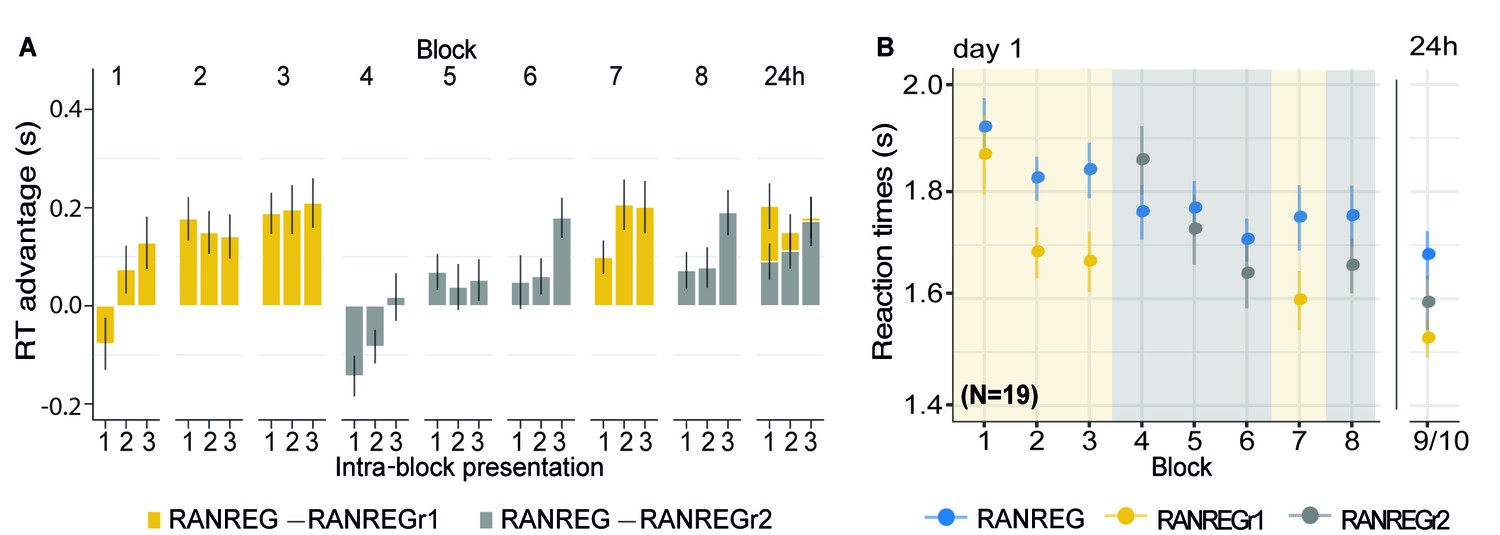
Participants were exposed to a set of three reoccurring patterns in the first three blocks (REGr1, yellow shading), followed by three blocks in which another set of patterns was reoccurring (REGr2, grey shading). The final blocks (7 and 8) tested memory for set 1 and 2, respectively. After 24 hr, memory for the two sets was tested again. (A) d’ across all blocks on day 1 and after 24 hr. Error bars indicate 1 s.e.m. (B) RT to the transition from random to regular pattern across blocks for RANREG, RANREGr1 and RANREGr2 on day 1 and after 24 hr. Error bars indicate 1 s.e.m. Figure 6—figure supplement 1A plots the RT advantage for each intra-block presentation. Figure 6—figure supplement 1B shows the RT data with N = 19.
Figure 6—figure supplement 1
Experiment 3.
(A) RT advantage for each intra-block presentation. Plotted values correspond to the RT advantage of REGr for each intra-block presentation. RTs to the 1st, 2nd or 3rd intra-block presentations were averaged across the different REGr, and RTs to novel REG were averaged across trials which occurred at the beginning (first third), middle or end of each block. The RT advantage for a set of reoccurring patterns (REG1; yellow traces) was not affected by the presentation of another set of REGr (REGr2) in blocks 4–6. Error bars indicate 1 s.e.m. Note that the RT for REGr is computed based on three trials and the effects are therefore rather noisy. (B) RT across blocks with N = 19. The overall pattern was identical to that observed with N = 30 participants (reported in the main text). The RT advantage for the first set of REGr1 observed across the first three blocks [main effect of condition: F(1, 18) = 24.16, p < 0.001, ηp2 = 0.57; main effect of block: F(3, 54) = 11.47, p < 0.001, ηp2 = 0.39; condition by block interaction: F(3, 54) = 3.08, p = 0.035, ηp2 = 0.15] was not perturbed after the presentation of the second set of reoccurring sequences [RT advantage for RANREGr1 in block three vs. block 7: t(18) = .403, p = 0.691].
Figure 7 with 1 supplement
Experiment 4 (N = 20): Implicit memory is robust to pattern phase shifts.
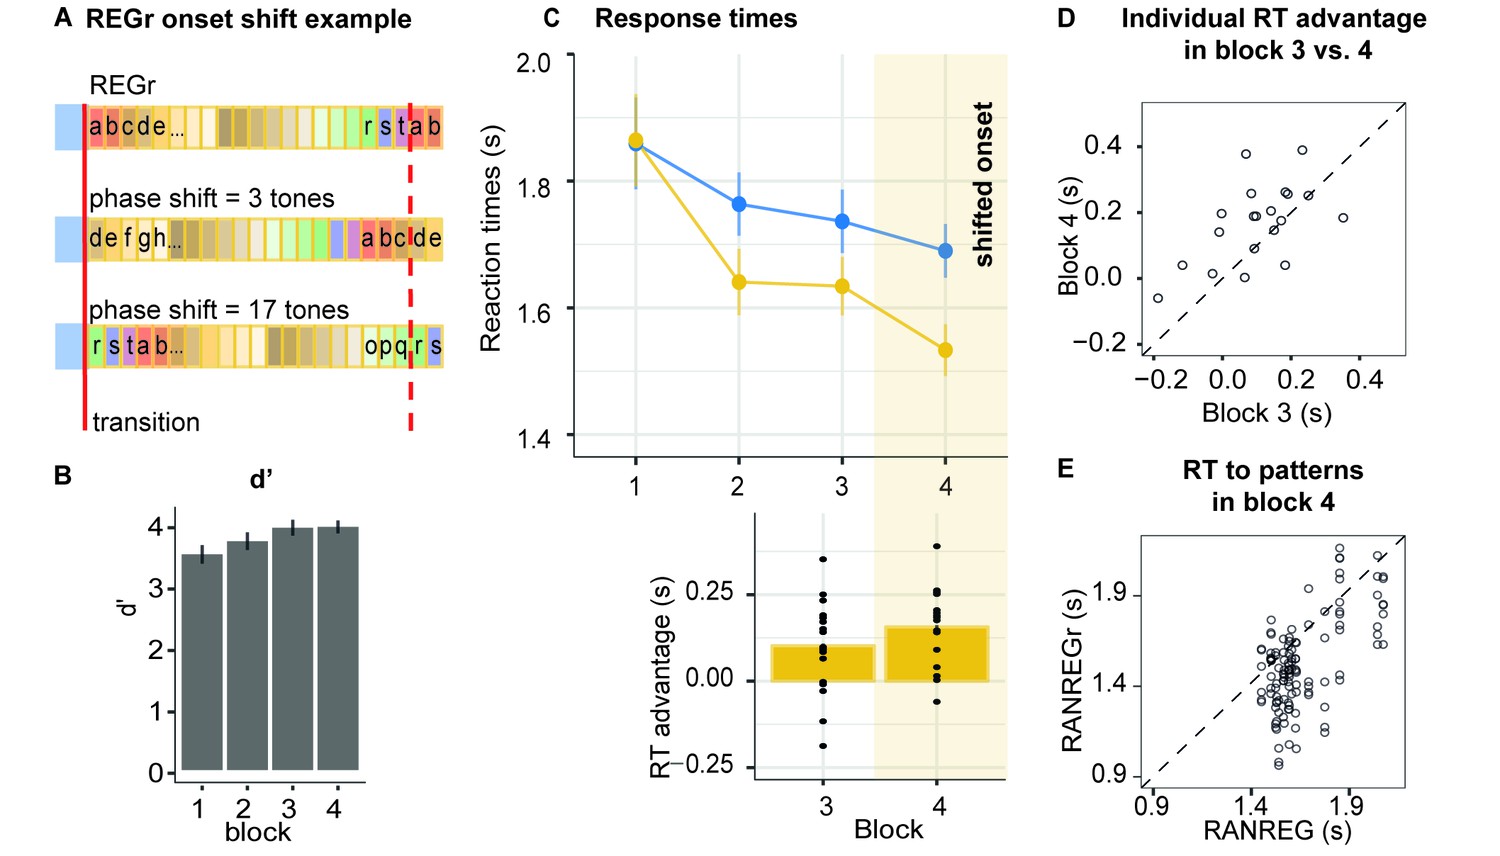
(A) In this experiment, six different reoccurring regularities (REGr) per participant were presented. In block 4 (yellow shading in C), these patterns were replaced by versions with shifted onset relative to the originally learned REGr. Two examples of phase shifted REGr and their original REGr version are depicted. The solid red line indicates the transition between RAN and REG (the onset of the regular pattern); the dashed red line denotes one cycle (20 tones) (B) d’ across all blocks. Error bars indicate 1 s.e.m. (C) RT to the transition from RAN to REG pattern across blocks for RANREG and RANREGr. The bottom plot represents the RT advantage observed in blocks 3 and 4. Error bars indicate 1 s.e.m. Figure 7—figure supplement 1 plots the RT advantage for each intra-block presentation. (D) The individual RT advantage in block three compared with block 4. Each circle represents an individual participant. (E) Plotted is the relationship between RTs to RANREG and RANREGr in block 4. Each circle represents a unique REGr pattern (six per participant), plotted against the mean RT to RANREG for that participant.
Figure 7—figure supplement 1
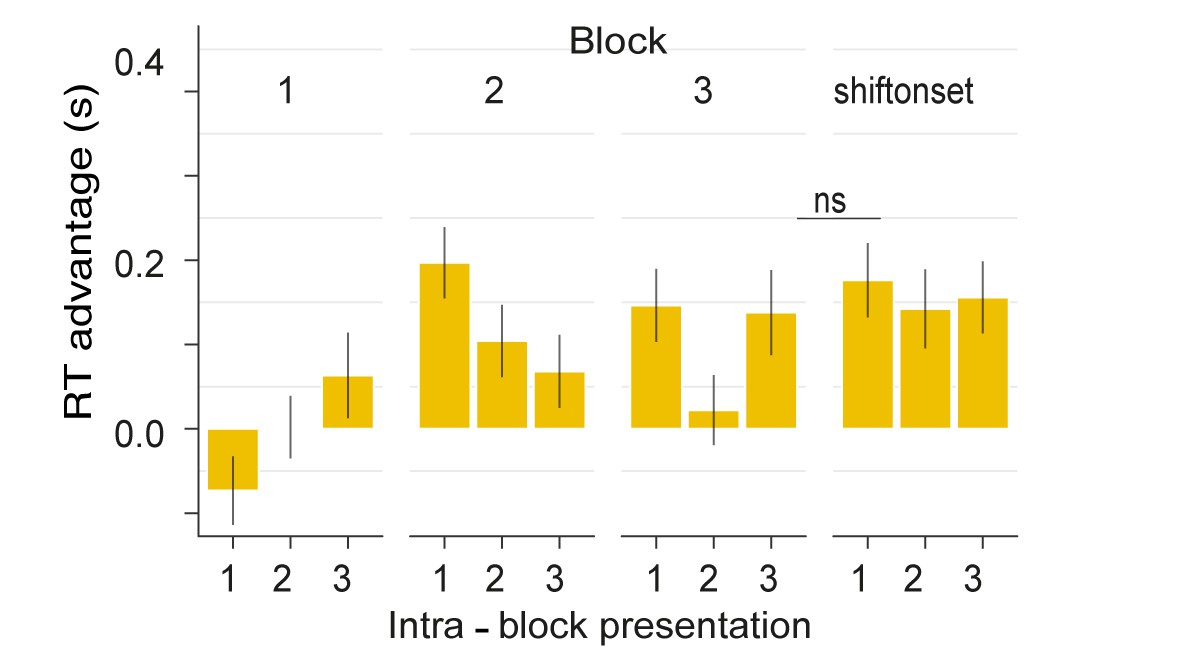
RT advantage for each intra-block presentation.
Plotted values correspond to the RT advantage of the 6 REGr for each intra-block presentation. RTs of 1st, 2nd or 3rd intra-block presentations were averaged across the different 6 REGr, and RTs to novel REG were averaged across trials which occurred at the beginning (first third), middle or end of each block. The RT advantage was preserved after the introduction of a REGr phase shift. Note that this analysis is based on a small number of trials per ‘intra-block’ presentation condition, and effects are therefore noisy. Error bars indicate 1 s.e.m.
Figure 8
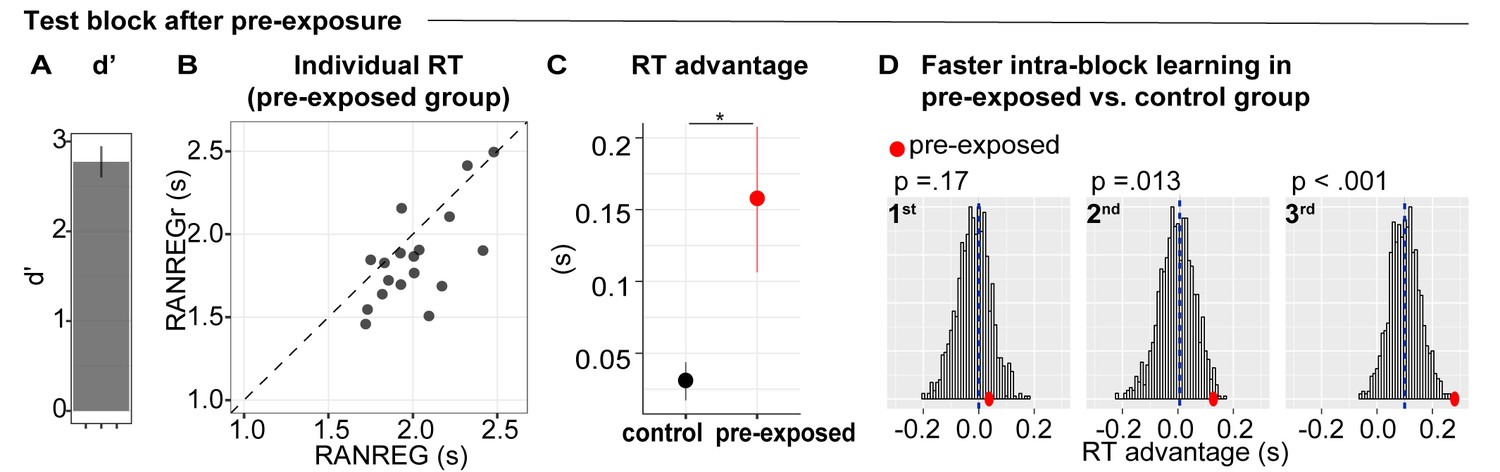
Experiment 5 (N = 18): implicit memory can form when sounds are behaviourally irrelevant, but does not immediately transfer to behaviour.
During three initial blocks, participants were asked to respond only to the STEP trials and ignore the other sounds. In the following test block, they were instructed to also detect the RANREG transitions. (A) Sensitivity to emergence of regularity (d’) in the test block. Error bars indicate 1 s.e.m. (B) The relationship between RTs to the RANREG and RANREGr conditions in the test block. Each data point represents an individual participant. Dots below the diagonal indicate faster detection of RANREGr compared with RANREG. (C) RT advantage in the pre-exposed and the control group (participants without previous exposure; see Materials and methods). Error bars indicate 1 s.e.m. ‘*’ indicates a significant difference. (D) Bootstrap resampling-based distributions of the RT advantage for the 1st, 2nd and 3rd intra-block presentation from the control group. The mean of the distribution is indicated by blue dashed lines. Red dots indicate the data from the present experiment (pre-exposed group). One-tailed p-values are reported with each graph.
Figure 9
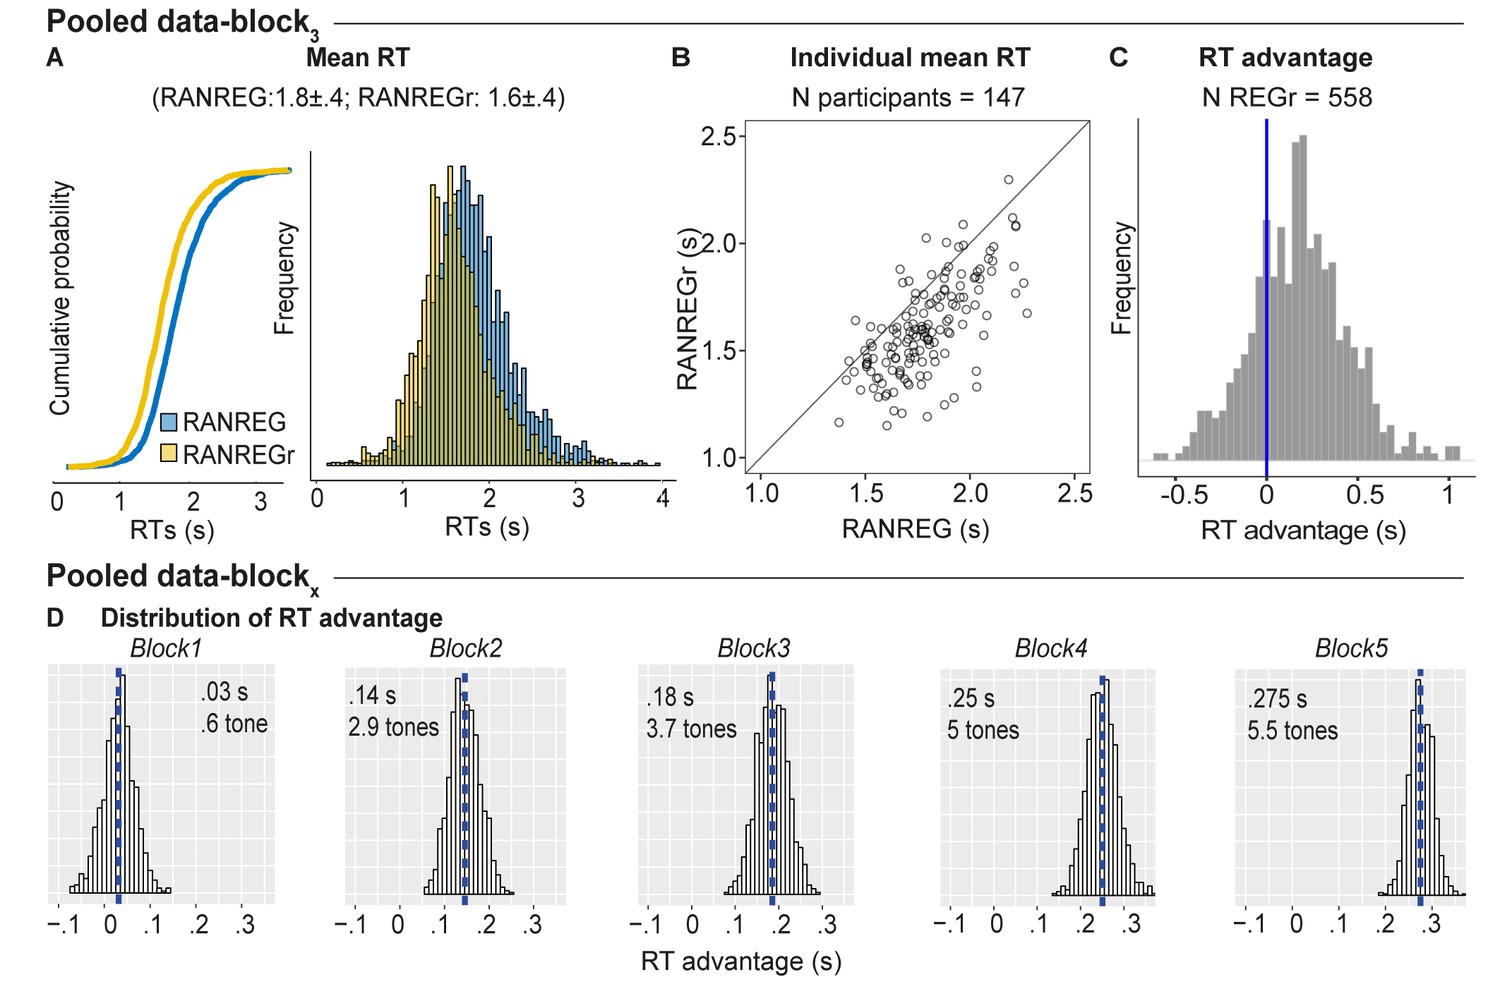
Individual variability in implicit memory.
(A) Cumulative distribution function (left) and distribution (right) of RTs to RANREG and RANREGr pooled from block 3 of several experiments (see Materials and methods). A two sample Kolmogorov-Smirnov test confirmed a significant difference in cumulative probability (D = 0.232, p < 0.001) (B) The relationship between RTs to the RANREG and RANREGr conditions in block 3. Each circle represents an individual participant. (C) Distribution of RT advantages across 558 different REGr patterns as measured after three blocks (9 presentations of REGr). Values > 0 indicate faster RTs to REGr relative to novel REG. (D) Distributions of the RT advantage in each block. To estimate the distribution of the RT advantage across the population (of young, healthy participants) we pooled data from several experiments (see Materials and methods) in which participants performed the standard regularity detection task. Pooled data-block1 reflects the distribution of RT advantage after one block (3 presentations of REGr), Pooled data-block2 reflects the distribution of the RT advantage after two blocks (6 presentations of REGr), etc. The distributions are computed via a bootstrapping process whereby on each iteration (1000 overall), data from 20 participants are chosen randomly (with replacement), to obtain an average RT advantage. The mean of each distribution is indicated by blue dashed lines. Overall these distributions demonstrate a robust emergence of an RT advantage after the first block.
Appendix 1—figure 1

Experiment S1 (N = 19): implicit memory for six concurrent patterns.
(A) Sensitivity to emergence of regularity (d') across blocks. (B) RT to the RAN to REG transition in RANREG and RANREGr conditions across blocks. (C) The relationship between RTs to the RANREG and RANREGr conditions in block 5. Each dot represents an individual participant. All participants exhibited implicit memory of reoccurring patterns by the end of the 5th block. (D) RT advantage for each intra-block presentation. A progressive RT advantage emergeed even when six different REGr were presented. Plotted values correspond to the RT advantage of REGr for each intra-block presentation. RTs of 1st, 2nd or 3rd intra-block presentations were averaged across the different REGr, and RTs to novel REG were averaged across trials which occurred at the beginning (first third), middle or end of each block. Note that this analysis is based on a small number of trials per ‘intra-block’ presentation condition, and effects are therefore somewhat noisy. Error bars indicate 1 s.e.m.
Appendix 1—figure 2
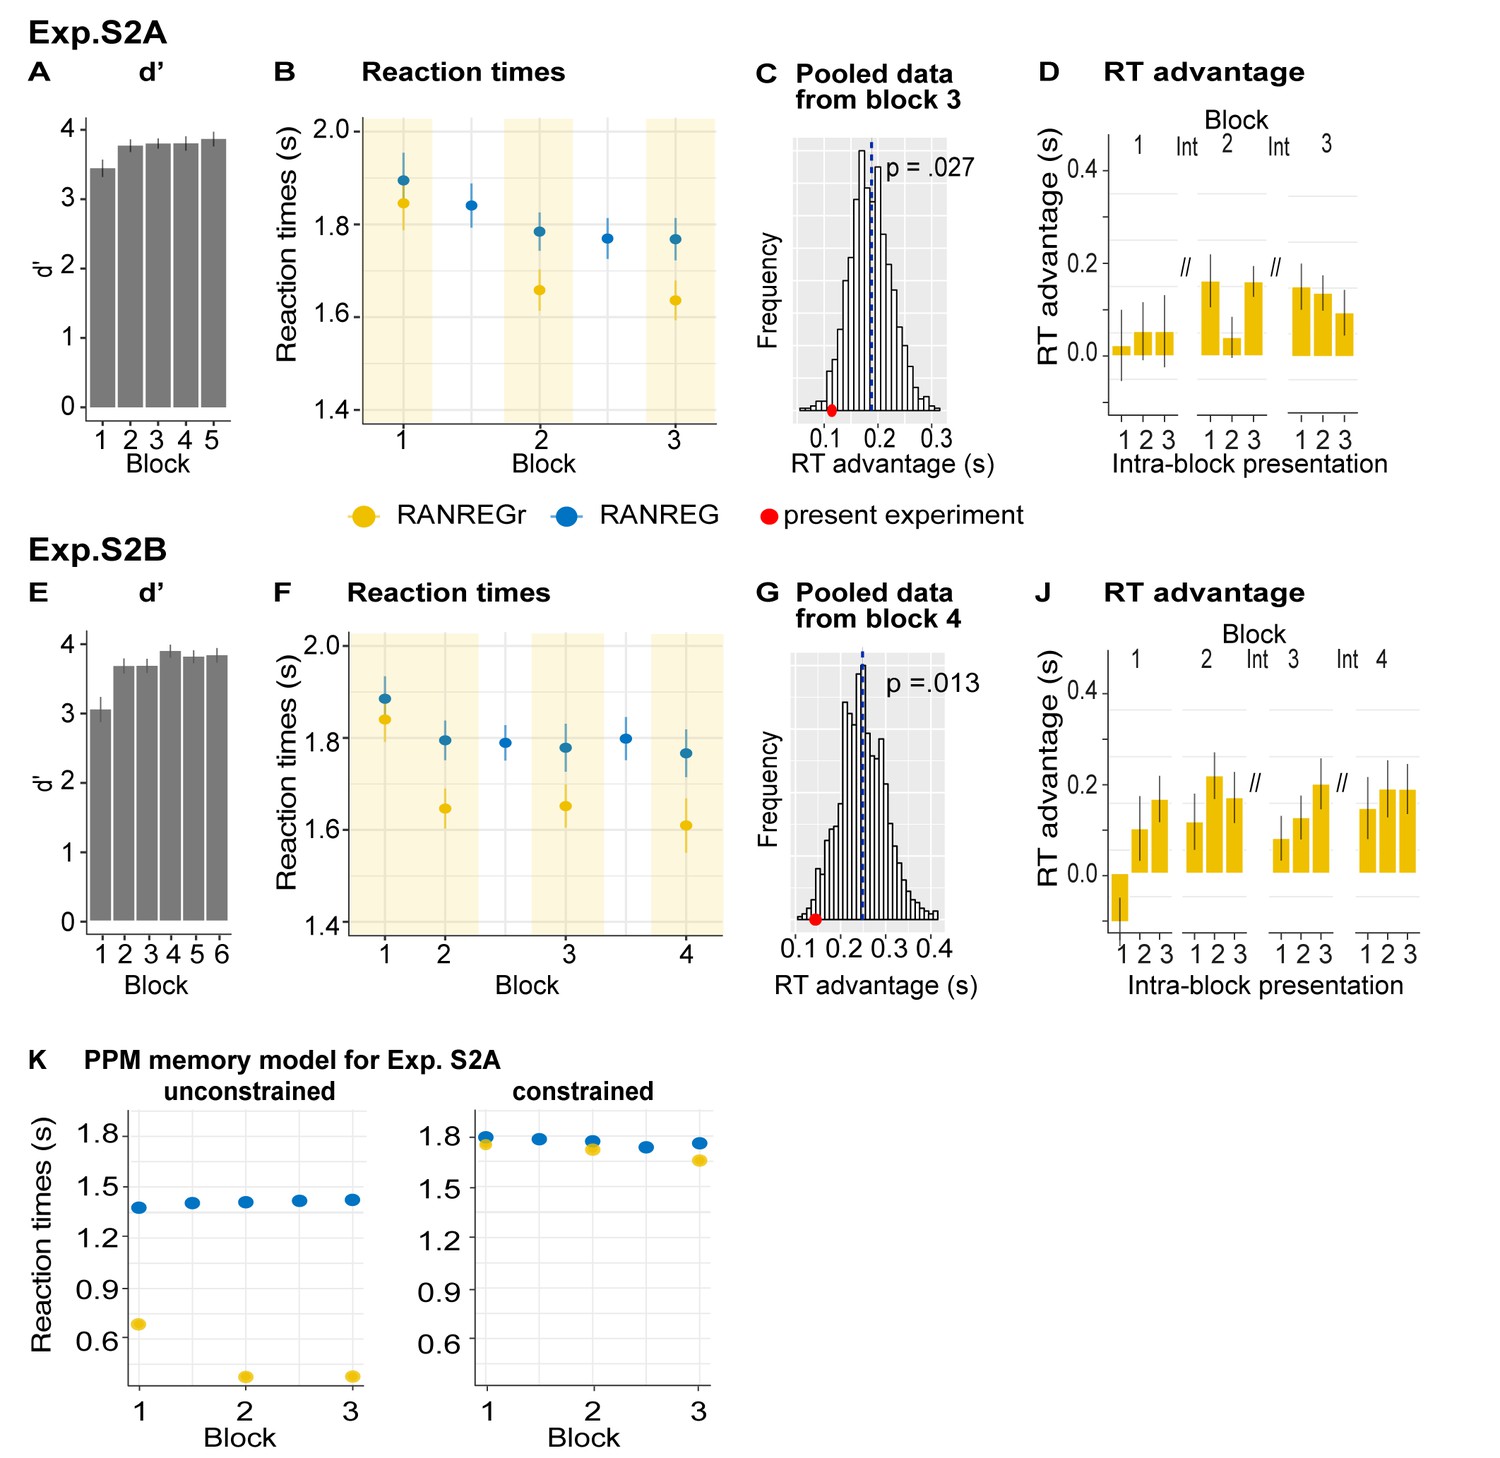
Experiment S2A (N = 18) and S2B (N = 19): the memory trace is weakened, but not abolished, by interrupting blocks.
(A–D) Exp. S2A: (A) Sensitivity to emergence of regularity (d') across blocks in experiment S2A. Error bars indicate 1 s.e.m. (B) RTs to transition in RANREG and RANREGr across blocks. Error bars indicate 1 s.e.m. Yellow shading indicates blocks where REGr were present. (C) Bootstrap resampling-based distributions of RT advantage after three uninterrupted blocks (Pooled data-block3; see Materials and methods). The red dot indicates the RT advantage measured after block three in the present experiment. (D) RT advantage for each intra-block presentation. The RT advantage was preserved over ‘interrupting’ blocks. Plotted values correspond to the RT advantage of REGr for each intra-block presentation. RTs of 1st, 2nd or 3rd intra-block presentations were averaged across the different REGr, and RTs to novel REG were averaged across trials which occurred at the beginning (first third), middle or end of each block. Note that the RT for REGr is computed based on three trials and the effects are therefore rather noisy. Error bars indicate 1 s.e.m. (E–J) Exp. S2B: (F) Sensitivity to emergence of regularity (d') across blocks for experiment S2B Error bars indicate 1 s.e.m. (F) RTs to the transition in RANREG and RANREGr across blocks. Error bars indicate 1 s.e.m. Yellow shading indicates blocks where REGr were present. (G) Bootstrap resampling-based distributions of RT advantage after 4th blocks (Pooled data-block4; see Materials and methods). The red dot indicates the RT advantage measured after block four in the present experiment. (J) The RT advantage was preserved over ‘interrupting’ blocks. (K) Unconstrained vs. Constrained memory model results for Exp. S2A. Error bars indicate 1 s.e.m.
Appendix 1—figure 3
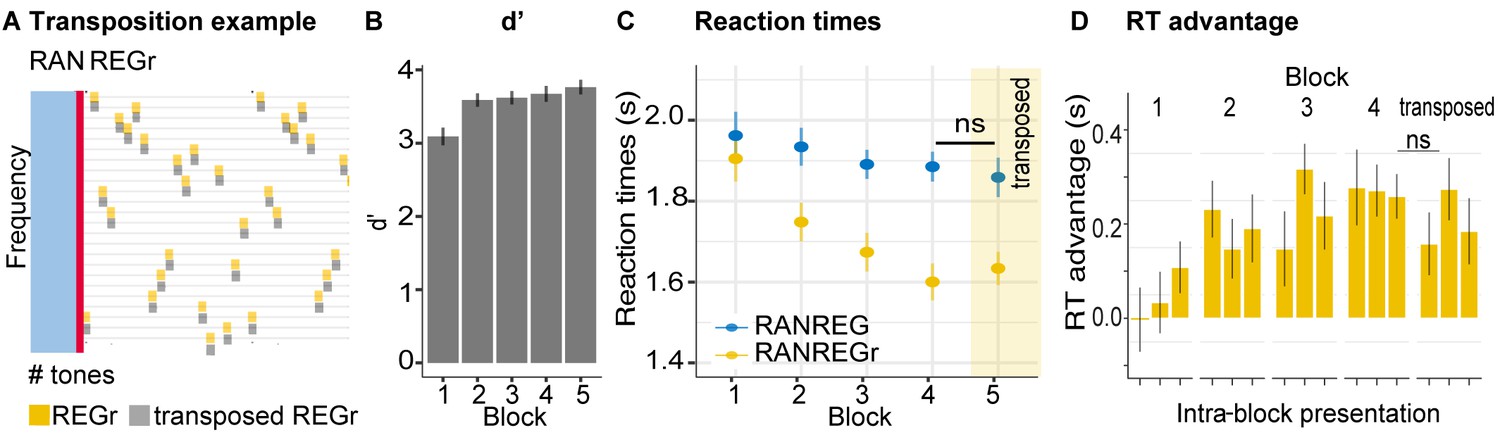
Experiment S3 (N = 20): implicit memory is robust to pattern transposition.
(A) Schematic example of the transposition. Yellow squares indicate tones in a REGr sequence; grey squares indicate the transposed version (in this example, the tones were shifted downwards by one step in the frequency pool; 12%). The red line indicates the transition from RAN (light blue area) to REGr. (B) d’ across all blocks. Error bars indicate 1 s.e.m. (C) RT to the transition in RANREG and RANREGr across blocks. In block 5 (yellow shading) the originally learned REGr were replaced by transposed versions. Error bars indicate 1 s.e.m. (D) RT advantage for each intra-block presentation. The RT advantage was preserved following frequency transposition of the REGr pattern. Plotted values correspond to the RT advantage of REGr for each intra-block presentation. RTs of 1st, 2nd or 3rd intra-block presentations were averaged across the different REGr, and RTs to novel REG were averaged across trials which occurred at the beginning (first third), middle or end of each block. Note that the RT for REGr is computed based on three trials and the effects are therefore rather noisy. Error bars indicate 1 s.e.m.
Tables
Table 1
Parameters for the memory-decay PPM model as manually optimized for Experiments 1A, 2, and S2A.
| Parameter | Value |
|---|---|
| Buffer capacity | 15 items |
| Buffer weight | 1 |
| Short-term memory weight* | 1 |
| Short-term memory duration* | 15 s |
| Long-term memory weight* | 0.02 |
| Long-term memory half life | 500 s |
| Long-term memory asymptote | 0 |
| Noise | 1.3 |
| Order bound | 4 |
-
*The combination of STM weight, STM duration and LTM weight yields a STM half-life of 3.06 s.
Additional files
-
Supplementary file 1
Sound - RAN sequence.
- https://cdn.elifesciences.org/articles/56073/elife-56073-supp1-v2.mp4
-
Supplementary file 2
Sound - RANREG sequence.
- https://cdn.elifesciences.org/articles/56073/elife-56073-supp2-v2.mp4
-
Transparent reporting form
- https://cdn.elifesciences.org/articles/56073/elife-56073-transrepform-v2.pdf
Download links
A two-part list of links to download the article, or parts of the article, in various formats.
Downloads (link to download the article as PDF)
Open citations (links to open the citations from this article in various online reference manager services)
Cite this article (links to download the citations from this article in formats compatible with various reference manager tools)
Long-term implicit memory for sequential auditory patterns in humans
eLife 9:e56073.
https://doi.org/10.7554/eLife.56073


