Srsf10 and the minor spliceosome control tissue-specific and dynamic SR protein expression
- Freie Universität Berlin, Institute of Chemistry and Biochemistry, Laboratory of RNA Biochemistry, Germany
- Institute of Cell Biology and Neurobiology, Charité-Universitätsmedizin Berlin, corporate member of Freie Universität Berlin, Humboldt-Universität zu Berlin, and Berlin Institute of Health, Germany
Figures
Figure 1 with 3 supplements

Srsf10 autoregulates its own splicing through a conserved enhancer in exon 3.
(A) Schematic of the exon/intron structure of Srsf10. Usage of the downstream (dn) major splice site in Srsf10 exon 2 (GT.AG, U2-type) leads to exon 3 inclusion and a non-protein coding isoform, while usage of the upstream minor splice site (AT.AC, U12-type) results in exon 4 inclusion. A minor 5’ splice site in exon 3 is present but not used in the endogenous context (dotted lines). * indicate stop codons. (B) Srsf10 minigene splicing upon siRNA-mediated knockdown of endogenous Srsf10. Top: exon/intron structure of the Srsf10 minigene reporter containing mouse exons 2 to 4 (and complete intervening introns) with indicated primer binding sites (arrows). HeLa cells were transfected with control siRNA (siCtrl) or against human Srsf10 (siSrsf10), incubated for 24 hr followed by minigene transfection. After 48 hr splicing was analyzed with the indicated primers. Bottom: exemplary gel and quantification of the dn-E3 isoform (n = 5, mean ± SD). (C) Knockdown and rescue of SRSF10. Top: Western Blot of SRSF10 after siRNA-mediated knockdown and transfection with overexpression vectors for the different GFP-tagged Srsf10 isoforms. VINCULIN was used as loading control. Middle: Exemplary gel of Srsf10 minigene splicing upon knockdown and rescue. Bottom: Quantification of the dn-E3 isoform (n ≥ 3, mean ± SD). (D) Exon/intron structure of the Srsf10 minigenes used for mutational analysis. Exon and intron sequences were replaced by sequences containing a minor intron from glia maturation factor beta (Gmfb exons 4 to 5 including the minor intron 4, marked in red). Below the sequence of the identified ESE is shown. (E) Quantification of Srsf10 minigene splicing upon knockdown and rescue. HeLa cells were transfected with the mutated minigenes (D) and analyzed as in (B). Splicing of mutants is shown relative to the wt from (B) and for each mutant relative to the Ctrl siRNA (n = 5, mean ± SD). Student’s t test-derived p values *p<0.05, **p<0.01, ***p<0.001.
Figure 1—figure supplement 1

Srsf10 autoregulates its own splicing.
(A, B) Confirmation of the Srsf10 knockdown. In (A) SRSF10 protein levels were investigated by Western Blot using an SRSF10-specific antibody. Note that both SRSF10 variants (fl and −2) are strongly reduced. The remaining signal for SRSF10-fl could indicate some unspecific detection of a different (SR)-protein. HNRNP L served as a loading control. In (B) confirmation of the Srsf10 knockdown on mRNA level is shown. The expression of the different Srsf10 isoforms is shown relative to Gapdh and control siRNA (n ≥ 6, mean ± SD). Note the reduced dn-E3/up-E4 ratio after knockdown of Srsf10. (C) Overexpression of SRSF10 variants as in Figure 1C. Top: Overexpression of the SRSF10 variants was investigated with an antibody detecting the GFP epitope. SRSF10-s was not detectably expressed. VINCULIN served as a loading control. Bottom: Representative image of splicing analysis of co-transfected minigenes. (D) Dose-dependent Srsf10 autoregulation. HeLa cells were cotransfected with the minigene, decreasing amounts of SRSF10-fl or −2 (0.1, 0.05, or 0.025 µg plasmid) and adjusted amounts of GFP. Expression was confirmed using an antibody against GFP (top). Note the higher expression levels of SRSF10-2. VINCULIN served as a loading control. Bottom: Splicing analysis of cotransfected minigenes (n = 2, mean ± SD). Note that barely detectable amounts of SRSF10 already change splicing with a stronger effect of SRSF10-fl, especially prominent given the lower expression level of this variant.
Figure 1—figure supplement 2
Srsf10 autoregulates its own splicing through a conserved enhancer in exon 3.
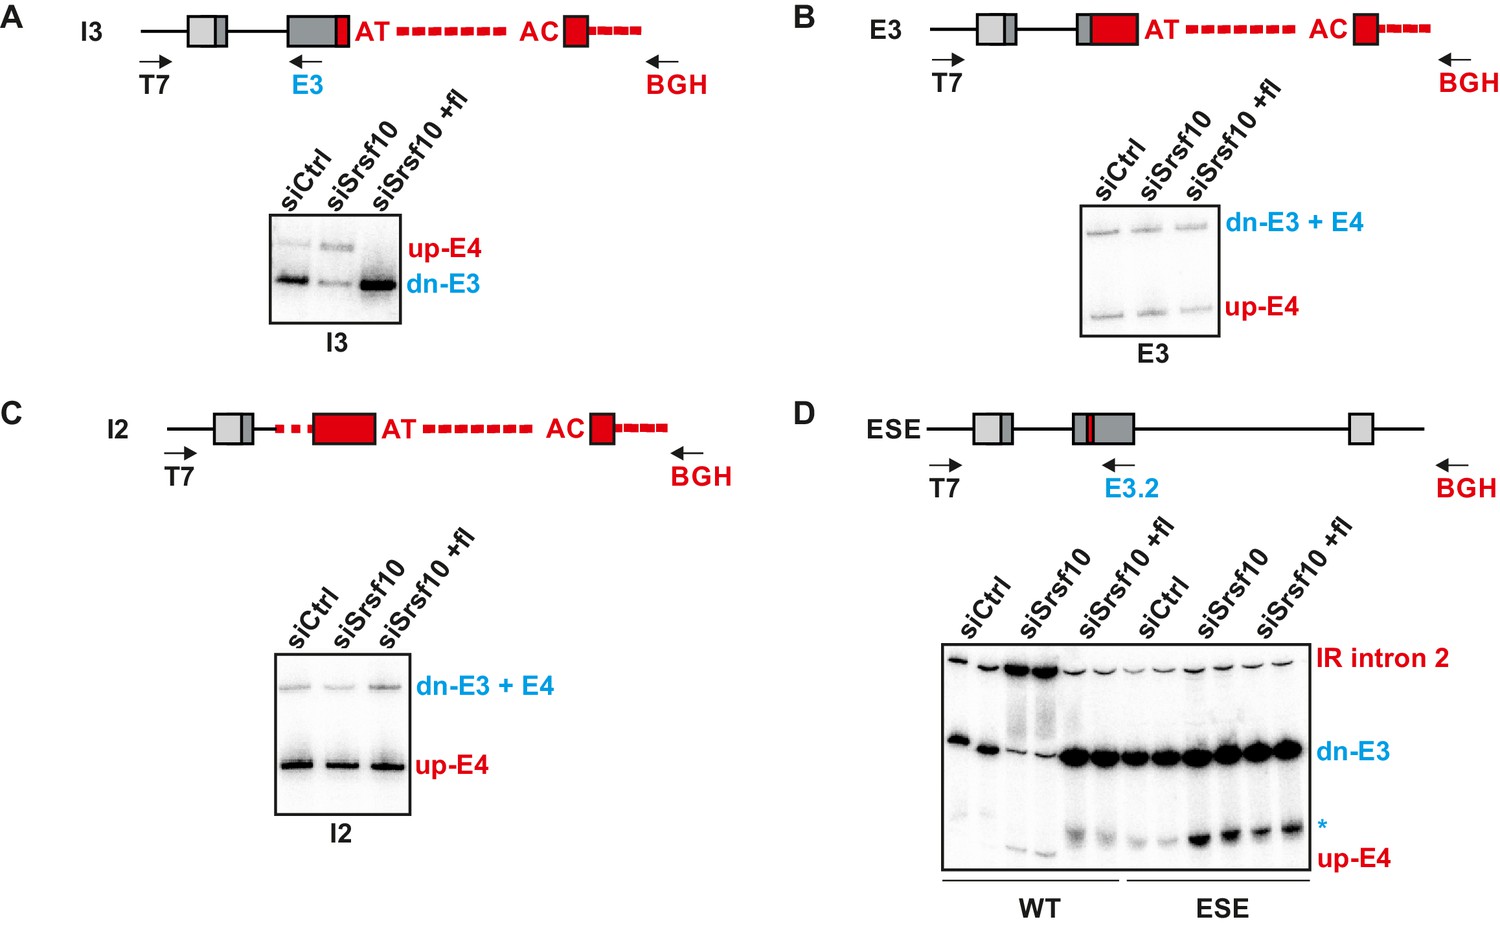
(A–D) Analysis of mutated minigene splicing via radioactive RT-PCR in knockdown (siSrsf10) and knockdown-rescue with SRSF10-fl (siSrsf10 +fl) conditions. In each panel on top the investigated minigene and the primers used are shown. Below, a representative gel with indicated splicing isoforms. The I3 mutant (A) was investigated as the WT in Figure 1C. After mutation of the polyA site in exon 3, mutants E3 and I2 (B and C) could be investigated with only BGH reverse, amplifying both splicing isoforms. The ESE mutant (D) was investigated with a second reverse primer in exon 3 (E3.2), and is shown in comparison to a transfected WT minigene in duplicates. The asterisk marks a degradation product most likely of dn-E3. Note that SRSF10 dependent generation of up-E4 and IR is abolished in the mutant. We observe less IR in the mutant in control condiitons, indicating that the SRSF10-dependent splicing enhancer sequence has an additional role in controlling splicing.
Figure 1—figure supplement 3
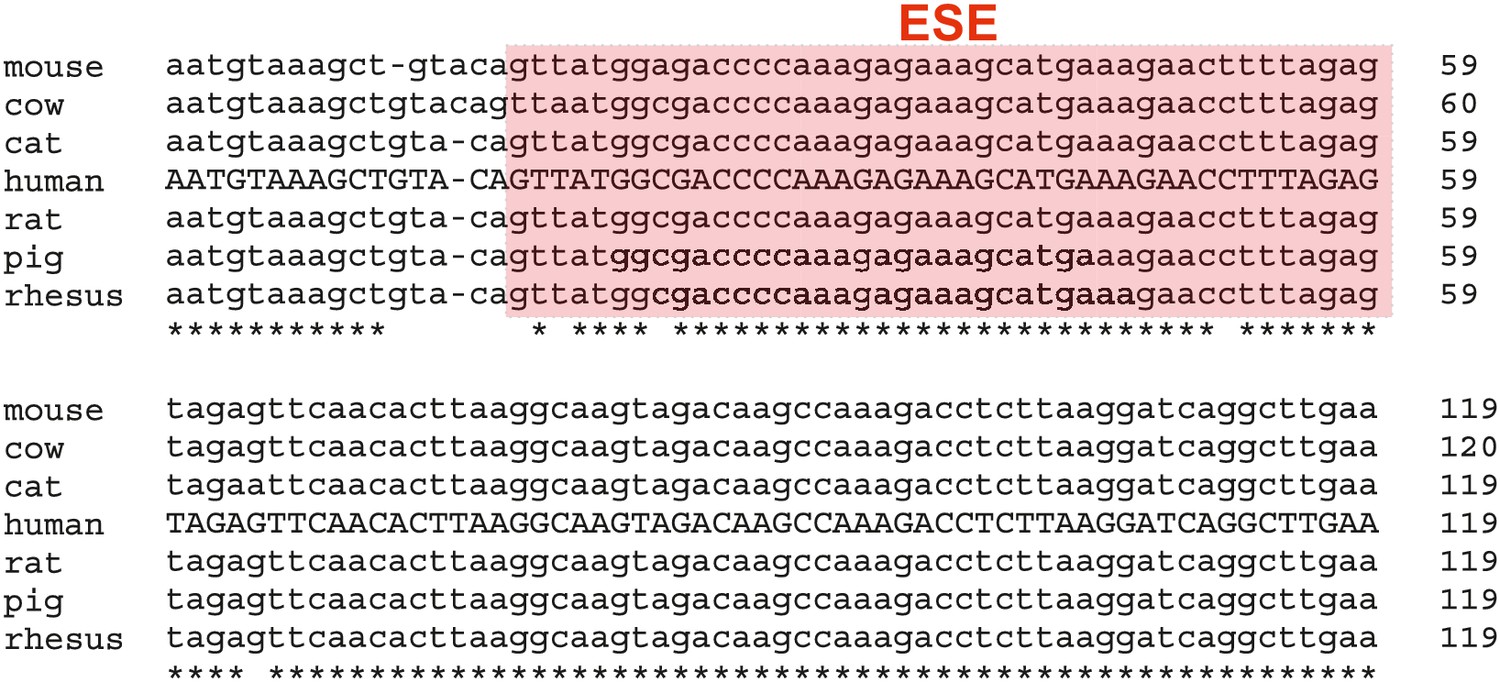
Alignment of the 5’ sequence of Srsf10 exon 3, which includes the identified ESE region (marked in red), showing high conservation across 7 mammals.
Figure 2 with 1 supplement

The minor spliceosome controls Srsf10 expression.
(A) Schematic of the exon/intron structure of the Srsf10 WT and mutated minigenes harboring only major (GT.AG, blue) or minor (AT.AC, red) splice sites. Mutated splice sites are marked in red. (B) Minigenes from (A) were analyzed as in Figure 1. Quantification of splicing-sensitive RT-PCRs is shown relative to the WT from Figure 1B (n = 4, mean +/- SD). A representative gel is shown in Figure 2—figure supplement 1. (C) RT-qPCRs confirm siRNA-mediated knockdown of Rnpc3 (left) and changes in Srsf10 expression levels in HEK293. Expression relative to Gapdh and normalized to siCtrl (n = 3, mean +/- SD). Student’s t test-derived p values *p<0.05, **p<0.01, ***p<0.001.
Figure 2—figure supplement 1
Competition of minor and major splice sites favors the downstream 5’ splice site A representative gel of only minor or major splice site containing minigenes.
Minigene splicing of major and minor minigenes described and quantified in Figure 2A and B. Note that in the absence of competition between minor and major splice sites, we observe mainly splicing from the upstream 5’ splice site and the downstream 5’ splice site is rarely used.
Figure 3 with 1 supplement
Minor spliceosome and Srsf10 expression correlate in a tissue-specific manner.
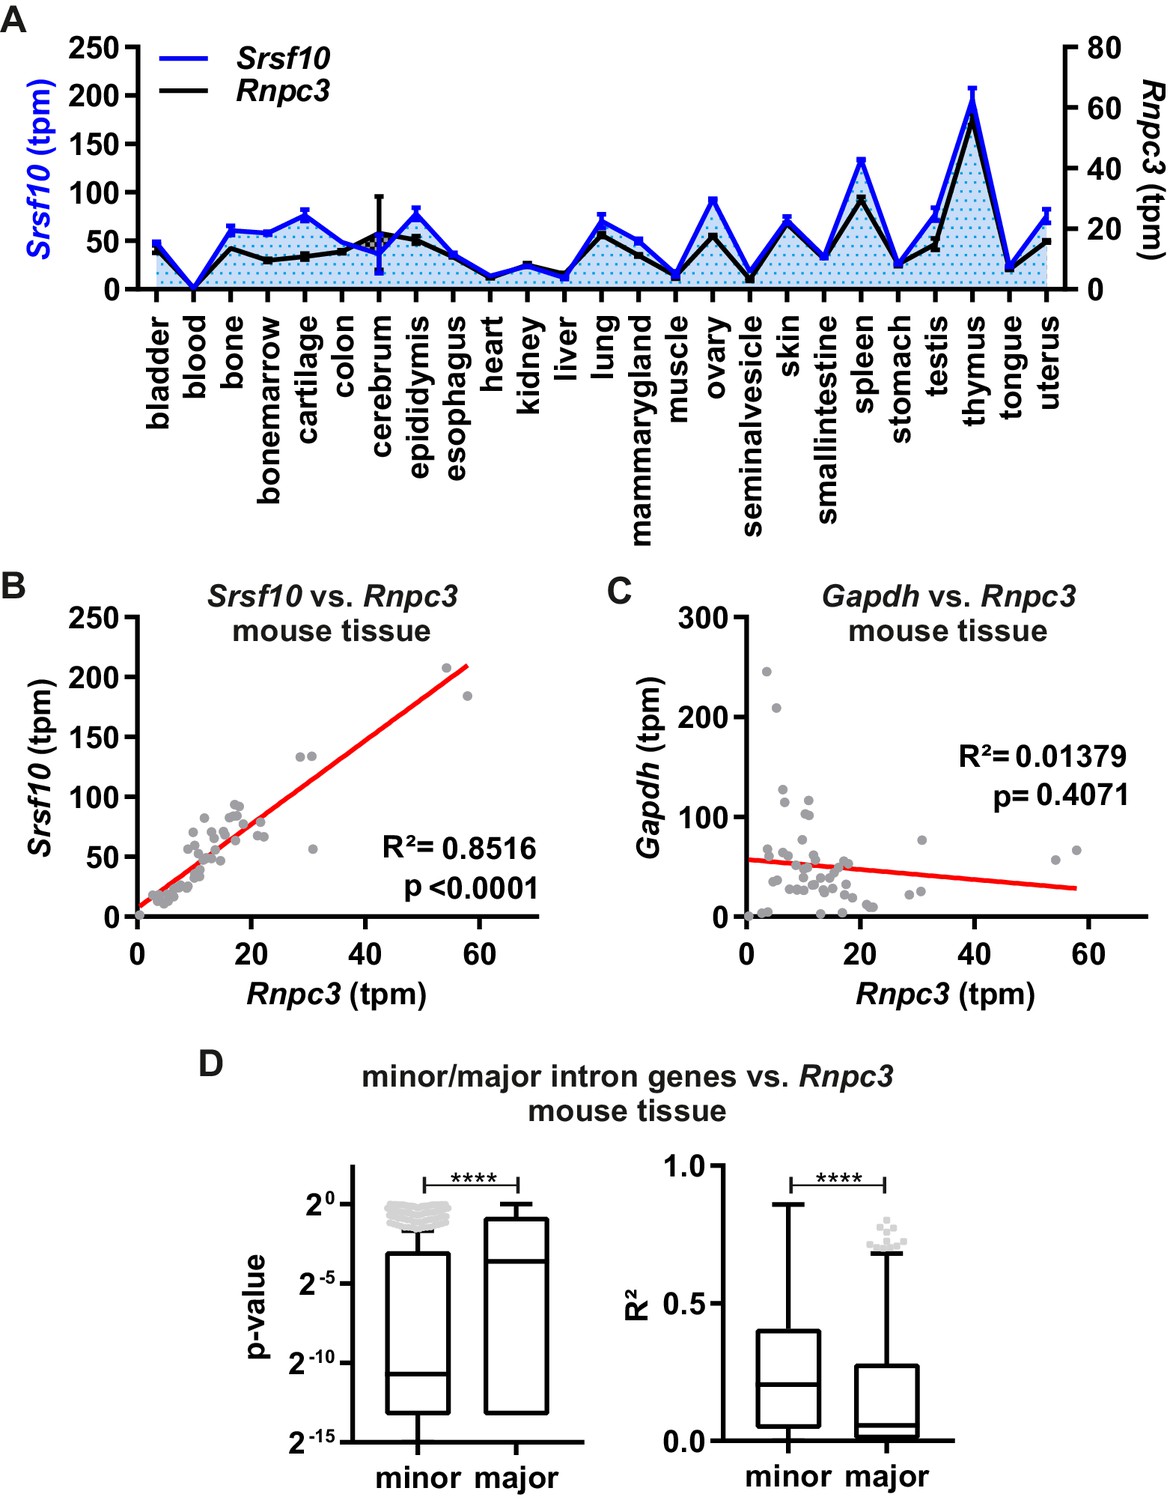
(A) Relative GE levels of Srsf10 and Rnpc3 across 25 mouse tissues (x-axis). Transcripts per million (tpm) values were calculated using Whippet (Sterne-Weiler et al., 2018) (n ≥ 2, mean +/- SEM). (B, C) Linear regression fit for comparison of Srsf10 (B) and Gapdh (C) GE/tpm values with Rnpc3 across the 25 different mouse tissues. Goodness of fit is represented by R2 and p-values. (D) Calculated p-values (left) and R2 values (right) of a global correlation analysis of Rnpc3 with minor intron containing genes (n = 587) or randomly chosen expression matched genes, containing only major introns (n = 629). Statistical significance was determined by an unpaired t-test ****p<0.0001.
Figure 3—figure supplement 1
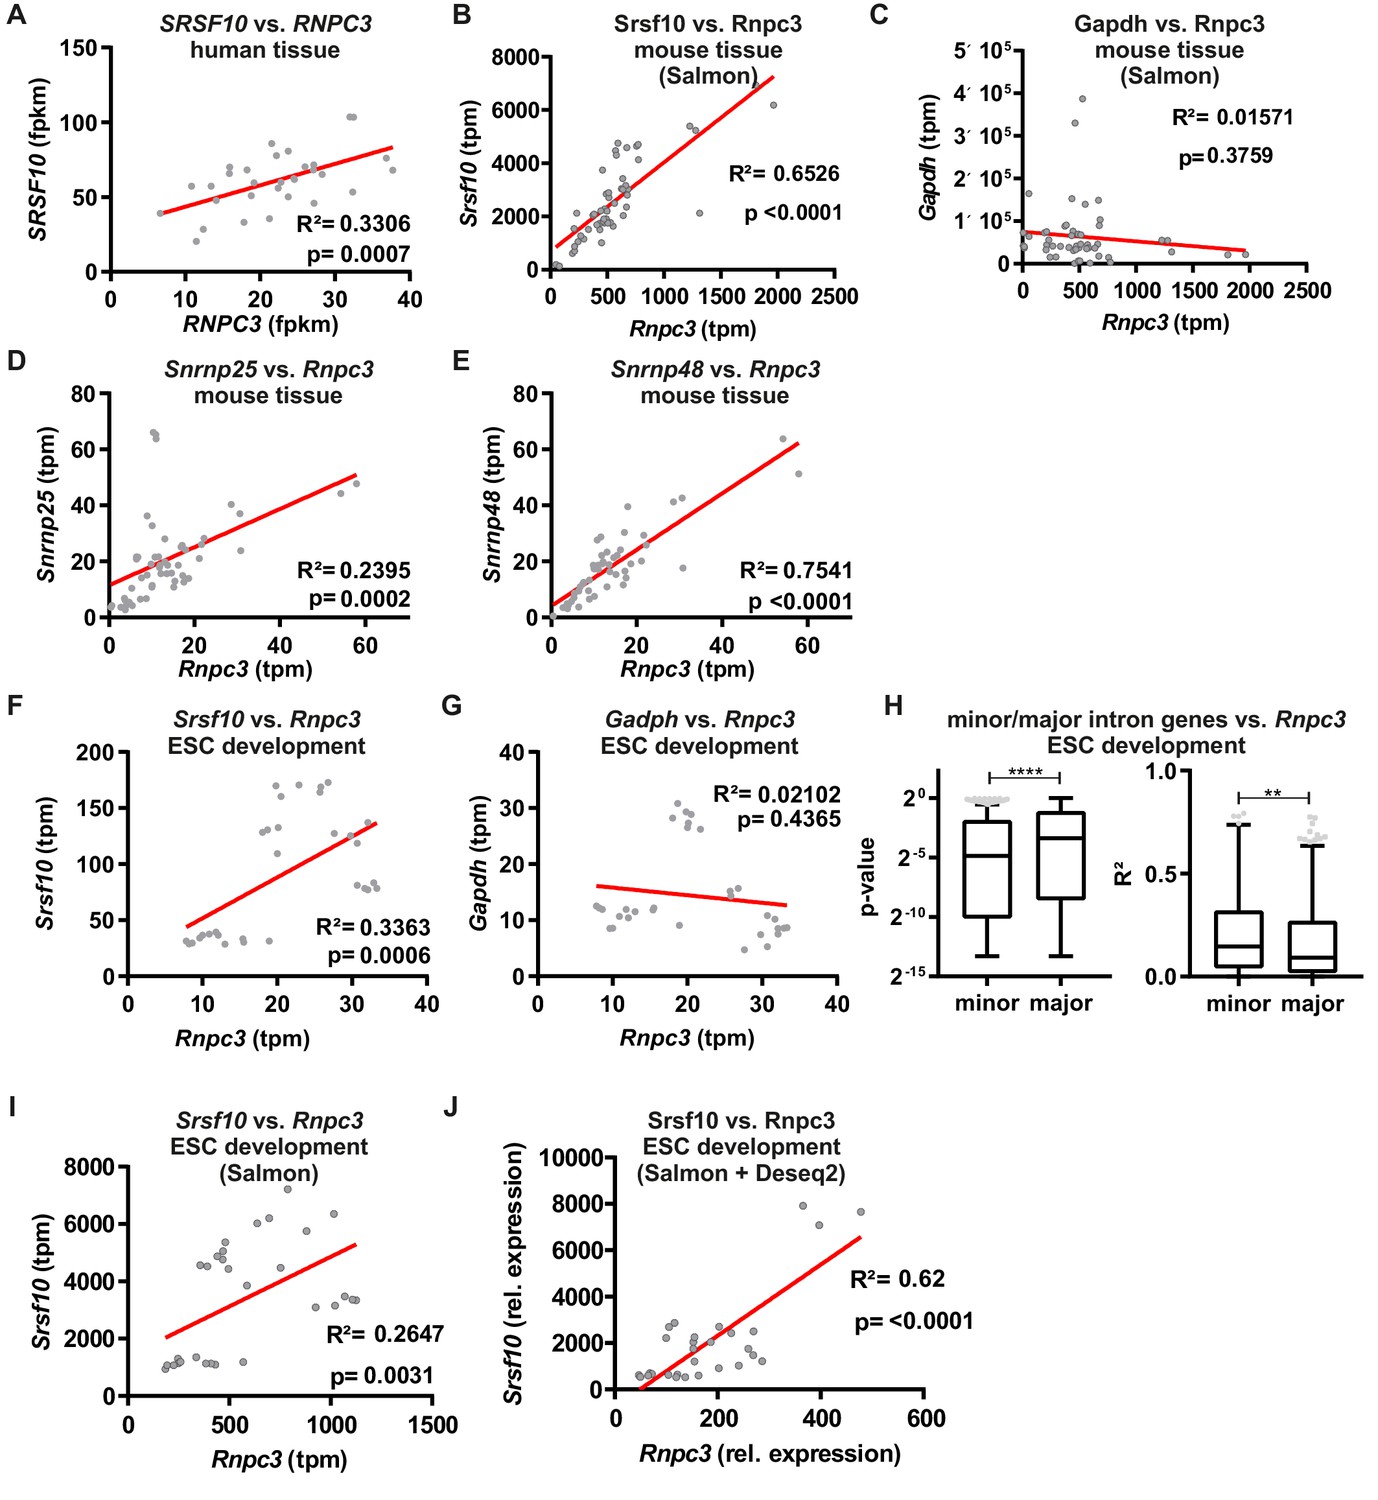
Minor spliceosome and Srsf10 expression correlate in a tissue-specific manner and during development.
(A) Linear regression analysis of Srsf10 and Rnpc3 expression values (fpkm, fragments per kilobase of exon model per million reads mapped) across 31 human tissues (Uhlén et al., 2015). (B, C) Linear regression analysis of Srsf10 or Gapdh and Rnpc3 using Salmon derived tpm values. (D, E) Linear regression analysis of calculated tpm values for minor spliceosome components Snrnp25 (D) and Snrnp48 (E) against Rnpc3 in 25 mouse tissues. (F, G) Correlation analysis of calculated tpm values for Srsf10 (F) and Gapdh (G) against Rnpc3 in differentiating mouse ES cells (Hubbard et al., 2012). (H) Global correlation analysis of Rnpc3 to minor intron containing genes or randomly chosen expression matched genes containing only major introns. Calculated p-values (left) and R2 values (right) are shown. Statistical significance was determined by an unpaired t-test **p<0.01, ****p<0.0001. (I, J) Correlation analysis of calculated tpm values for Srsf10 against Rnpc3 in differentiating mouse ES cells using either Salmon-derived (I), or Salmon-derived and DESeq2-normalized (J) expression levels.
Figure 4 with 2 supplements
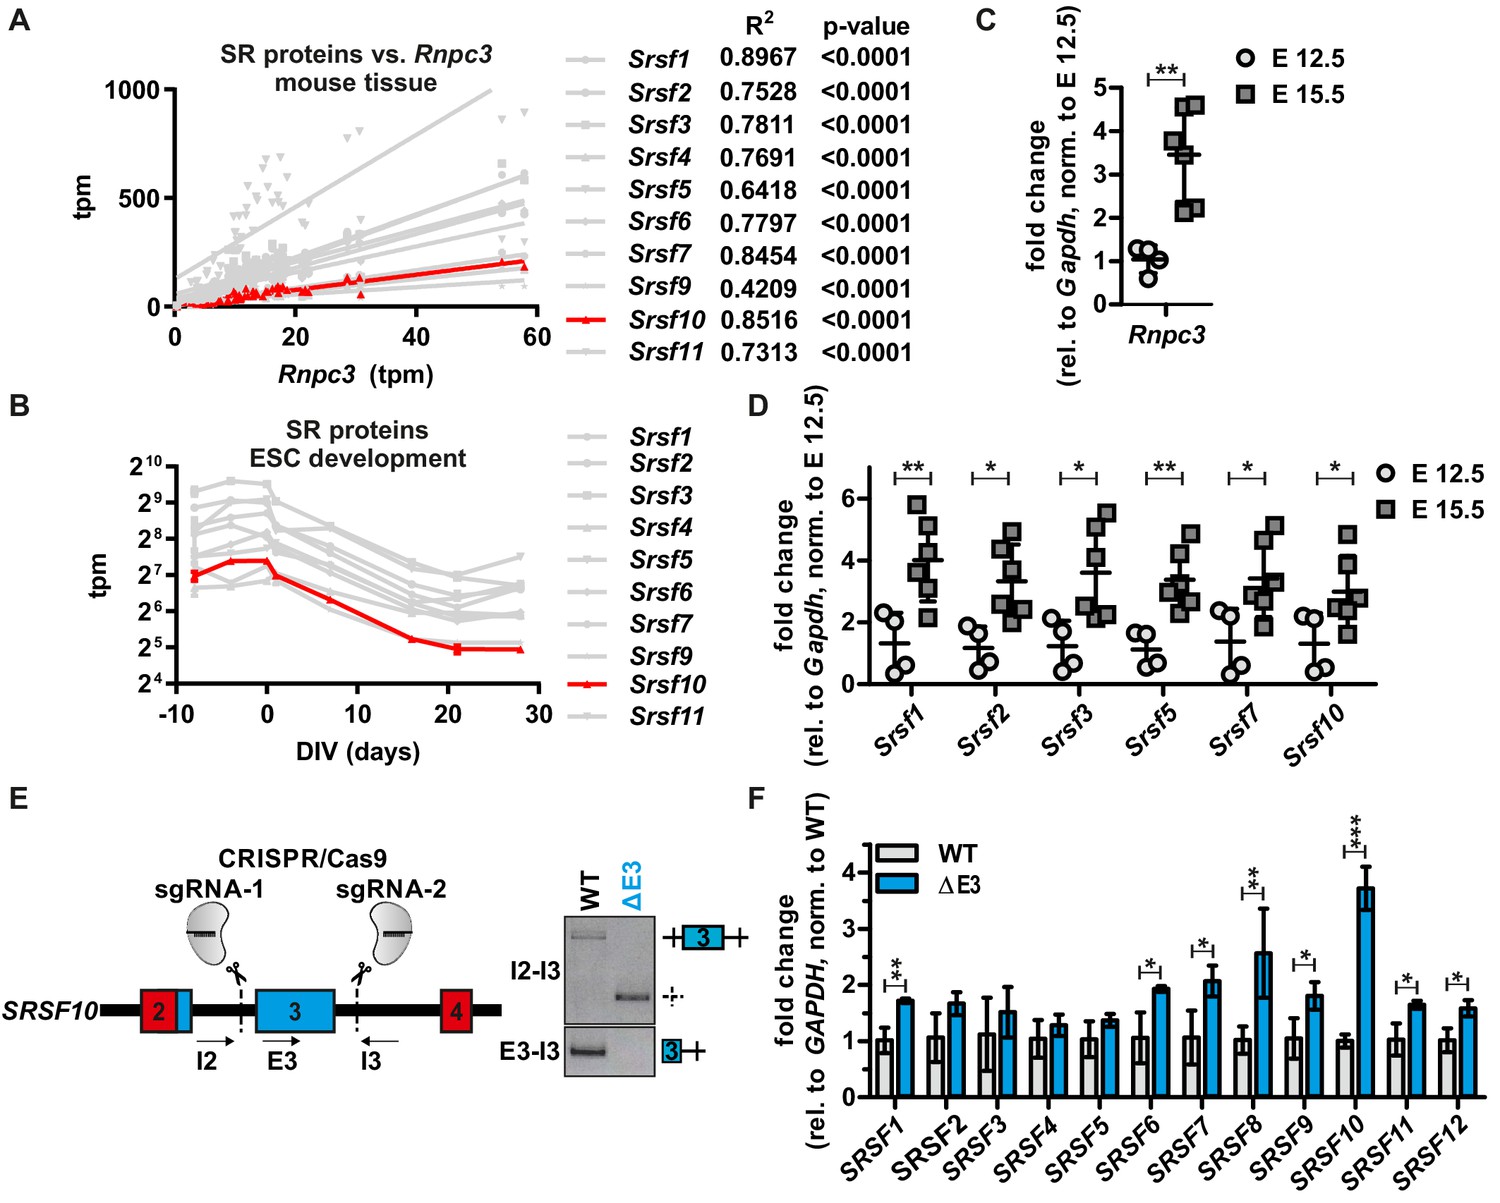
SRSF10 and the minor spliceosome control tissue-specific and dynamic SR protein expression.
(A) Linear regression analysis of calculated tpm values for SR proteins against Rnpc3 in 25 different mouse tissues. R2 and p-values are shown on the right. See also Figure 4—figure supplement 1A with all SR proteins colored. Due to generally low expression levels Srsf12 was omitted. (B) Comparison of tpm values of SR proteins during mouse ES cell differentiation (n ≥ 3, mean ± SD). See also Figure 4—figure supplement 1B and C. (C) Rnpc3 GE levels in mouse cortex samples of the developmental stages E 12.5 and E 15.5 (relative to Gapdh, normalized to time point E 12.5) (n ≥ 4, mean ± SD). (D) SR protein expression in mouse cortex samples of the developmental stages E 12.5 and E 15.5. For Srsf10 only the functional up-E4 isoform was analyzed (relative to Gapdh, normalized to time point E 12.5) (n ≥ 4, mean ± SD). (E) Generation of clonal HEK293 cell lines lacking the regulatory Srsf10 exon 3. Left: Schematic of CRISPR/Cas9-mediated deletion of Srsf10 exon 3. Arrows indicate primer binding sites. Right: genotyping PCR on genomic DNA. (F) Relative SR protein expression in WT HEK293 cells or Srsf10ΔE3 cells. For Srsf10 only the functional up-E4 isoform was analyzed (relative to Gapdh, normalized to WT) (n = 3, mean +/- SD). Statistical significance was determined by an unpaired t-test *p<0.05, **p<0.01, ***p<0.001.
Figure 4—figure supplement 1

SRSF10 and the minor spliceosome control tissue specific and dynamic SR protein expression.
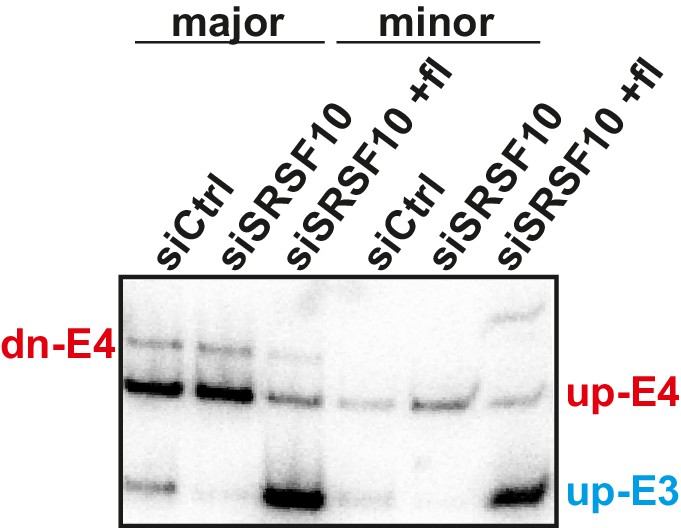
(A) Linear regression analysis of calculated tpm values for the SR proteins against Rnpc3 in 25 different mouse tissues as shown in Figure 4A with all SR proteins colored. (B) Comparison of GE/tpm values of SR proteins during mouse ES cell differentiation as shown in Figure 4B with all SR proteins colored. (C) Linear regression analysis of SR proteins against Rnpc3 in neuronal differentiating mouse ES cells. R2 and p-values are shown on the right. Quantifications are based on Salmon and DESeq2 based expression levels. (D) SRSF10-fl and SRSF10-2 protein levels in CRISPR/Cas9-edited HEK293 cells (ΔE3) were analyzed by Western Blot and quantified relative to HNRNP L (n = 3, mean ± SD). (E) SRSF10 target gene splicing (top: Bclaf1, middle: Ptbp2, bottom: Zfp207) in WT and CRISPR/Cas9-edited cells (ΔE3) and after Srsf10 knockdown. Representative gels for radioactive RT-PCRs and quantifications of SRSF10 target gene splicing in ΔE3 cells and upon siRNA-mediated knockdown, relative to WT or siCtrl, respectively (n = 3, mean ± SD). (F) mRNA expression levels of SR proteins in HEK293 cells upon Rnpc3 knockdown. SR protein expression levels are normalized to siCtrl (n = 3, mean +/- SD). Student’s t test-derived p values *p<0.05, **p<0.01, ***p<0.001.
Figure 4—figure supplement 2
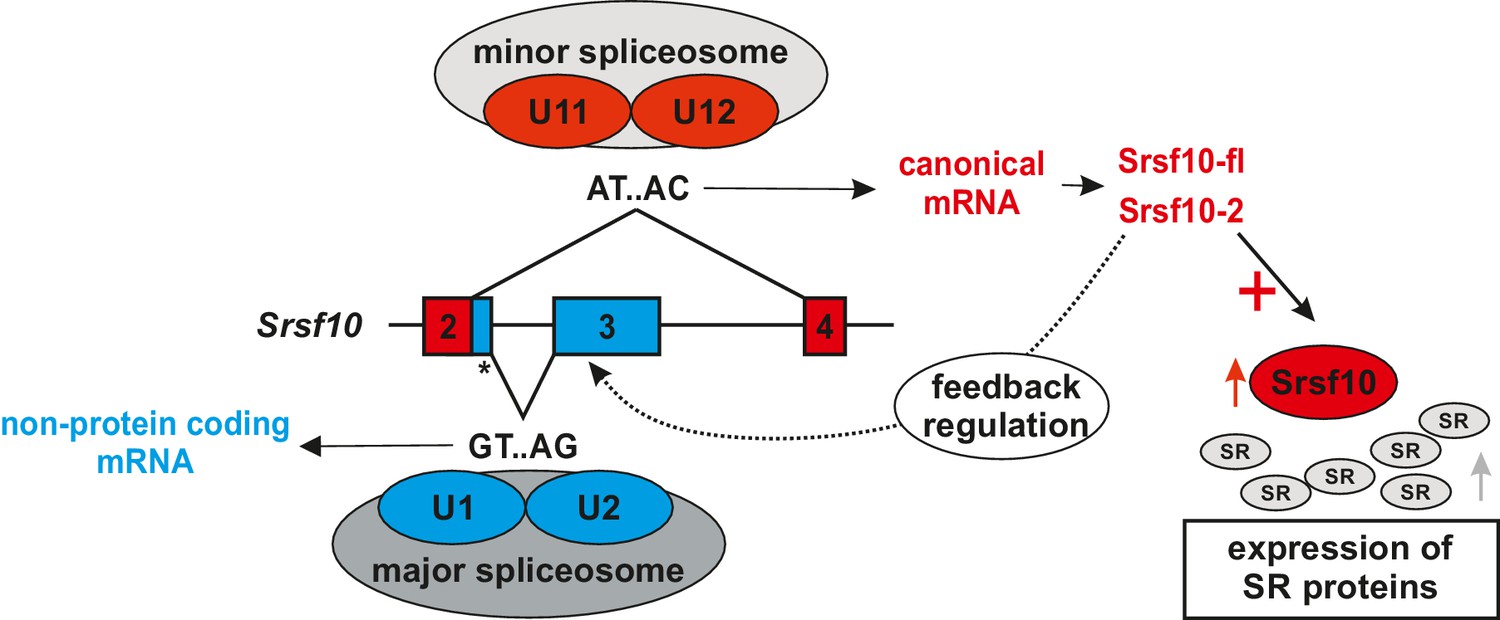
Model for minor spliceosome-mediated control of SR proteins AS of SRSF10 mirrors minor spliceosome activity.
Reduced minor spliceosome activity results in increased formation of an unproductive SRSF10 variant through exon 3 inclusion via the major spliceosome. High minor spliceosome activity results in splicing to exon 4 and formation of protein-coding isoforms. SRSF10 regulates both its own expression level and the expression of other SR proteins.
Tables
Key resources table
| Reagent type (species) or resource | Designation | Source or reference | Identifiers | Additional information |
|---|---|---|---|---|
| Gene (Mus musculus) | Srsf10 | ncbi | GeneID:14105 | Exons 2–4 |
| Gene (Homo sapiens) | Gmfb | ncbi | GeneID:2764 | Exon 4–5 |
| Gene (Homo sapiens) | Srsf10 | ncbi | GeneID:10772 | |
| Cell line (Homo sapiens) | HeLa | ATCC | RRID:CVCL_0030 | |
| Cell line (Homo sapiens) | HEK293 | ATCC | RRID:CVCL_0045 | |
| Cell line (Homo sapiens) | HEK293ΔE3 | This paper | CRISPR/Cas9-mediated deletion of Srsf10 exon 3; see Figure 4 and Materials and methods Part | |
| Biological sample (Mus musculus, NMRI strain) | Cortices | This paper | developmental stages E 12.5 and E 15.5; see Figure 4 and Materials and methods Part | |
| Antibody | anti-FUSIP1 (T-18) (human, monoclonal) | Santa Cruz Biotechnology | RRID:AB_1123037 | 1:1000 |
| Antibody | Anti-GFP (B-2)(monoclonal) | Santa Cruz Biotechnology | RRID:AB_627695 | 1:5000 |
| Antibody | anti-Vinculin (H-300) (rabbit, polyclonal) | Santa Cruz Biotechnology | RRID:AB_2214507 | 1:1000 |
| Antibody | anti-hnRNP L (4D11) (human, monoclonal) | Santa Cruz Biotechnology | RRID:AB_627736 | 1:10000 |
| Recombinant DNA reagent | Mouse Srsf10 minigene | This paper | See Figure 1 + with Figure 1—figure supplements 1 and 2; and Materials and methods part | |
| Recombinant DNA reagent | mouse Srsf10-fl-GFP | This paper | See Figure 1 + with Figure 1—figure supplements 1 and 2; and Materials and methods part | |
| Recombinant DNA reagent | mouse Srsf10-2-GFP | This paper | See Figure 1 + with Figure 1—figure supplements 1 and 2; and Materials and methods part | |
| Recombinant DNA reagent | mouse Srsf10-s-GFP | This paper | See Figure 1 + with Figure 1—figure supplements 1 and 2; and Materials and methods part | |
| Recombinant DNA reagent | PX459 vector | Kindly provided by Stefan Mundlos | RRID:Addgene_62988 | For sgRNA cloning and transfection |
| Recombinant DNA reagent | pEGFP-N3 | Clontech | SRSF10 expression construct | |
| Recombinant DNA reagent | pcDNA3.1(+) | Invitrogen | Catalog no: V79020 | Minigene cloning |
| Sequence-based reagent | siRNA against human Srsf10 (siSrsf10) | This paper | GCGUGAAUUUGGUUAUdTdT | Knockdown of endogenous Srsf10 |
| Sequence-based reagent | siRNA against human Rnpc3 (siRnpc3) | This paper | GAAAGAAGGUCGUAUGAAAdTdT | Knockdown of endogenous Rnpc3 |
| Sequence-based reagent | Control siRNA (siCtrl) | This paper | UUUGUAAUCGUCGAUACCCdTdT | |
| Sequence-based reagent | sgRNA: SRSF10_E3_3fw | Benchling Tool | RRID:SCR_013955 | Sequence: caccgctactttactcggtaagcca; CRISPR/Cas9-mediated deletion of Srsf10 exon 3 |
| Sequence-based reagent | sgRNA: SRSF10_E3_3rv | Benchling Tool | RRID:SCR_013955 | Sequence: aaactggcttaccgagtaaagtagc; CRISPR/ Cas9-mediated deletion of Srsf10 exon 3 |
| Sequence-based reagent | sgRNA: SRSF10_E3_5fw | Benchling Tool | RRID:SCR_013955 | Sequence: caccgtgagtttcagaagcatgaat; CRISPR/Cas9-mediated deletion of Srsf10 exon 3 |
| Sequence-based reagent | sgRNA: SRSF10_E3_5rv | Benchling Tool | RRID:SCR_013955 | sequence: aaacattcatgcttctgaaactcac; CRISPR/Cas9-mediated deletion of Srsf10 exon 3 |
| Commercial assay or kit | PowerUp SYBR Green Mastermix | ThermoFisher Scientific | A25742 | RT-qPCR |
| Chemical compound, drug | Roti-Fect | Carl Roth | Order no:P001.1 | Plasmid vector transfection |
| Software, algorithm | GraphPad Prism 7.05 | GraphPad | RRID:SCR_002798 | Statistical analysis |
| Software, algorithm | ImageQuant TL | GE Life Sciences | RRID:SCR_014246 | quantification |
| Software, algorithm | Whippet v0.11 | Sterne-Weiler et al., 2018 | RRID:SCR_018349 | Tpm calculation |
| Software, algorithm | Salmon v1.2.0 | Patro et al., 2017 | RRID:SCR_017036 | Tpm calculation |
| Software, algorithm | TxImport v1.14.0 | Soneson et al., 2015 | RRID:SCR_016752 | Import of transcript counts to R for normalization wit DESeq |
| Software, algorithm | DESeq2 v1.26.0 | Love et al., 2014 | RRID:SCR_015687 | Transcript counts normalization |
Additional files
-
Supplementary file 1
Oligonucleotide sequences of primers, siRNAs, and guide RNAs.
- https://cdn.elifesciences.org/articles/56075/elife-56075-supp1-v2.xlsx
-
Transparent reporting form
- https://cdn.elifesciences.org/articles/56075/elife-56075-transrepform-v2.pdf
Download links
A two-part list of links to download the article, or parts of the article, in various formats.
Downloads (link to download the article as PDF)
Open citations (links to open the citations from this article in various online reference manager services)
Cite this article (links to download the citations from this article in formats compatible with various reference manager tools)
Srsf10 and the minor spliceosome control tissue-specific and dynamic SR protein expression
eLife 9:e56075.
https://doi.org/10.7554/eLife.56075


