Regulation of photosynthetic electron flow on dark to light transition by ferredoxin:NADP(H) oxidoreductase interactions
- School of Biochemistry and Chemistry, Queen Mary University of London, United Kingdom
- Department of Plant Physiology, Faculty of Biology and Chemistry, University of Osnabrück, Germany
- Institute of Plant Biology and Biotechnology, University of Münster, Germany
- Institute for Integrative Biology of the Cell (I2BC), CEA, CNRS, Univ Paris-Sud, Université Paris-Saclay, France
- Laboratoire de Physiologie Cellulaire et Végétale, UMR 5168, Centre National de la Recherche Scientifique (CNRS), Commissariat a` l’Energie Atomique et aux Energies Alternatives (CEA), Université Grenoble Alpes, Institut National Recherche Agronomique (INRA), Institut de Recherche en Sciences et Technologies pour le Vivant (iRTSV), CEA Grenoble, France
Figures
Figure 1 with 2 supplements
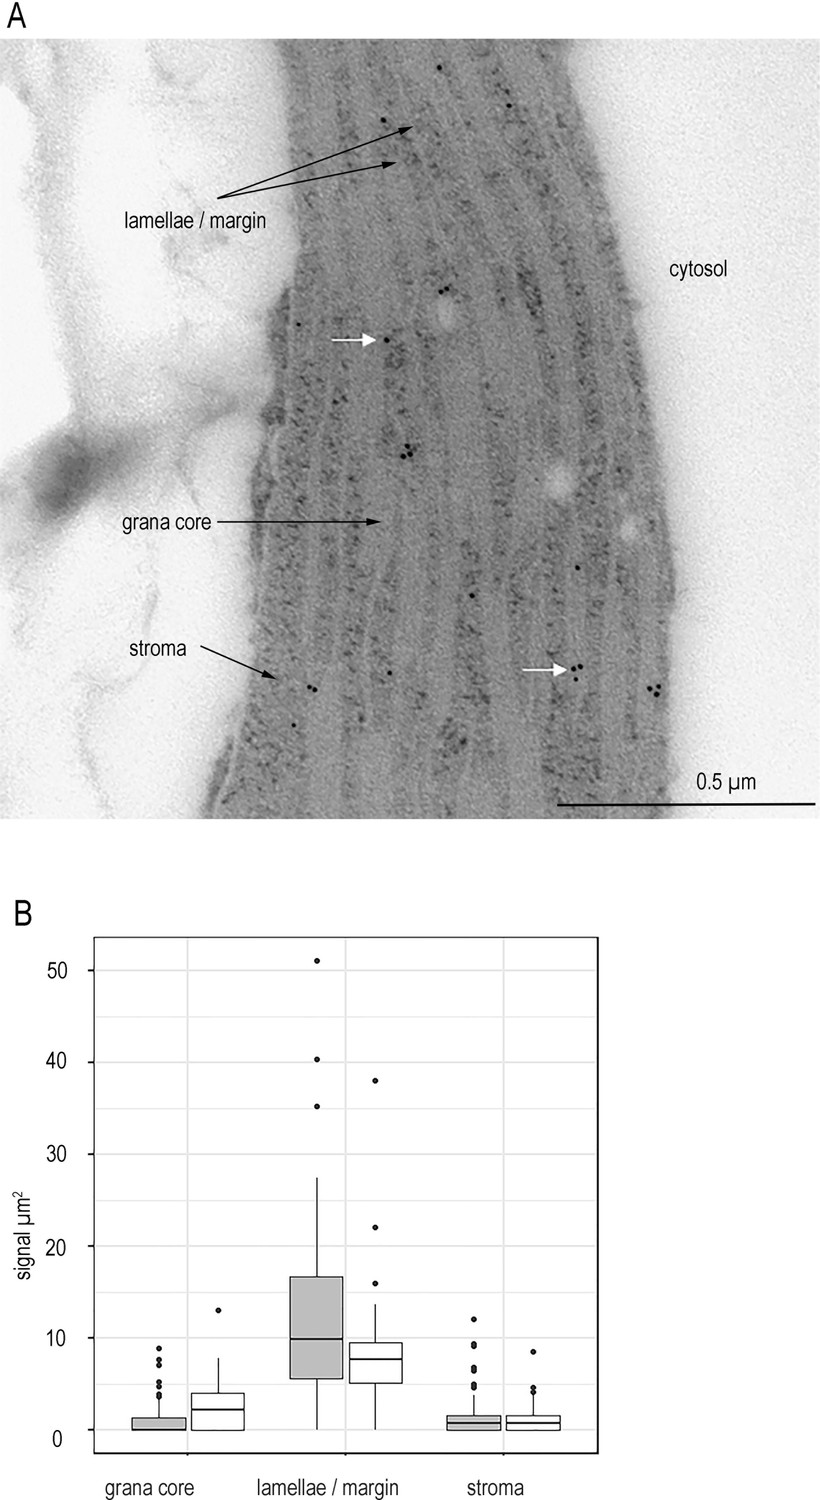
FNR is not detected in the chloroplast stroma of higher plants.
(A) Representative micrograph showing immunogold labelling of FNR in sections of chloroplasts from Wt Arabidopsis detected by IGL-TEM. White arrows indicate example gold particles. (B) Immunogold labelling density of FNR in different sub-chloroplast compartments, n = 15–22 chloroplasts each from three Wt individuals (grey) and 3 fnr1 (white) individuals. Outliers shown. See Figure 1—figure supplement 1 for quality control of antibodies and Figure 1—figure supplement 2 for optimisation of IG-TEM technique. See Table 1 for statistical significance in a mixed effects model analysis of variance between genotypes and between sub-compartments within each genotype.
Figure 1—figure supplement 1
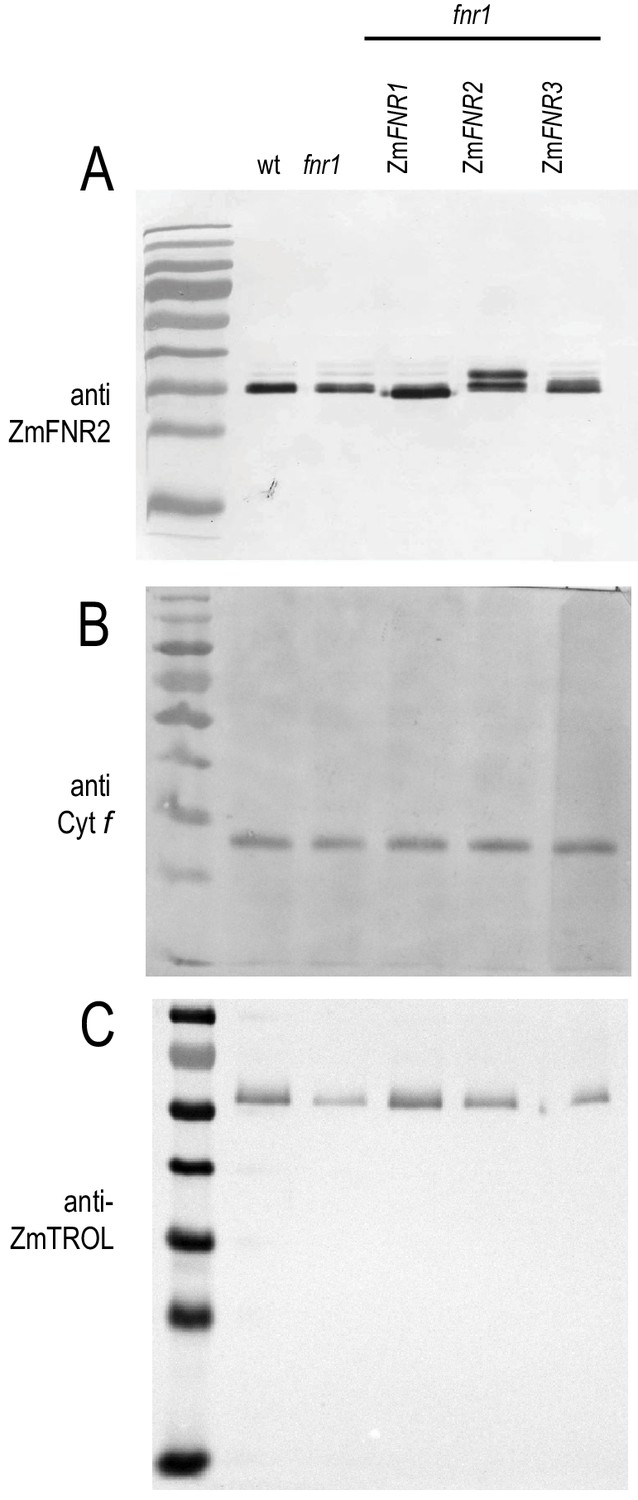
Specificity of antisera used for Immunogold labelling and blue native PAGE western blots.
Mature Arabidopsis leaf protein extract was subjected to SDS-PAGE before immunoblotting and detection of (A) FNR, (B) cytochrome f (Cyt f), and (C) TROL. The gel was loaded with 20 µg protein for each sample, blotted, challenged with the indicated antisera, and visualised using alkaline phosphatase conjugated secondary antibody.
Figure 1—figure supplement 2
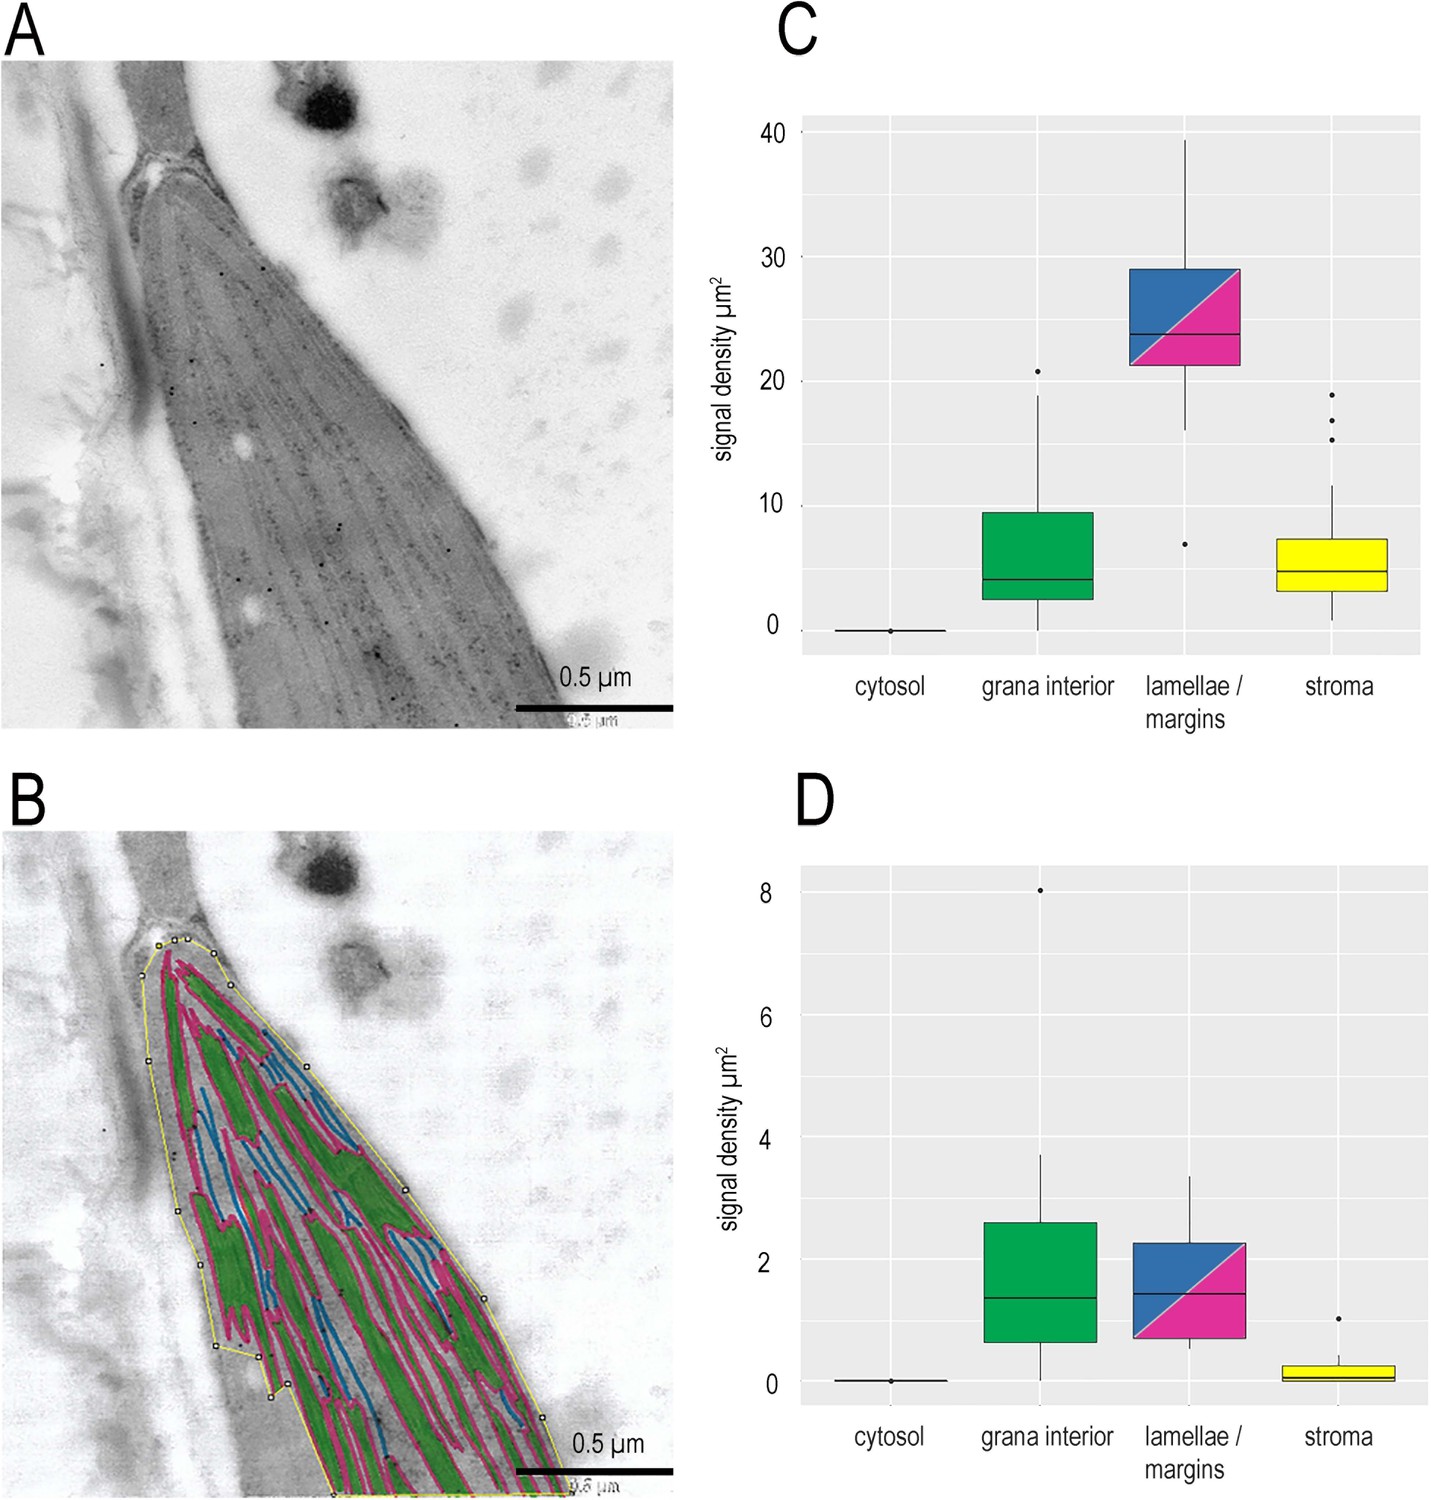
Detecting protein localisation in sub-chloroplast compartments.
(A) Representative micrograph of a wt chloroplast, with acceptable uranyl acetate staining for detection of sub-chloroplast localisation of proteins. Chloroplast was immunolabelled to detect FNR. (B) The same micrograph with sub-chloroplast regions defined. Within the yellow border, identifiable stromal region, Green, grana core; Blue, stromal lamellae not connected to appressed membrane, defined as a ~ 10 nm area with the membrane in the centre; Cyan, margin, defined as ~10 nm region around membranes exposed to the stroma, but adjacent to an appressed membrane. (C) Signal density of FNR immunogold label in chloroplasts of a single wt individual with margins and lamellae combined (n = 22). Colours code as for panel (B). Outliers shown. Supplementary file 2a for statistical analysis in a mixed effects model of variance between sub-compartments. (D) As for (C), except IGL for cytochrome f. Signal density of cytochrome f immunogold label in chloroplast areas defined as for FNR analysis. Supplementary file 2b for statistical analysis in a mixed effects model of variance between sub-compartments.
Figure 2
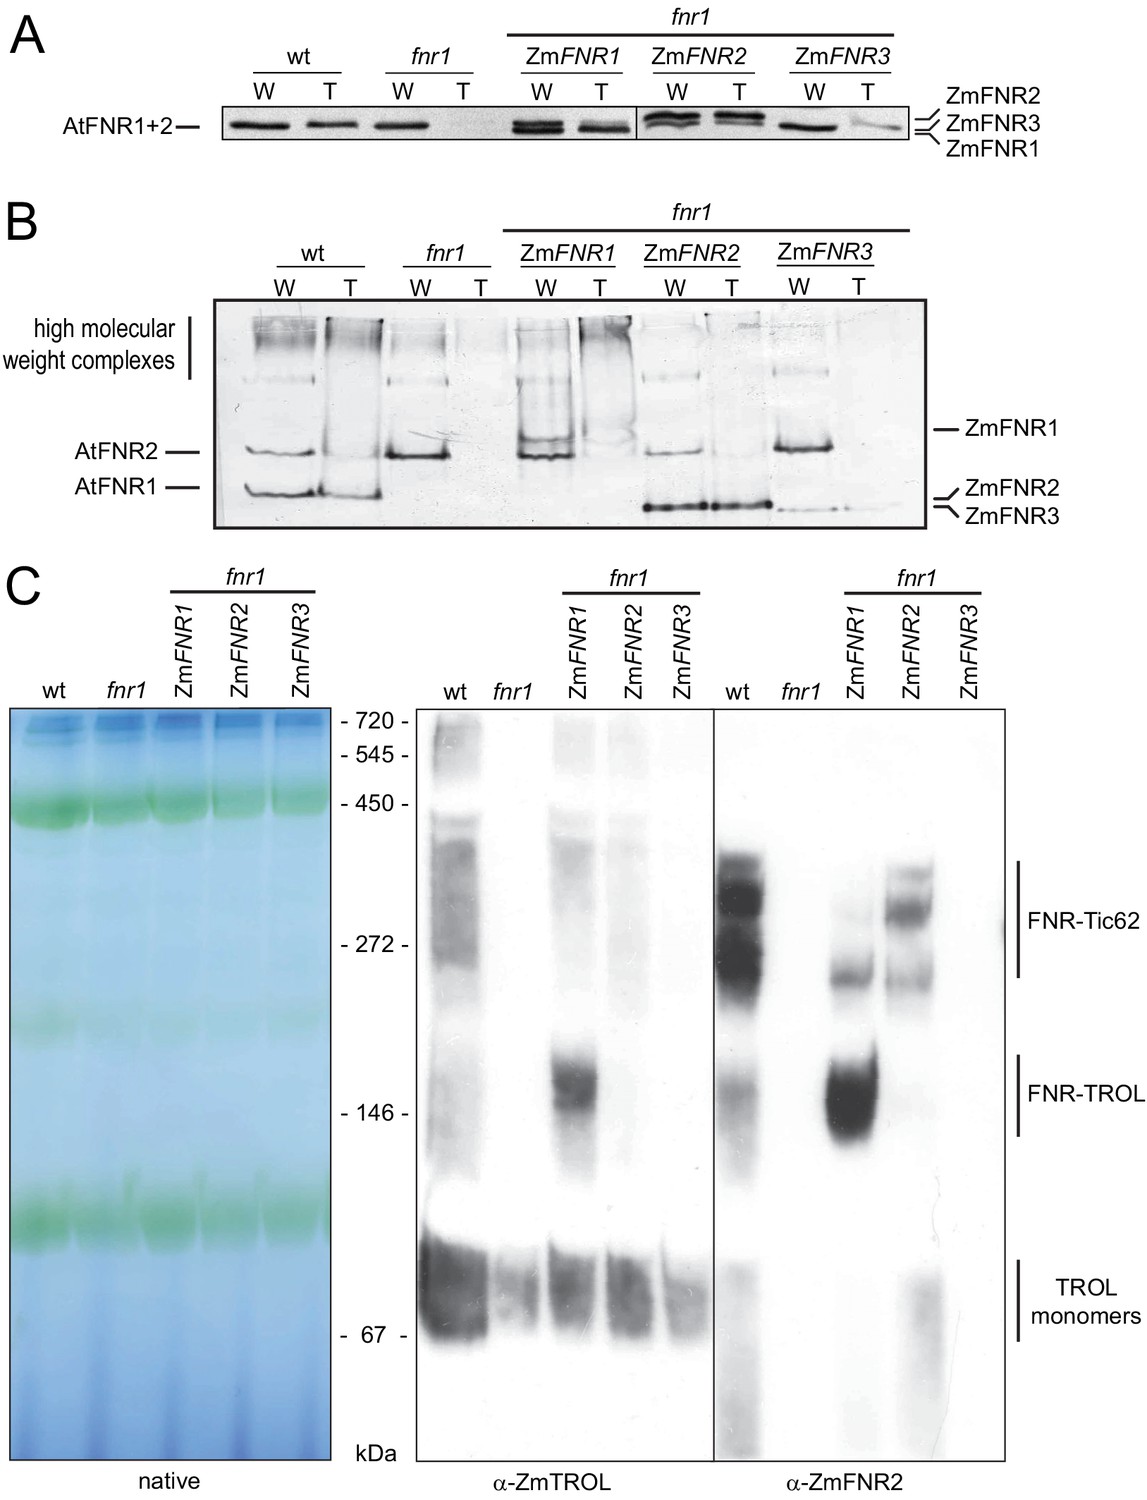
Arabidopsis plants with variable FNR:membrane tether interactions.
Leaf extracts of Arabidopsis wt, fnr1, and fnr1 mutants transformed to express genes for the maize FNR proteins ZmFNR1, ZmFNR2, and ZmFNR3 in the fnr1 background were separated into soluble and insoluble fractions. These were designated loose (L) and tight (T) membrane bound FNR fractions, based on the analysis in Figure 1. Samples were subjected to (A) SDS-PAGE (25 µg protein prior to separation of L and T fractions) or (B) native PAGE (20 µg protein prior to separation of L and T fractions) before immunoblotting, challenge with antisera against FNR, then detection with alkaline phosphatase. Migration positions of Arabidopsis (At) FNRs and maize (Zm) FNRs are indicated to the left and right, respectively. (C) Recruitment of maize FNR proteins into specific Arabidopsis thylakoid membrane complexes. Chloroplasts were isolated from the same genotypes used in (A) and (B). Thylakoid membranes were solubilised with DDM and subjected to blue native-PAGE (BNP). Samples were loaded on an equal chlorophyll basis, with 3.2 μg per lane, western blotted and challenged with antisera raised against FNR (rabbit) and TROL (guinea pig) before visualisation using secondary antisera conjugated to horseradish peroxidase (chemiluminescence) and alkaline phosphatase respectively. Positions of molecular mass markers are indicated between the gels and the blots in kDa.
Figure 3 with 1 supplement
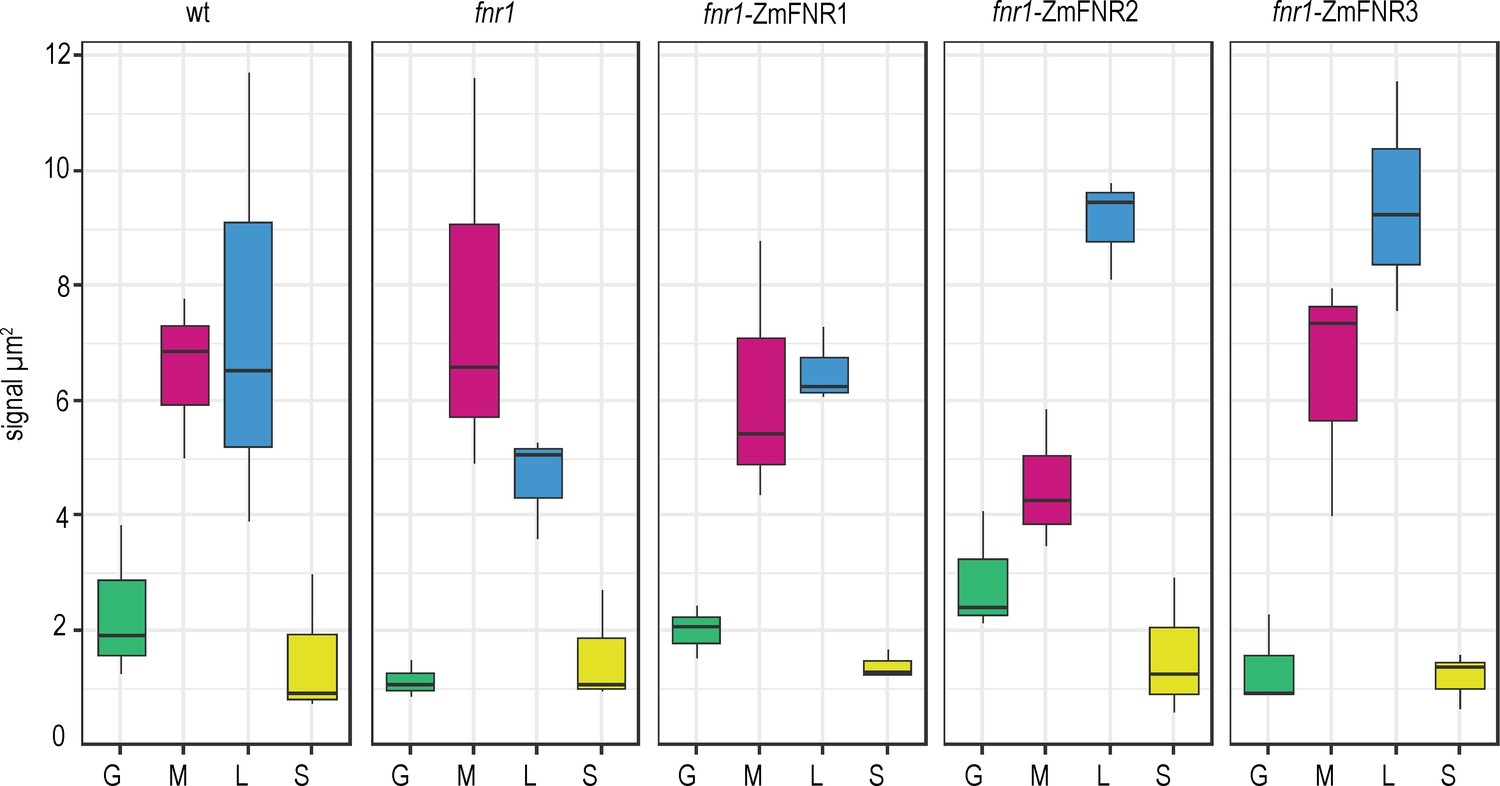
Tether interactions determine FNR sub-chloroplast location.
Density of immunogold labelled FNR in different sub-chloroplast compartments of the indicated genotypes. Values are averages of three biological replicates, with combined label and area for the sub-compartments of 15–20 chloroplasts for each individual. Areas shown are: grana core (green), margins (magenta), stromal lamellae (blue), and stroma (yellow). See Figure 3—figure supplement 1 for confirmation that sub-chloroplast areas do not vary between genotypes. Statistical significance between sub-compartment signal density within genotypes was calculated with a mixed effects model analysis of variance (Table 2).
Figure 3—figure supplement 1

Comparison of areas of different chloroplast sub-compartments between genotypes.
Areas of chloroplast sub-compartments were defined as displayed in Figure 1—figure supplement 2, before calculating the percentage area within the chloroplast of each indicated sub-compartment for 15–22 chloroplasts from three individuals each of the indicated genotypes.
Figure 4 with 1 supplement
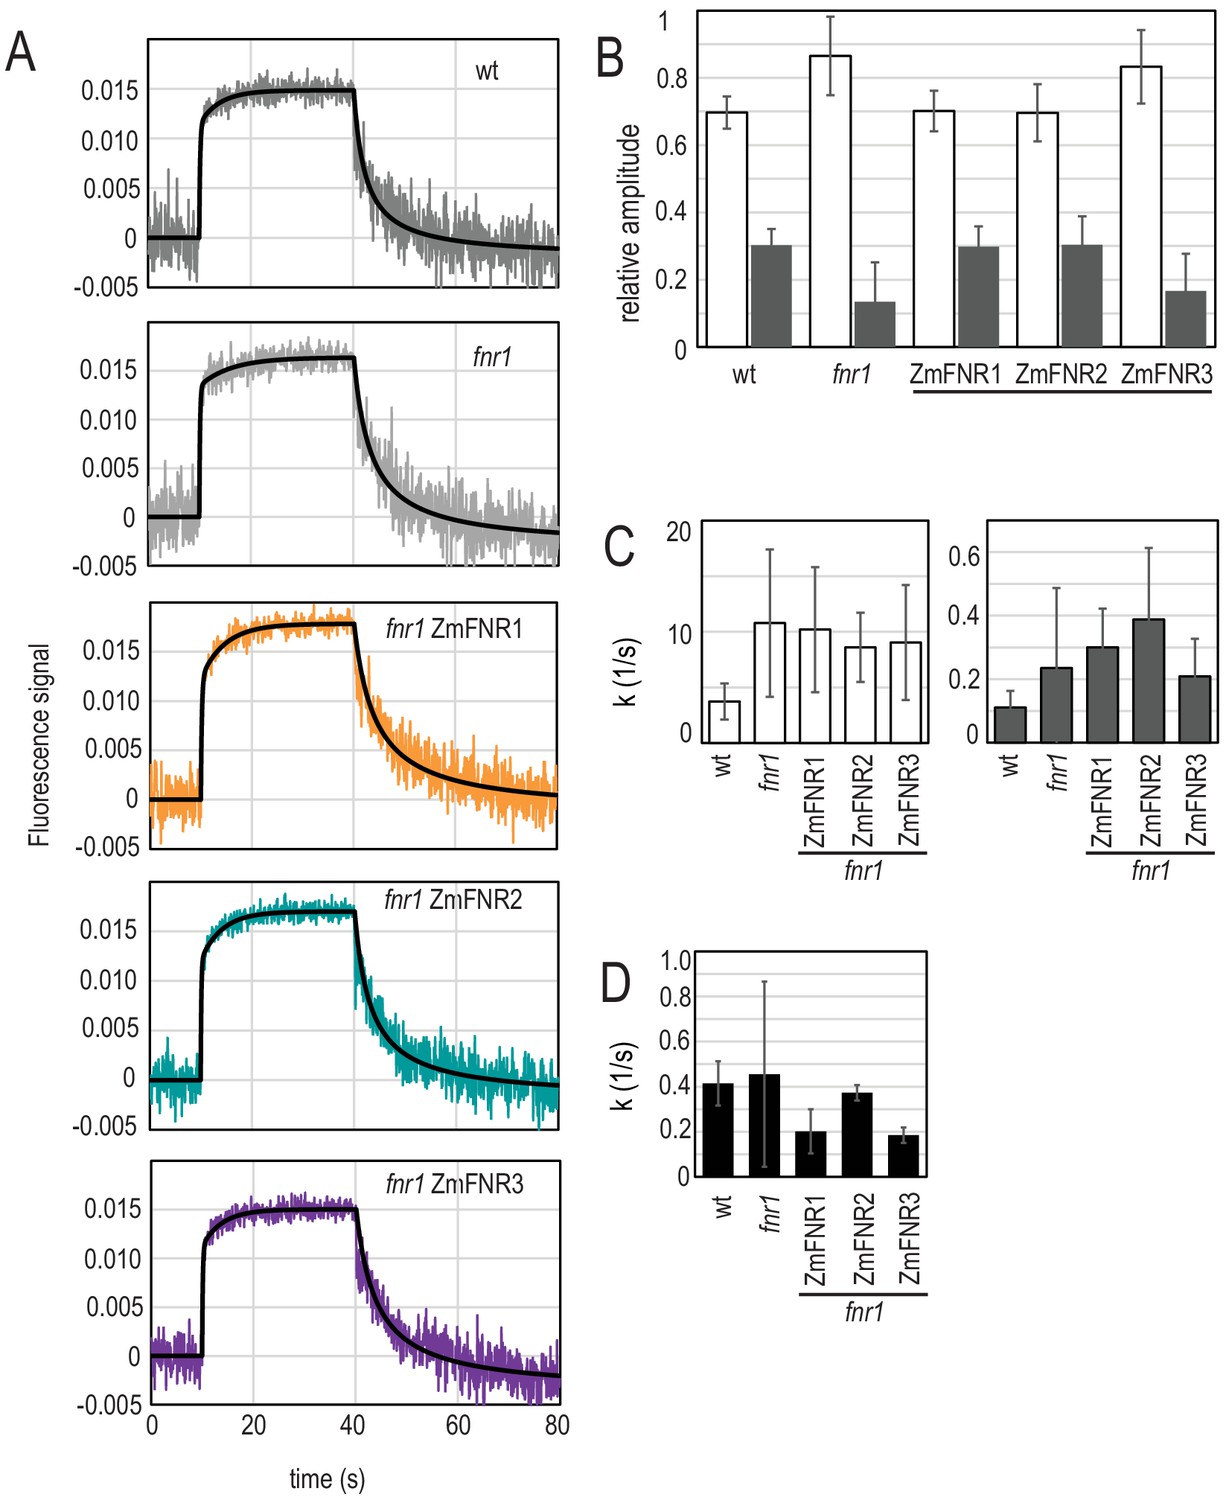
Light-dependent NADP(H) reduction and oxidation kinetics are influenced by FNR location and binding partners.
(A) Traces show NADPH fluorescence of dark adapted Arabidopsis chloroplasts measured over a short light exposure from 10 to 40 s. Traces are averages of three to five independent chloroplast preparations, each of which was composed of an average of 15 separate measurements. Genotypes from which chloroplasts were isolated are indicated on each graph. Black traces overlaying signals are fits (two components for reduction, one component for oxidation), calculated as described in Materials and methods. (B) Relative amplitude of fast (white bars) and slow (grey bars) components fitted to the NADP+ reduction traces shown in (A). (C) Rate of fluorescence induction for the fast (white bars, left) and slow (grey bars, right) components fitted to the NADP+ reduction traces shown in (A). (D) Rate of NADPH fluorescence decay following switching off the light, fitted to the traces shown in A. B–D are averages of values calculated from three to five separate chloroplast preparations (parameters in Supplementary file 2c and e). All values given ± standard error (fitting errors with absolute, 95% confidence). See Figure 4—figure supplement 1 for comparison between genotypes of proteins involved in NADP(H) metabolism. Appendix 1 describes further characterisation of the two phases of NADP+ reduction and Appendix 1—figure 1 shows further data on this topic.
Figure 4—figure supplement 1
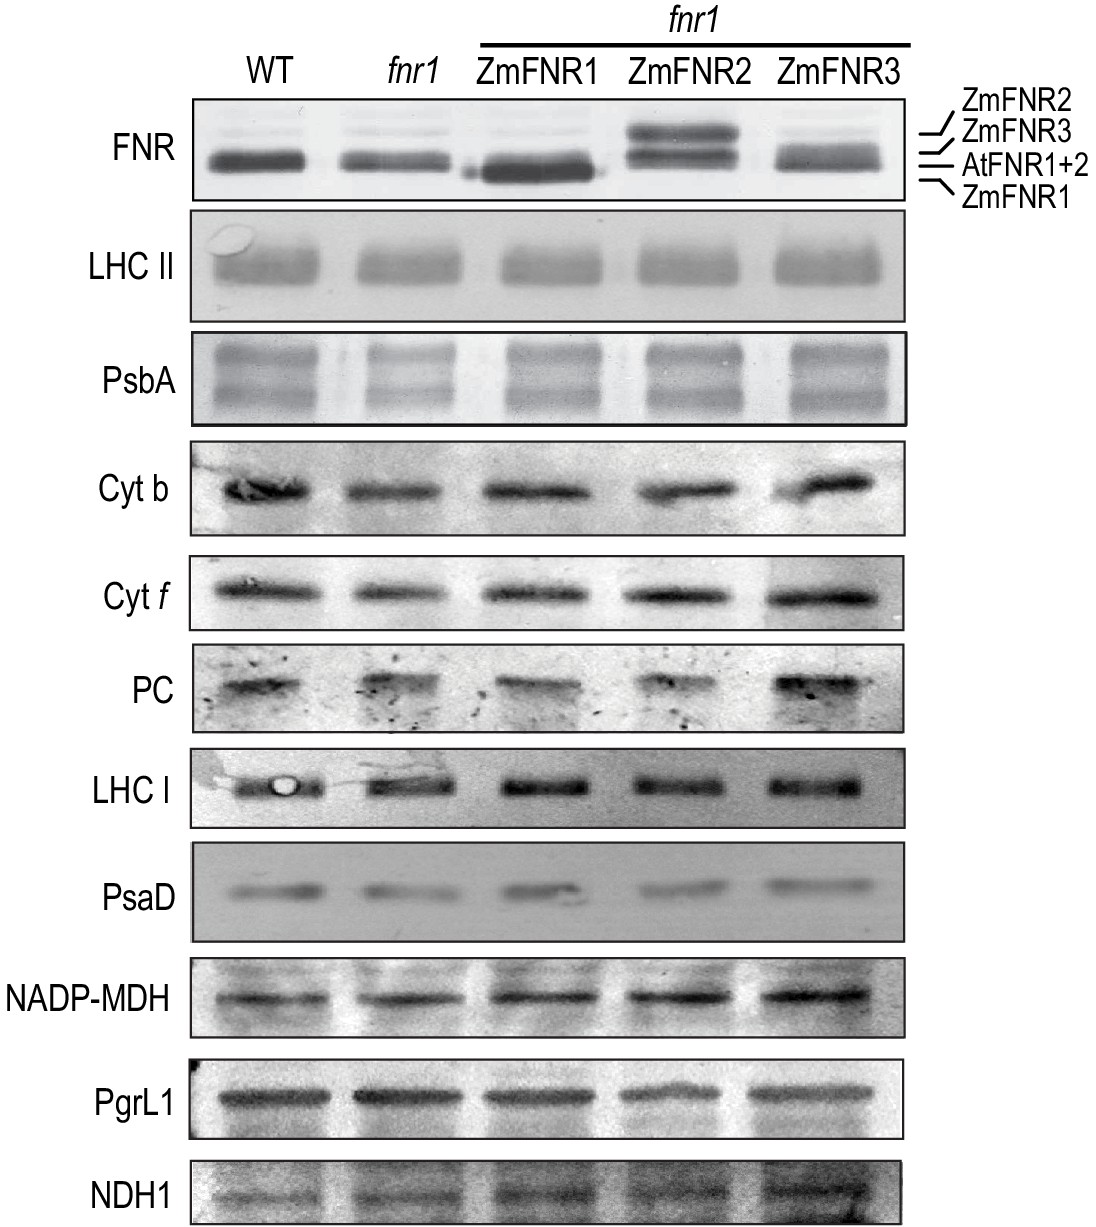
Abundance of the major photosynthetic complexes in the genotypes used in this study.
Arabidopsis plants of the indicated genotypes were grown in 12 hr light conditions at 150 µE/12 hr dark and mature leaf protein extract was subjected to SDS-PAGE before immunoblotting and detection of the indicated proteins with primary antisera and alkaline phosphatase conjugated secondary antisera. Gels were loaded on an equal protein basis, and blots are representative of experiments on at least three biological replicates for each genotype. Differences in migration of FNR iso-proteins are indicated to the right.
Figure 5 with 2 supplements
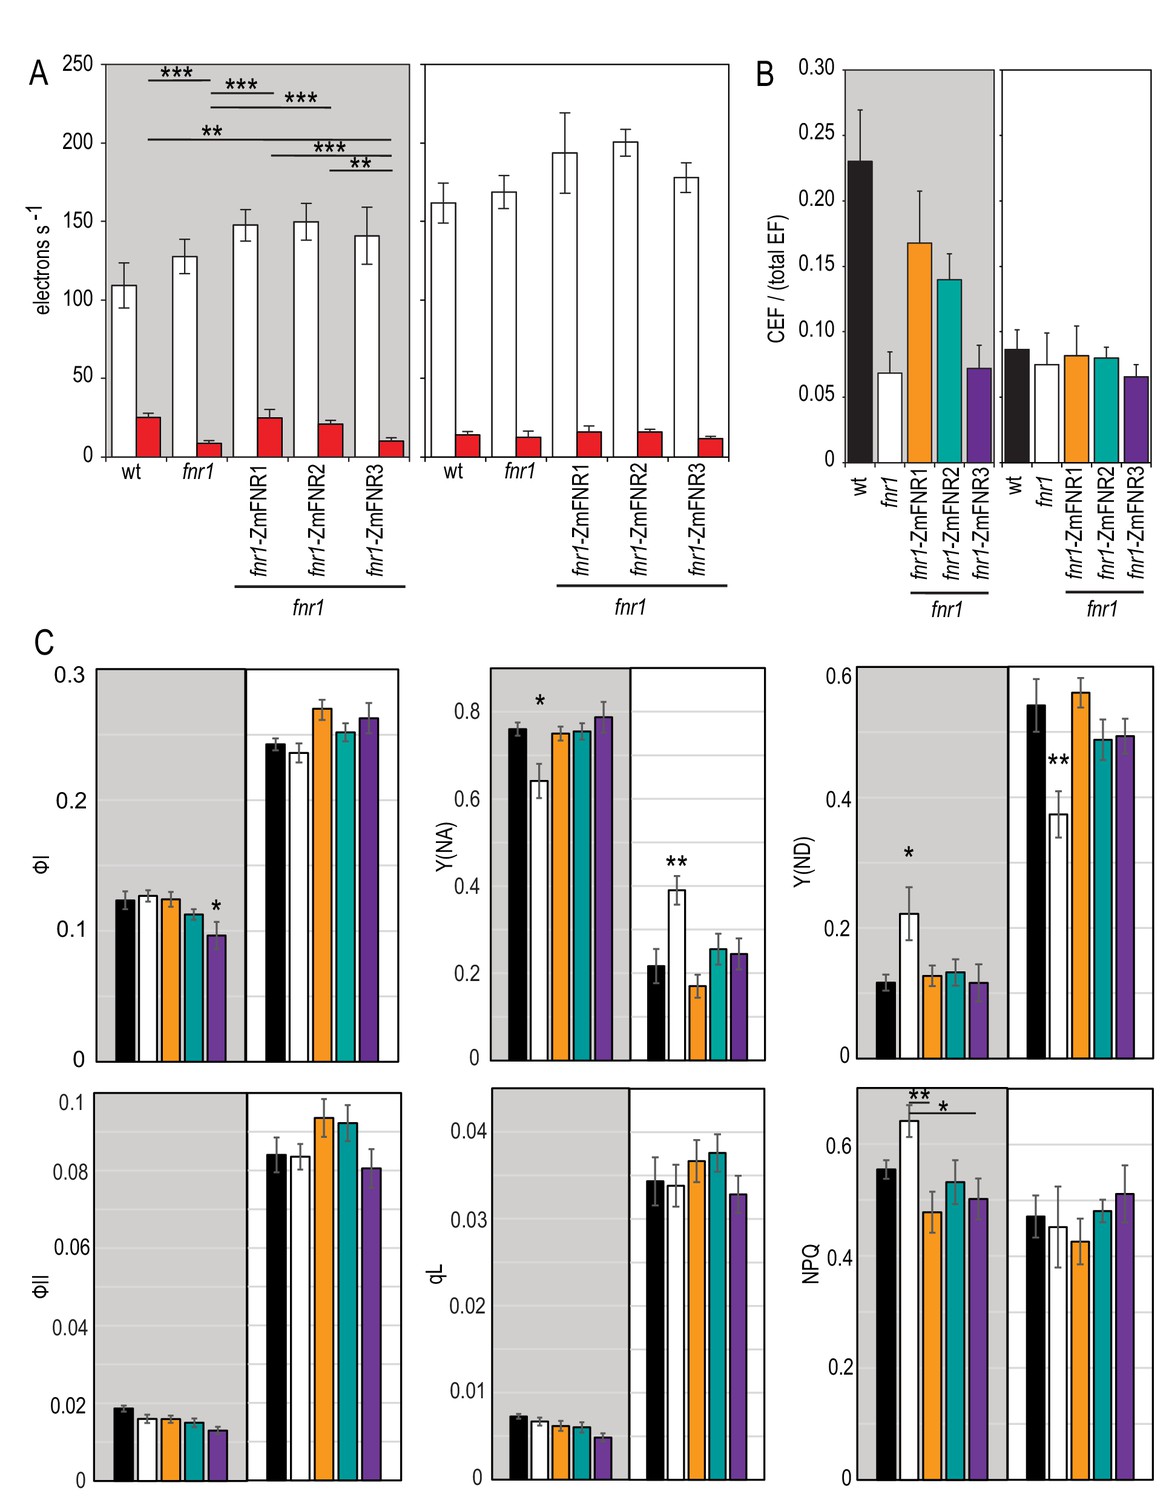
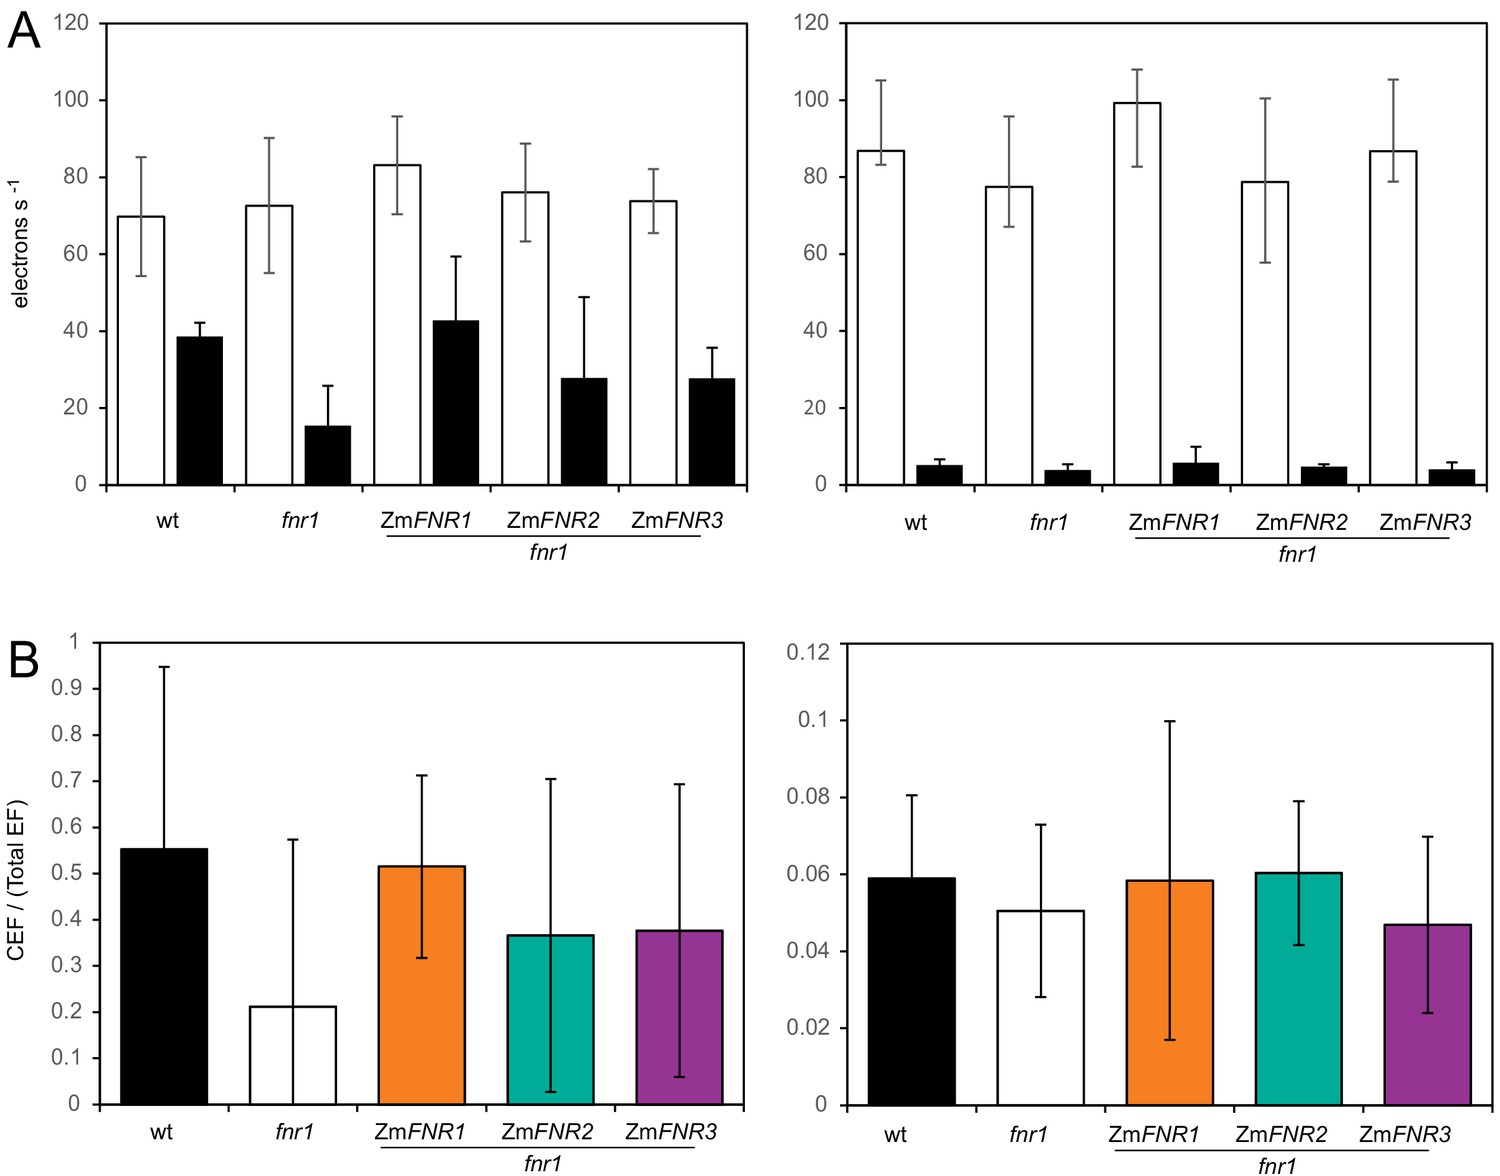
Impact of FNR location on photosynthetic electron transport in Arabidopsis following dark adaptation or light acclimation.
(A) ECS measurements after a 20 s high light pulse on dark adapted leaves (grey background) and light acclimated leaves (5 min 150 µE m−2 s−1, actinic light). The relaxation kinetics of ECS were measured at 520–546 nm after a 20 s pulse of actinic light at 1100 µmol photons m−2 s−1 (LEF + CEF stimulating, white boxes) or far red light (CEF stimulating, red boxes). Averages are shown for between five and seven independent measurements ± s.d. (B) Relative amount of CEF as a function of total electron flow calculated from the data in (A). Figure 5—figure supplement 1 shows a comparable experiment preformed with DCMU rather than far red light to drive PSI activity. (C) The response to high light in dark adapted leaves (grey background) and light acclimated leaves (5 min 150 µE m−2 s−1, actinic light, white background) was measured by detecting chlorophyll fluorescence and P700 oxidation with saturating pulses following 20 s of actinic light at 1100 µmol photons m−2 s−1. Measurements are averages ± s.e. of 6–12 replicates of the following genotypes: black, wt; white, fnr1; orange, fnr1-ZmFNR1; cyan, fnr1-ZmFNR2; purple, fnr1-ZmFNR3. Photosystem I parameters (quantum efficiency, ФI; donor limitation, Y(ND); acceptor limitation, Y(NA)) and photosystem II parameters (quantum efficiency, ФII; non-photochemical quenching, NPQ; photochemical quenching, qL). p-value significance in Tukey post hoc analysis of ANOVA is indicated as 0 ‘***’, 0.001 ‘**’ 0.01 ‘*’ 0.05 ‘.’. Unless indicated by bars, stars indicate variation from all other genotypes. Representative P700 and ECS traces are shown in Figure 5—figure supplement 2.
Figure 5—figure supplement 1
DCMU inhibition of PSII for measurement of cyclic electron flow in Arabidopsis.
Electrochromic band shift (ECS) assay to compare generation of ΔpH without (stimulation of both photosystems) or with 20 µM DCMU (inhibition of photosystem II). (A) ECS measurements on leaves from wild-type, fnr1, and fnr1 plants expressing either ZmFNR1, ZmFNR2, or ZmFNR3. The relaxation kinetics of ECS were measured at 520–546 nm after a 20 s pulse of actinic light at 1100 µE m−2 s−1 in leaf discs that had been infiltrated with 0.4 M manitol (white boxes) or 200 µM DCMU in 0.4 M manitol (black boxes). Leaves were either dark adapted and then subject to the illuminating pulse (left) or light acclimated at 150 µE m-2 s−1 actinic for 5 min (right) before measurement of ECS. Averages are shown for three independent measurements with standard deviation. (B) Relative amount of CEF as a function of total electron flow calculated from the data in (A) following dark adaptation (left) and light acclimation (right).
Figure 5—figure supplement 2
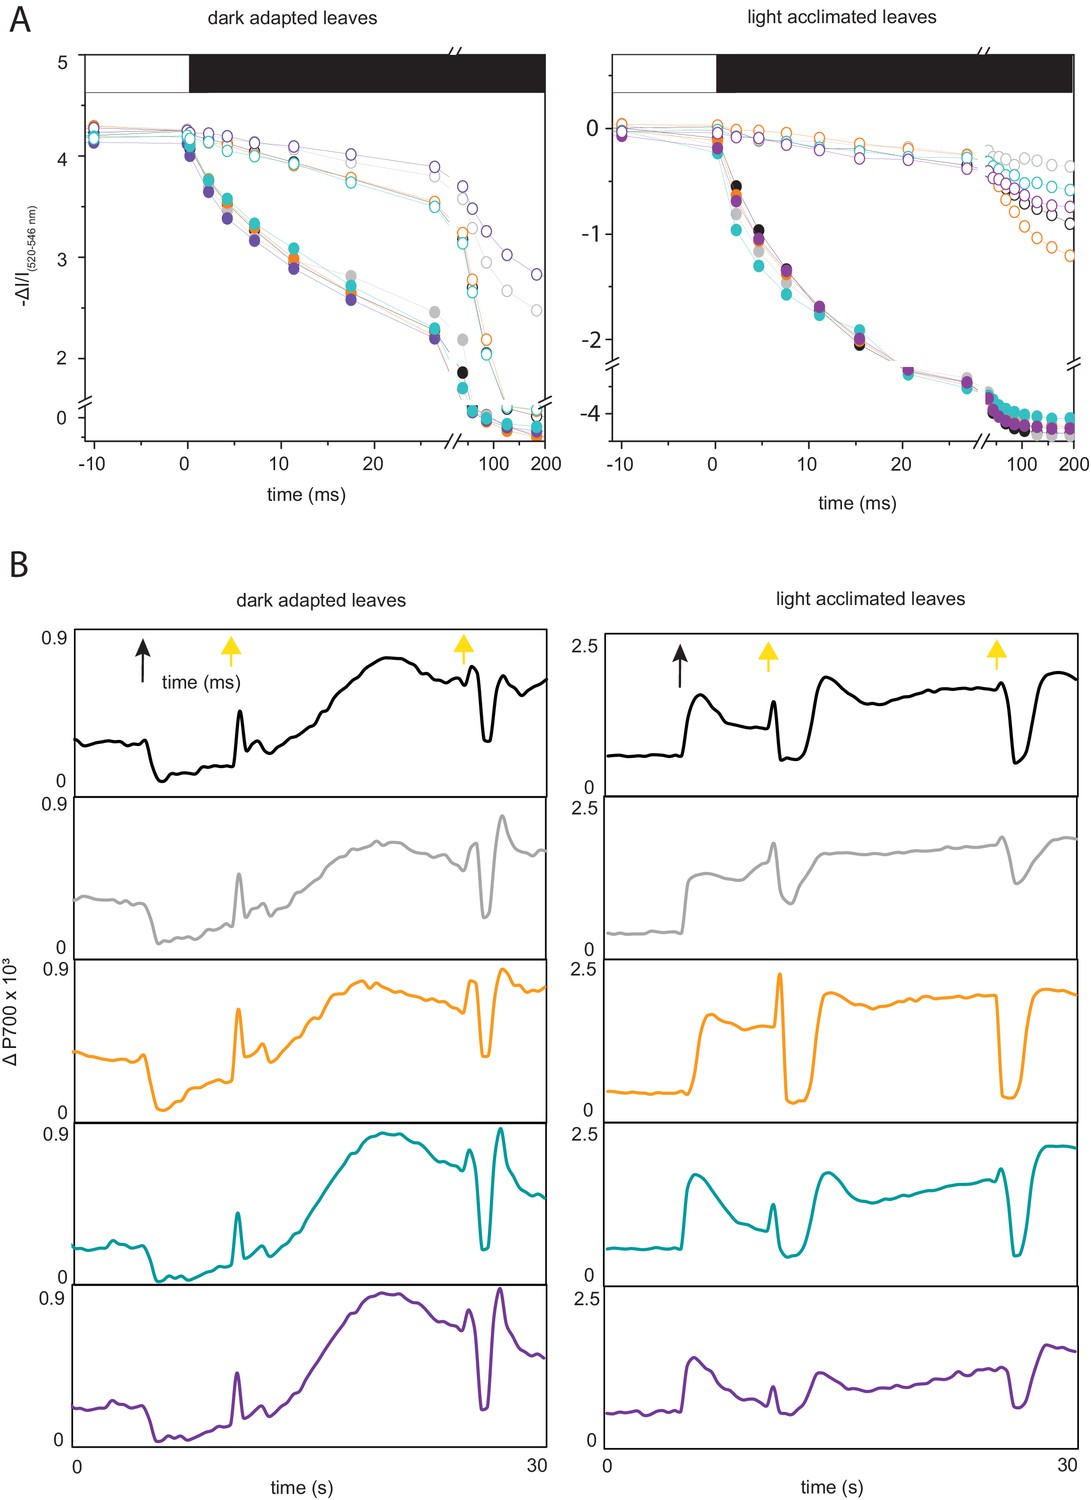
Raw data from ECS and PSI responses to high light treatment.
(A) Representative normalised ECS traces following high light exposure to either red light (filled circles) or far red light (empty circles) after dark adaptation (left) and light acclimation at 150 µmol photons m−2 s−1 actinic light (right). Bars above graphs indicate the end of high light treatment and transition to dark relaxation. Typical traces from six to seven measurements on independent plants are shown. Genotypes from top to bottom: black, wt; grey, fnr1; orange, fnr1-ZmFNR1; cyan, fnr1-ZmFNR2; purple, fnr1-ZmFNR3. (B) P700 traces on high light exposure following dark adaptation (left) and light acclimation at 150 µmol photons m−2 s−1 actinic light (right). Black arrow indicates start of illumination at 1100 µmol photons m−2 s−1, and yellow arrows indicate application of saturating pulses. Data presented in Figure 5B is only calculated from pulses applied 20 s after the start of the high light treatment. Typical traces from 6 to 12 measurements on independent plants are shown. Genotypes coloured as for part (A). Values of Pm and their statistical analysis are provided in Supplementary file 2f.
Figure 6 with 1 supplement
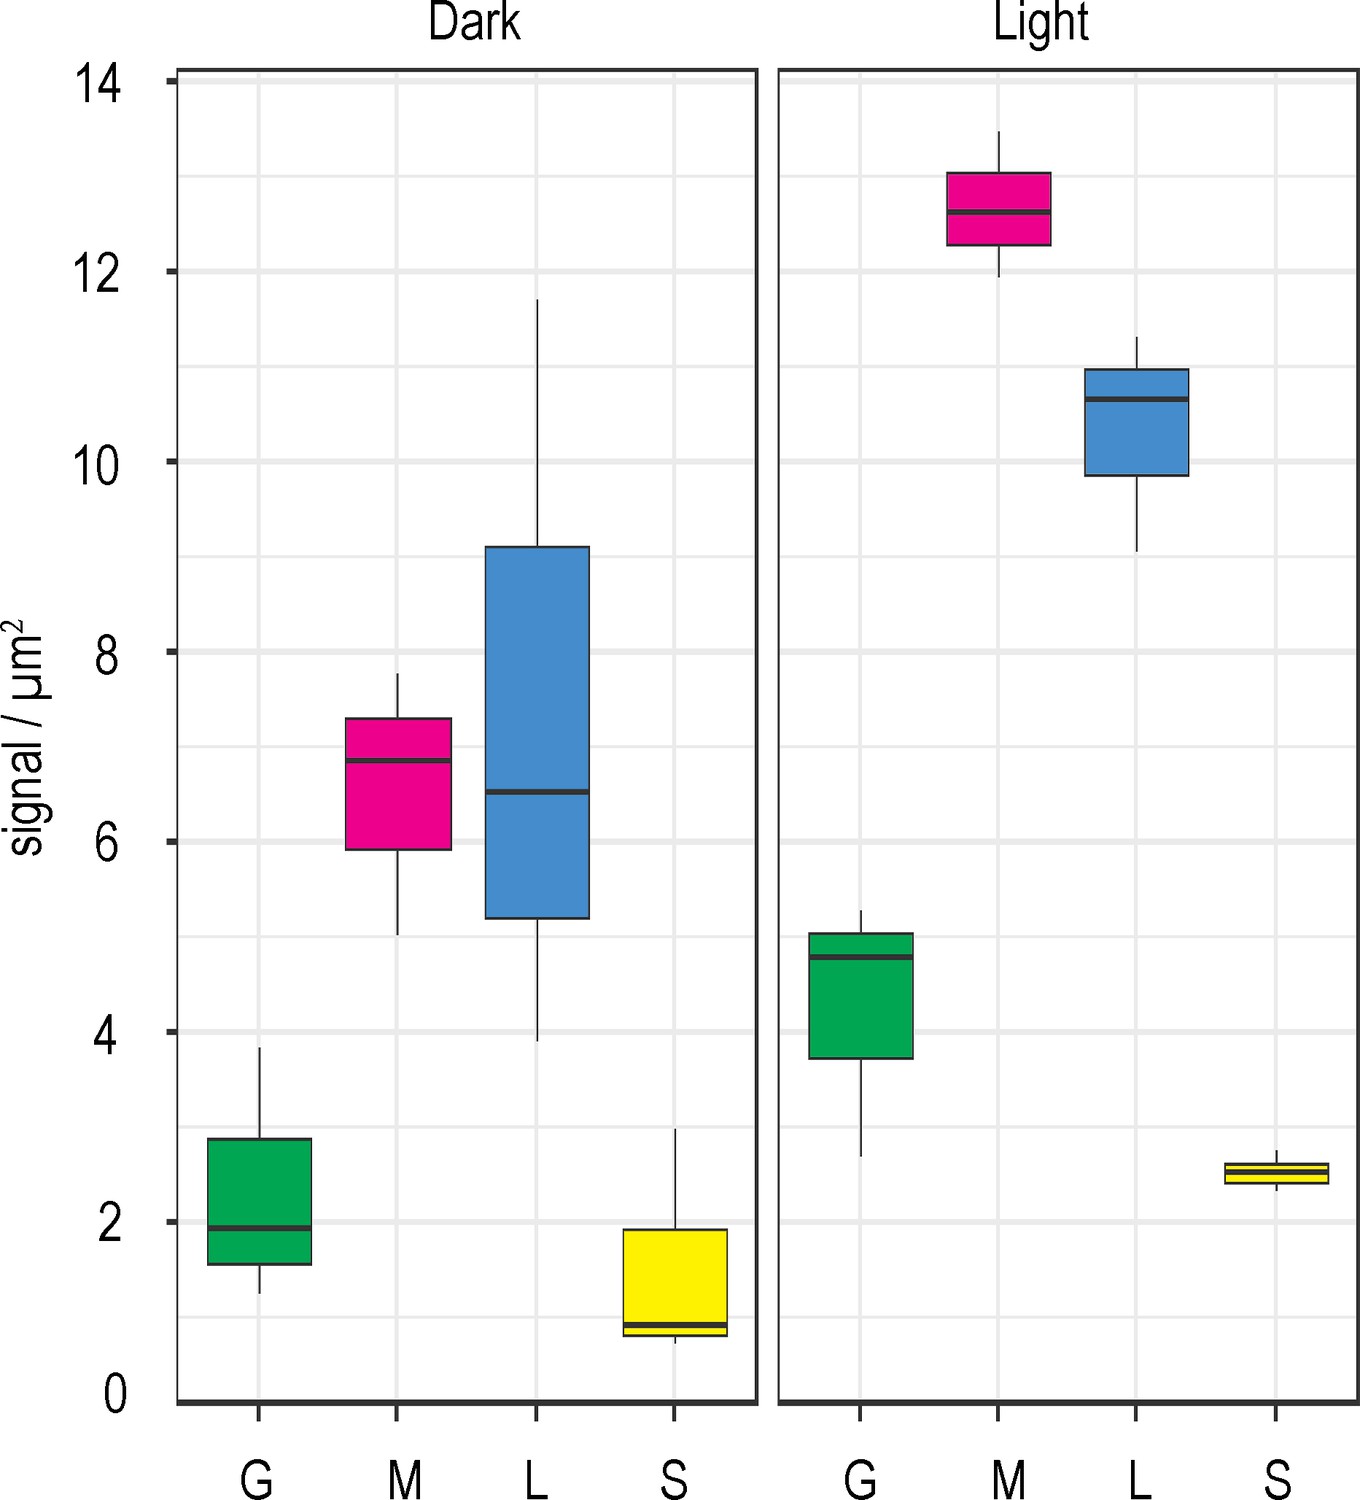
FNR sub-chloroplast distribution changes in response to light.
Density of immunogold labelled FNR in different sub-chloroplast compartments of Wt Arabidopsis either dark incubated (left panel, same data as in Figure 3) or light incubated (right panel), prior to and during fixation. Densities given are grana core, green; margins, magenta; lamellae, blue; and stroma, yellow. Values are averages of three biological replicates, with combined label and area for the sub-compartments of 15–20 chloroplasts for each individual. Statistical significance within and between treatments was calculated with a mixed effects model analysis of variance (Table 3).
Figure 6—figure supplement 1
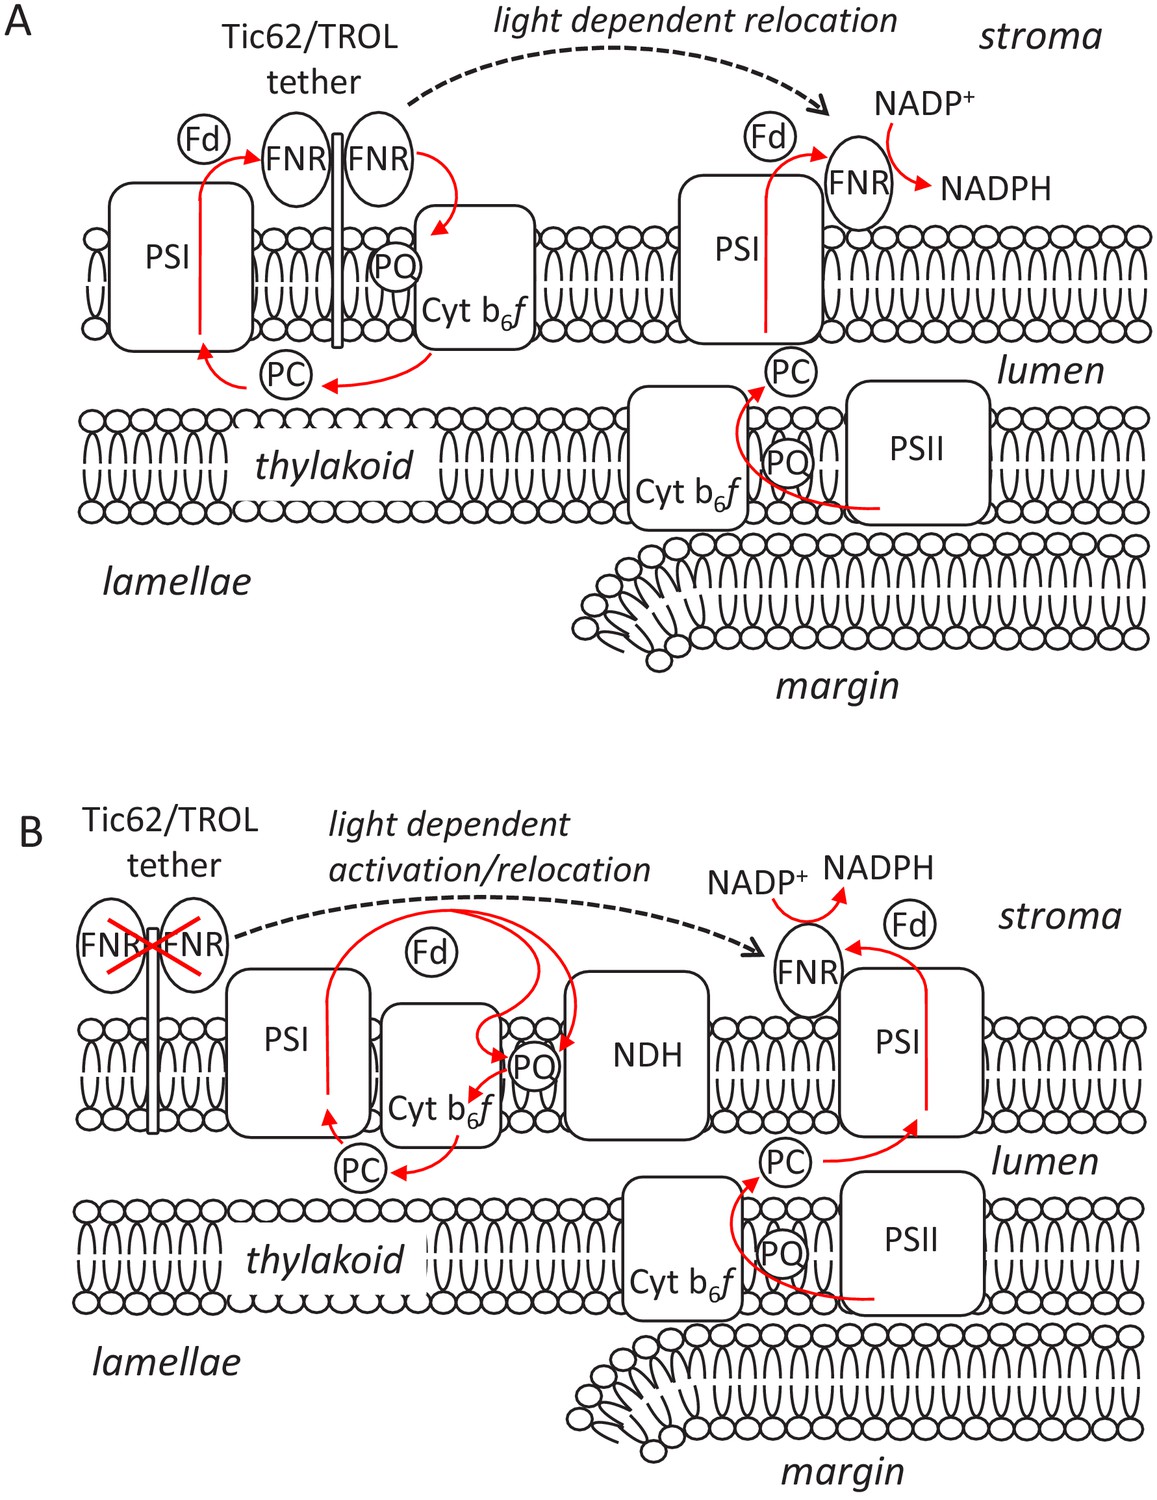
Two models describing potential mechanisms that could explain the impact of FNR interactions on photosynthetic electron transport during the dark to light transition.
Models are based on data presented in this work that indicate (i) FNR is overwhelmingly membrane bound irrespective of interaction with the Tic62/TROL tethers (Figures 1 and 3); (ii) Strong FNR:Tic62/TROL association is required for the transient CEF seen on dark to light transition (Figure 5); (iii) Fast and slow (10–15 s) components of NADP+ reduction are seen at the onset of light, and the slow component is attenuated without FNR:Tic62/TROL tether interactions (Figure 4); (iv) there is a tendency for FNR accumulation at the margins during the light (Figure 6). Model A, Active role in CEF for the FNR:tether complex. Tight binding of FNR to Tic62/TROL during the dark sequesters some of the enzyme on the stromal lamellae, favouring increased CEF at the onset of light (possibly involving pgr5/pgrL1 and/or interaction with the Cyt b6f). As proton pumping drives ∆pH formation, FNR:tether interactions weaken, and a proportion of this enzyme relocates to PSI at the margins, increasing the rate of NADPH formation. Model B, Default CEF due to FNR deactivation on tether interaction. Binding of some FNR to the Tic62/TROL tethers inactivates the enzyme, driving CEF by default, either through the Cyt b6f or the NDH complex. Weakening of these associations during the light releases a proportion of this enzyme, activating it. Some of this FNR relocates to the margin region, increasing the rate of NADP+ reduction. In both models significant amounts of weakly bound FNR at the margins continue to conduct NADP+ reduction in both the dark and the light.
Appendix 1—figure 1
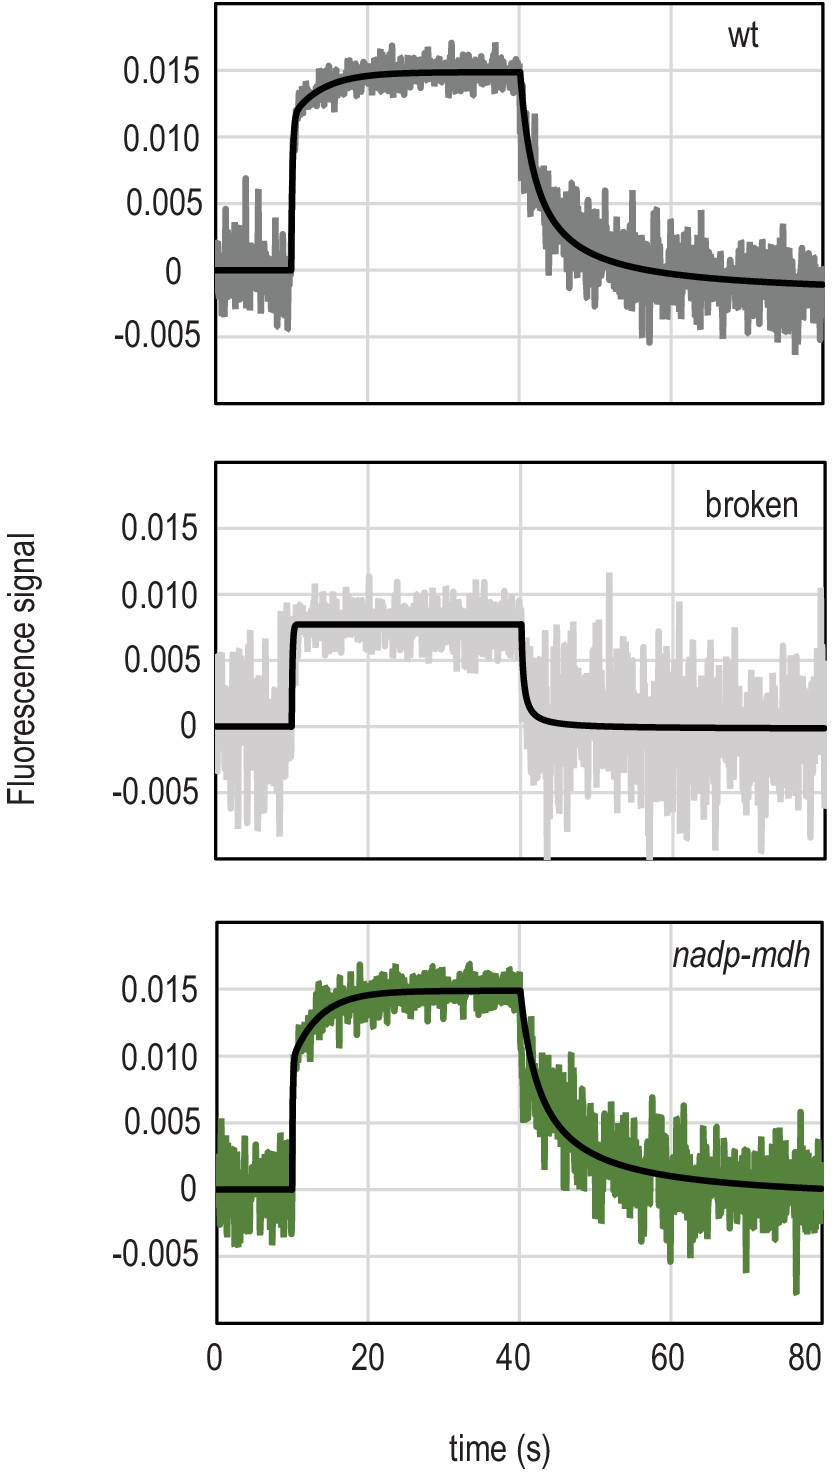
Examination of the two phases detected in fluorescent measurement of light-dependent NADP+ reduction.
Traces show NADPH fluorescence of dark adapted Arabidopsis chloroplasts measured over a short light exposure from 10 to 40 s. Traces are averages of five separate chloroplast preparations (wt), or representative of two separate experiments (broken chloroplasts and the nadp-mdh mutant, each of which is composed of an average of 15 separate measurements). Genotypes and treatment of chloroplasts are indicated on each graph. Chloroplasts were ruptured either by freeze thawing, or osmotic lysis with the same result. Black traces overlaying signals are fits (two components for reduction, one component for oxidation), calculated as described in Materials and methods.
Tables
Table 1
Mixed effects model investigating changes in FNR density between total chloroplast sub-compartments of three individuals each of WT and fnr1 Arabidopsis.
Analysis of data presented in Figure 1. Fixed effects taking either label density in the stroma as the intercept or label density in the margins/lamellae as the intercept. Linear mixed model fit by REML. Signif. codes: 0 ‘***’ 0.001 ‘**’ 0.01 ‘*’ 0.05 ‘.’ 0.1 ‘’ 1.
| Deletion test carried out using Satterthwaite’s method with the R package lmerTest (Kuznetsova, Brockhoff & Christensen 2017). The model is a mixed effects model with random intercepts. The square root of response is the response variable, tissue is the fixed effect, and individual the random effect. | ||||||||||||||||||||
|---|---|---|---|---|---|---|---|---|---|---|---|---|---|---|---|---|---|---|---|---|
| Fixed effect deleted | Sum sq | Mean sq | Num DF | Den DF | F value | Pr (>F) | ||||||||||||||
| Sub-compartment | 14.231 | 7.1153 | 2 | 295.58 | 7.4565 | 0.000693 | *** | |||||||||||||
| Model summary: | ||||||||||||||||||||
| Random effects: | ||||||||||||||||||||
| Groups | Name | Variance | Std. Dev. | |||||||||||||||||
| individual | (Intercept) | 0.1896 | 0.4354 | |||||||||||||||||
| Residual | 0.9542 | 0.9769 | ||||||||||||||||||
| Number of obs: 306, groups: individual, 6 | ||||||||||||||||||||
| Fixed effects when fnr1 stroma is set as the intercept | ||||||||||||||||||||
| Estimate | Std. Error | DF | t value | Pr (>|t|) | ||||||||||||||||
| (Intercept) | 0.9165 | 0.2791 | 4.2686 | 3.283 | 0.0276 | * | ||||||||||||||
| Grana | −0.3607 | 0.1714 | 295.5794 | −2.105 | 0.0361 | * | ||||||||||||||
| Margin/lamellae | 2.2884 | 0.1714 | 295.5794 | 13.355 | <2−16 | *** | ||||||||||||||
| Genotype comparison WT:fnr1 | 0.1230 | 0.4128 | 5.0375 | 0.298 | 0.7776 | |||||||||||||||
| WT grana: fnr1 grana | 0.6286 | 0.2845 | 295.5794 | 2.210 | 0.0279 | * | ||||||||||||||
| WT margin/lamellae: fnr1 margin/lamellae | −0.4661 | 0.2845 | 295.5794 | −1.638 | 0.1025 | |||||||||||||||
| Fixed effects when fnr1 margin/lamellae is set as the intercept | ||||||||||||||||||||
| Estimate | Std. Error | DF | t value | Pr (>|t|) | ||||||||||||||||
| (Intercept) | 0.9165 | 0.2791 | 4.2686 | 11.482 | 0.000228 | *** | ||||||||||||||
| Grana | −2.6491 | 0.1714 | 295.5794 | −15.460 | <2−16 | *** | ||||||||||||||
| Stroma | −2.2884 | 0.1714 | 295.5794 | −13.355 | <2−16 | *** | ||||||||||||||
| Genotype comparison WT:fnr1 | −0.3430 | 0.4128 | 5.0375 | −0.831 | 0.443524 | |||||||||||||||
| WT grana: fnr1 grana | 1.0947 | 0.2845 | 295.5794 | 3.848 | 0.000146 | *** | ||||||||||||||
| WT stroma: fnr1 stroma | −0.4661 | 0.2845 | 295.5794 | 1.638 | 0.102459 | |||||||||||||||
| Fixed effects when Wt stroma is set as the intercept | ||||||||||||||||||||
| Estimate | Std. Error | DF | t value | Pr (>|t|) | ||||||||||||||||
| (Intercept) | 1.0395 | 0.3041 | 5.8576 | 3.418 | 0.0147 | * | ||||||||||||||
| Grana | 0.2679 | 0.2271 | 295.5794 | 1.180 | 0.2391 | |||||||||||||||
| Margin/lamellae | 1.8223 | 0.2271 | 295.5794 | 8.024 | 2.43−14 | *** | ||||||||||||||
| Genotype comparison WT:fnr1 | −0.1230 | 0.4128 | 5.0375 | −0.298 | 0.7776 | |||||||||||||||
| Wt grana: fnr1 grana | −0.6286 | 0.2845 | 295.5794 | −2.210 | 0.0279 | * | ||||||||||||||
| Wt margin/lamellae: fnr1 margin/lamellae | 0.4661 | 0.2845 | 295.5794 | 1.638 | 0.1025 | |||||||||||||||
| Fixed effects when Wt margin/lamellae is set as the intercept | ||||||||||||||||||||
| Estimate | Std. Error | DF | t value | Pr (>|t|) | ||||||||||||||||
| (Intercept) | 2.8618 | 0.3041 | 5.8576 | 9.411 | 9.41−05 | *** | ||||||||||||||
| Grana | −1.5544 | 0.2271 | 295.5794 | −6.844 | 4.44−11 | *** | ||||||||||||||
| Stroma | −1.8223 | 0.2271 | 295.5794 | −8.024 | 2.43−14 | *** | ||||||||||||||
| Genotype comparison WT:fnr1 | 0.343 | 0.4128 | 5.0375 | 0.831 | 0.443524 | |||||||||||||||
| Wt grana: fnr1 grana | −1.0947 | 0.2845 | 295.5794 | −3.848 | 0.000146 | *** | ||||||||||||||
| Wt stroma: fnr1 stroma | −0.4661 | 0.2845 | 295.5794 | −1.638 | 0.102459 | |||||||||||||||
Table 2
Mixed effects model investigating changes in FNR density between total chloroplast sub-compartments of three individuals each from Arabidopsis genotypes WT, fnr1 mutant and expressing ZmFNR1; ZmFNR2 and ZmFNR3 in the fnr1 background.
Analysis of data presented in Figure 3. Fixed effects taking either label density in the stroma as the intercept or label density in the margins/lamellae as the intercept. Linear mixed model fit by REML. Signif. codes: 0 ‘***’ 0.001 ‘**’ 0.01 ‘*’ 0.05 ‘.’ 0.1 ‘’ 1.
| Wt Deletion test carried out using Satterthwaite’s method with the R package lmerTest (Kuznetsova, Brockhoff & Christensen 2017). The model is a mixed effects model with random intercepts. The square root of response is the response variable, tissue is the fixed effect, and individual the random effect. | |||||||
| Fixed effect deleted | Sum Sq | Mean Sq | Num DF | Den DF | F value | Pr (>F) | |
| Sub-compartment | 4.991 | 1.6637 | 3 | 6 | 36.152 | 0.0003089 | *** |
| Model summary: | |||||||
| Random effects: | |||||||
| Groups | Name | Variance | Std. Dev. | ||||
| Individual | (Intercept) | 0.21097 | 0.4593 | ||||
| Residual | 0.04602 | 0.2145 | |||||
| Number of obs: 12, groups: individual, 3 | |||||||
| Fixed effects when stroma is set as the intercept: | |||||||
| Estimate | Std. Error | DF | t value | Pr (>|t|) | |||
| (Intercept) | 1.1743 | 0.2927 | 2.6475 | 4.012 | 0.034961 | * | |
| Grana | 0.3104 | 0.1752 | 6 | 1.772 | 0.126711 | ||
| Lamellae | 1.4748 | 0.1752 | 6 | 8.42 | 0.000153 | *** | |
| Margin | 1.3736 | 0.1752 | 6 | 7.842 | 0.000227 | *** | |
| Fixed effects when lamellae is set as the intercept: | |||||||
| Estimate | Std. Error | DF | t value | Pr (>|t|) | |||
| (Intercept) | 2.6491 | 0.2927 | 2.6475 | 9.051 | 0.004601 | ** | |
| Grana | −1.1644 | 0.1752 | 6 | −6.648 | 0.00056 | *** | |
| Margin | −0.1012 | 0.1752 | 6 | −0.578 | 0.584522 | ||
| Stroma | −1.4748 | 0.1752 | 6 | −8.42 | 0.000153 | *** | |
| fnr1 Deletion test carried out using Satterthwaite’s method with the R package lmerTest (Kuznetsova, Brockhoff & Christensen 2017). The model is a mixed effects model with random intercepts. The square root of response is the response variable, tissue is the fixed effect, and individual the random effect. | |||||||
| Fixed effect deleted | Sum Sq | Mean Sq | Num DF | Den DF | F value | Pr (>F) | |
| Sub-compartment | 5.6516 | 1.8839 | 3 | 6 | 26.204 | 0.000759 | *** |
| Model summary: | |||||||
| Random effects: | |||||||
| Groups | Name | Variance | Std. Dev. | ||||
| Individual | (Intercept) | 0.07521 | 0.2742 | ||||
| Residual | 0.07189 | 0.2681 | |||||
| Number of obs: 12, groups: individual, 3 | |||||||
| Fixed effects when stroma is set as the intercept: | |||||||
| Estimate | Std. Error | DF | t value | Pr (>|t|) | |||
| (Intercept) | 1.2117 | 0.2214 | 4.4836 | 5.472 | 0.003875 | ** | |
| Grana | −0.1584 | 0.2189 | 6 | −0.724 | 0.496563 | ||
| Lamellae | 0.9353 | 0.2189 | 6 | 4.272 | 0.005251 | ** | |
| Margin | 1.5161 | 0.2189 | 6 | 6.925 | 0.000449 | *** | |
| Fixed effects when lamellae is set as the intercept: | |||||||
| Estimate | Std. Error | DF | t value | Pr (>|t|) | |||
| (Intercept) | 2.1469 | 0.2214 | 4.4836 | 9.695 | 0.000356 | *** | |
| Grana | −1.0937 | 0.2189 | 6 | −4.996 | 0.002463 | ** | |
| Margin | 0.5808 | 0.2189 | 6 | 2.653 | 0.037882 | * | |
| Stroma | −0.9353 | 0.2189 | 6 | −4.272 | 0.005251 | ** | |
| fnr1:ZmFNR1 Deletion test carried out using Satterthwaite’s method with the R package lmerTest (Kuznetsova, Brockhoff & Christensen 2017). The model is a mixed effects model with random intercepts. The square root of response is the response variable, tissue is the fixed effect, and individual the random effect. | |||||||
| Fixed effect deleted | Sum Sq | Mean Sq | Num DF | Den DF | F value | Pr (>F) | |
| Sub-compartment | 4.5242 | 1.5081 | 3 | 6.01 | 23.558 | 0.001009 | ** |
| Model summary: | |||||||
| Random effects: | |||||||
| Groups | Name | Variance | Std. Dev. | ||||
| Individual | (Intercept) | 0.0005984 | 0.02446 | ||||
| Residual | 0.064017 | 0.25302 | |||||
| Number of obs: 12, groups: individual, 3 | |||||||
| Fixed effects when stroma is set as the intercept: | |||||||
| Estimate | Std. Error | DF | t value | Pr (>|t|) | |||
| (Intercept) | 1.1754 | 0.1468 | 7.9979 | 8.009 | 4.34−05 | *** | |
| Relevel grana | 0.2318 | 0.2066 | 6.01 | 1.122 | 0.304712 | ||
| Relevel lamellae | 1.3774 | 0.2066 | 6.01 | 6.668 | 0.000547 | *** | |
| Relevel margin | 1.2849 | 0.2066 | 6.01 | 6.22 | 0.000793 | *** | |
| Fixed effects when lamellae is set as the intercept: | |||||||
| Estimate | Std. Error | DF | t value | Pr (>|t|) | |||
| (Intercept) | 2.55285 | 0.14676 | 7.9979 | 17.395 | 1.22−07 | *** | |
| Relevel grana | −1.14567 | 0.20659 | 6.01002 | −5.546 | 0.001444 | ** | |
| Relevel margin | −0.09252 | 0.20659 | 6.01002 | −0.448 | 0.669949 | ||
| Relevel stroma | −1.37744 | 0.20659 | 6.01002 | −6.668 | 0.000547 | *** | |
| fnr1:ZmFNR2 | |||||||
| Deletion test carried out using Satterthwaite’s method with the R package lmerTest (Kuznetsova, Brockhoff & Christensen 2017). The model is a mixed effects model with random intercepts. The square root of response is the response variable, tissue is the fixed effect, and individual the random effect. | |||||||
| Fixed effect deleted | Sum Sq | Mean Sq | Num DF | Den DF | F value | Pr (>F) | |
| Sub-compartment | 5.4414 | 1.8138 | 3 | 6 | 22.849 | 0.001106 | ** |
| Model summary: | |||||||
| Random effects: | |||||||
| Groups | Name | Variance | Std. Dev. | ||||
| Individual | (Intercept) | 0.02741 | 0.1656 | ||||
| Residual | 0.07938 | 0.2817 | |||||
| Number of obs: 12, groups: individual, 3 | |||||||
| Fixed effects when stroma is set as the intercept: | |||||||
| Estimate | Std. Error | DF | t value | Pr (>|t|) | |||
| (Intercept) | 1.1886 | 0.1887 | 6.6796 | 6.3 | 0.000488 | *** | |
| Grana | 0.4864 | 0.23 | 6 | 2.114 | 0.078885 | . | |
| Lamellae | 1.8298 | 0.23 | 6 | 7.954 | 0.00021 | *** | |
| Margin | 0.9239 | 0.23 | 6 | 4.016 | 0.006989 | ** | |
| Fixed effects when lamellae is set as the intercept: | |||||||
| Estimate | Std. Error | DF | t value | Pr (>|t|) | |||
| (Intercept) | 3.0184 | 0.1887 | 6.6796 | 15.998 | 1.42−06 | *** | |
| Grana | −1.3434 | 0.23 | 6 | −5.84 | 0.00111 | ** | |
| Margin | −0.9059 | 0.23 | 6 | −3.938 | 0.00764 | ** | |
| Stroma | −1.8298 | 0.23 | 6 | −7.954 | 0.00021 | *** | |
| fnr1:ZmFNR3 | |||||||
| Deletion test carried out using Satterthwaite’s method with the R package lmerTest (Kuznetsova, Brockhoff & Christensen 2017). The model is a mixed effects model with random intercepts. The square root of response is the response variable, tissue is the fixed effect, and individual the random effect. | |||||||
| Fixed effect deleted | Sum Sq | Mean Sq | Num DF | Den DF | F value | Pr (>F) | |
| Sub-compartment | 9.0046 | 3.0015 | 3 | 8 | 25.416 | 0.0001923 | *** |
| Model summary: | |||||||
| Random effects: | |||||||
| Groups | Name | Variance | Std. Dev. | ||||
| Individual | (Intercept) | 0 | 0 | ||||
| Residual | 0.1181 | 0.3436 | |||||
| Number of obs: 12, groups: individual, 3 | |||||||
| Fixed effects when stroma is set as the intercept: | |||||||
| Estimate | Std. Error | DF | t value | Pr (>|t|) | |||
| (Intercept) | 1.06794 | 0.19841 | 8 | 5.383 | 0.00066 | *** | |
| Grana | 0.06284 | 0.28059 | 8 | 0.224 | 0.828395 | ||
| Lamellae | 1.99447 | 0.28059 | 8 | 7.108 | 0.000101 | *** | |
| Margin | 1.44343 | 0.28059 | 8 | 5.144 | 0.00088 | *** | |
| Fixed effects when lamellae is set as the intercept: | |||||||
| Estimate | Std. Error | DF | t value | Pr (>|t|) | |||
| (Intercept) | 3.0624 | 0.1984 | 8 | 15.435 | 3.09−07 | *** | |
| Grana | −1.9316 | 0.2806 | 8 | −6.884 | 0.000127 | *** | |
| Margin | −0.551 | 0.2806 | 8 | −1.964 | 0.085144 | . | |
| Stroma | −1.9945 | 0.2806 | 8 | −7.108 | 0.000101 | *** | |
Table 3
Mixed effects model investigating changes in FNR density between different the chloroplast sub-compartments of WT Arabidopsis following dark adaptation or light adaptation of leaves.
Analysis performed using the data in Figure 6. Fixed effects taking either label density in the stroma as the intercept or label density in the margins/lamellae as the intercept. Linear mixed model fit by REML. Signif. codes: 0 ‘***’ 0.001 ‘**’ 0.01 ‘*’ 0.05 ‘.’ 0.1 ‘’ 1.
| Deletion test carried out using Satterthwaite’s method with the R package lmerTest (Kuznetsova, Brockhoff & Christensen 2017). The model is a mixed effects model with random intercepts. The square root of response is the response variable, tissue is the fixed effect, and individual the random effect. | |||||||||||||||||||||
|---|---|---|---|---|---|---|---|---|---|---|---|---|---|---|---|---|---|---|---|---|---|
| Fixed effect deleted | Sum Sq | Mean Sq | Num DF | Den DF | F value | Pr (>F) | |||||||||||||||
| Sub-compartment | 0.30184 | 0.10061 | 3 | 12 | 2.3613 | 0.1227 | |||||||||||||||
| Model summary: | |||||||||||||||||||||
| Random effects: | |||||||||||||||||||||
| Groups | Name | Variance | Std. Dev. | ||||||||||||||||||
| Individual | (Intercept) | 0.1073 | 0.3276 | ||||||||||||||||||
| Residual | 0.04261 | 0.2064 | |||||||||||||||||||
| Number of obs: 24, groups: individual, 6 | |||||||||||||||||||||
| Fixed effects when dark adapted stroma is set as the intercept:: | |||||||||||||||||||||
| Estimate | Std. Error | DF | t value | Pr (>|t|) | |||||||||||||||||
| (Intercept) | 1.1743 | 0.2235 | 6.3067 | 5.253 | 0.00164 | ** | |||||||||||||||
| Grana | 0.3104 | 0.1685 | 12 | 1.842 | 0.09033 | . | |||||||||||||||
| Lamellae | 1.4748 | 0.1685 | 12 | 8.75 | 1.48−06 | *** | |||||||||||||||
| Margins | 1.3736 | 0.1685 | 12 | 8.15 | 3.11−06 | *** | |||||||||||||||
| Light:dark comparison | 0.4157 | 0.3161 | 6.3067 | 1.315 | 0.23427 | ||||||||||||||||
| Light:dark grana | 0.1421 | 0.2384 | 12 | 0.596 | 0.5622 | ||||||||||||||||
| Light:dark lamellae | 0.1482 | 0.2384 | 12 | 0.622 | 0.54562 | ||||||||||||||||
| Light:dark margins | 0.5963 | 0.2384 | 12 | 2.502 | 0.02782 | * | |||||||||||||||
| Fixed effects when dark adapted lamellae is set as the intercept:: | |||||||||||||||||||||
| Estimate | Std. Error | DF | t value | Pr (>|t|) | |||||||||||||||||
| (Intercept) | 2.64913 | 0.223542 | 6.306738 | 11.851 | 1.52−05 | *** | |||||||||||||||
| Grana | −1.16437 | 0.168543 | 12.000001 | −6.908 | 1.63−05 | *** | |||||||||||||||
| Margins | −0.101175 | 0.168543 | 12.000001 | −0.6 | 0.5595 | ||||||||||||||||
| Stroma | −1.474807 | 0.168543 | 12.000001 | −8.75 | 1.48−06 | *** | |||||||||||||||
| Light:dark comparison | 0.563988 | 0.316136 | 6.306738 | 1.784 | 0.1223 | ||||||||||||||||
| Light:dark grana | −0.006164 | 0.238356 | 12.000001 | −0.026 | 0.9798 | ||||||||||||||||
| Light:dark margins | 0.44808 | 0.238356 | 12.000001 | 1.88 | 0.0846 | . | |||||||||||||||
| Light:dark stroma | −0.148241 | 0.238356 | 12.000001 | −0.622 | 0.5456 | ||||||||||||||||
| Fixed effects when light acclimated stroma is set as the intercept: | |||||||||||||||||||||
| Estimate | Std. Error | DF | t value | Pr (>|t|) | |||||||||||||||||
| (Intercept) | 1.5901 | 0.2235 | 6.3067 | 7.113 | 0.00031 | *** | |||||||||||||||
| Grana | 0.4525 | 0.1685 | 12 | 2.685 | 0.01986 | * | |||||||||||||||
| Lamellae | 1.623 | 0.1685 | 12 | 9.63 | 5.37−07 | *** | |||||||||||||||
| Margins | 1.97 | 0.1685 | 12 | 11.688 | 6.48−08 | *** | |||||||||||||||
| Dark:light comparison | −0.4157 | 0.3161 | 6.3067 | −1.315 | 0.23427 | ||||||||||||||||
| Dark:light grana | −0.1421 | 0.2384 | 12 | −0.596 | 0.5622 | ||||||||||||||||
| Dark:light lamellae | −0.1482 | 0.2384 | 12 | −0.622 | 0.54562 | ||||||||||||||||
| Dark:light margins | −0.5963 | 0.2384 | 12 | −2.502 | 0.02782 | * | |||||||||||||||
| Fixed effects when light acclimated lamellae is set as the intercept: | |||||||||||||||||||||
| Estimate | Std. Error | DF | t value | Pr (>|t|) | |||||||||||||||||
| (Intercept) | 3.213118 | 0.223542 | 6.306738 | 14.374 | 4.68−06 | *** | |||||||||||||||
| Grana | −1.170535 | 0.168543 | 12.000001 | −6.945 | 1.55−05 | *** | |||||||||||||||
| Margins | 0.346905 | 0.168543 | 12.000001 | 2.058 | 0.062 | . | |||||||||||||||
| Stroma | −1.623048 | 0.168543 | 12.000001 | −9.63 | 5.37−07 | *** | |||||||||||||||
| Dark:light comparison | −0.563988 | 0.316136 | 6.306738 | −1.784 | 0.1223 | ||||||||||||||||
| Dark:light grana | 0.006164 | 0.238356 | 12.000001 | 0.026 | 0.9798 | ||||||||||||||||
| Dark:light margins | −0.44808 | 0.238356 | 12.000001 | −1.88 | 0.0846 | . | |||||||||||||||
| Dark:light stroma | 0.148241 | 0.238356 | 12.000001 | 0.622 | 0.5456 | ||||||||||||||||
Key resources table
| Reagent type (species) or resource | Designation | Source or reference | Identifiers | Additional information |
|---|---|---|---|---|
| Gene (Arabidopsis thaliana) | FNR1; FNR2 | GenBank | AT5G66190; AT1G20020 | |
| Gene (Zea mays) | FNR1; FNR2; FNR3; TROL | GenBank | BAA88236; BAA88237; ACF85815; ACF79627.1 | |
| Strain, strain background (Escherichia coli) | BL21(DE3) | Thermo Fisher | EC0114 | Competent cells |
| Genetic reagent (A. thaliana) | Columbia; Columbia fnr1; Columbia ZmFNR1; Columbia ZmFNR3 | Arabidopsis Biological Resource Center (ABRC) See Twachtmann et al., 2012 for over-expression line generation | wt; AT1G20020 T-DNA insertion mutant; Line expressing BAA88236 under control of the AT1G20020 promoter; Line expressing ACF85815 under control of the AT1G20020 promoter | See Hanke et al., 2008 for mutant isolation; |
| Antibody | Anti-maize FNR2 (Rabbit polyclonal) | This paper (Okutani et al., 2005) | BAA88237 | IG-TEM (1:200), WB (1:50,000). Raised in rabbit using recombinant mature purified maize FNR2 protein |
| Antibody | Anti-maize Cyt f (Rabbit polyclonal) | This paper (Okutani et al., 2005) | IG-TEM (1:200), WB (1:5000) Raised in rabbit using Cyt f protein purified from maize leaves | |
| Antibody | Anti-maize TROL (guinea pig polyclonal) | This paper | WB (1:10,000) Raised in guinea pig using TROL protein purified as described in the Materials and methods | |
| Recombinant DNA reagent | pCold His-TROL (plasmid) | Takara-Bio; This paper | ACF79627.1 | Cloned as described in the Materials and methods |
| Recombinant DNA reagent | pSAt-FNR1pro-Zm-FNR2 (plasmid) | From Twachtmann et al., 2012 | AT1G20020;BAA88237 | Plasmid for expressing maize FNR2 under control of the Arabidopsis FNR1 promoter |
| Sequence-based reagent | TROL -F | Eurofins genomics (Ebersberg, Germany) | PCR primers | GTCGACGAGGATCGACAAAA |
| Sequence-based reagent | TROL -R | Eurofins genomics (Ebersberg, Germany) | PCR primers | GAATTCCTAGACCCGGTTTCTT |
| Peptide, recombinant protein | Maize TROL | Eurofins genomics (Ebersberg, Germany) | ACF79627.1 | Cloned and purified as described in the Materials and methods |
Additional files
-
Supplementary file 1
Summary of published information about Arabidopsis and maize FNR iso-proteins.
Taken from Hanke et al., 2005, Okutani et al., 2005, Lintala et al., 2009, Lintala et al., 2007, and Twachtmann et al., 2012. Kinetic parameters are for the reverse direction to photosynthesis (NADPH-dependent reduction of Fd).
- https://cdn.elifesciences.org/articles/56088/elife-56088-supp1-v2.docx
-
Supplementary file 2
Additional statistical analysis.
(a) Table of mixed effects model investigating changes in FNR density between different chloroplast sub-compartments in WT Arabidopsis. Analysis of data presented in Figure 1—figure supplement 2. Fixed effects taking either label density in the stroma as the intercept or label density in the margins/lamellae as the intercept. Linear mixed model fit by REML. Signif. codes: 0 ‘***’ 0.001 ‘**’ 0.01 ‘*’ 0.05 ‘.’ 0.1 ‘’ 1. (b) Table of mixed effects model investigating changes in cytochrome f density between different chloroplast sub-compartments in WT Arabidopsis. Analysis of data presented in Figure 1—figure supplement 2. Fixed effects taking either label density in the stroma as the intercept or label density in the margins/lamellae as the intercept. Linear mixed model fit by REML. Signif. codes: 0 ‘***’ 0.001 ‘**’ 0.01 ‘*’ 0.05 ‘.’ 0.1 ‘’ 1. (c) Table of fitting parameters and errors in comparison of light-dependent NADP+ reduction by different genotypes. Analysis performed using the data in Figure 4. Fits were calculated from experiments on individual chloroplast preparations, and then the parameters, and the fitting errors averaged. (d) Table of statistical analysis on the contribution of the fast phase to total amplitude of light-dependent fluorescence change in the chloroplast assay of NADP+ reduction. Analysis performed using the data averaged in Figure 4 and in (c). (e) Table of fitting parameters and errors in comparison of dark NADPH oxidation by different genotypes. Analysis performed using the data in Figure 4. Fits were calculated from experiments on individual chloroplast preparations, and then the parameters, and the fitting errors averaged. (f) Table of Pm values and statistical analysis of plants used for PAM analysis of the high light response. Analysis performed using the data in Figure 5, with example traces given in Figure 5—figure supplement 2. Pm determination of dark adapted leaves in order to calculate PSI parameters in response to high light treatment of Wt, fnr1, and fnr1 plants expressing either ZmFNR1, ZmFNR2, or ZmFNR3 Arabidopsis plants (see Figure 5). n = 5–7 replicates. Signif. codes: 0 ‘***’ 0.001 ‘**’ 0.01 ‘*’ 0.05 ‘.’ 0.1 ‘’ 1.
- https://cdn.elifesciences.org/articles/56088/elife-56088-supp2-v2.docx
-
Transparent reporting form
- https://cdn.elifesciences.org/articles/56088/elife-56088-transrepform-v2.pdf
Download links
A two-part list of links to download the article, or parts of the article, in various formats.
Downloads (link to download the article as PDF)
Open citations (links to open the citations from this article in various online reference manager services)
Cite this article (links to download the citations from this article in formats compatible with various reference manager tools)
Regulation of photosynthetic electron flow on dark to light transition by ferredoxin:NADP(H) oxidoreductase interactions
eLife 10:e56088.
https://doi.org/10.7554/eLife.56088


