Oomycete small RNAs bind to the plant RNA-induced silencing complex for virulence
- Faculty of Biology, Genetics, Biocenter Martinsried, LMU Munich, Germany
- Phytopathology, School of Life Sciences Weihenstephan, Technical University of Munich, Germany
- Department of Cell and Metabolic Biology, Leibniz Institute of Plant Biochemistry, Germany
- Center for Plant Molecular Biology, Interfaculty Institute of Microbiology and Infection Medicine Tübingen, University of Tübingen, Germany
Figures
Figure 1 with 5 supplements
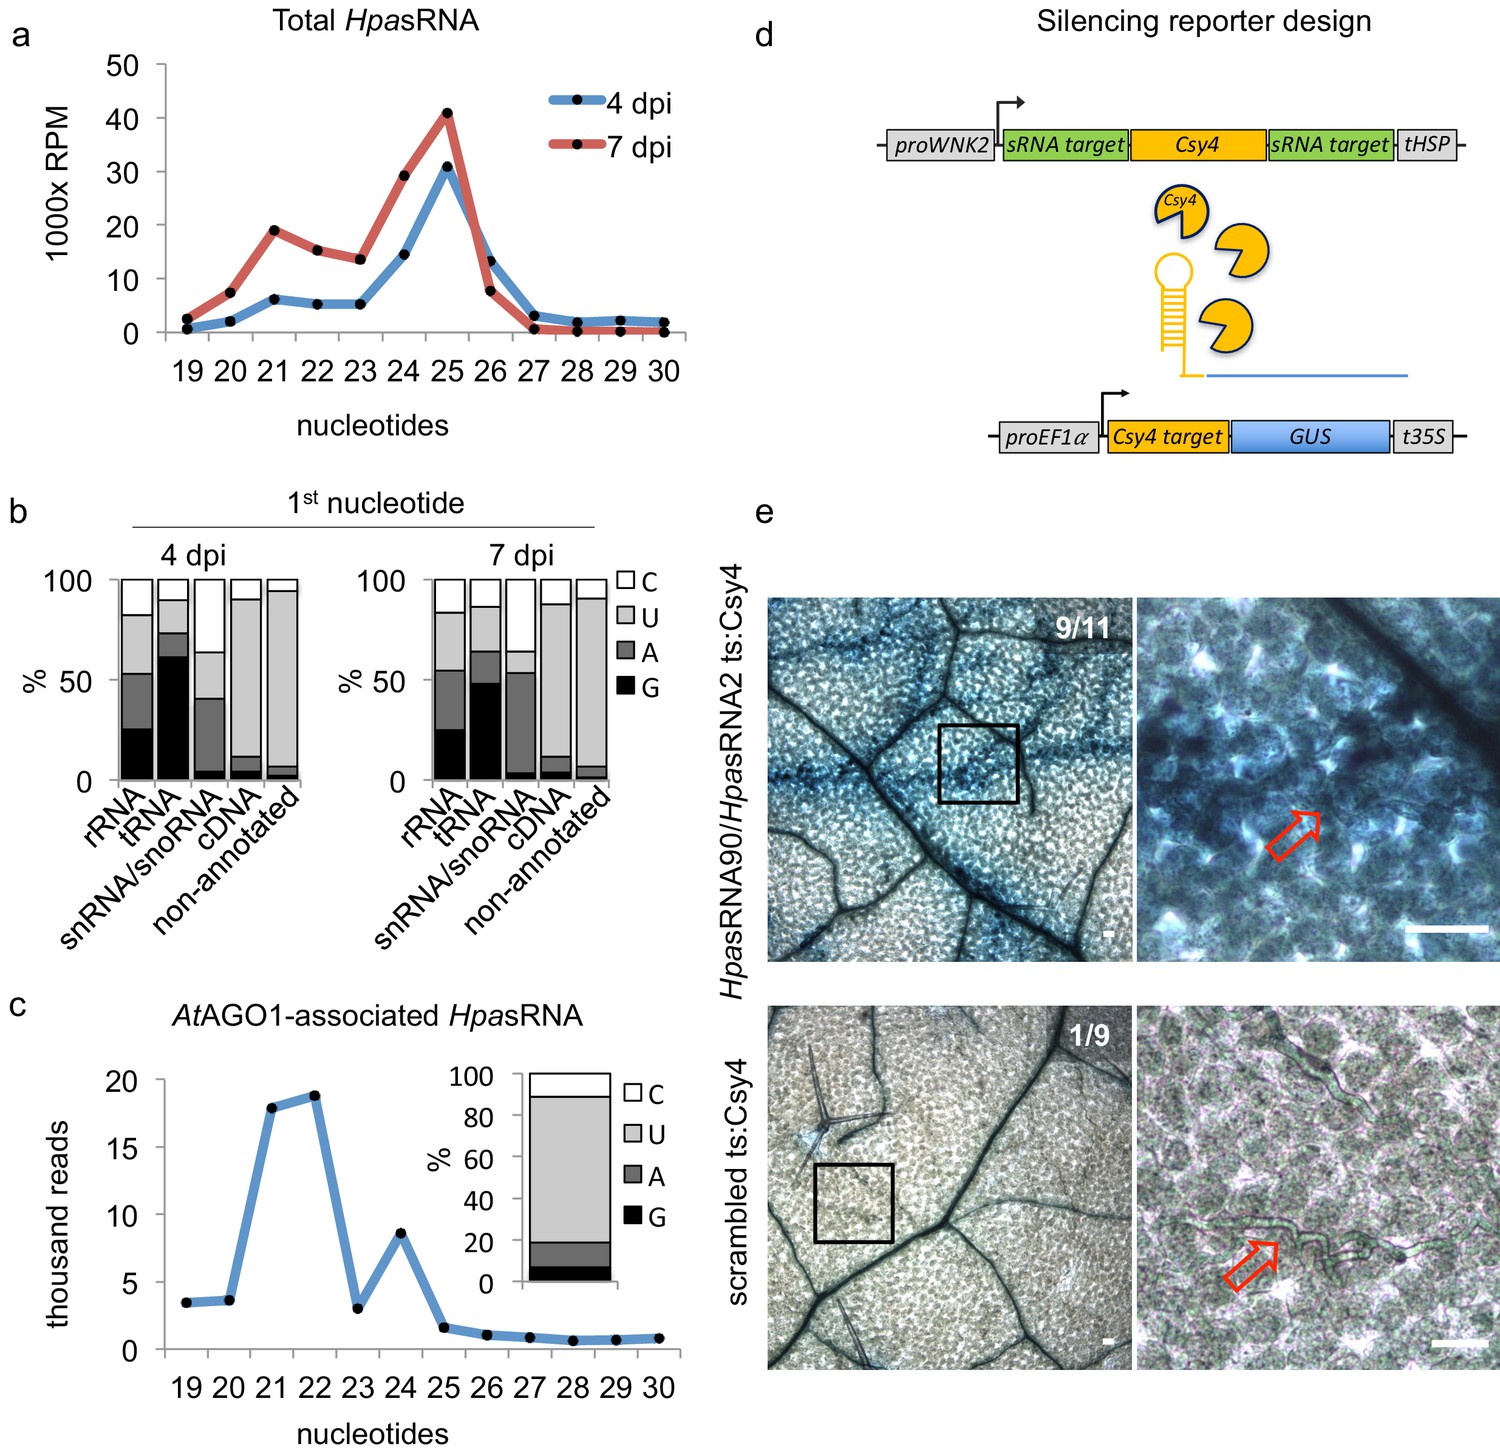
HpasRNAs translocated into the plant AtAGO1 and induced host target silencing in infected plant cells.
(a) Size profile of HpasRNAs revealed two size peaks at 21 nt and 25 nt at 4 and 7 dpi. (b) The frequency of the first nucleotide at 5’ terminal positions of HpasRNAs mapping to cDNAs or non-annotated regions revealed bias towards uracil. (c) Size distribution and first nucleotide analysis of AtAGO1-associated HpasRNAs showed size preference at 21 nt with 5’ terminal uracil. (d) A novel Csy4/GUS reporter construct was assembled to detect HpasRNA-directed gene silencing, reporting GUS activity if HpasRNAs were functional to suppress Csy4 expression sequence-specificly. (e) GUS staining of infected leaves at two magnifications revealed sequence-specific reporter silencing at 4 dpi. Csy4 with HpasRNA2 and HpasRNA90 target sequences (ts) is depicted on the top and with random scrambled ts on the bottom. Red arrows indicate H. arabidopsidis hyphae in the higher magnification images. Scale bars indicate 50 µm. Numbers in the micrographs indicate number of leaves showing GUS activity per total leaves inspected.
Figure 1—figure supplement 1
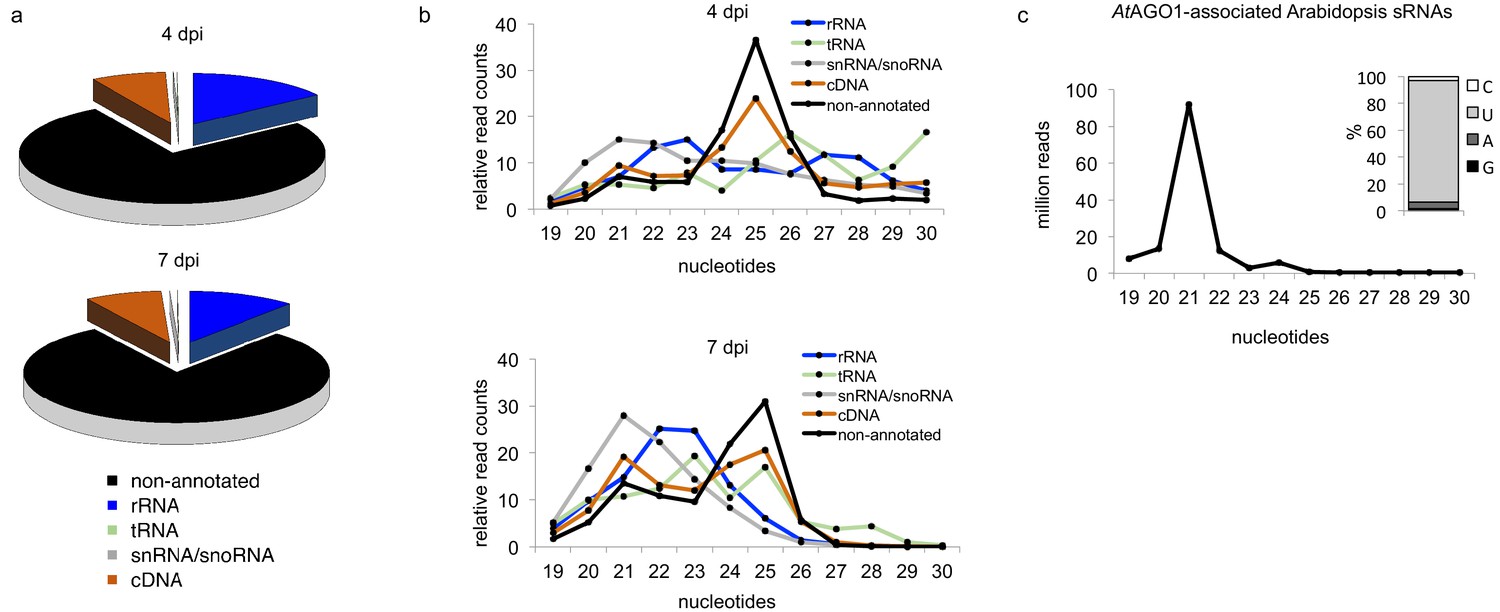
Insights into the small RNAome of H. arabidopsidis and Arabidopsis.
(a) HpasRNAs mapped to distinct coding and to non-coding genomic regions. (b) Relative read counts and size distribution of HpasRNAs mapped to different genomic regions at 4 and 7 dpi. (c) Size distribution and first nucleotide analysis of AtAGO1-associated sRNAs of A. thaliana.
Figure 1—figure supplement 2
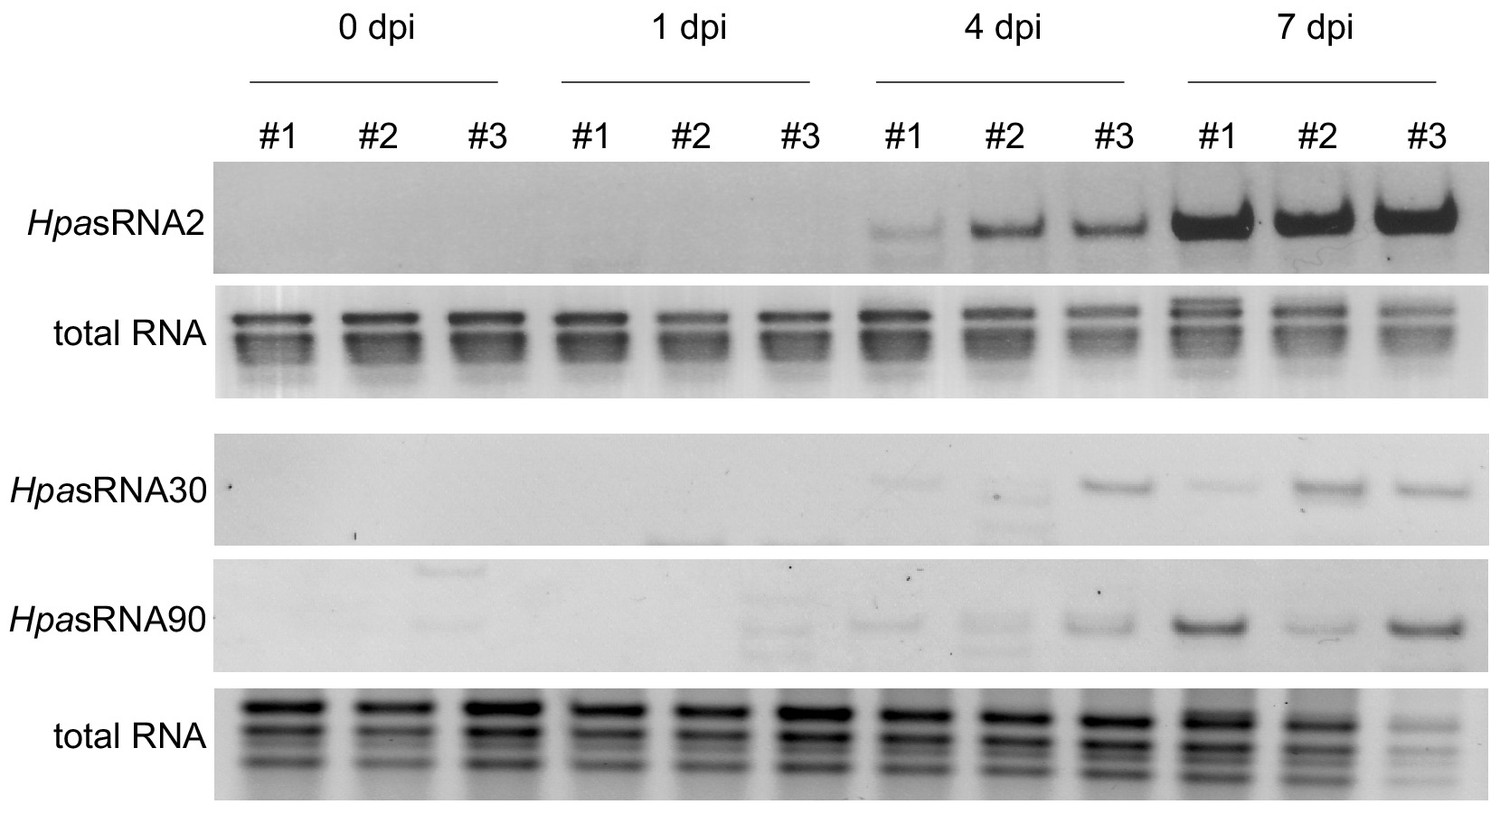
Stem-loop RT-PCR revealed HpasRNA2, HpasRNA30 and HpasRNA90 expression at 4 and 7 dpi in three biological replicates.
Total RNA served as loading control.
Figure 1—figure supplement 3
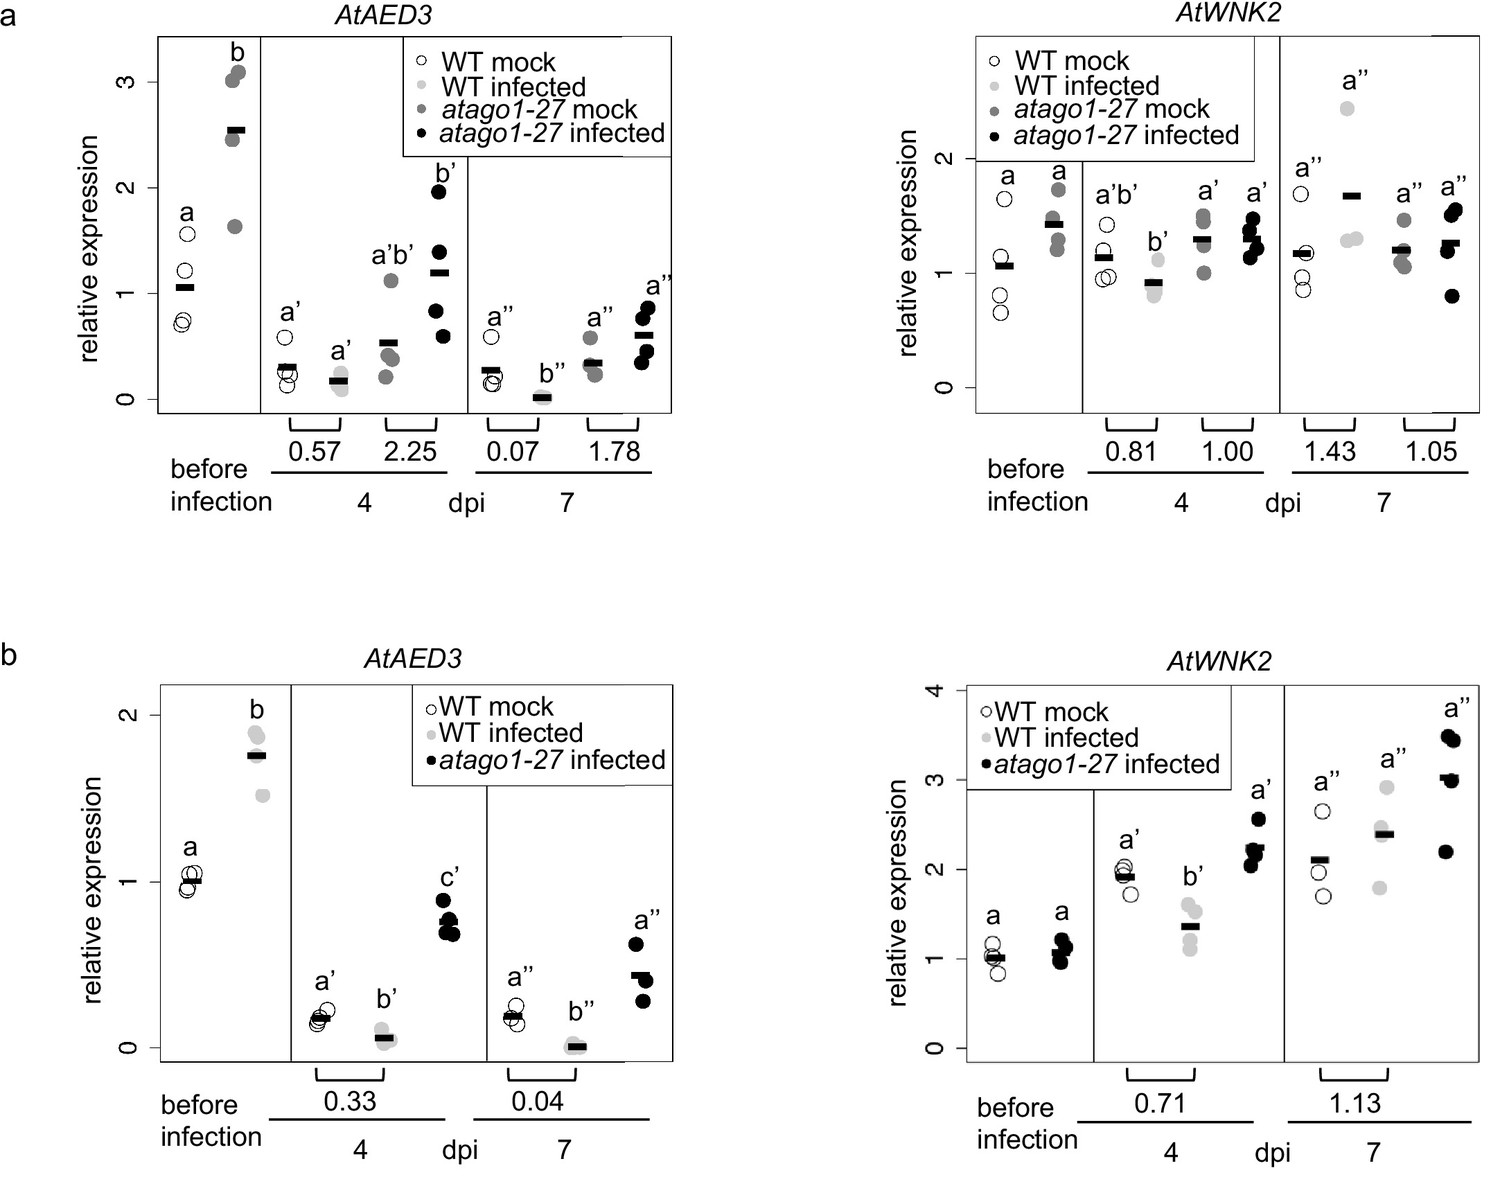
Relative expression of AtAED3 and AtWNK2 was measured in mock-treated or H. arabidopsidis inoculated plants.
arabidopsidis-infected WT and atago1-27 seedlings before and at 4 and 7 dpi by qRT-PCR using AtActin as a reference in two independent infection experiments (a, b). The bars within the graphs represent the average of n ≥ three biological replicates, and letters indicate groups of statistically significant difference within one time point by ANOVA followed by TukeyHSD with p≤0.05. Numbers below the graphs give change-fold factors of H. arabidopsidis-infected versus mock-treated samples.
Figure 1—figure supplement 4
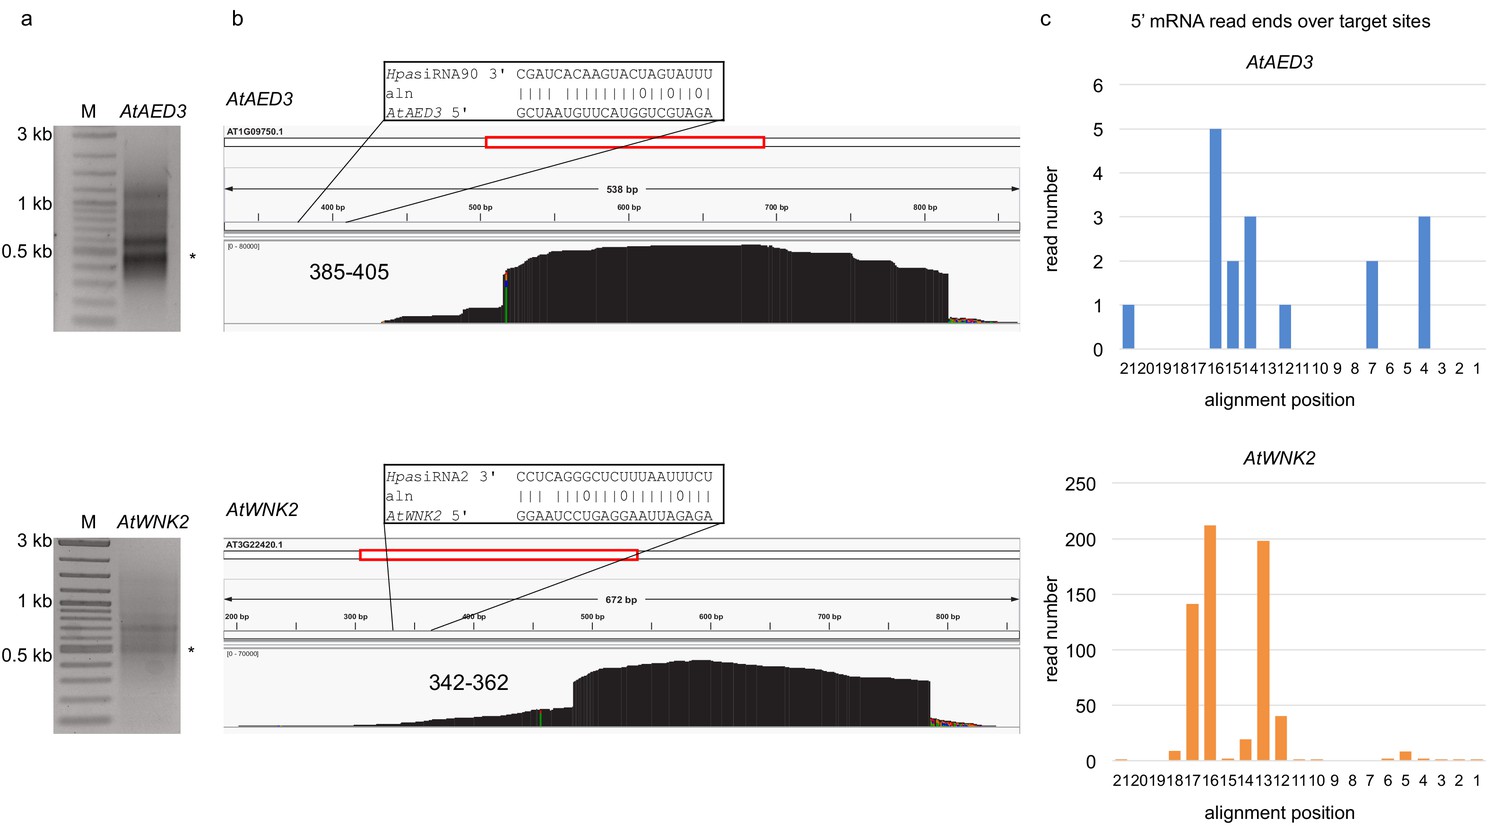
5’ RACE PCR did not provide evidence for pathogen sRNA mediated target cleavage.
(a) Agarose gel images show RACE-PCR bands amplified at the predicted cleavage size of 440 bp for AtAED3 and 530 bp for AtWNK2, marked with asterisks. (b) Mapping schemes of AtWNK2 and AtAED3 mRNA reads indicated the ends of RACE-PCR fragments corresponding to a as revealed by next generation sequencing. (c) Numbers of 5’ end position of AtWNK2 and AtAED3 mRNAs at the predicted HpasRNA2 or HpasRNA90 target sites.
Figure 1—figure supplement 5
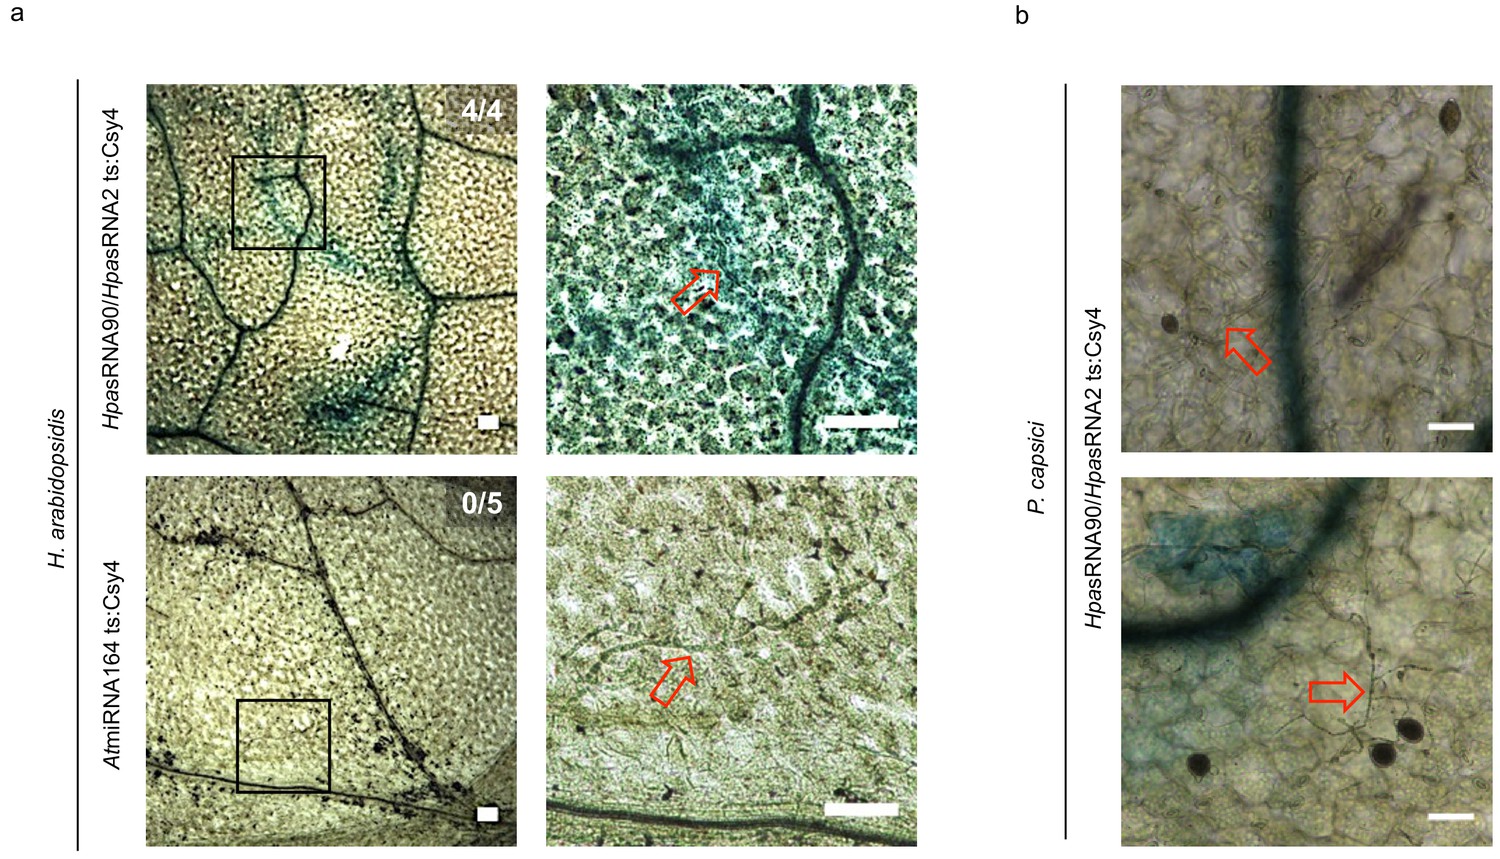
The reporter was neither activated by an endogenous miRNA target site nor by a distinct pathogen.
(a) Csy4 repressor reporter with HpasRNA2 and HpasRNA90 target sequence (ts) is depicted on the top and with AtmiRNA164 ts of the AtCUC2 target gene on the bottom. GUS staining of infected leaves at two magnifications revealed sequence-specific reporter silencing at 4 dpi in HpasRNA2/HpasRNA90 ts construct but not in AtmiRNA164 ts. (b) The Csy4 reporter was not activated by the oomycete pathogen Phytophthora capsici. At 2 dpi, P. capsici formed a dense hyphal network, but no pathogen-associated GUS activity was observed (upper panel). In two of the five inspected leaf discs GUS activity was detected in cell clusters, but these were independent of pathogen presence (lower panel). The numbers indicate leaves with GUS activity per total inspected leaves in this experiment. Red arrows indicate H. arabidopsidis or P. capsici hyphae. Scale bars indicate 50 µm.
Figure 2 with 6 supplements
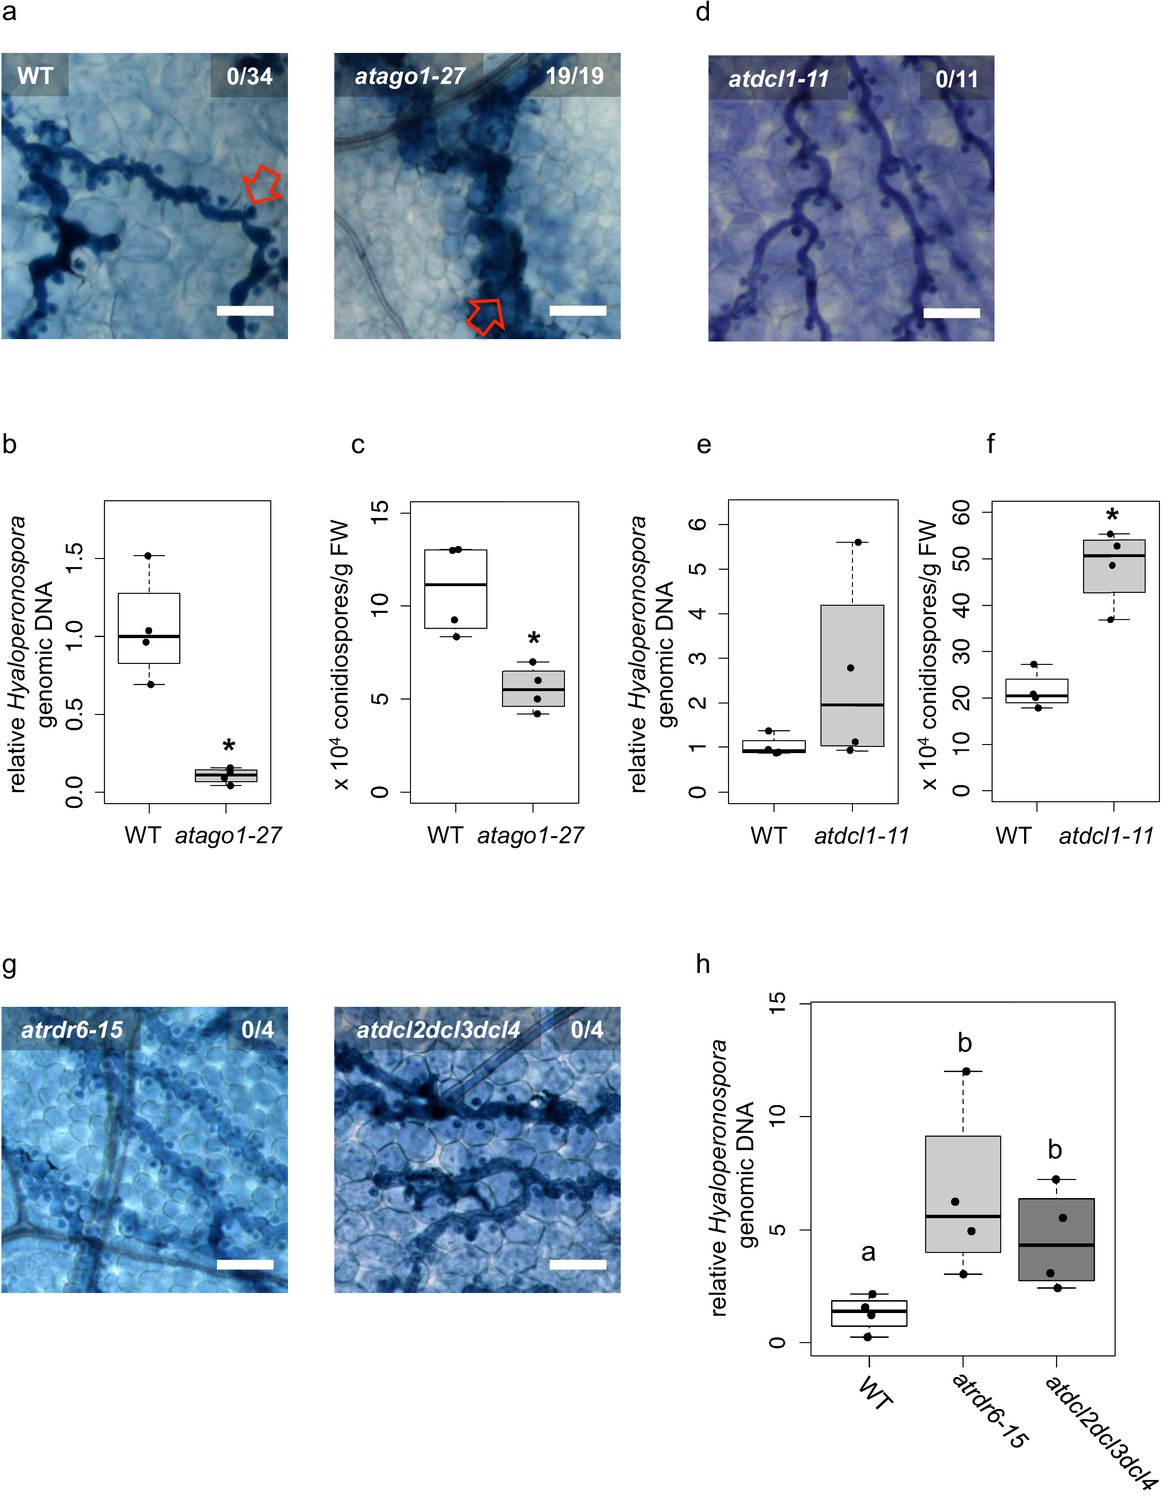
Arabidopsis atago1 exhibited enhanced disease resistance against H. arabidopsidis.
(a) Trypan Blue-stained microscopy images showed trailing necrosis around hyphae in atago1-27, but no necrosis on WT seedling leaves at 7 dpi. Red arrow in WT marks H. arabidopsidis haustorium, red arrow in atago1-27 indicates trailing necrosis. (b) H. arabidopsidis genomic DNA was quantified in atago1-27 and WT plants by qPCR at 4 dpi relative to plant genomic DNA represented by n ≥ four biological replicates. (c) Numbers of conidiospores per gram leaf fresh weight (FW) in atago1-27 and WT plants at 7 dpi are represented by four biological replicates. (d) Trypan Blue-stained microscopy images of atdcl1-11 did not show any trailing necrosis at 7 dpi. (e) H. arabidopsidis genomic DNA in atdcl1-11 and WT plants at 4 dpi were in tendency enhanced with n ≥ four biological replicates. (f) Number of conidiospores per gram leaf fresh weight (FW) in atdcl1-11 at 7 dpi was significantly elevated compared to WT plants. (g) Trypan Blue-stained microscopy images of atrdr6-15 and atdcl2dcl3dcl4 showed no plant cell necrosis after inoculation with H. arabidopsidis at 7 dpi. (h) H. arabidopsidis genomic DNA content in leaves was elevated in atrdr6-15 and atdcl2dcl3dcl4 compared to WT at 4 dpi with n ≥ four biological replicates. Asterisk indicates statistically significant difference by one tailed Student’s t-test with p≤0.05. Letters indicate groups of statistically significant difference by ANOVA followed by TukeyHSD with p≤0.05. Scale bars in all microscopy images indicate 50 µm and numbers in the micrographs represent observed leaves with necrosis per total inspected leaves.
Figure 2—figure supplement 1
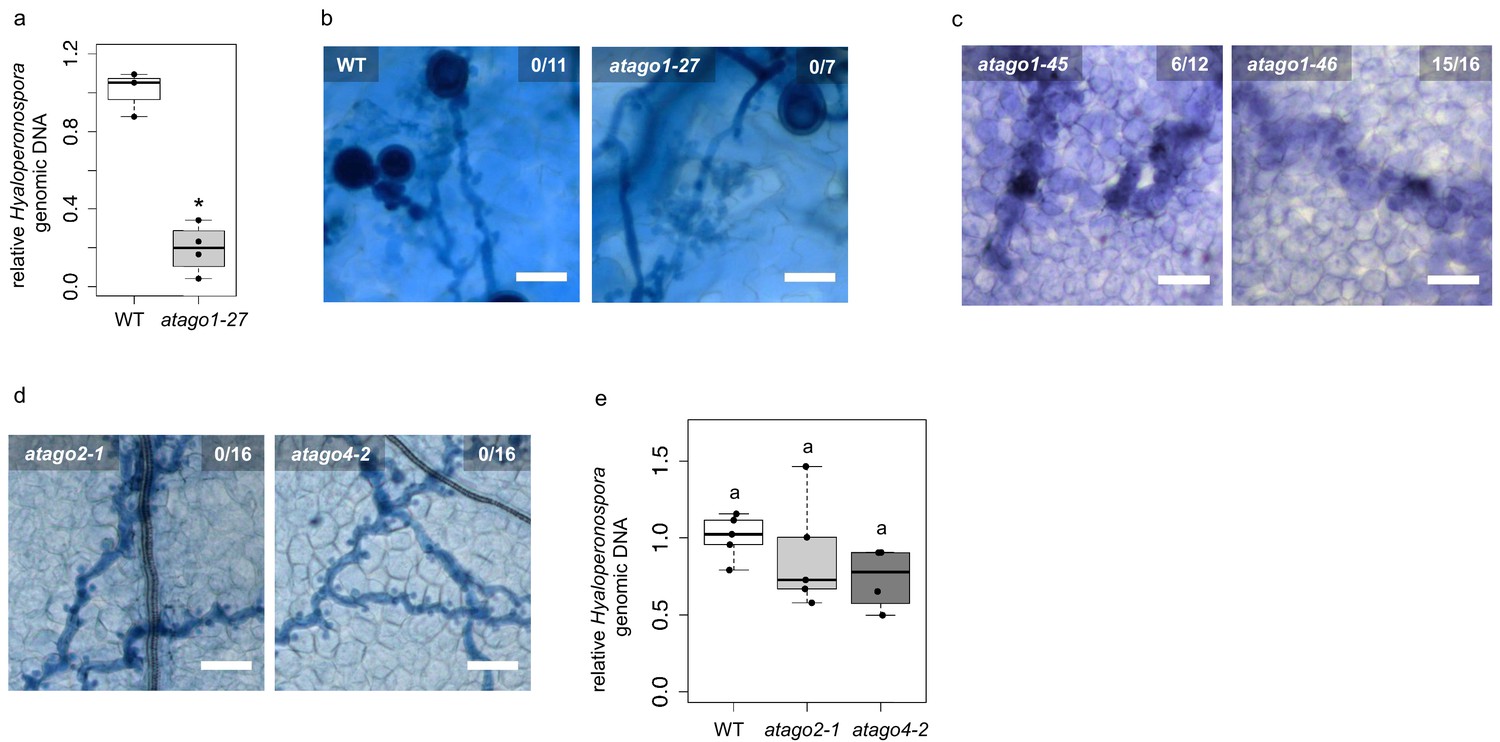
Enhanced resistance against infection was restricted to atago1 mutants.
(a) H. arabidopsidis genomic DNA content in cotyledons was lower in atago1-27 compared to WT, as measured by qPCR relative to plant genomic DNA at 4 dpi with n ≥ three biological replicates. (b) Trypan Blue-stained microscopy images of atago1-27 cotyledons did not show any necrosis at 7 dpi. (c) Trypan Blue-stained microscopy images of atago1-45 and atago1-46 revealed trailing necrosis at 7 dpi with H. arabidopsidis. (d) Trypan Blue-stained microscopy images presenting H. arabidopsidis-infected atago2-1 and atago4-2 seeding leaves at 7 dpi. (e) H. arabidopsidis genomic DNA was quantified in WT versus atago2-1 and atago4-2 by qPCR at 4 dpi relative to plant genomic DNA represented by n ≥ four biological replicates. Numbers in the micrographs represent observed leaves with necrosis per total inspected leaves. Asterisk indicates significant difference by one tailed Student’s t-test with p≤0.05. Letters indicate groups of statistically significant difference by ANOVA followed by TukeyHSD with p≤0.05.
Figure 2—figure supplement 2

Stem-loop RT-PCR of HpasRNAs from AtAGO1-IP or AtAGO2-IP of mock-treated or H. arabidopsidis infected leaf tissue.
arabidopsidis-inoculated seedlings. AtmiRNA164 and AtmiRNA393* were used as positive AtAGO-IP controls. Pull-down of AtAGO1 was achieved with WT plants using an AtAGO1 native antibody, and AtAGO2 with HA-epitope tagged AtAGO2-expressing A. thaliana Col-0 using anti-HA antibody with the lower panel showing Western blot analysis.
Figure 2—figure supplement 3
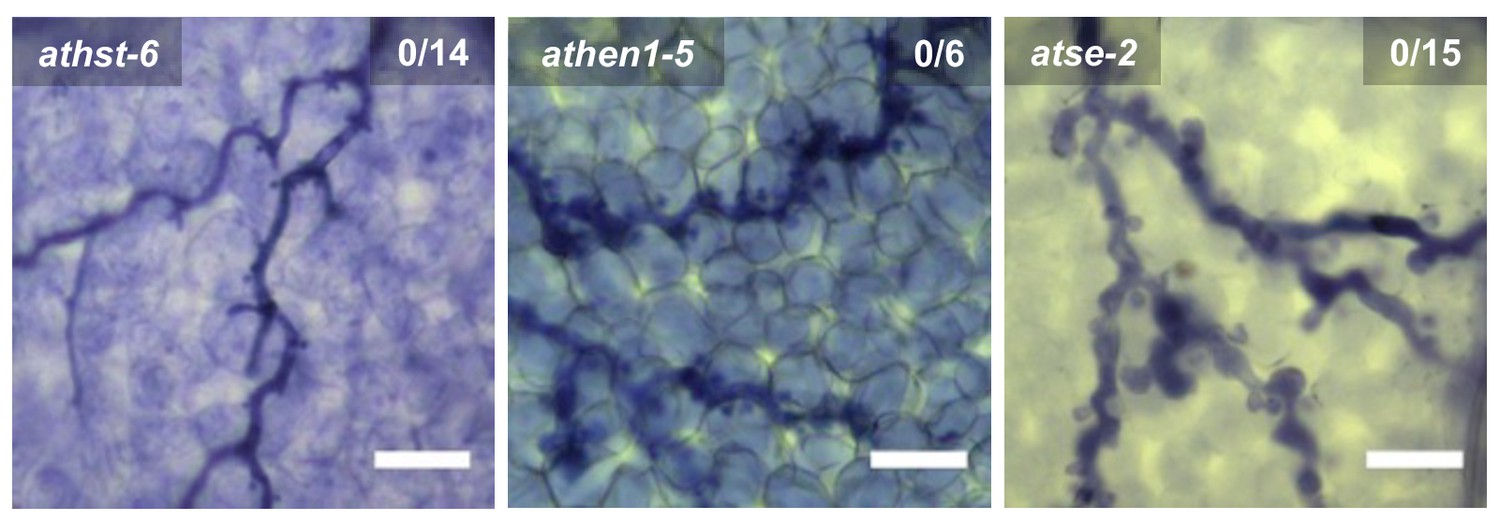
Trypan Blue-stained microscopy images presenting the AtmiRNA biogenesis mutants athst-6, athen1-5 and atse-2 did not show any trailing necrosis at 7 dpi.
Scale bars in microscopy images indicate 50 µm and numbers in the micrographs represent observed leaves with necrosis per total inspected leaves.
Figure 2—figure supplement 4
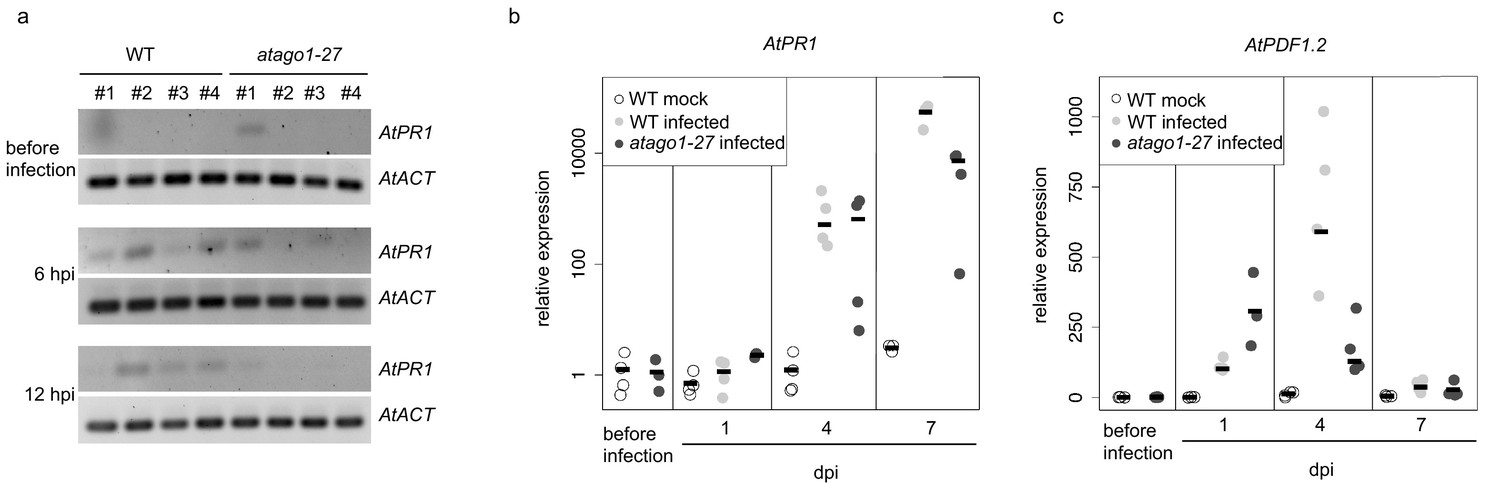
Common defence-related marker gene induction was not enhanced in atago1-27 mutants.
(a) Expression analysis of AtPR1 by RT-PCR in WT and atago1-27 did not show obvious differences at 6 and 12 h post inoculation with H. arabidopsidis. AtActin was used as reference gene with four biological replicates. (b and c) Relative expression of AtPR1 and AtPDF1.2 determined by qRT-PCR using AtActin as reference. The bar represents the average of n ≥ three biological replicates, each comprising two technical replicates.
Figure 2—figure supplement 5
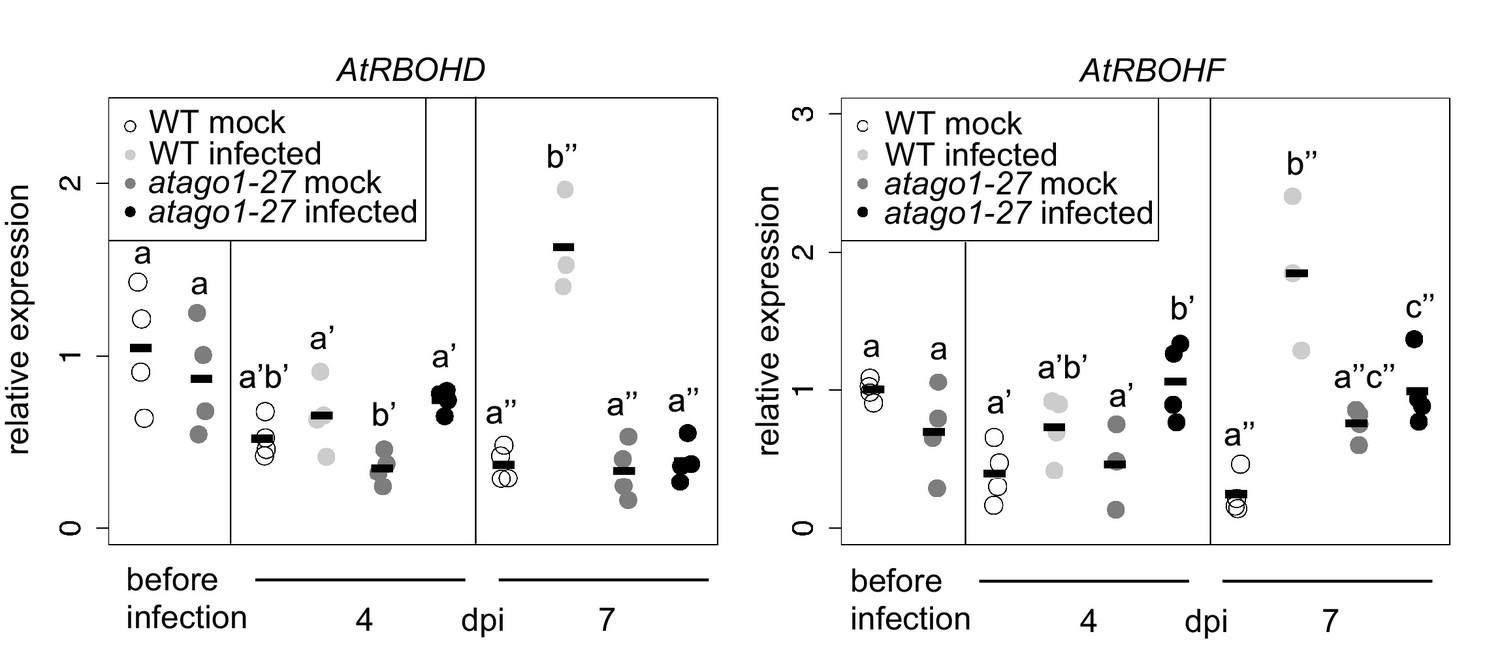
Relative mRNA expression of AtRBOHD and AtRBOHF determined by qRT-PCR using AtActin as reference in WT and atago1-27 in H. arabidopsidis and mock treated plants.
The bars represent the average of n ≥ three biological replicates, each comprising two technical replicates. Letters indicate groups of statistically significant difference within one time point by ANOVA followed by TukeyHSD with p≤0.05.
Figure 2—figure supplement 6
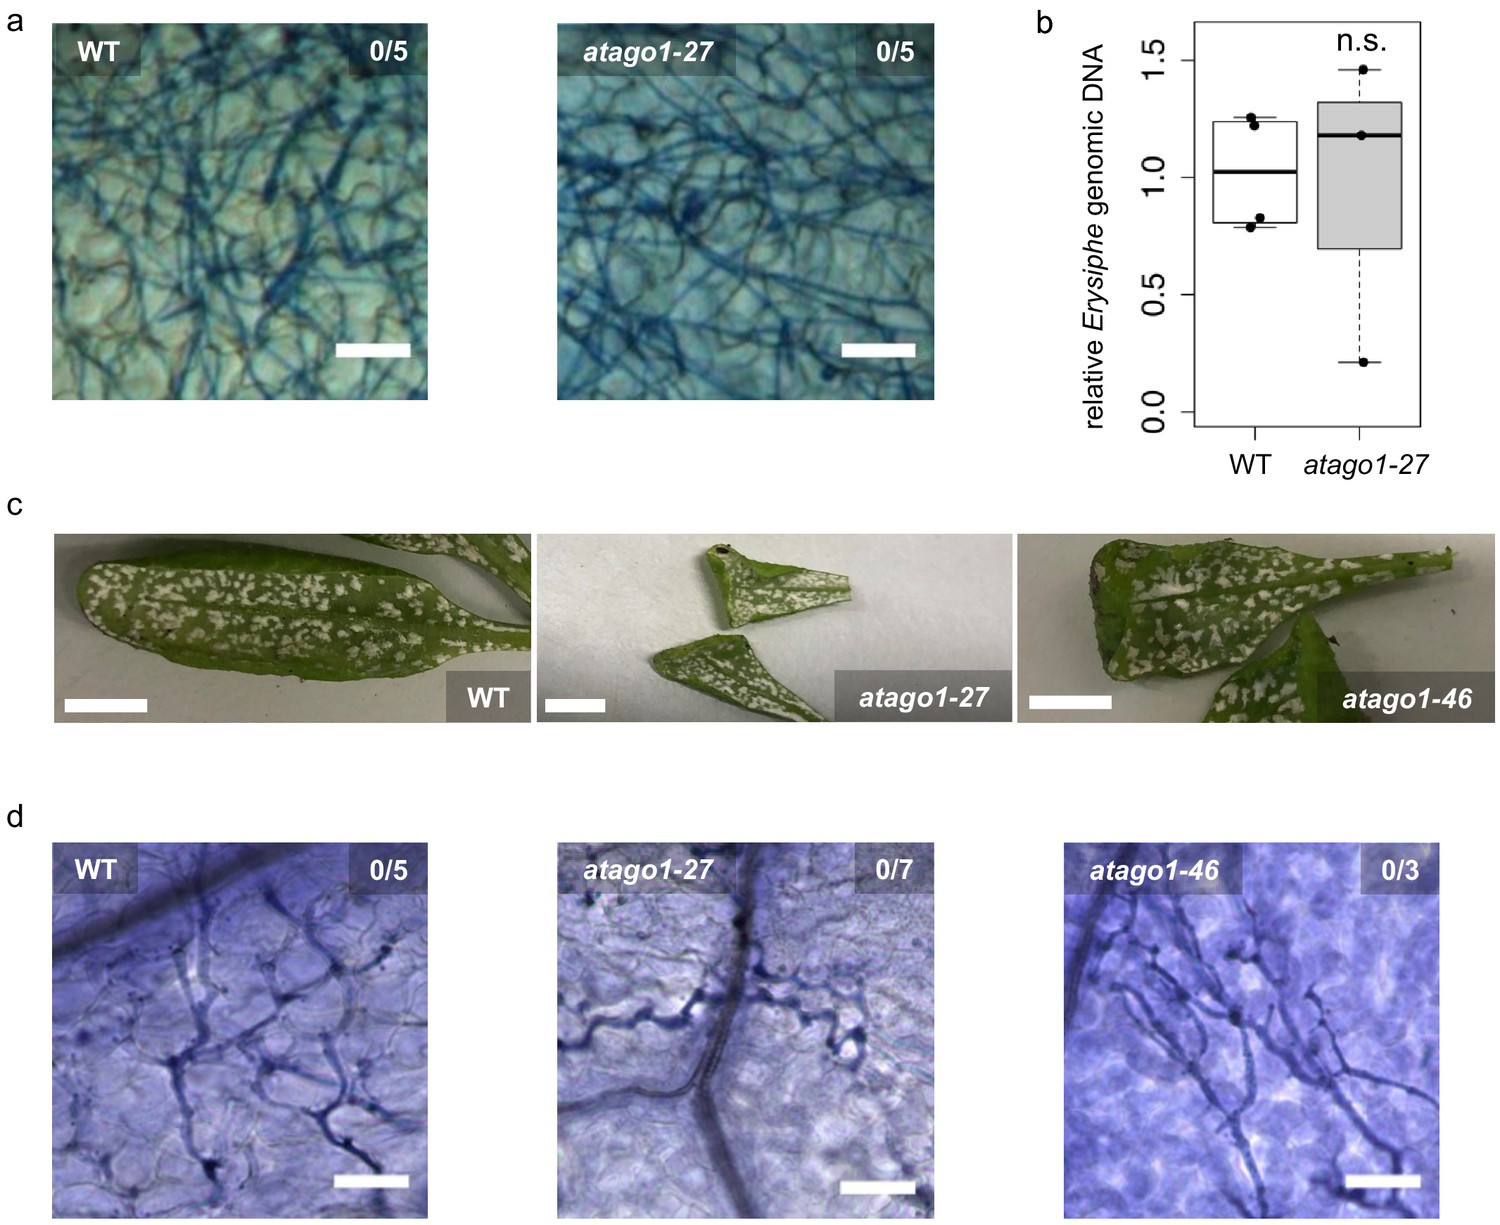
Susceptibility of atago1 mutants to infection with the biotrophic fungus E. cruciferarum and the oomycete A. laibachii remained unaltered.
(a) Trypan Blue-stained microscopy images of WT or atago1-27 leaves infected with Erysiphe cruciferarum did not show necrosis at 8 dpi. Scale bars in microscopy images indicate 50 µm and numbers represent observed leaves with necrosis per total inspected leaves. (b) E. cruciferarum genomic DNA content in WT and atago1-27 was not significantly different at 4 dpi relative to plant genomic DNA as measured by qPCR in n ≥ three biological replicates. (c) Macroscopic infection phenotype of the white rust Albugo laibachii remained unaltered in atago1-27 and atago1-46 mutants at 3 weeks post inoculation. (d) Trypan Blue-stained microscopy images of WT, atago1-27 or atago1-46 leaves infected with A. laibachii did not show necrosis at 7 dpi. Scale bars in microscopy images indicate 50 µm and numbers represent observed leaves with necrosis per total inspected leaves. Scale bars in the total leaf pictures indicate 50 mm. Significance was determined by one tailed Student’s t-test with p≤0.05.
Figure 3 with 1 supplement
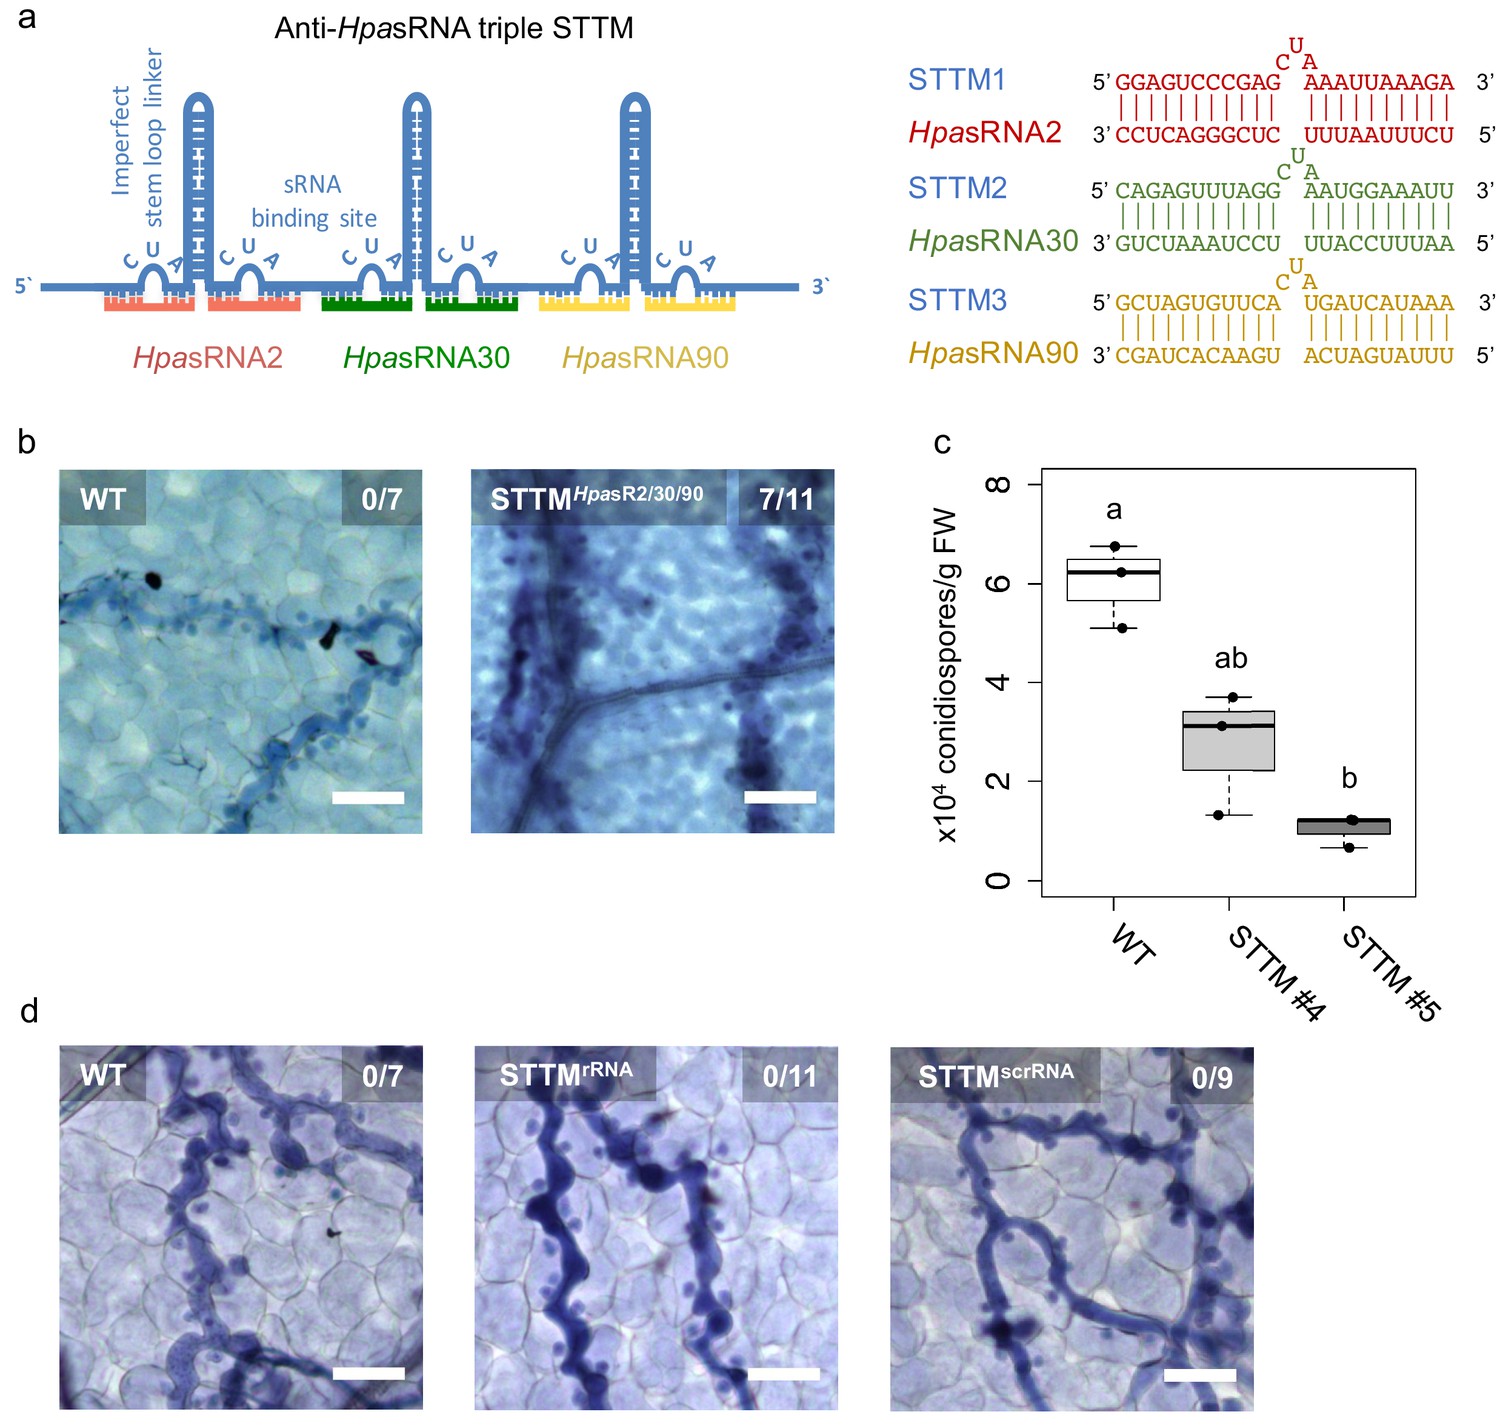
Translocated HpasRNAs were crucial for virulence.
(a) A triple STTM construct was designed to target the three HpasRNAs HpasRNA2, HpasRNA30 and HpasRNA90 in Arabidopsis. (b) A. thaliana T1 plants expressing the triple STTM to scavenge HpasRNA2, HpasRNA30 and HpasRNA90 exhibited trailing necrosis at 7 dpi. (c) Number of conidiospores per gram FW was significantly reduced in two independent STTM-expressing Arabidopsis T2 lines (#4, #5) compared to WT. (d) Transgenic Arabidopsis plants in T1 expressing a STTM complementary to a rRNA-derived HpasRNA (STTMrRNA) or to a random scrambled (STTMscrRNA) sequence did not exhibit trailing necrosis at 7 dpi. The scale bars indicate 50 µm and numbers represent observed leaves with necrosis per total inspected leaves.
Figure 3—figure supplement 1
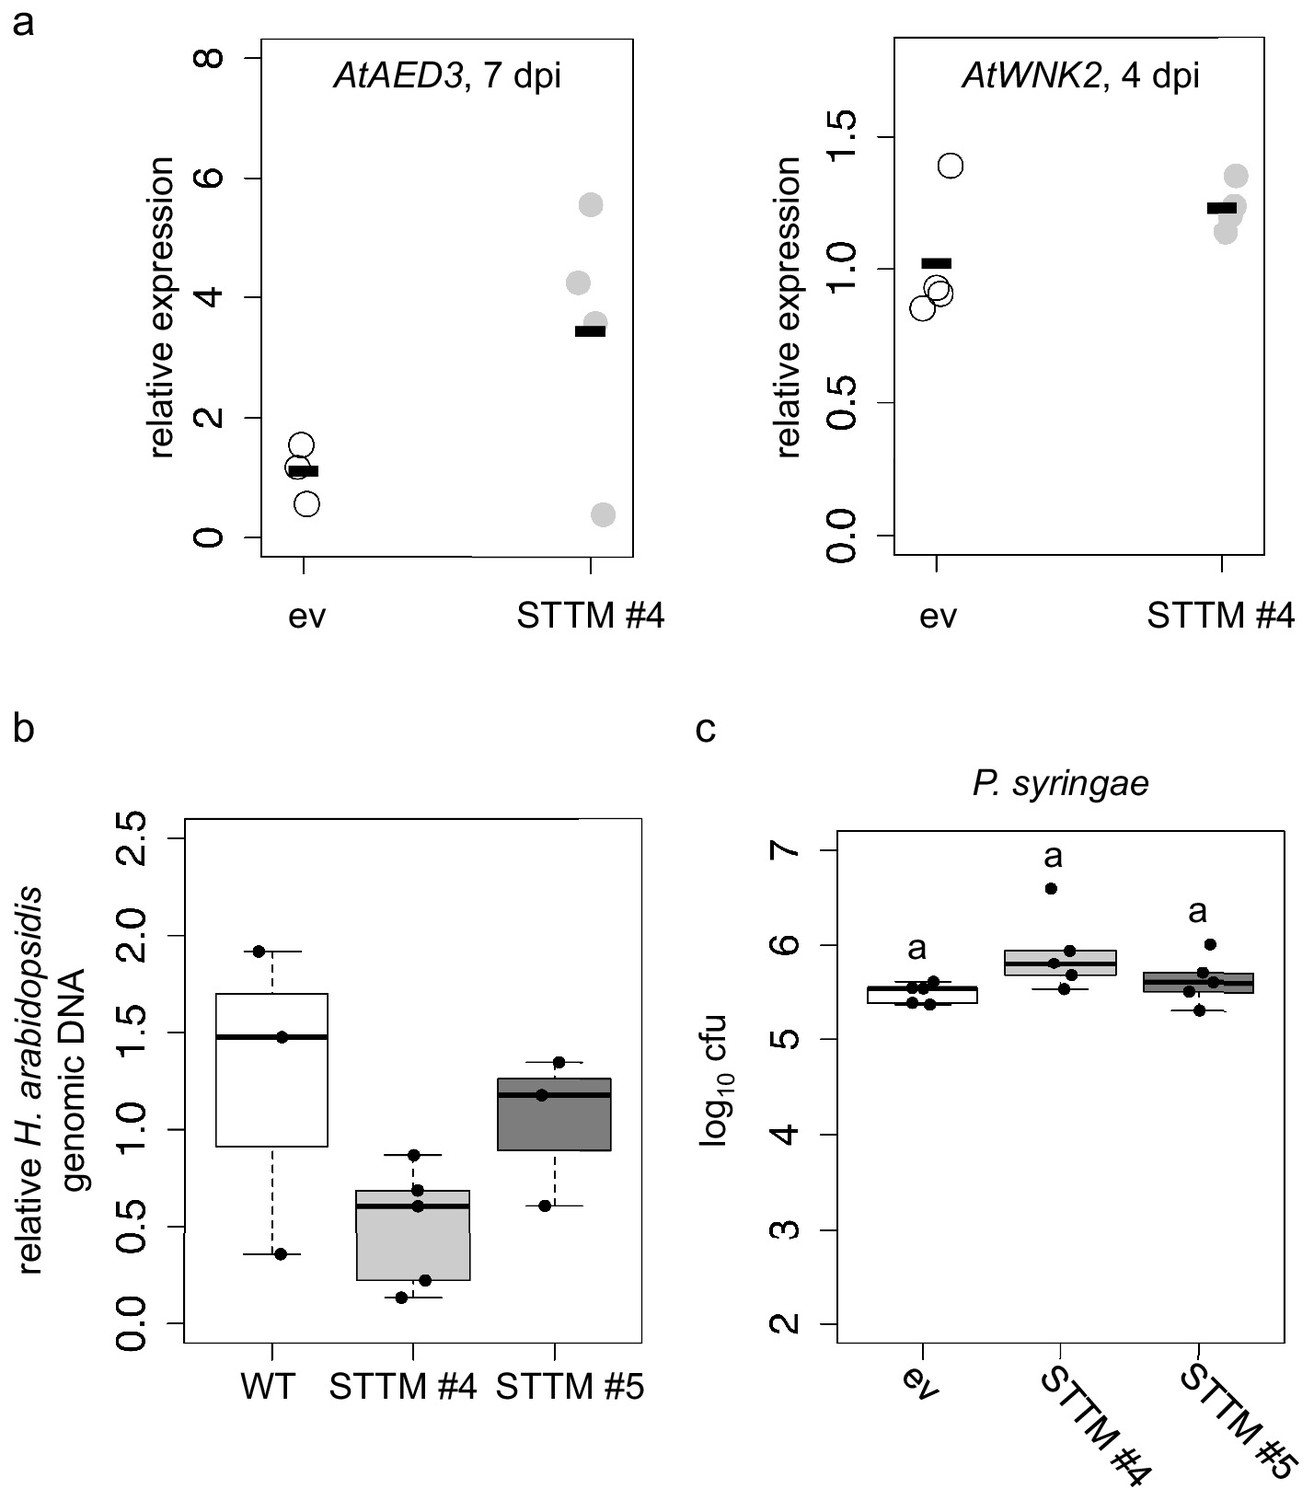
STTM plants revealed higher expression of target genes and lower H. arabidopsidis abundance.
(a) Relative expression of AtAED3 at 7 dpi and AtWNK2 at 4 dpi was determined for STTM or empty vector (ev) expressing plants upon H. arabidopsidis inoculation at 7 and 4 dpi, respectively, by qRT-PCR. One biological replicate represented three leaves, the bars represent the average of n ≥ three biological replicates. The differences of the average were not statistically significant as determined by Student’s t-test. (b) H. arabidopsidis genomic DNA content in leaves was increased in STTM #4 and STTM #5 plants compared to empty vector (ev) expressing WT plants at 4 dpi with n ≥ three biological replicates. The differences were not statistically significant as determined by ANOVA followed by TukeyHSD. (c) STTM-expressing Arabidopsis plants did not exhibit increased resistance against bacterial infection. The bacterial growth was determined by counting colony-forming units (cfu) at 3 days post inoculation. One biological replicate represents bacteria from three leaf discs. Letters in c) indicate significant difference (p≤0.05) according to one site ANOVA followed by TukeyHSD including three biological replicates.
Figure 4 with 6 supplements
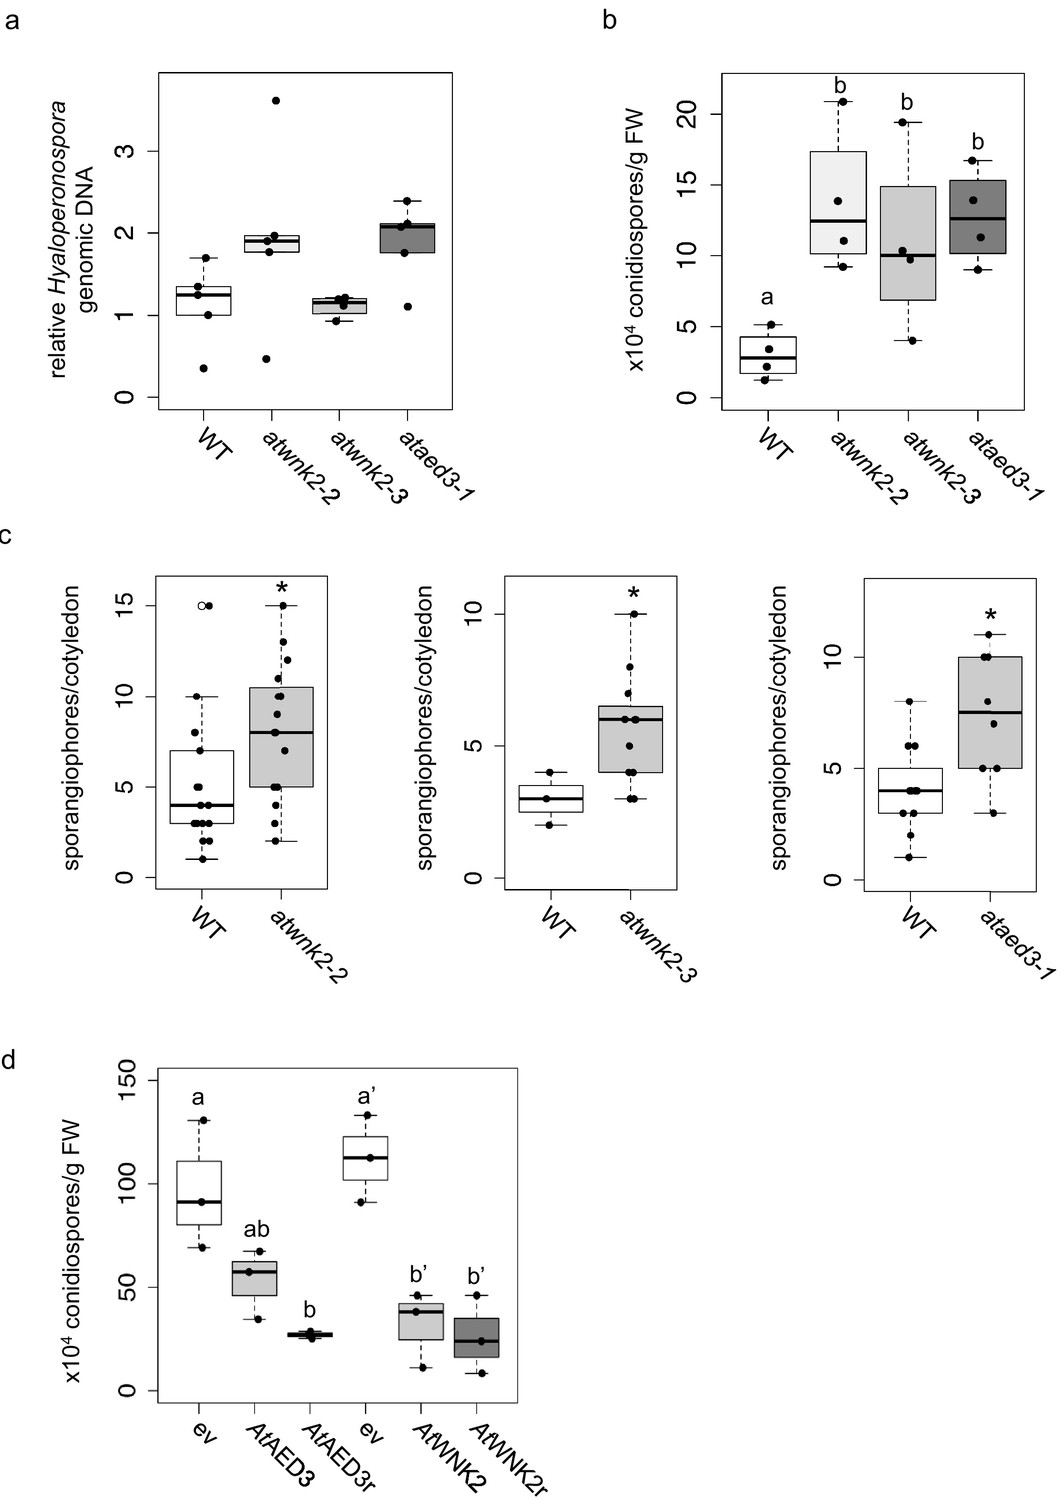
Arabidopsis target genes of HpasRNAs contributed to plant defence.
(a) H. arabidopsidis genomic DNA content in leaves was slightly but not significantly enhanced in atwnk2-2 and ataed3-1 compared to WT, but not in atwnk2-3, at 4 dpi with n ≥ four biological replicates. (b) T-DNA insertion lines of HpasRNA target genes ataed3-1, atwnk2-2, and atwnk2-3 showed significantly higher number of sporangiophores per cotyledon upon infection compared to WT at 5 dpi. (c) ataed3-1, atwnk2-2, and atwnk2-3 showed significantly higher numbers of conidiospores per gram leaf FW upon infection compared to WT at 5 dpi. (d) Number of conidiospores was significantly reduced in gene-complemented mutant lines using the corresponding native promoters proAtEWNK2 or proAtAED3 with native gene sequence, AtAED3 and AtWNK2, or with target site resistant versions, AtAED3r and AtWNK2r compared to the knockout mutant background expressing an empty vector (ev), respectively. Asterisks indicate significant difference by one tailed Student’s t-test with p≤0.05. Letters indicate significant difference by one-site ANOVA test.
Figure 4—figure supplement 1
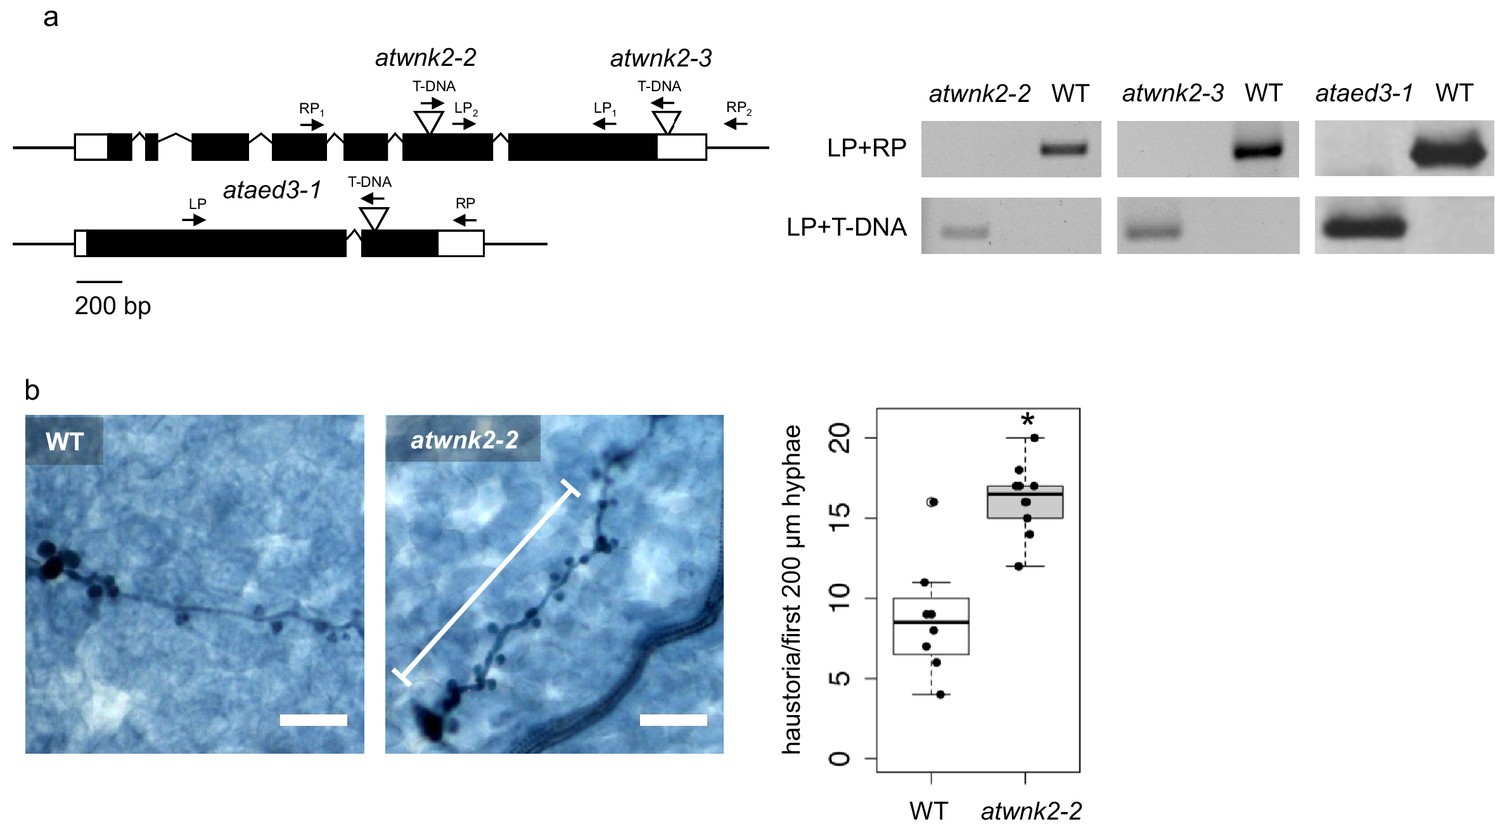
Further details on sRNA target gene mutants.
(a) Gene models of AtWNK2 and AtAED3. The insertion site of the T-DNA is marked by the triangles and the genotyping primer binding sites are shown with arrows. T-DNA insertion of HpasRNA target gene mutant lines atwnk2-2, atwnk2-3 and ataed3-1 were verified by genomic DNA PCR. (b) Trypan Blue-stained microscopy images revealed a higher number of haustoria in the first 200 µm of hyphae (indicated by white bar alongside the hyphae) from the spore germination site in atwnk2-2 compared to WT with n ≥ eight leaves. Asterisk indicates significant difference by one tailed Student’s t-test with p≤0.05. Similar results were obtained in two independent experiments.
Figure 4—figure supplement 2

Target sequence-resistant versions of AtAED3 (AtAED3r) and AtWNK2 (AtWNK2r) were created by introducing synonymous nucleotide substitutions indicated by red letters.
Figure 4—figure supplement 3

Transgenic A. thaliana atwnk2-2 was complemented with proWNK2:WNK2 or proWNK2:WNK2r that resulted in a WT-like flowering time point, while empty vector (ev) exhibited early flowing phenotype, as reported for atwnk2-2 (Wang et al., 2008).
Figure 4—figure supplement 4

A. thaliana plants overexpressing proLjUBI1:AtWNK2r in the atwnk2-2 background revealed local necrosis without pathogen infection (a) and aberrant hyphae and haustoria swellings (b).
Scale bars in microscopy images indicate 50 µm and the numbers represent observed leaves with necrosis or swellings respectively per total inspected leaves.
Figure 4—figure supplement 5

Sequence diversity of HpasRNAs and their predicted Arabidopsis target mRNAs.
(a) HpasRNAs were conserved among the three H. arabidopsidis isolates, Noco2, Cala2, Emoy2. (b) Sequence variations were found in the predicted Arabidopsis mRNAs analysing 1135 A. thaliana accessions. Three categories (colour coded) were considered to possibly prevent target silencing: indels causing bulges that block the HpasRNA/AtmRNA base pairing (red), SNPs at the position 10/11 interfering with RISC-mediated cleavage (orange), and SNPs in the HpasRNA seed region (account to RNA nucleotide positions from 2 to 12) loosing HpasRNA/AtmRNA base pairing (green).
Figure 4—figure supplement 6
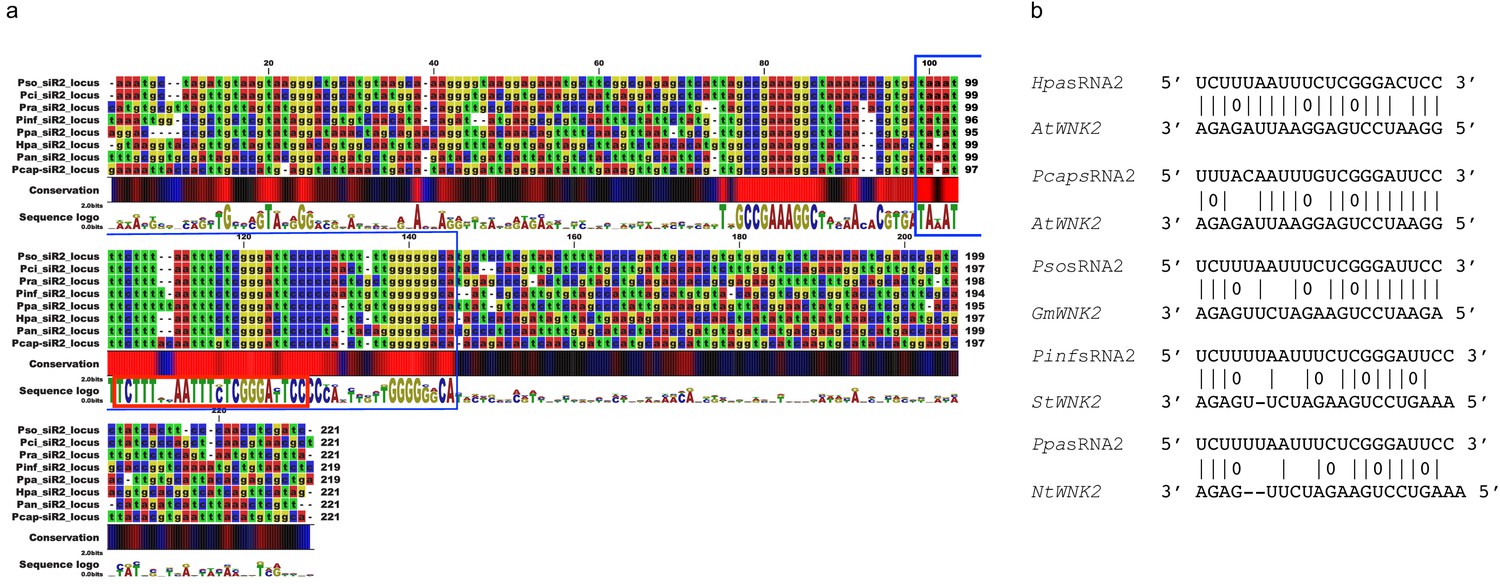
The pathogen sRNA2 and its target are conserved across different plant pathogenic oomycetes and hosts.
(a) Oomycete SRNA2 genomic loci are conserved among different plant pathogenic oomycete species of the genera Hyaloperonospora, Phytophthora, and Pythium (Hpa = Hyaloperonospora arabidopsidis, Pcap = Phytophthora capsici, Pso = Phytophthora sojae, Pan = Pythium aphanidermatum, Pinf = Phytophthora infestans, Ppa = Phytophthora parasitica). Blue box at the consensus sequence indicates the region of sRNA transcription as identified by sRNA-seq analysis and red box marks the consensus of the mature 21 nt HpasRNA2 region. (b) Target prediction alignment of sRNA2 homologs from different oomycete species with the target sequences of homolog WNK2s from respective host plant species (At = Arabidopsis thaliana, Gm = Glycine max, St = Solanum tuberosum, Nt = Nicotiana tabacum).
Author response image 1
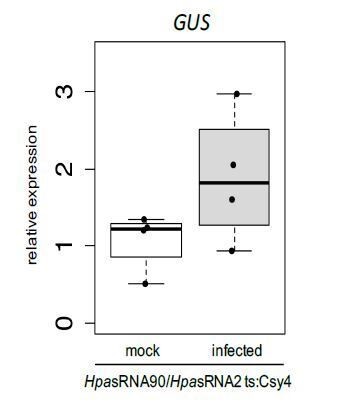
Relative GUS mRNA levels in cross-kingdom RNAi reporter plants upon water treatment or H. arabidopsidis inoculation at 5 dpi.
AtActin was used as a reference gene. Expression was measured in four independent biological replicates.
Author response image 2

Arabidopsis wild type, atago1-27 and atago1-45 plants were stained with Propidium Iodide at 7 dpi with H. arabidopsidis.
Fluorescence signals were detected with a rhodamine filter set and are shown in yellow. A minimum of 5 leaves was inspected per genotype with comparable results.
Author response image 3
AtmiR164 reporter plants revealed GUS activation at leaf teeth and in mature leaves.
a) Plants expressing AtmiR164 target site (ts) reporter displayed GUS activation at the serrated leaf tips and at the leaf tooth. In rare cases (two over all three round of experimental replication), also patchy GUS activity was observed, which was unlinked to pathogen presence. b) In mature plants, GUS activity was visible throughout the leaf in AtmiR164ts reporter plants, here shown with infecting P. capsici. However, GUS activity was independent of the pathogen presence. Scale bars represent 50 μm.
Author response image 4

Alignment of the WNK2 orthologs from four distinct plant species, Solanum lycopersicum, Nicotiana benthamiana, Glycine max and Arabidopsis thaliana.
a) N-terminal section, b) full-length gene alignment indicating different levels of nucleotide sequence conservation with black (low) to red (high) sequence identity. The red arrow indicates the siR2 target site.
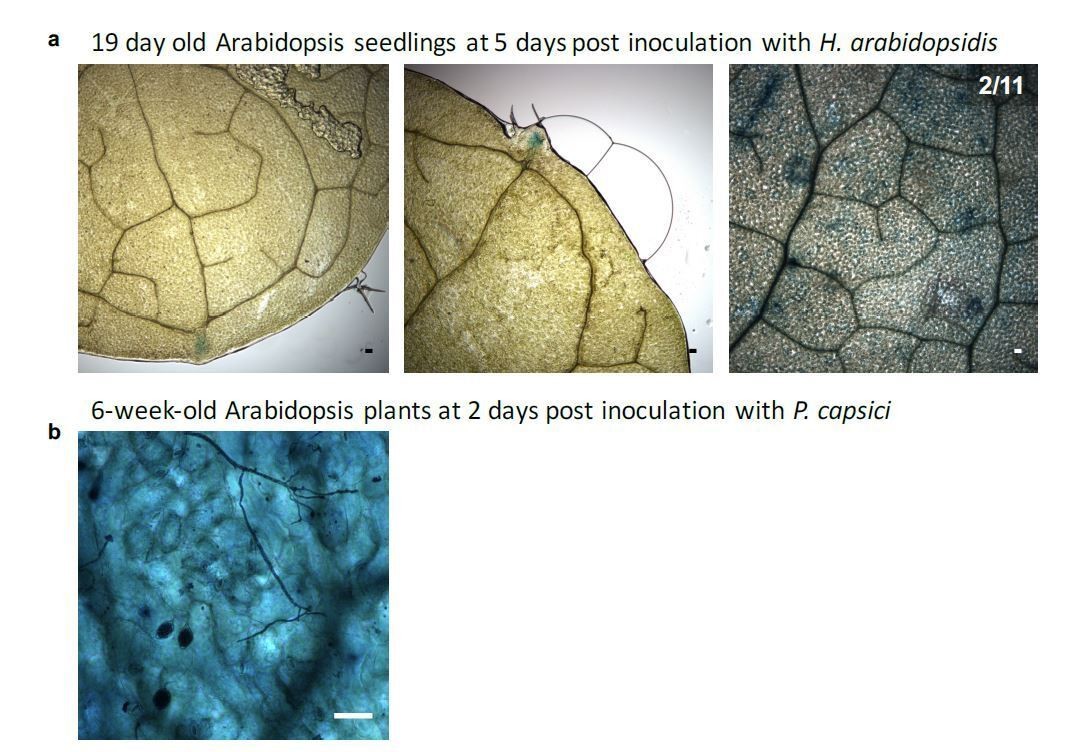
Author response image 5
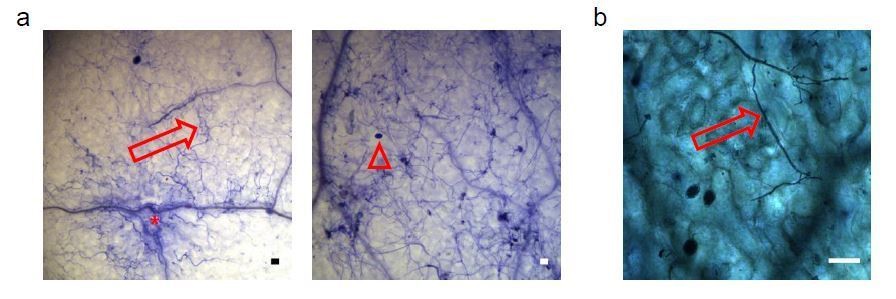
Proof of the viability of Arabidopsis cells colonized by Phytophthora capsici under inoculation condition used in the Csy4/GUS ck-RNAi reporter-based assays.
a) Two representative microscopy images showing Trypan-blue stained Arabidopsis leaves infected with P. capsici hyphae (arrows) and oospores (triangle) at 3 dpi. Local plant cell death was started eliciting at infection sites (asterisk); however, most plant cells yet appeared to be still alive. b) A mature leaf of the Csy4/GUS reporter plants including the AtmiR164 target site expressed GUS. The arrow indicates the infection structures of P. capsici. GUS activity was stained at 2 dpi. The scale bars represent 50 μm.
Tables
Key resources table
| Reagent type (species) or resource | Designation | Source or reference | Identifiers | Additional information |
|---|---|---|---|---|
| Gene (Arabidopsis thaliana) | AtWNK2 | arabidopsis.org | AT3G22420 | |
| Gene (Arabidopsis thaliana) | AtAED3 | arabidopsis.org | AT1G09750 | |
| Gene (Arabidopsis thaliana) | AtPR1 | arabidopsis.org | AT2G14610 | |
| Gene (Arabidopsis thaliana) | AtPDF1.2 | arabidopsis.org | AT5G44420 | |
| Gene (Arabidopsis thaliana) | AtAGO1 | arabidopsis.org | AT1G48410 | |
| Gene (Arabidopsis thaliana) | AtAGO2 | arabidopsis.org | AT1G31280 | |
| Strain, strain background (Hyaloperonospora arabidopsidis) | Noco2 | isolated originally in Norwich, UK | ||
| Strain, strain background (Albugo laibachii) | Nc14 | Kemen et al., 2011 DOI:10.1371/journal.pbio.1001094 | ||
| Strain, strain background (Pseudomonas syringae pv tomato) | DC3000 | Whalen et al., 1991 DOI:10.1105/tpc.3.1.49 | ||
| Strain, strain background (Phytophthora capsici) | LT263 | Hurtado-Gonzales and Lamour, 2009 DOI: 10.1111/j.1365–3059.2009.02059.x | ||
| Genetic reagent (Arabidopsis thaliana) | atago1-27 | Morel et al., 2002 PMID:11910010 | ||
| Genetic reagent (Arabidopsis thaliana) | atago1-45 | Nottingham Arabidopsis stock center (NASC) | N67861 | |
| Genetic reagent (Arabidopsis thaliana) | atago1-46 | (Nottingham Arabidopsis stock center (NASC) | N67862 | |
| Genetic reagent (Arabidopsis thaliana) | atago2-1 | Takeda et al., 2008 DOI: 10.1093/pcp/pcn043 | ||
| Genetic reagent (Arabidopsis thaliana) | atago4-2 | Agorio and Vera, 2007 DOI: 10.1093/pcp/pcn043 | ||
| Genetic reagent (Arabidopsis thaliana) | atdcl1-11 | Zhang et al., 2008 DOI: 10.1111/j.1365–3040.2008.01786.x | ||
| Genetic reagent (Arabidopsis thaliana) | atdcl2dcl3dcl4 | Deleris et al., 2006 DOI: 10.1126/science.1128214 | triple mutant | |
| Genetic reagent (Arabidopsis thaliana) | athen1-5 | Vazquez et al., 2004 DOI: 10.1016/j.cub.2004.01.035 | ||
| Genetic reagent (Arabidopsis thaliana) | athst-6 | Bollman et al., 2003 PMID:12620976 | ||
| Genetic reagent (Arabidopsis thaliana) | atrdr6-15 | Allen et al., 2004 DOI: 10.1038/ng1478 | ||
| Genetic reagent (Arabidopsis thaliana) | atse-2 | Grigg et al., 2005 DOI: 10.1038/nature04052 | ||
| Genetic reagent (Arabidopsis thaliana) | proAGO2:HA-AGO2 | Montgomery et al., 2008 DOI:10.1016/j.cell.2008.02.033 | ||
| Genetic reagent (Arabidopsis thaliana) | atwnk2-2 (SALK_121042) | Nottingham Arabidopsis stock center (NASC) | N663846 | |
| Genetic reagent (Arabidopsis thaliana) | atwnk2-3 (SALK_206118) | Nottingham Arabidopsis stock center (NASC) | N695550 | |
| Genetic reagent (Arabidopsis thaliana) | ataed3-1 (SAIL_722_G02C1) | Nottingham Arabidopsis stock center (NASC) | N867202 | |
| Genetic reagent (Arabidopsis thaliana) | proLjUBI:STTMHasR2: STTMHasR30:STTMHasR90 | this study | stable triple STTM overexpressor line (maintained in the Weiberg lab) | |
| Genetic reagent (Arabidopsis thaliana) | proAtWNK2:HasRNA2/90ts:Csy4:HasRNA2/90ts; proEF1:Csy4ts:GUS | this study | stable silencing reporter line (maintained in the Weiberg lab) | |
| Genetic reagent (Arabidopsis thaliana) | proAtWNK2:AtmiR164ts:Csy4:AtmiR164ts; proEF1:Csy4ts:GUS | this study | stable silencing reporter line (maintained in the Weiberg lab) | |
| Genetic reagent (Arabidopsis thaliana) | proAtWNK2:scrambled:Csy4:scrambled; proEF1:Csy4ts:GUS | this study | stable silencing reporter line (maintained in the Weiberg lab) | |
| Genetic reagent (Arabidopsis thaliana) | atwnk2-2 (proAtWNK2:AtWNK2-GFP) | this study | stable WNK2 complementation line (maintained in the Weiberg lab) | |
| Genetic reagent (Arabidopsis thaliana) | atwnk2-2 (proAtWNK2:AtWNK2r-GFP) | this study | stable, sRNA resistant WNK2 complementation line (maintained in the Weiberg lab) | |
| Genetic reagent (Arabidopsis thaliana) | atwnk2-2 (proAtWNK2:GFP) | this study | stable plant line as empty vector control (maintained in the Weiberg lab) | |
| Genetic reagent (Arabidopsis thaliana) | ataed3-1 (proAtAED3:AtAED3-GFP) | this study | stable AED3 complementation line (maintained in the Weiberg lab) | |
| Genetic reagent (Arabidopsis thaliana) | ataed3-1 (proAtAED3:AtAED3r-GFP) | this study | stable, sRNA resistant AED3 complementation line (maintained in the Weiberg lab) | |
| Genetic reagent (Arabidopsis thaliana) | ataed3-1 (proAtAED3: GFP) | this study | stable plant line as empty vector control (maintained in the Weiberg lab) | |
| Antibody | anti-AtAGO1 (rabbit polyclonal) | Agrisera | AS09 527; RRID:AB_2224930 | IP(1 µg antibody/g tissue), WB (1:4000) |
| Antibody | anti-HA (3F10; rat monoclonal) | Roche Diagnostics | Sigma-Aldrich (11867423001); RRID:AB_2314622 | IP(0.1 µg antibody/g tissue), WB (1:1000) |
| Antibody | anti-HA (12CA5; mouse monoclonal) | provided by Dr. Michael Boshart | IP(0.1 µg antibody/g tissue), WB (1:1000), available in the Boshart lab (LMU Munich) | |
| Antibody | anti-mouse IRdye800 (goat polyclonal) | Li-Cor | 926–32210; RRID:AB_2782998 | secondary antibody WB (1:15000) |
| Antibody | anti-rat IRdye800 (goat polyclonal) | Li-Cor | 926–32219; RRID:AB_1850025 | secondary antibody WB (1:15000) |
| Antibody | anti-rabbit IRdye800 (goat polyclonal) | Li-Cor | 926–32211; RRID:AB_621843 | secondary antibody WB (1:3000) |
| Commercial assay or kit | NEBNext Multiplex Small RNA Library Prep Set for Illumina | New England Biolabs (NEB) | NEB: E7300 | |
| Commercial assay or kit | 5′/3′ RACE Kit, 2nd Generation | Roche Diagnostics | Sigma-Aldrich: 03353621001 | |
| Commercial assay or kit | sparQ DNA Library Prep Kit | Quantabio | vwr.com (95191–024) | |
| Software, algorithm | Galaxy Server | Giardine et al., 2005 | hosted by the Gene Center Munich |
Additional files
-
Supplementary file 1
sRNA read numbers.
- https://cdn.elifesciences.org/articles/56096/elife-56096-supp1-v3.xlsx
-
Supplementary file 2
Predicted A. thaliana target genes of HpasRNAs.
- https://cdn.elifesciences.org/articles/56096/elife-56096-supp2-v3.xlsx
-
Supplementary file 3
List of oligonucleotides used in this study.
- https://cdn.elifesciences.org/articles/56096/elife-56096-supp3-v3.xlsx
-
Transparent reporting form
- https://cdn.elifesciences.org/articles/56096/elife-56096-transrepform-v3.docx
Download links
A two-part list of links to download the article, or parts of the article, in various formats.
Downloads (link to download the article as PDF)
Open citations (links to open the citations from this article in various online reference manager services)
Cite this article (links to download the citations from this article in formats compatible with various reference manager tools)
Oomycete small RNAs bind to the plant RNA-induced silencing complex for virulence
eLife 9:e56096.
https://doi.org/10.7554/eLife.56096


