Phosphoinositides regulate force-independent interactions between talin, vinculin, and actin
- Max Planck Institute of Biochemistry, Department of Structural Cell Biology, Germany
- Max Planck Institute of Biochemistry, Department of Cellular and Molecular Biophysics, Germany
- Laboratory of Structural Cell Biology, National Heart, Lung, and Blood Institute, National Institutes of Health, United States
- National Institute of Arthritis and Musculoskeletal and Skin Diseases, National Institutes of Health, United States
Figures
Figure 1 with 4 supplements
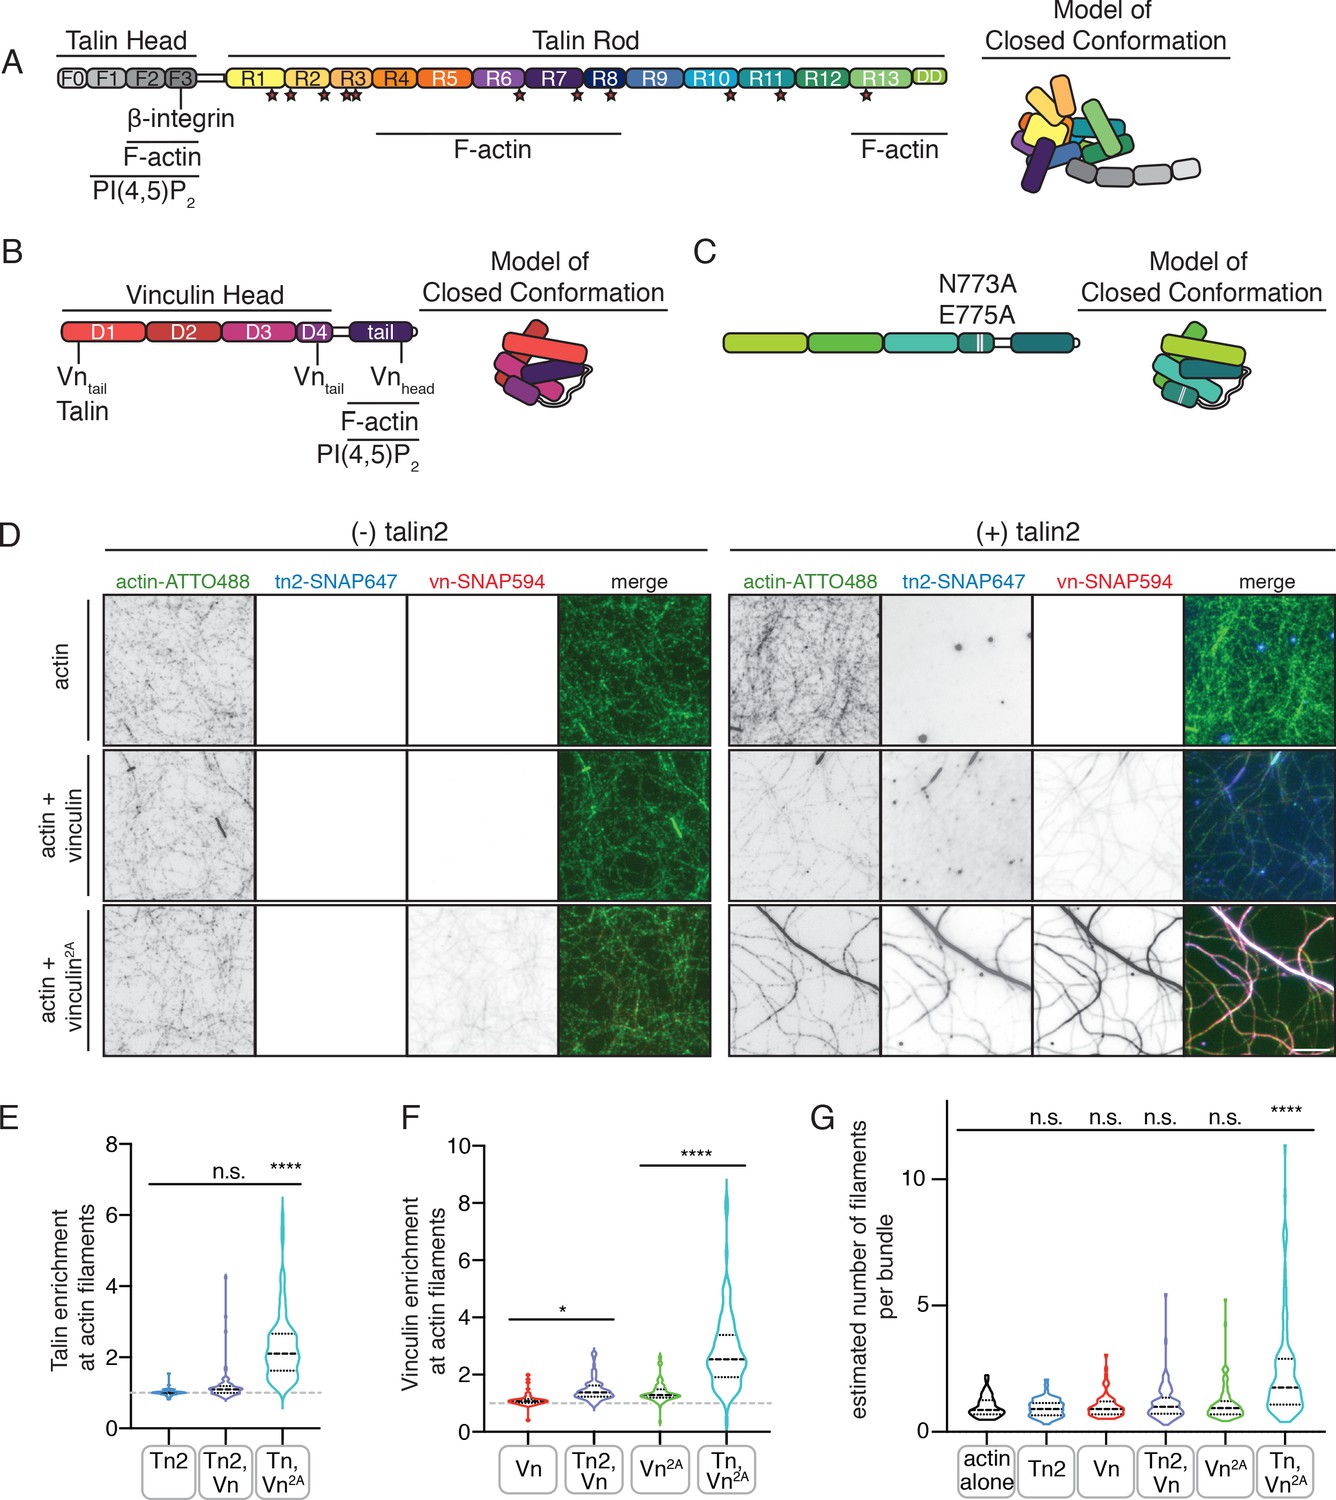
Autoinhibition blocks interactions between talin, vinculin, and actin in vitro.
(A) Human talin2 domain organization, left. Stars highlight predicted vinculin binding sites. To the right, a model of the closed, autoinhibited conformation of talin, based on the Tn1 autoinhibited structure (Dedden et al., 2019). (B) Human vinculin domain organization, with model of autoinhibited structure (red) and (C) human vinculin with a deregulating mutation in the D4 domain (N773A,E775A), with a model of the partially deregulated structure (green) (Bakolitsa et al., 2004; Cohen et al., 2005). (D) Representative three-color TIRF microscopy images of 1.5 µM SNAP-tag-labeled FA proteins and 1 µM actin (10% actin-ATTO488,green) added to TIRFm buffer (10 mM imidazole, 50 mM KCl, 1 mM MgCl2, 1 mM EGTA, 0.2 mM ATP, pH 7.5) supplemented with 15 mM glucose, 20 µg/mL catalase, 100 µg/mL glucose oxidase, 1 mM DTT and 0.25% methyl-cellulose (4000 cp). Images acquired after 30 min of polymerization. Scale bar = 5 µm. (E) Quantification of talin enrichment at actin filaments, compared to background Tn-SNAP647 signal, for Tn alone, with Vn wild-type, and with Vn2A. A value of 1 indicates no enrichment at filaments. (F) Quantification of vinculin enrichment at actin filaments, compared to background Vn-SNAP647 or Vn2A-SNAP647 signal, both with or without Tn2. A value of 1 indicates no enrichment at filaments. (G) Estimation of number of filaments per actin bundle for each condition shown in (D), n (from left to right)=43, 57, 60, 93, 97, 108. The average fluorescence of individual filaments in actin alone samples was used to define the signal of a single actin filament, and then used to estimate the number of filaments for each condition. n.s. >0.5,*p<0.05 ****p<0.0001, by one-way ANOVA.
-
Figure 1—source data 1
source data corresponding to Figure 1D–G.
- https://cdn.elifesciences.org/articles/56110/elife-56110-fig1-data1-v2.xlsx
Figure 1—figure supplement 1

Talin and vinculin do not form a complex under low ionic strength conditions.
Tn2, Vn, and Vn2A (5 µM) reconstitution assay using size-exclusion chromatography (SEC). Chromatograms and SDS-PAGE indicate the elution profiles of the proteins alone and in combination for Tn2,Vn (top) and Tn2,Vn2A (bottom) in 20 mM HEPES pH 7.8, 75 mM KCl, 1 mM EDTA, 3 mM β-mercaptoethanol.
Figure 1—figure supplement 2
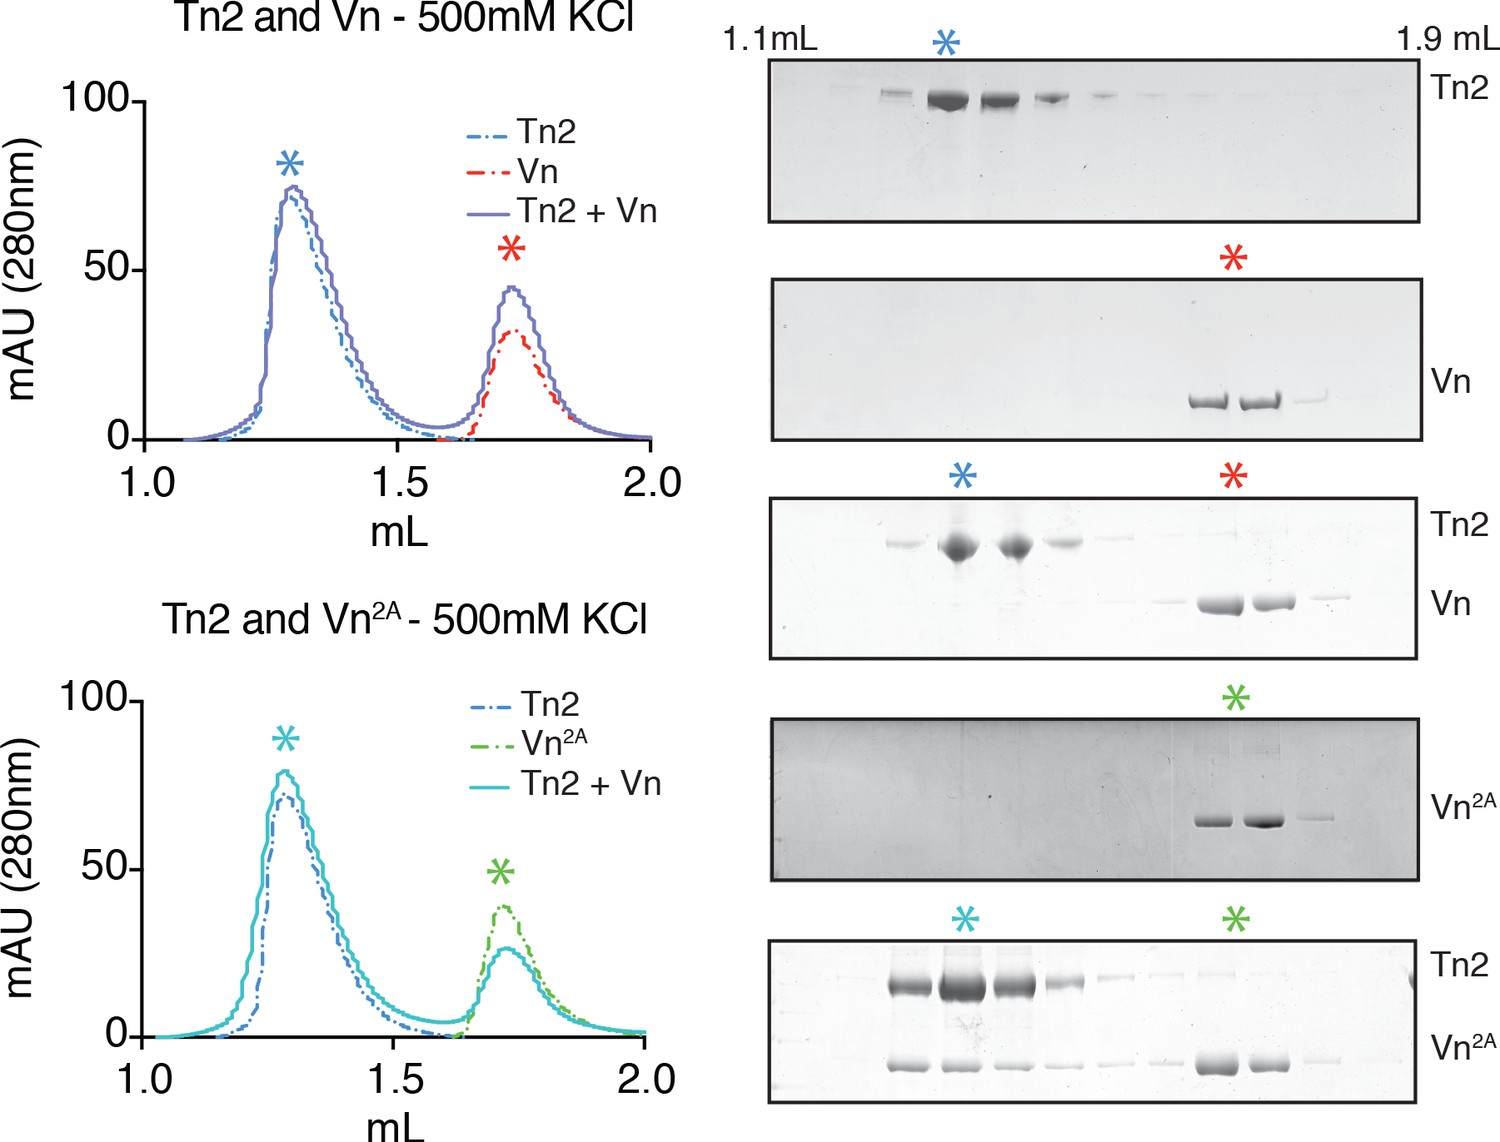
Partial relief of vinculin inhibition allows talin-vinculin complex formation under high ionic strength conditions.
Tn2, Vn, and Vn2A (5 µM) reconstitution assay using size-exclusion chromatography (SEC). Chromatograms and SDS-PAGE indicate the elution profiles of the proteins alone and in combination in 20 mM HEPES pH 7.8, 500 mM KCl, 1 mM EDTA, 3 mM β-mercaptoethanol., for Tn2,Vn or Tn2,Vn2A.
Figure 1—figure supplement 3

Talin and vinculin are enriched along multi-filament actin bundles.
Enrichment of Tn2 and Vn (right) or Tn2 and Vn2A (left) along actin filaments, divided by estimated number of filaments per bundle. Tn2 and Vn2A have enrichment >1 for all filament numbers, but enrichment is higher for bundles of multiple filaments (>2). Number of filaments was estimated using the average fluorescence of single filaments from actin control samples. n.s. >0.5, *p<0.05, ***p<0.005 ****p<0.0001, by one-way ANOVA. See also Figure 1—source data 1.
Figure 1—figure supplement 4

Talin and vinculin interact weakly with actin independently.
(A) Actin co-sedimentation assay with purified Tn2, Vn, and Vn2A (5 µM) with F-actin (10 µM) in 20 mM HEPES, pH 7.5, 75 mM KCl, 2 mM MgCl2, and 0.2 mM ATP. Gel shows representative pellet and supernatant fractions. Graph shows individual data points (normalized to actin-free controls), mean densitometry, and ± SD for three independent experiments, n.s. >0.5, **p<0.01, ***p<0.005 by one-way ANOVA. (B) Control samples without actin for actin co-sedimentation shown to the right. For quantification, negative control samples were used to correct for actin-independent pelleting. We note that talin2 sedimented in the absence of actin. This was independent of incubation time, temperature over the course of the experiment, and occurs under all buffer conditions used within this study, with the exception of >400 mM KCl. However, DLS measurements (C) of hydrodynamic radius over a range of salt concentrations indicate that Tn2 undergoes a salt-dependent conformation change similar to Tn1 (Dedden et al., 2019). Based on these results, as well as the SEC results of Figure 1—figure supplements 1 and 2, Tn2 behaves similar to Tn1 and, thus, is well-folded and functional. Graph represents mean hydrodynamic radius ± SD for three independent measurements for each salt concentration in the following buffer: 20 mM HEPES pH 7.5, 500 mM KCl, 1 mM EDTA, 3 mM β-mercaptoethanol.
Figure 2 with 6 supplements
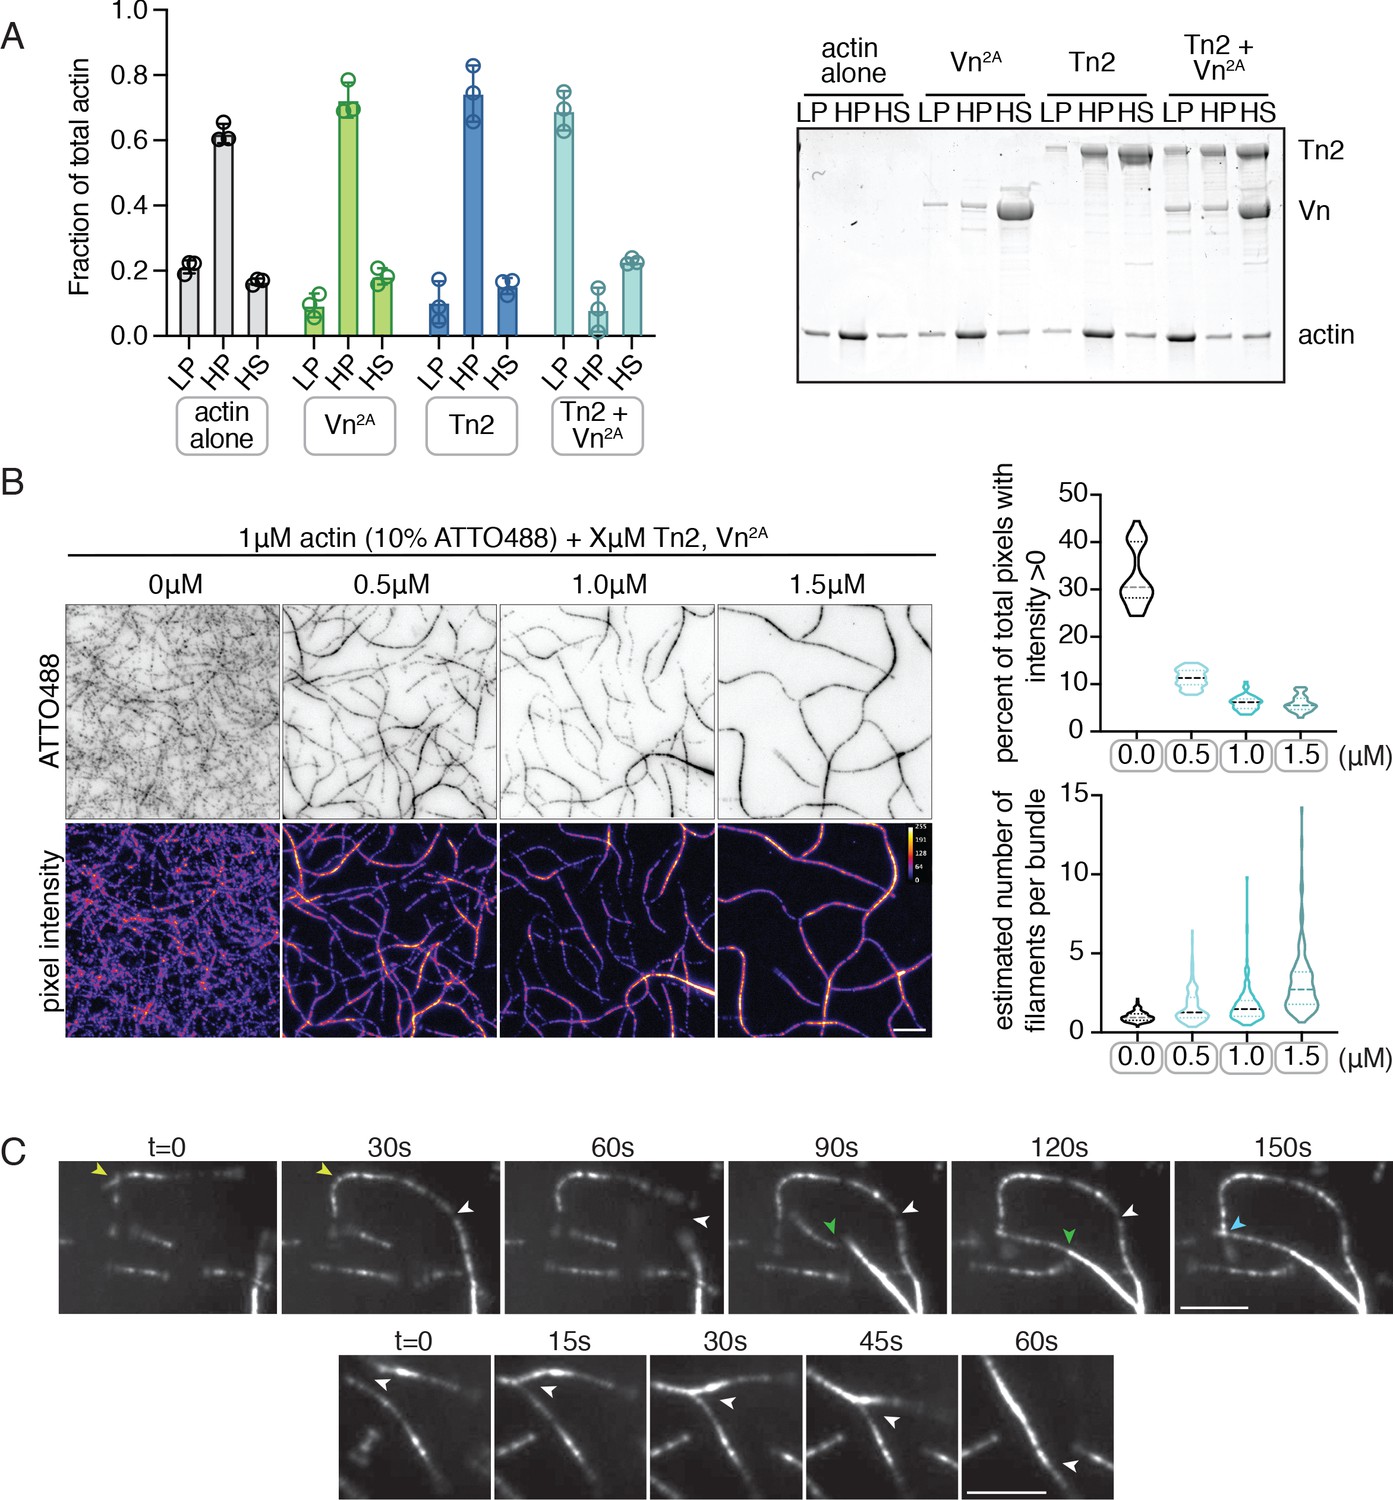
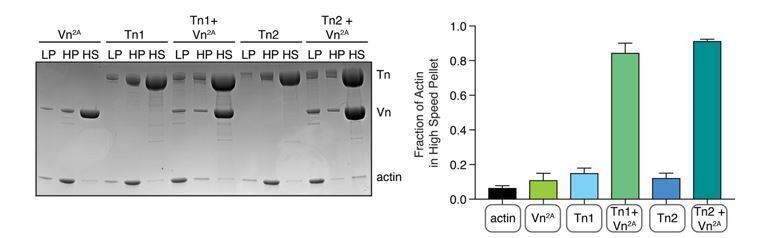
Deregulated vinculin induces actin bundling with full-length talin.
(A) Actin bundling (low speed; 10,000 x g) and binding (high speed; 100,000 x g) co-sedimentation assay with pre-polymerized filamentous actin (2.5 µM) and purified FA proteins (2.5 µM). Low-speed pellet (LP), high-speed pellet (HP), and high-speed supernatant (HS) samples were analyzed by gradient SDS-PAGE. Graph shows individual data points, mean densitometry, and ± SD for three independent samples. See also Figure 2—figure supplement 1 for controls and comparison to actin polymerized in the presence of talin and vinculin. (B) One-color TIRF microscopy of 1 µM actin with Tn2,Vn2A (0.5 to 1.5 µM) after 15 min of polymerization, also shown in Figure 2—video 1. Violin plots show percent area covered by actin for each condition tested (top) and the estimated number of filaments per bundle (bottom), based on the average peak fluorescence of individual filaments in the actin control sample, for three independent experiments. Percent area, from left to right, n = 31, 34, 45, 45. Filaments per bundle, from left to right, n = 117, 136, 184, 155. (C) Representative time-lapse images of 0.6 µM actin (5% ATTO488-actin) cross-linking and bundling during polymerization in the presence of 1 µM Tn2 and Vn2A. Top images, multiple instances of filaments coming into contact and forming stable connections. Different colored arrows represent individual cross-linking events. Bottom images, filaments zipper together, white arrow. Scale bar = 5 µm. See also figure supplement videos 2 and 3. Cosedimentation experiments performed in 20 mM HEPES, pH 7.5, 75 mM KCl, 2 mM MgCl2, and 0.2 mM ATP. TIRFm experiments carried out in TIRFm buffer with 15 mM glucose, 20 µg/mL catalase, 100 µg/mL glucose oxidase, 1 mM DTT and 0.25% methyl-cellulose (4000 cp).
-
Figure 2—source data 1
source data corresponding to Figure 2B.
- https://cdn.elifesciences.org/articles/56110/elife-56110-fig2-data1-v2.xlsx
Figure 2—figure supplement 1
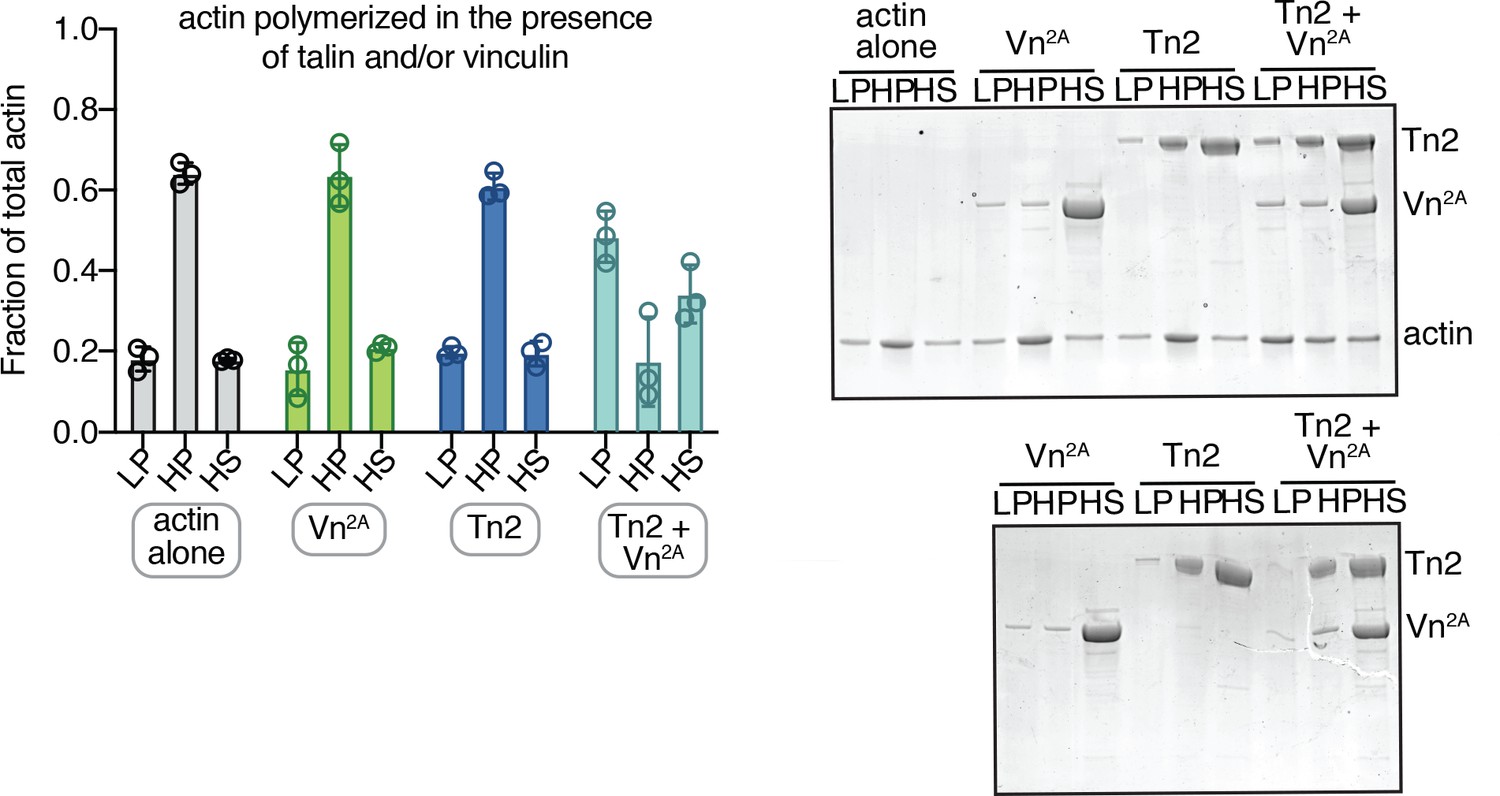
Actin also crosslinked when polymerized in the presence of talin and partially deregulated vinculin.
Actin bundling (low speed; 10,000 x g) and binding (high speed; 100,000 x g) co-sedimentation assay with actin (2.5 µM) and purified FA proteins (2.5 µM). Actin was polymerized in the presence of FA proteins. Low-speed pellet (LP), high-speed pellet (HP), and high-speed supernatant (HS) samples were analyzed by gradient SDS-PAGE. Graph shows mean and individual data points for three independent reactions. SDS-PAGE of samples with actin (top) and without actin (bottom). Cosedimentation experiments performed in 20 mM HEPES, pH 7.5, 75 mM KCl, 2 mM MgCl2, and 0.2 mM ATP.
Figure 2—figure supplement 2
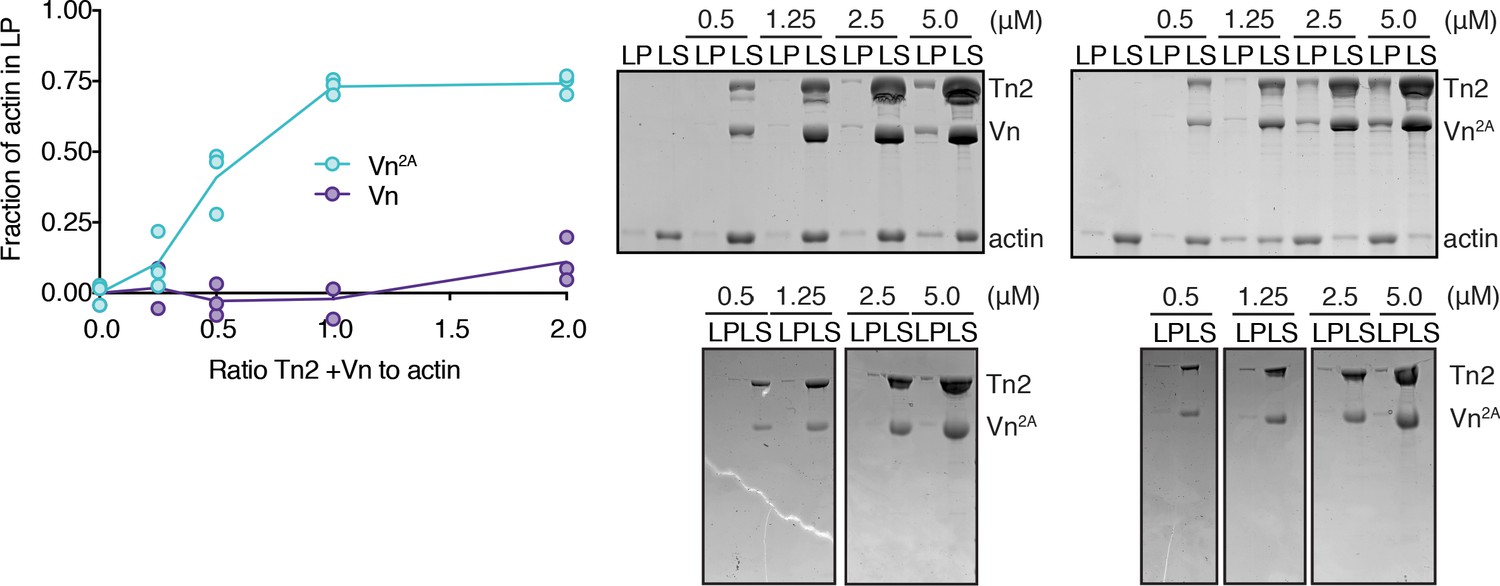
Concentration dependence of talin-vinculin-mediated actin cross-linking.
Actin co-sedimentation assay with filamentous actin (2.5 µM) and Tn2,Vn or Tn2,Vn2A(0.5 to 5 µM). Graph shows individual data points for three independent samples. Representative SDS-PAGE on the right; top gels are with actin, bottom gels are negative controls without actin.
Figure 2—figure supplement 3
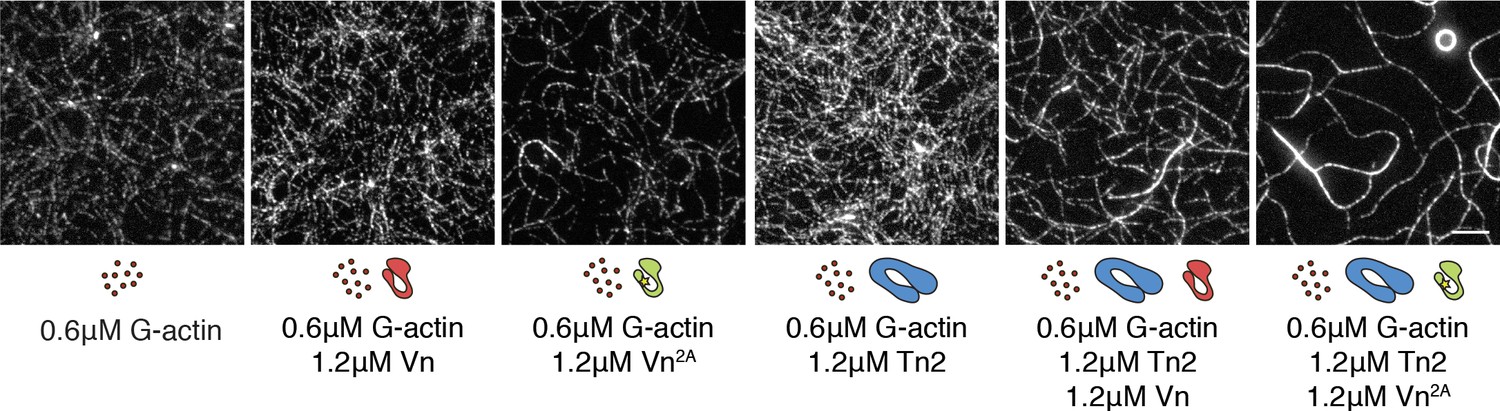
Both talin and vinculin are required for actin bundling.
One-color TIRF microscopy of 0.6 µM actin with different combinations of talin2 and vinculin proteins, after 15 min of polymerization. Scale bar = 5 µm. TIRFm experiments were carried out in TIRFm buffer with 15 mM glucose, 20 µg/mL catalase, 100 µg/mL glucose oxidase, 1 mM DTT and 0.25% methyl-cellulose (4000 cp).
Figure 2—video 1
Actin polymerization with Tn2, Vn or Tn2,Vn2A.
TIRFm of polymerization of 0.6 µM actin (10% actin-ATTO488-TIRF, 0.5% biotin-actin) with 1 µM Tn2 and 1 µM either Vn or Vn2A. Video playback is seven frames per second.
Figure 2—video 2
Actin bundling by Tn2 and Vn2A.
TIRFm of actin bundling during polymerization of 0.6 µM actin (10% actin-ATTO488, 0.5% biotin-actin) with 1 µM Tn2 and 1 µM Vn2A. Video playback is seven frames per second.
Figure 2—video 3
Actin bundling by Tn2 and Vn2A.
TIRFm of actin bundling during polymerization of 0.6 µM actin (10% actin-ATTO488, 0.5% biotin-actin) with 1 µM Tn2 and 1 µM Vn2A. Video playback is seven frames per second.
Figure 3 with 4 supplements

Talin mediates interactions between full-length vinculin and actin.
(A) Actin bundling co-sedimentation assay with filamentous actin (2.5 µM) and Tn2 with various vinculin fragments (2.5 µM, see Figure 3—figure supplement 1), supernatant and pellet samples were analyzed using SDS-PAGE. Graph shows individual data points and mean densitometry for three independent samples. (B) Actin bundling co-sedimentation assay with filamentous actin (2.5 µM) and various talin2 mutants and fragments (see Figure 3—figure supplement 1), with and without Vn2A (2.5 µM), supernatant and pellet samples were analyzed using SDS-PAGE. Graph shows individual data points and mean densitometry for talin2 proteins alone (dark blue) and with Vn2A (aqua) for three independent samples. Cosedimentation experiments performed in 20 mM HEPES, pH 7.5, 75 mM KCl, 2 mM MgCl2, and 0.2 mM ATP. Controls for (A,B) found in Figure 3—figure supplement 2.(C) Representative images of two-color TIRFm with 1 µM actin (5% ATTO488-actin) and Vn2A (1.5 µM) with different SNAP-647-labeled Tn2 proteins (1.5 µM). Schematics above images indicate domain locations of mutations and truncations. Quantification can be found in Figure 3—figure supplement 4. Scale bar = 5 µm. TIRFm experiments were carried out in TIRFm buffer with 15 mM glucose, 20 µg/mL catalase, 100 µg/mL glucose oxidase, 1 mM DTT and 0.25% methyl-cellulose (4000 cp).
Figure 3—figure supplement 1
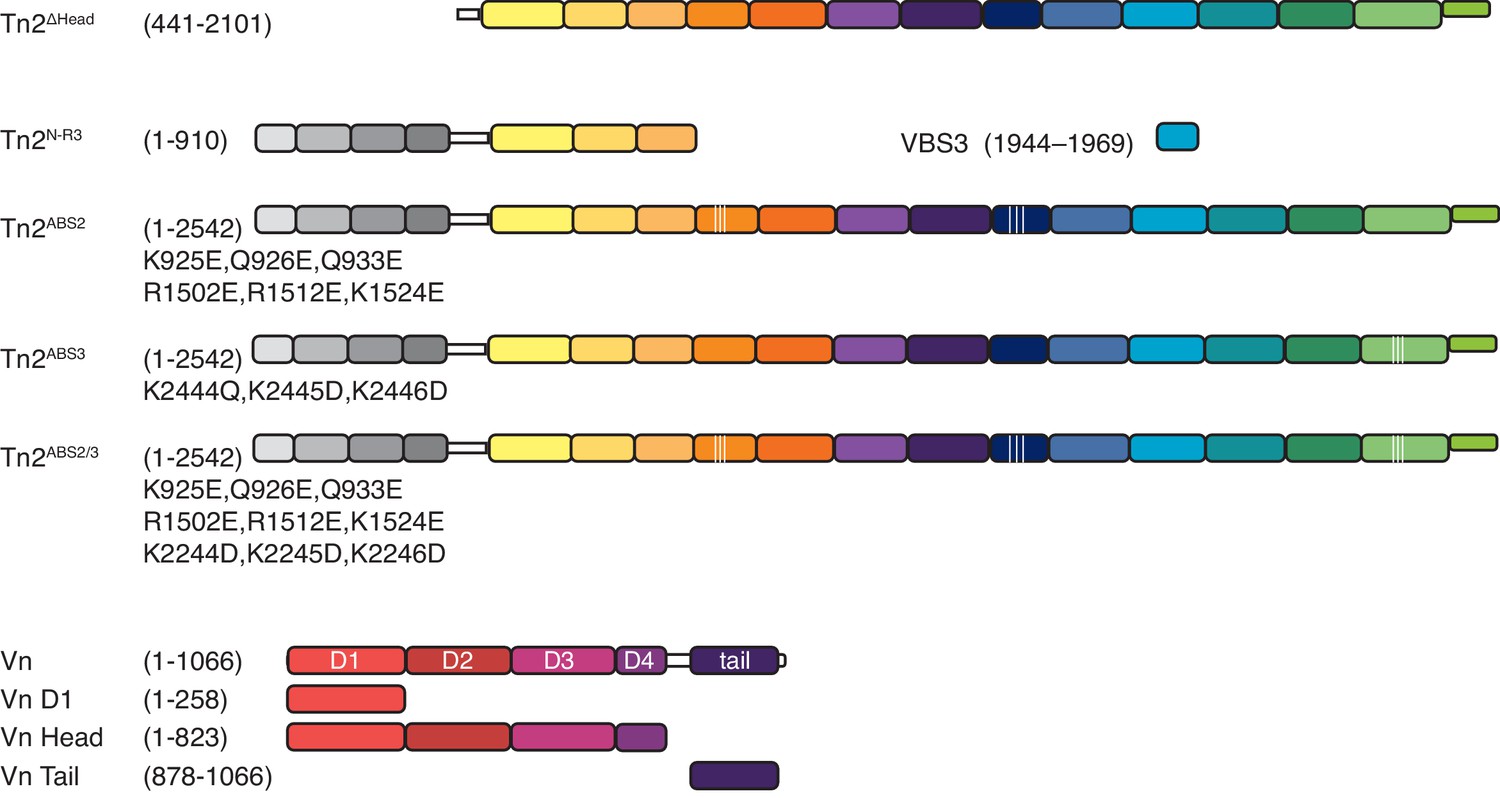
Domain schematics of talin mutants and vinculin truncations.
Domain schematic of talin mutants, and truncations used in this study (top). Domain schematic of vinculin full-length and truncations used in this study (bottom).
Figure 3—figure supplement 2
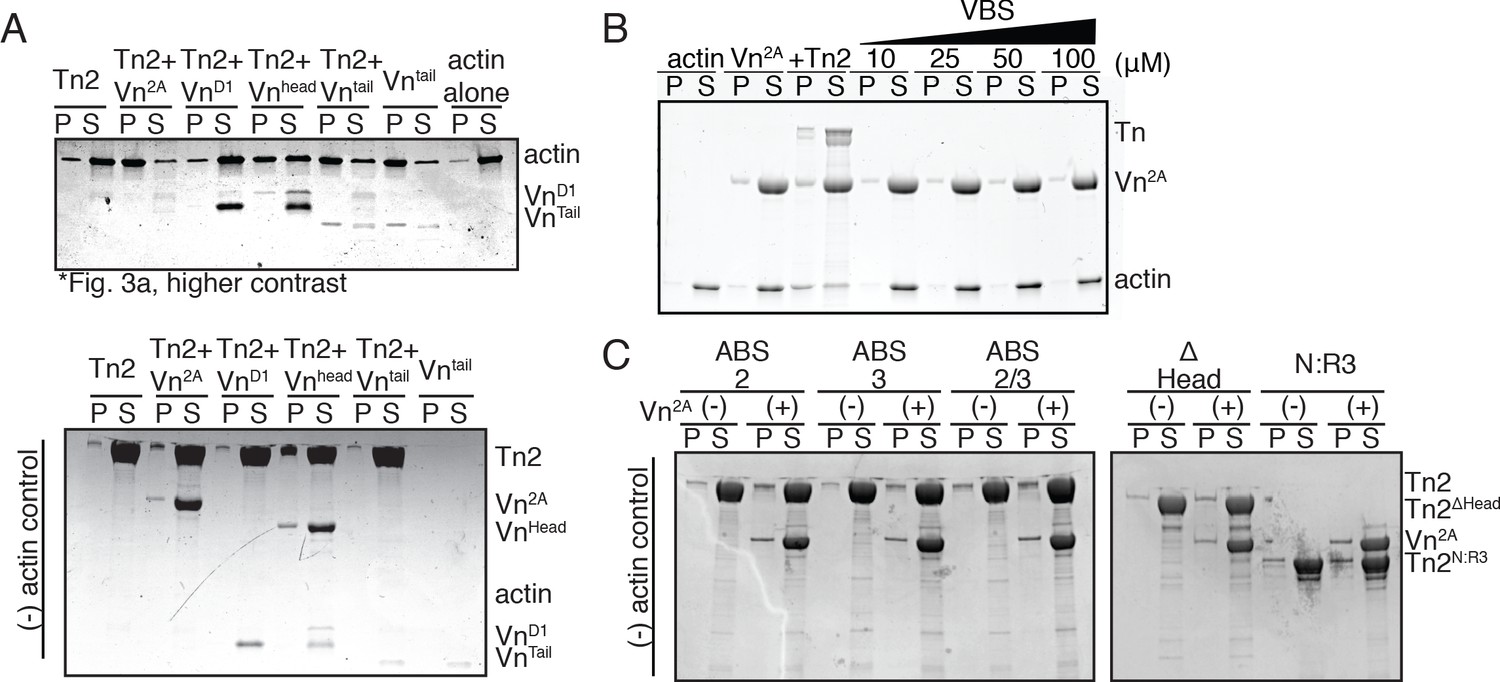
Cosedimentation controls corresponding to Figure 3.
(A) SDS-PAGE from Figure 3A, adjusted to clearly show VnD1 and VnTail (top) and actin-negative control samples (bottom) (B) Actin bundling co-sedimentation assay with actin (2.5 µM), Vn2A (2.5 µM), and increasing amounts of talin VBS peptide (10 µM to 100 µM). Representative SDS-PAGE of supernatant and pellet samples. (C) Cosedimentation control samples without actin for Figure 3B. Cosedimentation experiments were performed in 20 mM HEPES, pH 7.5, 75 mM KCl, 2 mM MgCl2, and 0.2 mM ATP.
Figure 3—figure supplement 3

Mass spectrometry of Tn2ΔHead and quantification of Vn cosedimentation with Tn2 mutants.
(A) Coverage map of Tn2ΔHead compared to Tn2, from mass spectrometry of the purified proteins. (B) Quantification of Vn2A co-sedimented with actin and Tn in the actin bundling assay shown in Figure 3B. n.s. >0.5, *p<0.5, by one-way ANOVA.
Figure 3—figure supplement 4
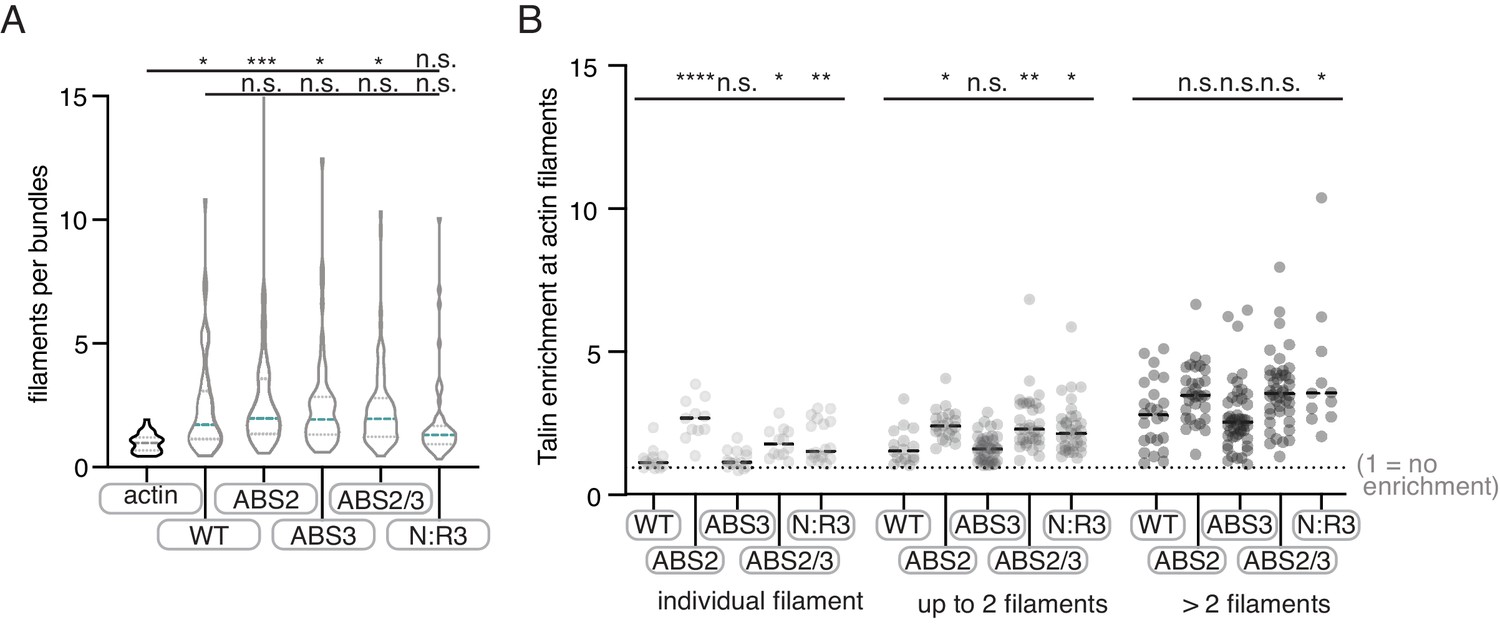
Quantification of Tn2 mutant TIRFm data.
(A) Violin plot shows the distribution of estimated number of actin filaments per bundle for three independent experiments. From left to right, n = 35, 53, 63, 63, 87, 62. (B) Graph shows individual data points for Tn2 enrichment at actin filaments, binned according to number of filaments within an individual bundle, based on average filament fluorescence in the actin alone control, from three independent experiments. A value of 1 indicates no enrichment of Tn2 at the actin filament or bundle. From left to right, total measurements, n = 53, 63, 102, 87, 62. n.s. >0.5, *p<0.5 **p<0.05, ***p<0.005.
-
Figure 3—figure supplement 4—source data 1
source data corresponding to Figure 3—figure supplement 4.
- https://cdn.elifesciences.org/articles/56110/elife-56110-fig3-figsupp4-data1-v2.xlsx
Figure 4 with 2 supplements
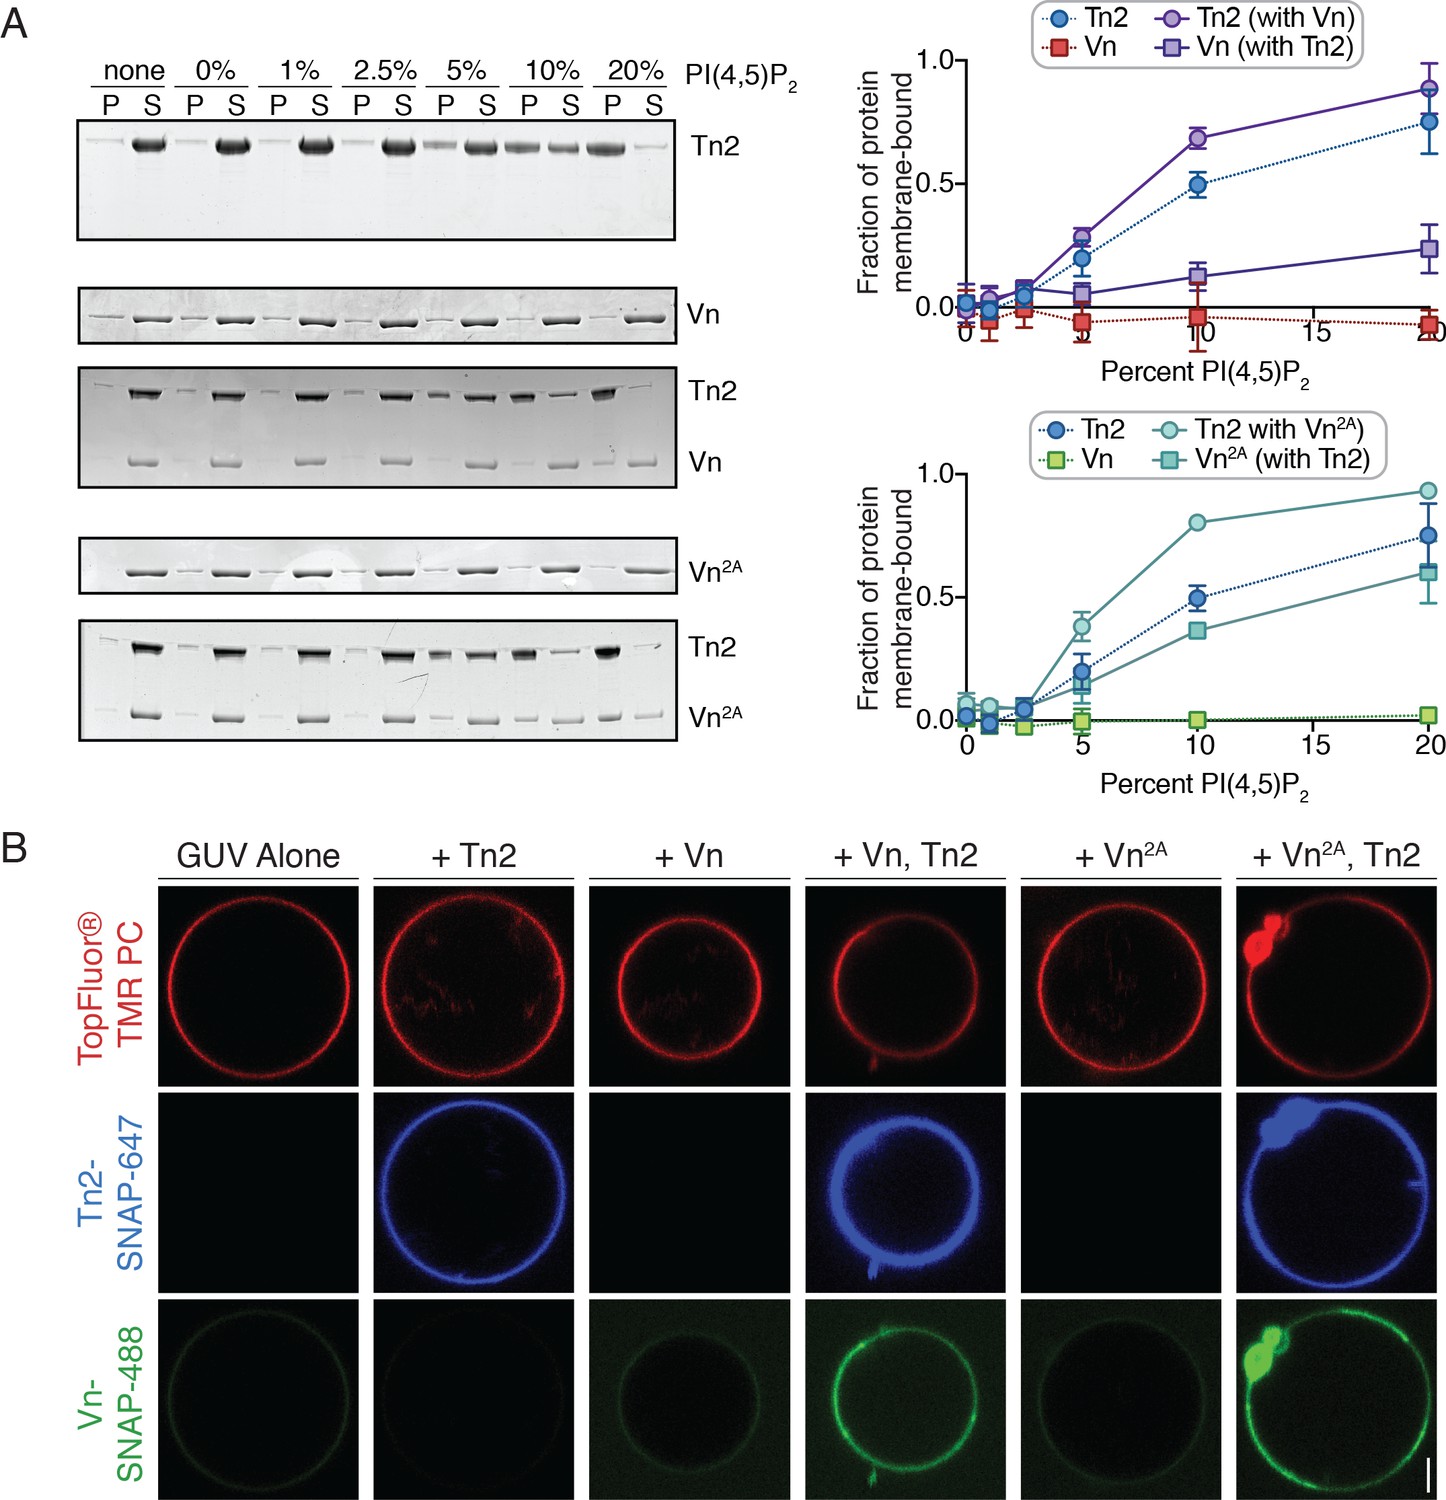
PI(4,5)P2-rich membranes unlock talin-vinculin interactions in vitro.
(A) Liposome co-sedimentation assay with purified Tn2, Vn, and Vn2A (0.5 µM). Proteins were incubated with liposomes of the following composition: 0.75-X DOPC, 0.15 DOPE, 0.1 DOPS, X PI(4,5)P2. Representative Coomassie-stained SDS-PAGE of pellet and supernatant samples for each condition. Graphs show mean densitometry from three independent samples ± SD, for Tn2, Vn and Tn2, Vn2A. Data for Tn2 alone (blue) is shown on both graphs, but represent identical data. (B) Representative images of PC-TMR-labeled GUVs (red) with purified, SNAP-tag-labeled FA proteins (Tn2: blue and Vn: green). For quantification see Figure 4—figure supplement 2. All liposome experiments in this figure were performed in liposome buffer (20 mM HEPES, pH 7.5 and 100 mM NaCl). Scale bar = 2.5 µm.
Figure 4—figure supplement 1

Talin FERM domain is required to recruit vinculin to liposomes.
Liposome co-sedimentation of Vn2A (0.5 µM) with TnΔHead (0.5 µM) or VBS peptide (50 µM) with liposomes of the following composition: 0.55 DOPC, 0.15 DOPE, 0.1 DOPS, 0.20 PI(4,5)P2 by molar ratio. Representative Coomassie-stained SDS-PAGE of pellet and supernatant samples for each condition.
Figure 4—figure supplement 2

Quantification of talin-mediated vinculin recruitment to GUVs.
Quantification of membrane binding from GUV experiment shown in Figure 4B. Scatter plot of talin and vinculin intensity at the membrane surface for varying concentrations of Tn2, Vn (A) or Tn2, Vn2A (C), for three repetitions of each condition. Graphs on the right show the enrichment of Tn2, Vn (B) or Tn2,Vn2A (D) at the membrane surface for varying concentrations of talin and vinculin, from three repetitions of each condition.
-
Figure 4—figure supplement 2—source data 1
source data corresponding to Figure 4—figure supplement 2.
- https://cdn.elifesciences.org/articles/56110/elife-56110-fig4-figsupp2-data1-v2.xlsx
Figure 5 with 2 supplements
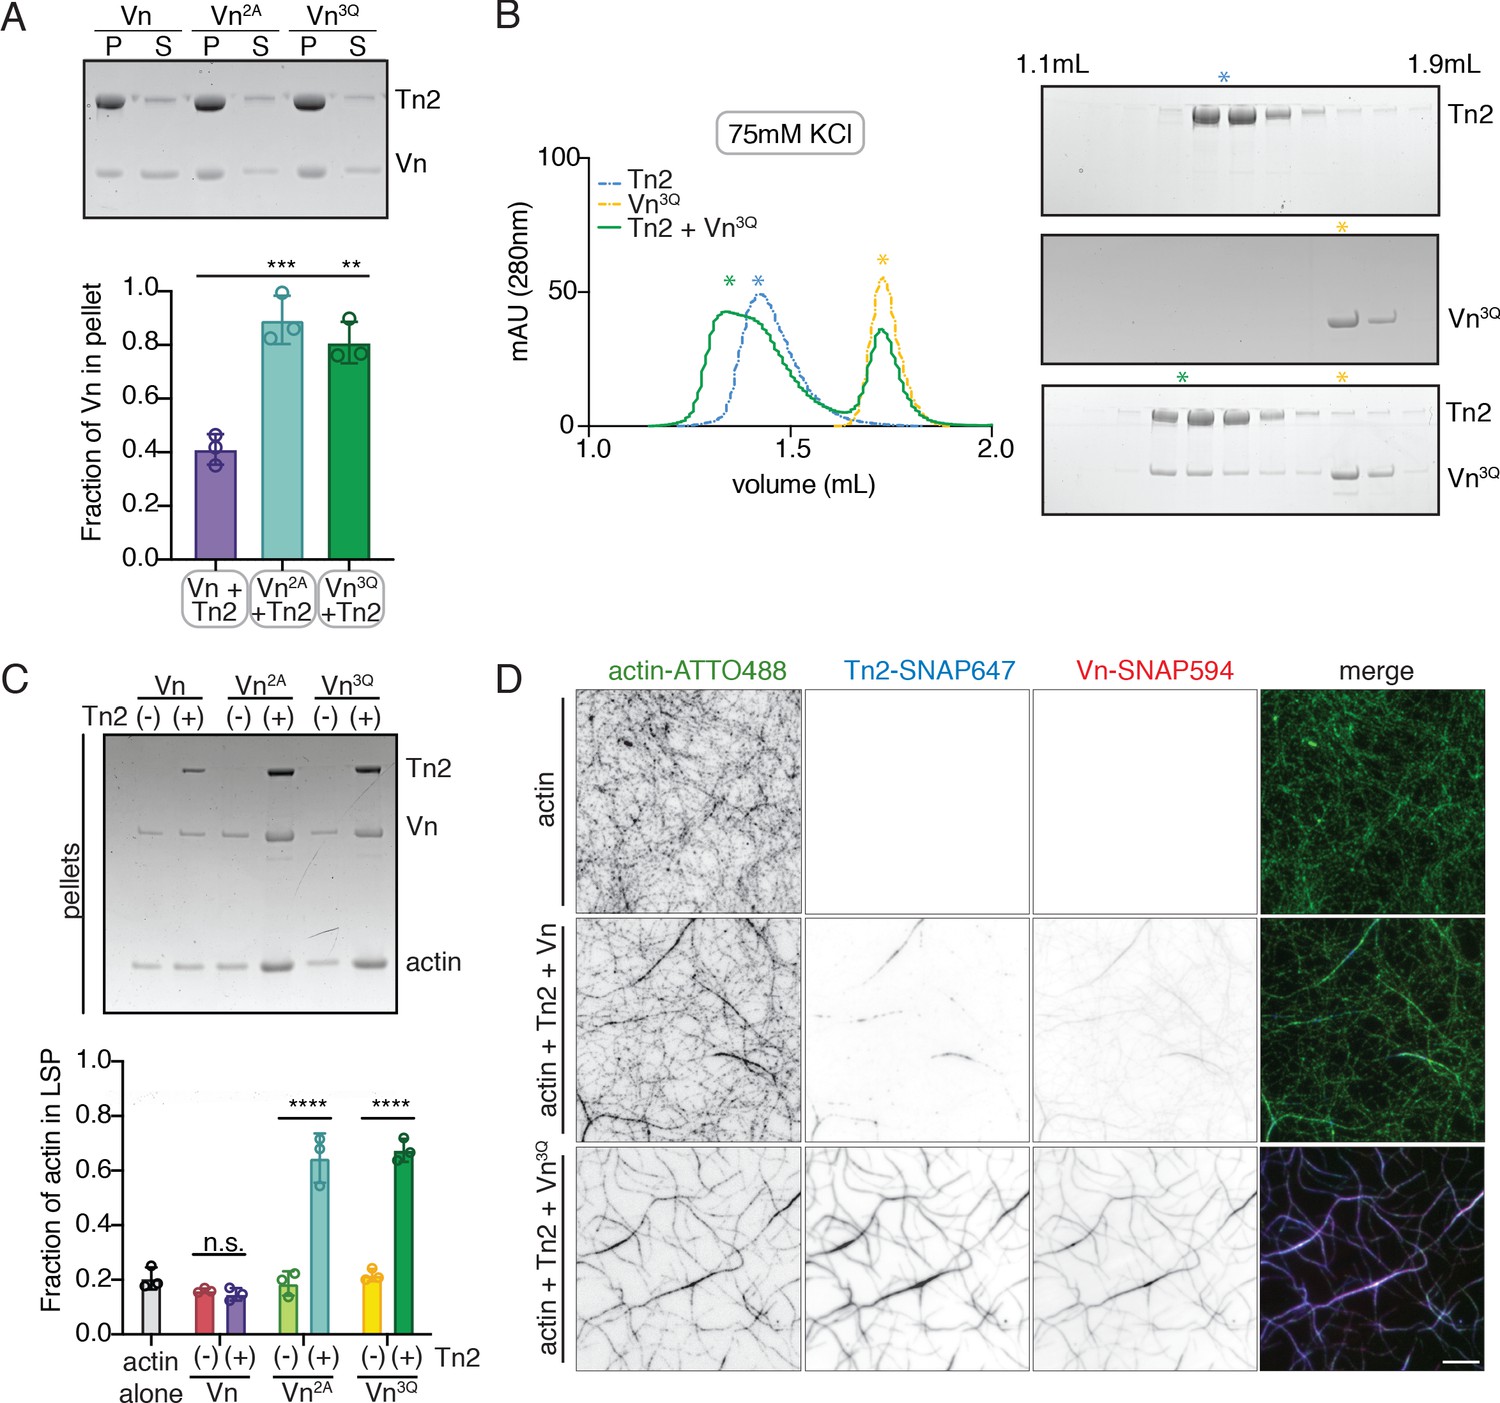
Vinculin membrane binding is linked to autoinhibition.
(A) Liposome co-sedimentation assay with full-length Vn, Vn2A, Vn3Q with Tn2 (0.5 µM) and liposomes (0.55 DOPC, 0.15 DOPE, 0.1 DOPS, 0.20 PI(4,5)P2, molar ratio). Representative SDS-PAGE of pellet and supernatant samples, control found in Figure 5—figure supplement 2. Graph shows mean densitometry and individual values from three independent samples. All liposome cosedimentation assays in this figure were performed in liposome buffer. (B) Tn2 and Vn3Q reconstitution assay using size-exclusion chromatography (SEC) in 20 mM HEPES pH 7.8, 75 mM KCl, 1 mM EDTA, 3 mM β-mercaptoethanol. Elution profiles compared by SDS-PAGE are on the right for Tn2 alone, Vn3Q , and Tn2 with Vn3Q (every other fraction loaded from 1.1 mL to 1.9 mL). (C) Actin bundling co-sedimentation assay with vinculin mutants, with and without Tn2, carried out under the following buffer conditions: 20 mM HEPES, pH 7.5, 75 mM KCl, 2 mM MgCl2, and 0.2 mM ATP. Representative SDS-PAGE of pellet samples after low-speed spin (10,000 x g), control found in Figure 5—figure supplement 1. Graph represents individual and mean densitometry from three individual experiments. ****p<0.0005, one-way ANOVA. (D) Representative images of three-color TIRFm with Vn-SNAP594, Vn3Q-SNAP594, and Tn2-SNAP647, carried out in TIRFm buffer with 15 mM glucose, 20 µg/mL catalase, 100 µg/mL glucose oxidase, 1 mM DTT and 0.25% methyl-cellulose (4000 cp). Conditions were each repeated in triplicate with consistent results. Scale bar = 5 µm.
Figure 5—figure supplement 1

Additional cosedimentation experiments and controls corresponding to Figure 5.
(A) Liposome co-sedimentation assay with purified vinculin fragments (2.5 µM), with and without Tn2 (1 µM). Proteins were incubated with liposomes of the following composition: 0.55 DOPC, 0.15 DOPE, 0.1 DOPS, 0.20 PI(4,5)P2 by molar ratio. Representative Coomassie-stained SDS-PAGE of pellet samples for each condition. Graph shows mean densitometry and individual values from three independent samples for vinculin proteins alone (black) and with Tn2 (gray). (B) Liposome co-sedimentation of VnTail-SNAP or VnTail3Q-SNAP(2.5 µM) with (black) or without (gray) Tn2 with liposomes of the following composition: 0.55 DOPC, 0.15 DOPE, 0.1 DOPS, 0.20 PI(4,5)P2 by molar ratio. Representative Coomassie-stained SDS-PAGE of pellet and supernatant samples for each condition, and graph of individual data points and mean densitometry ± SD of three individual experiments. (C) Control samples without liposomes for cosedimentation experiments shown in (A) and (B). (D) Control samples without liposomes for cosedimentation experiment shown in Figure 5A. (E) Control samples without actin for cosedimentation experiment shown in Figure 5C.
Figure 5—figure supplement 2
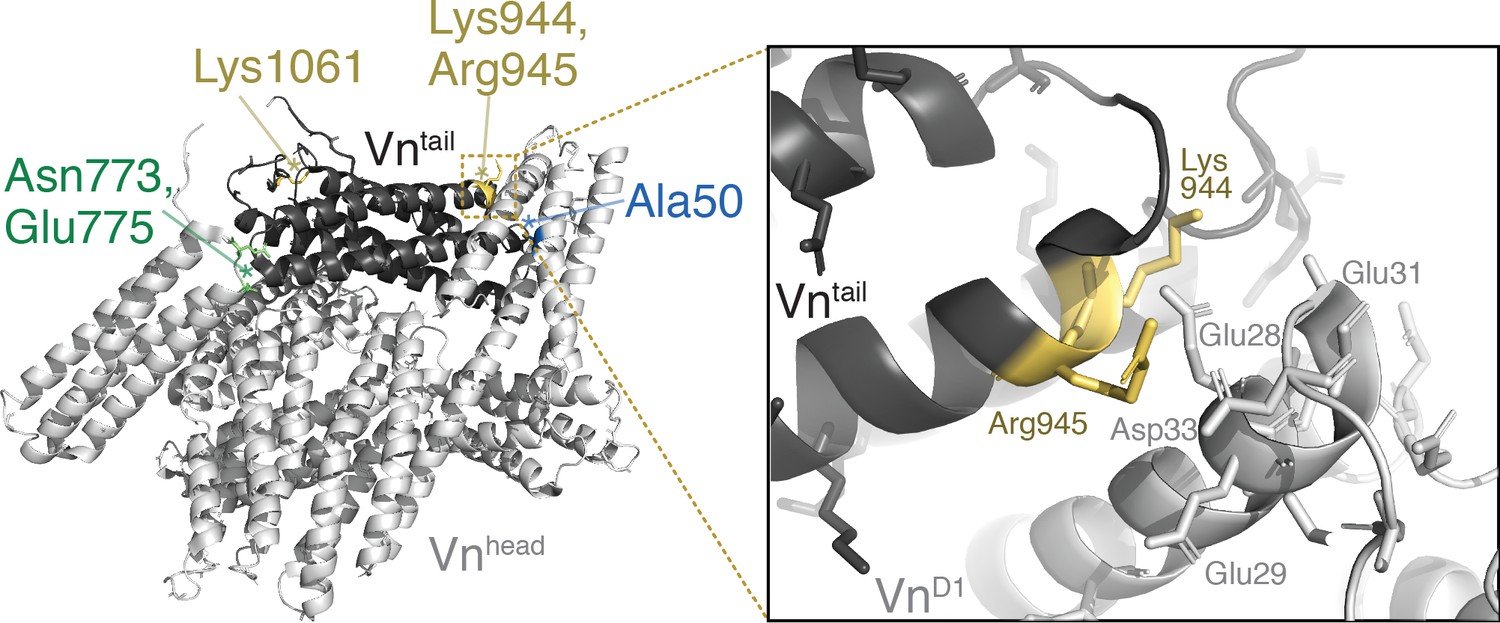
Lipid-binding residues are located at the vinculin tail-D1 interface.
Crystal structure of full-length human vinculin (PDB: 1TR2, Borgon et al., 2004) with Tn binding site A50 (blue), autoinhibitory residues N773, E775 (green), and lipid binding sites K944,R945,K1061 (yellow) highlighted, and a zoomed-in view of the vinculin D1-tail interface near residues K944,R945.
Figure 6 with 5 supplements
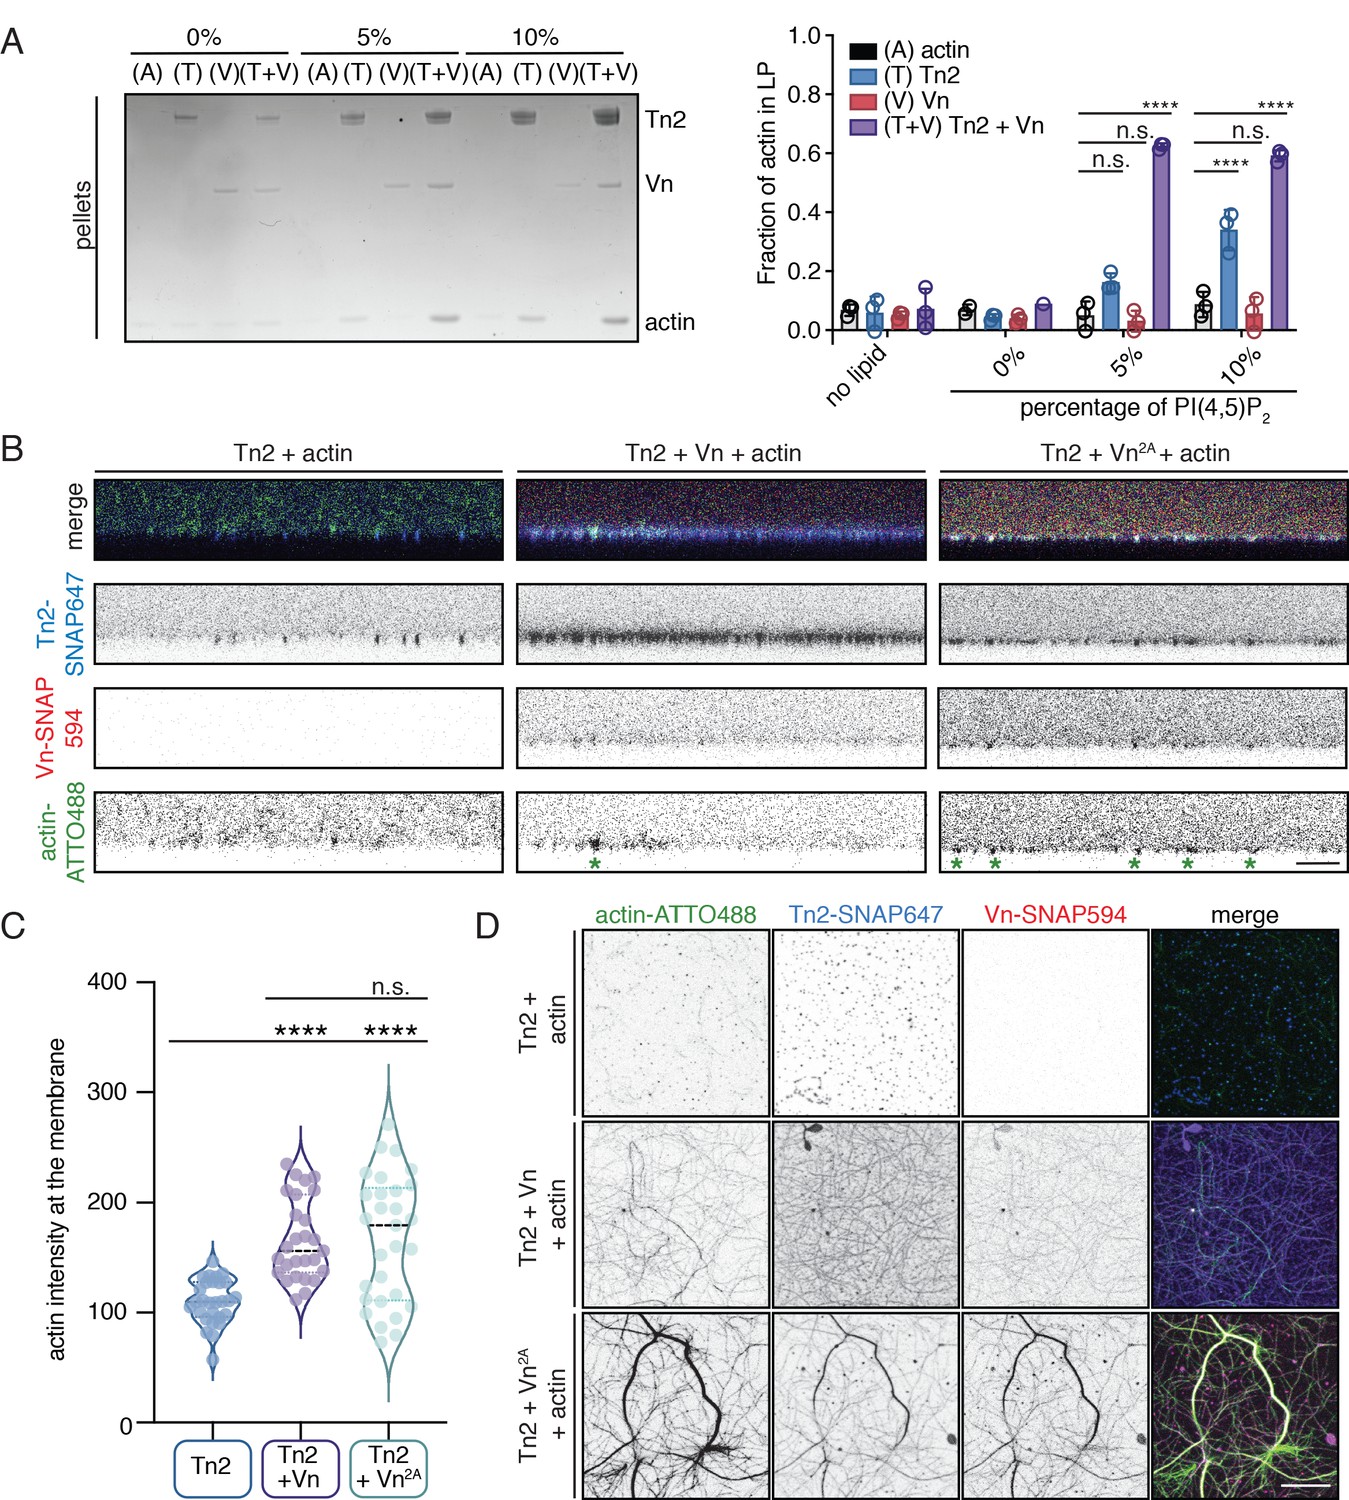
Talin and vinculin recruit actin to PI(4,5)P2-rich membranes.
(A) Actin bundling co-sedimentation assay with liposomes of the following composition: 0.75-X DOPC, 0.15 DOPE, 0.1 DOPS, X PI(4,5)P2. FA proteins (2.5 µM) were pre-incubated with liposomes, followed by the addition of G-actin (2.5 µM). Final buffer conditions were 20 mM HEPES pH 7.5, 20 mM NaCl, 85 mM KCl, 1.6 mM MgCl2, 0.16 mM ATP. After actin polymerization, samples were centrifuged to sediment liposomes and membrane-associated proteins (10,000 x g). Representative Coomassie-stained SDS-PAGE of pellet samples for different combinations of FA proteins with actin, with increasing amounts of PI(4,5)P2. Graph shows mean densitometry and individual values from three independent samples. Related data are shown in Figure 6—figure supplement 1. (B) Side-view confocal images of Tn2, Tn2+Vn, and Tn2+Vn2A with actin on 5% PI(4,5)P2 supported lipid bilayers after 45 min of actin polymerization, carried out in TIRFm buffer with 15 mM glucose, 20 µg/mL catalase, 100 µg/mL glucose oxidase. Reaction components are as follows: 1 µM actin (10% actin-ATTO488) (green), 0.5 µM Tn2, 0.5 µM Tn2-SNAP647 (blue), 1 µM Vn-SNAP594 or Vn2A-SNAP594 (red). Actin bundles appear as bright spots at the membrane surface, indicated by green asterisks for the grayscale actin images. See Figure 6—figure supplements 2 and 3, Figure 6—videos 1 and 2 for additional data from SLB experiments. (C) Comparison of the actin signal at the membrane surface for Tn2, Tn2+Vn, and Tn2+Vn2A after 45 min of actin polymerization. Measurements were taken from three independent experiments, at least nine images from each. ****p<0.0005, one-way ANOVA. (D) Top view of SLBs after 45 min of actin polymerization. Projections of 3-slice z-stack at the membrane surface for each condition tested. Scale bar = 10 µm.
Figure 6—figure supplement 1
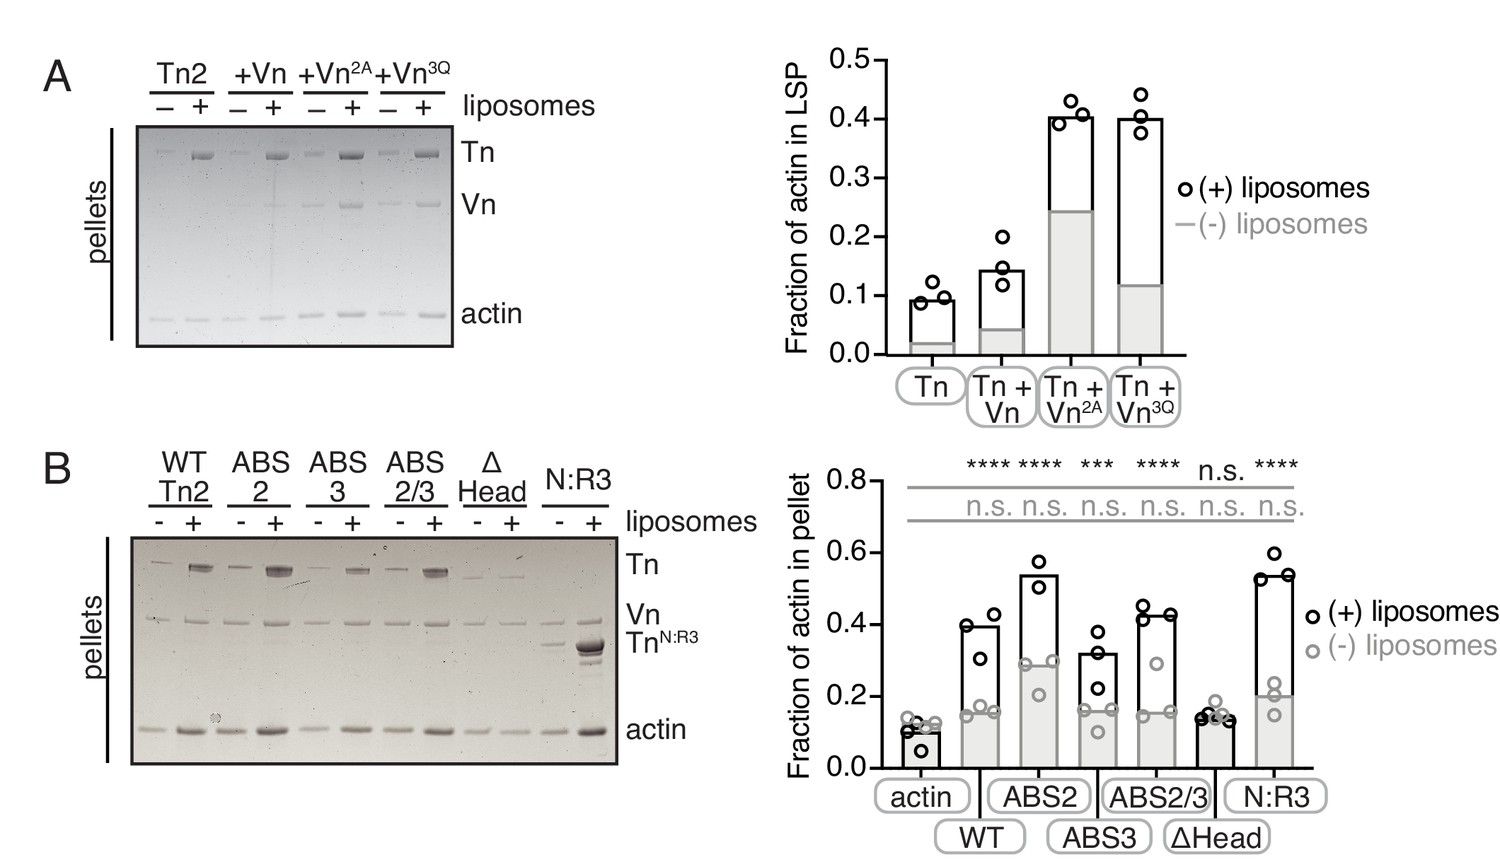
Additional cosedimentation experiments corresponding to Figure 6.
Actin bundling co-sedimentation assays with liposomes (white) and without liposomes (gray) of the following composition: 0.7 DOPC, 0.15 DOPE, 0.1 DOPS, 0.05 PI(4,5)P2. FA proteins (2.5 µM) are pre-incubated with liposomes, followed by the addition of G-actin (2.5 µM). After actin polymerization, samples are centrifuged to sediment liposomes and membrane-associated proteins (10,000 x g). Representative Coomassie-stained SDS-PAGE of pellet samples for Tn2 with vinculin mutants (A) and Vn with talin2 mutants (B). Graphs shows mean densitometry and individual values from three independent reactions. Final buffer conditions are 20 mM HEPES pH 7.5, 20 mM NaCl, 85 mM KCl, 1.6 mM MgCl2, 0.16 mM ATP.
Figure 6—figure supplement 2
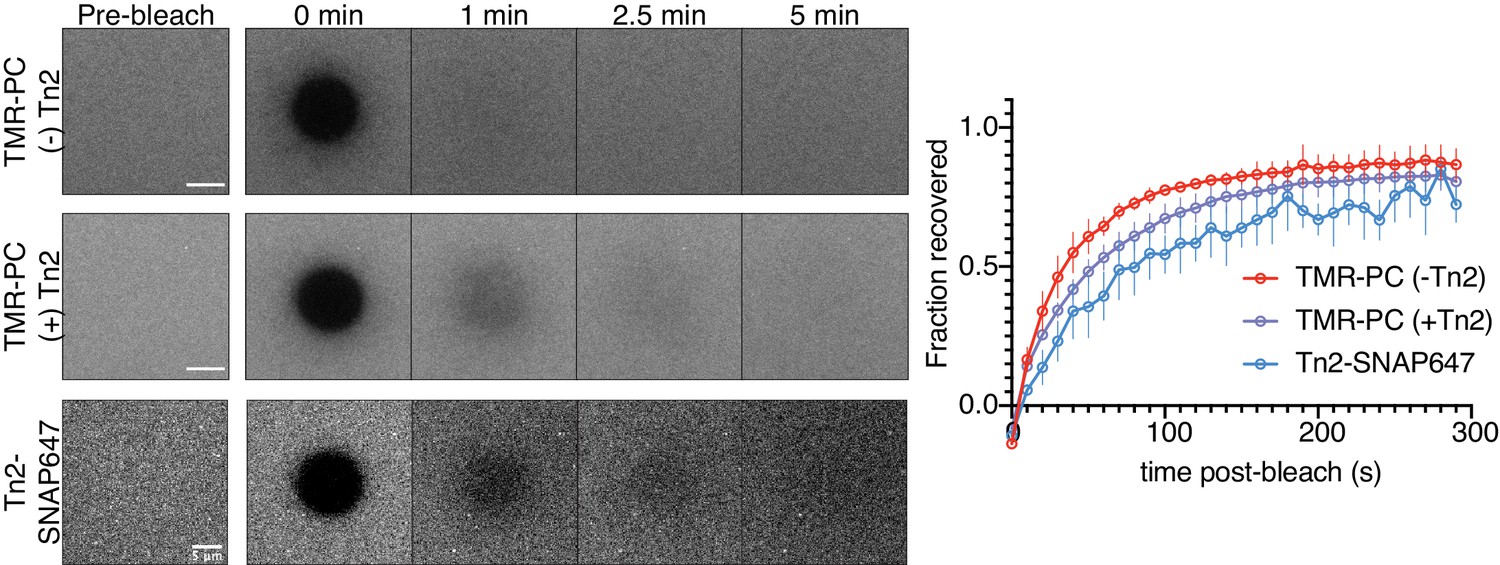
Fluorescence recovery after photobleaching of TMR-PC SLBs, with and without Tn2.
Representative time-course and quantification of bleaching and recovery of labeled TMR-PC and membrane-bound Tn2 on 5% PI(4,5)P2-containing SLB. These results are from two separate experiments. The talin measurements are from the experiments described in Figure 6B–D, without labeled lipid. The TMR-PC results are from control samples measured before (top, blue) and after (middle, purple) addition of 500 nM Tn2. Scale bars = 5 µm.
-
Figure 6—figure supplement 2—source data 1
source data corresponding to Figure 6—figure supplement 2.
- https://cdn.elifesciences.org/articles/56110/elife-56110-fig6-figsupp2-data1-v2.xlsx
Figure 6—figure supplement 3
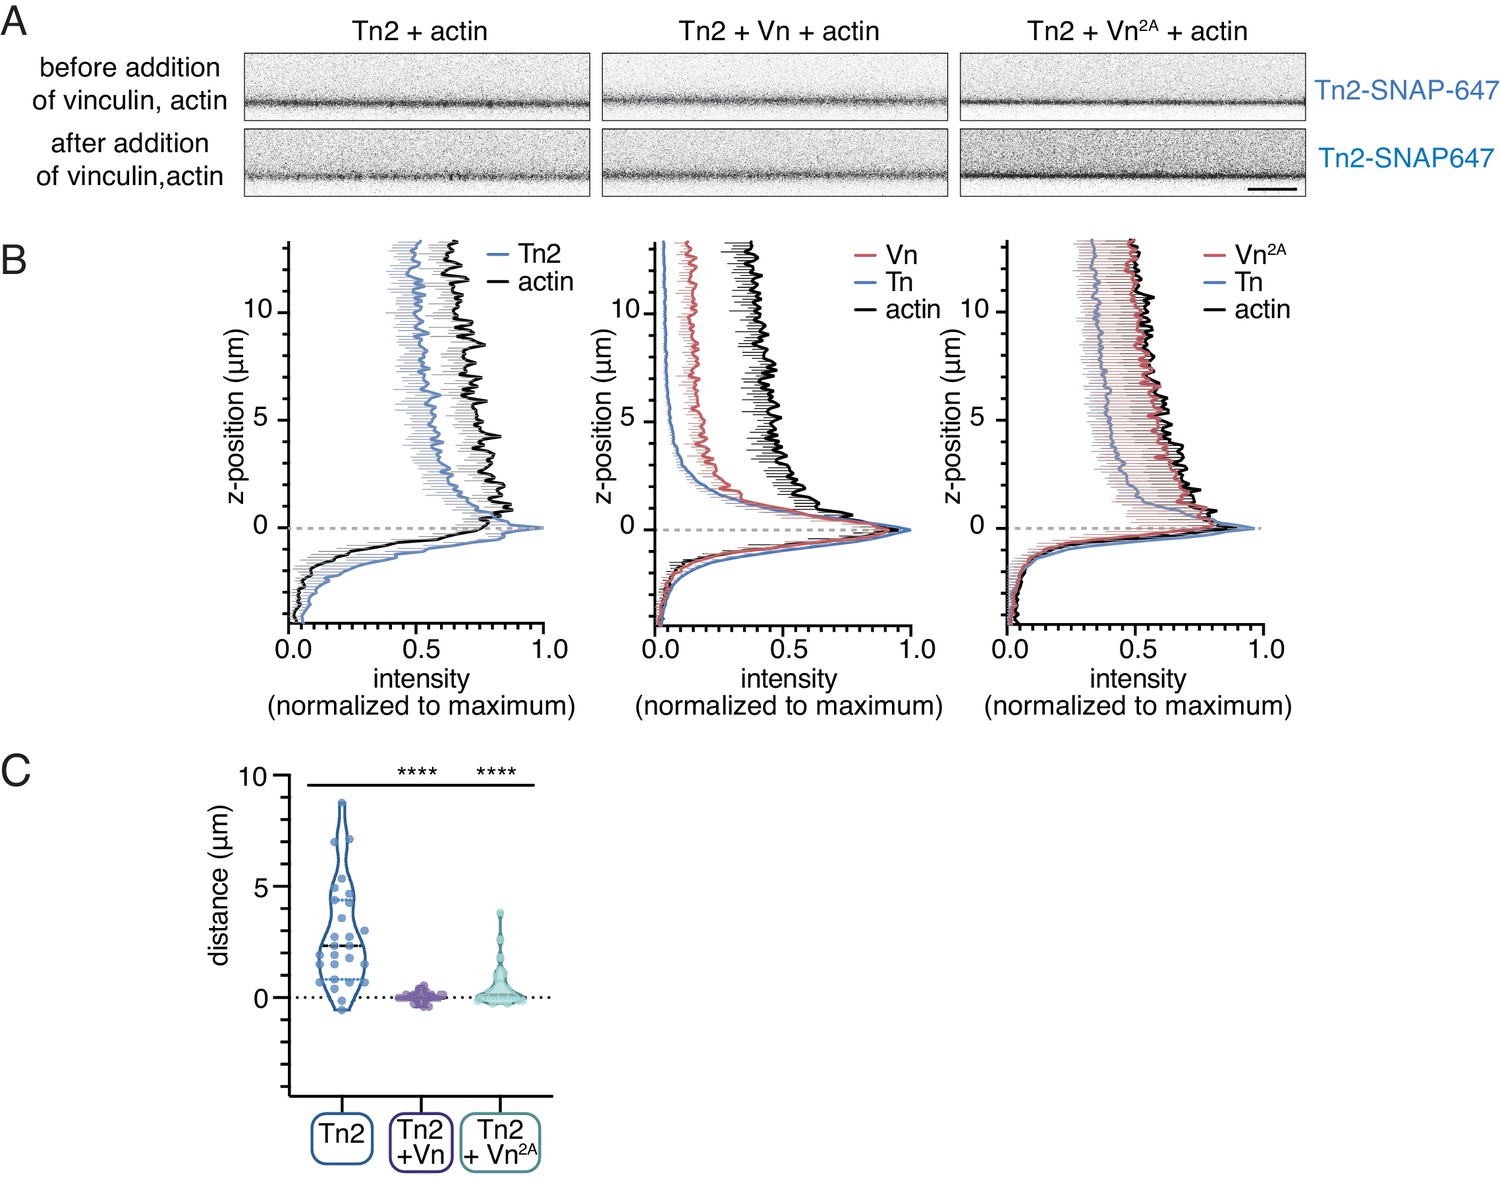
Talin-vinculin interactions regulate actin localization at PIP2-containing SLBs.
(A) Side-view confocal image of Tn2 bound to the SLB after 15 min incubation, before FRAP test (top), and immediately after addition of Vn and actin, before 45 time-course (bottom). Scale bar = 10 µm. SLB experiments are performed in TIRFm buffer with 15 mM glucose, 20 µg/mL catalase, 100 µg/mL glucose oxidase. (B) Quantification of Tn-SNAP647, Vn-SNAP594, and actin-ATTO488 signals after 45 min of actin polymerization. Intensities have been normalized to maximum and background subtracted using the area below the SLB. Z-position = 0 has been set to the position of maximum Tn-SNAP647 signal, which indicates the location of the lipid bilayer. These graphs represent quantification of at least nine images from the samples depicted in Figure 6B. Each condition was repeated at least three times with consistent results. (C) Quantification of the approximate distance between the peak Tn2 and actin signals. While the peaks overlap consistently in the presence of both Vn and Vn2A, in the absence of vinculin the distance between the Tn2 peak at the membrane and peak actin signal is larger and more variable.
-
Figure 6—figure supplement 3—source data 1
source data corresponding to Figure 6C and Figure 6—figure supplement 3B.
- https://cdn.elifesciences.org/articles/56110/elife-56110-fig6-figsupp3-data1-v2.xlsx
Figure 6—video 1
Side view of actin polymerization in the presence of PIP2-containing SLBs under different conditions.
Confocal xz timelapse of actin polymerization with 5% PI(4,5)P2 SLB and Tn2 (left), Tn2 and Vn (middle), and Tn2 and Vn2A (right). Reaction components are as follows: 1 µM actin (10% actin-ATTO488) (green), 0.5 µM Tn2, 0.5 µM Tn2-SNAP647 (blue), 1 µM Vn-SNAP594 or Vn2A-SNAP594 (red). Video playback is seven frames per second.
Figure 6—video 2
Actin organization differs in the presence of talin and vinculin or vinculin2A.
Rotating 3D view of confocal z-stack with 20 × 0.3 µm slices (6 µm total thickness) of actin with 5% PI(4,5)P2 SLB and Tn2 (left), Tn2 and Vn (middle), and Tn2 and Vn2A (immediately after 45 min of polymerization. Reaction components are as follows: 1 µM actin (10% actin-ATTO488) (green), 0.5 µM Tn2, 0.5 µM Tn2-SNAP647 (blue), 1 µM Vn-SNAP594 or Vn2A-SNAP594 (red). Video playback is seven frames per second.
Figure 7 with 2 supplements
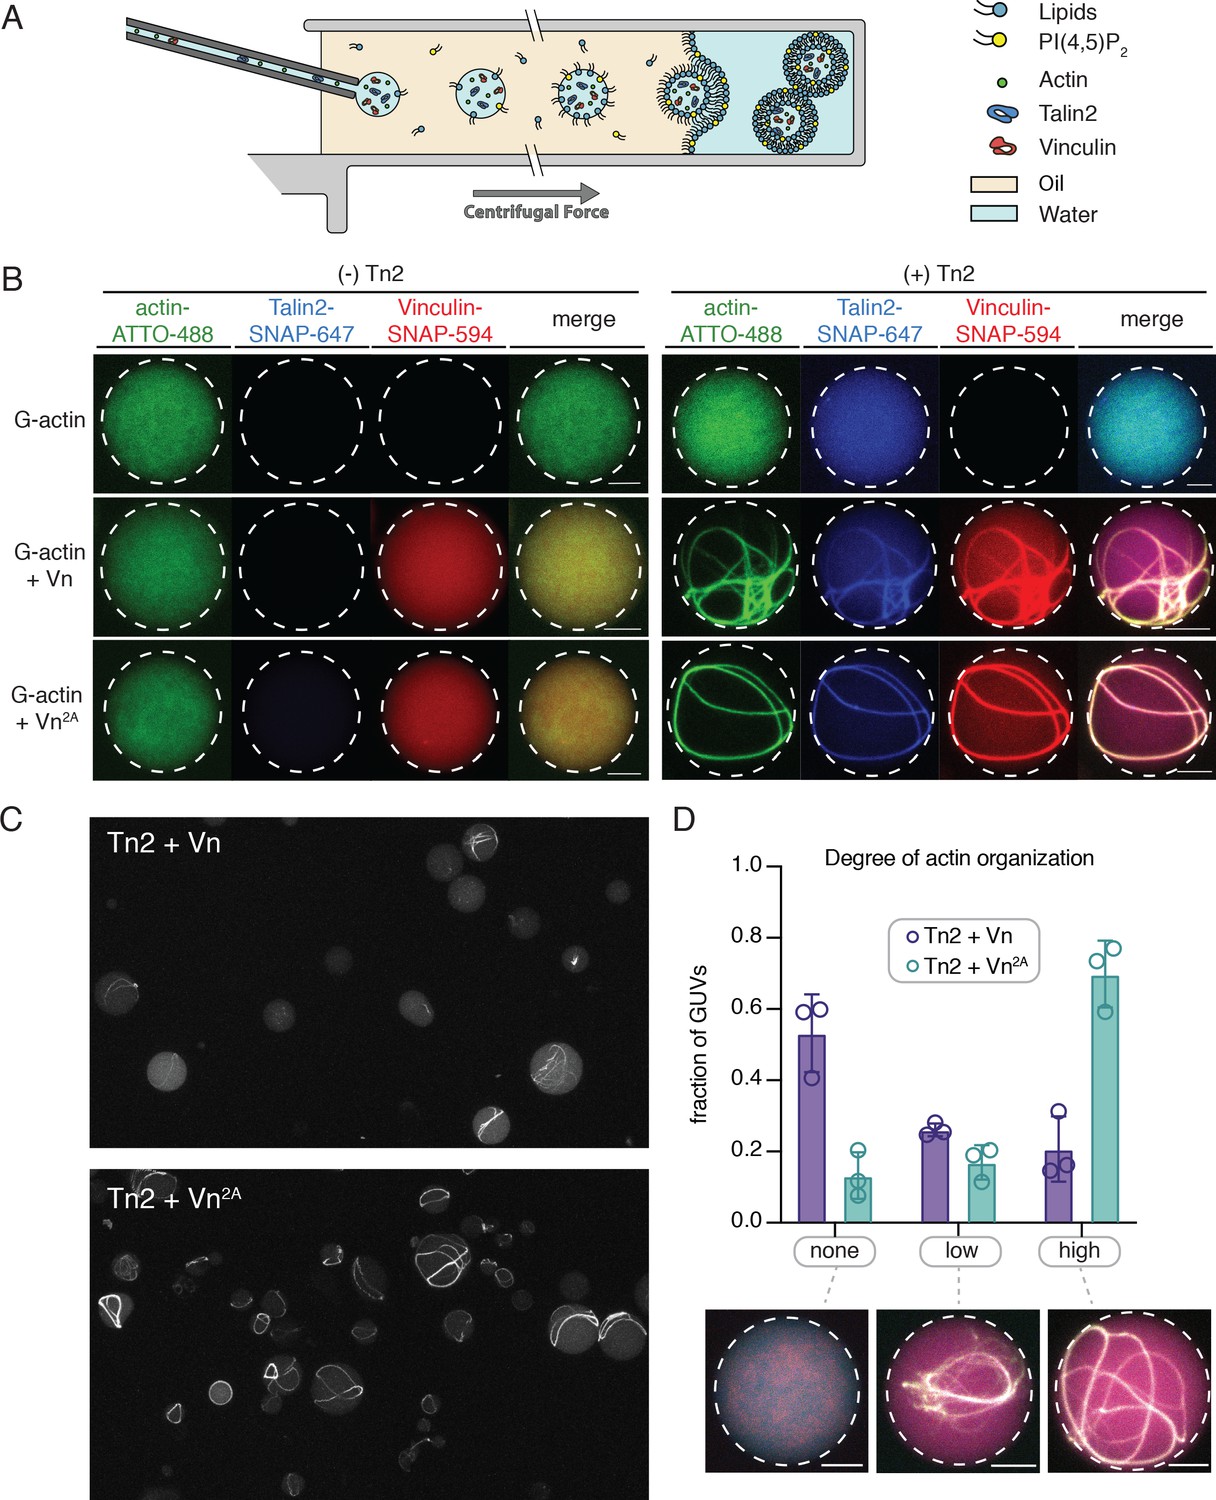
Encapsulated talin and vinculin reorganizes F-actin into highly bundled and cross-linked structures.
(A) Schematic of vesicle encapsulation of FA proteins with cDICE. (B) Representative confocal images of individual GUVs (0.975 DOPC, 0.025 PI(4,5)P2) with encapsulated actin, Tn and Vn carried out in TIRFm buffer. Membrane surface indicated by dotted white lines. Scale bars = 5 µM. (C) Field of view confocal image of GUVs formed using cDICE, encapsulating Tn2 with Vn or Vn2A, and G-actin (10% actin-ATTO488) (2 µM) under polymerizing conditions. (D) Comparison of actin organization in vesicles with Tn2 and either Vn or Vn2A. The number of actin bundles, from three independent experiments for each condition, was used to characterize the degree of actin reorganization within the vesicles, n = 531 (Vn2A), 398 (Vn). Scale bars = 2.5 µm. See also Figure 7—figure supplement 1 and Figure 7—video 1.
Figure 7—figure supplement 1

MinDE oscillations indicate successful incorporation of PIP2 in cDICE-generated vesicles.
Encapsulation experiment with oscillating proteins MinD and MinE. The proteins form a complex on negatively charged membranes which cooperatively bind/unbind. Here, they were used to confirm that the bilayer formed during encapsulation includes PI(4,5)P2, as their oscillations depend on acidic phospholipids. (A) Confocal images of a PI(4,5)P2-containing vesicle containing oscillating MinDE proteins, showing a cross-section of the vesicle, demonstrating cyclical membrane binding-unbinding. (B) Kymograph (dotted white line in (A)) showing cyclical changes in Min protein localization, dependent on acidic phospholipids. (C) Graphical comparison of MinD intensity in lumen, at membrane surface after encapsulation in PI(4,5)P2-containing vesicles. Scale bar = 5 µm.
Figure 7—video 1
Rotating 3D views of encapsulated focal adhesion proteins from Figure 7B.
Figure 8 with 1 supplement
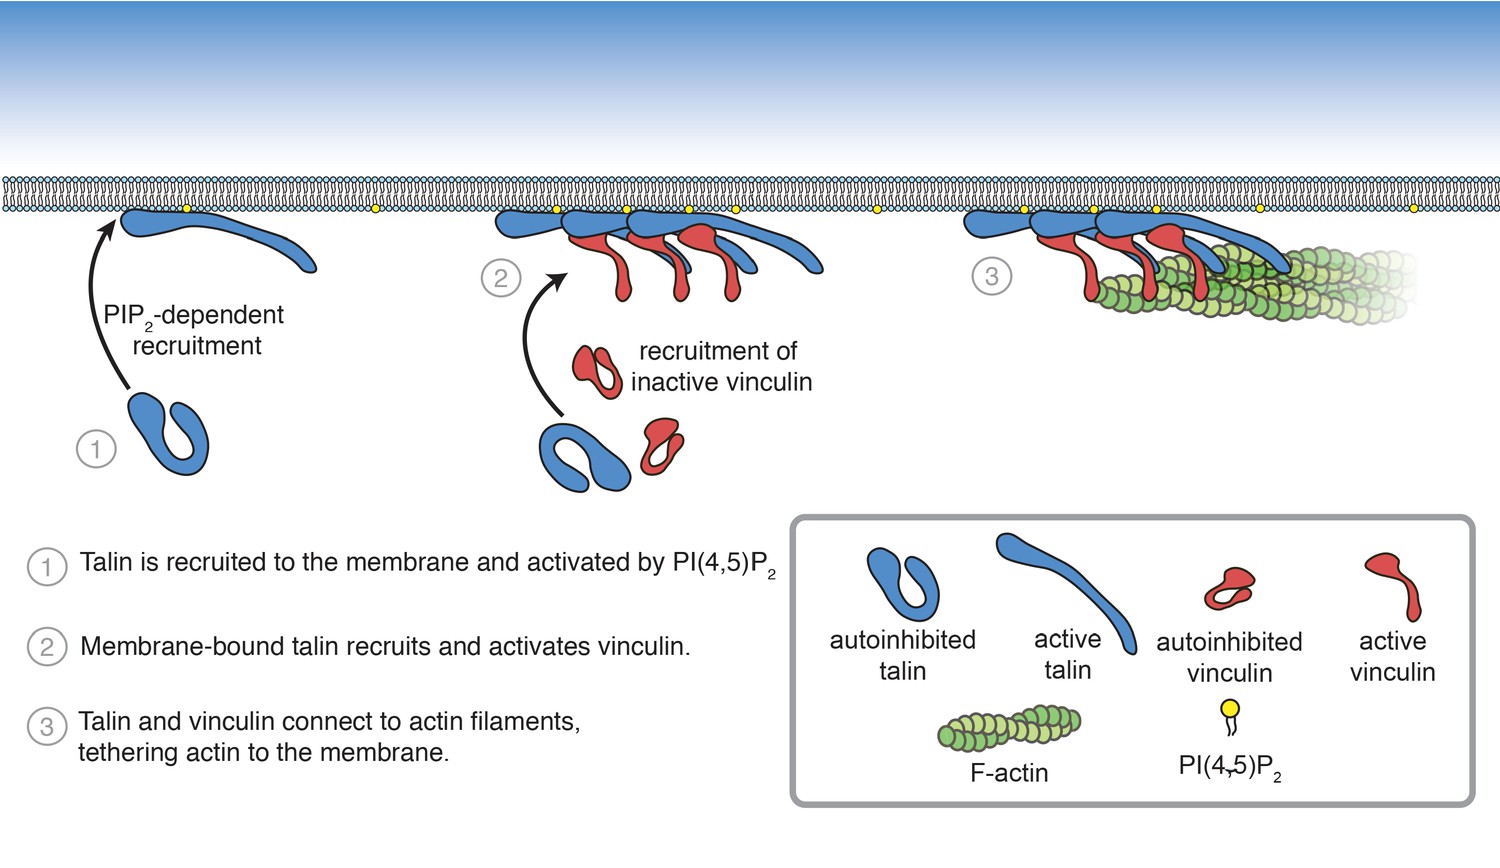
Summary of PI(4,5)P2-mediated talin and vinculin activation, and attachment of actin to the membrane surface.
Figure 8—figure supplement 1
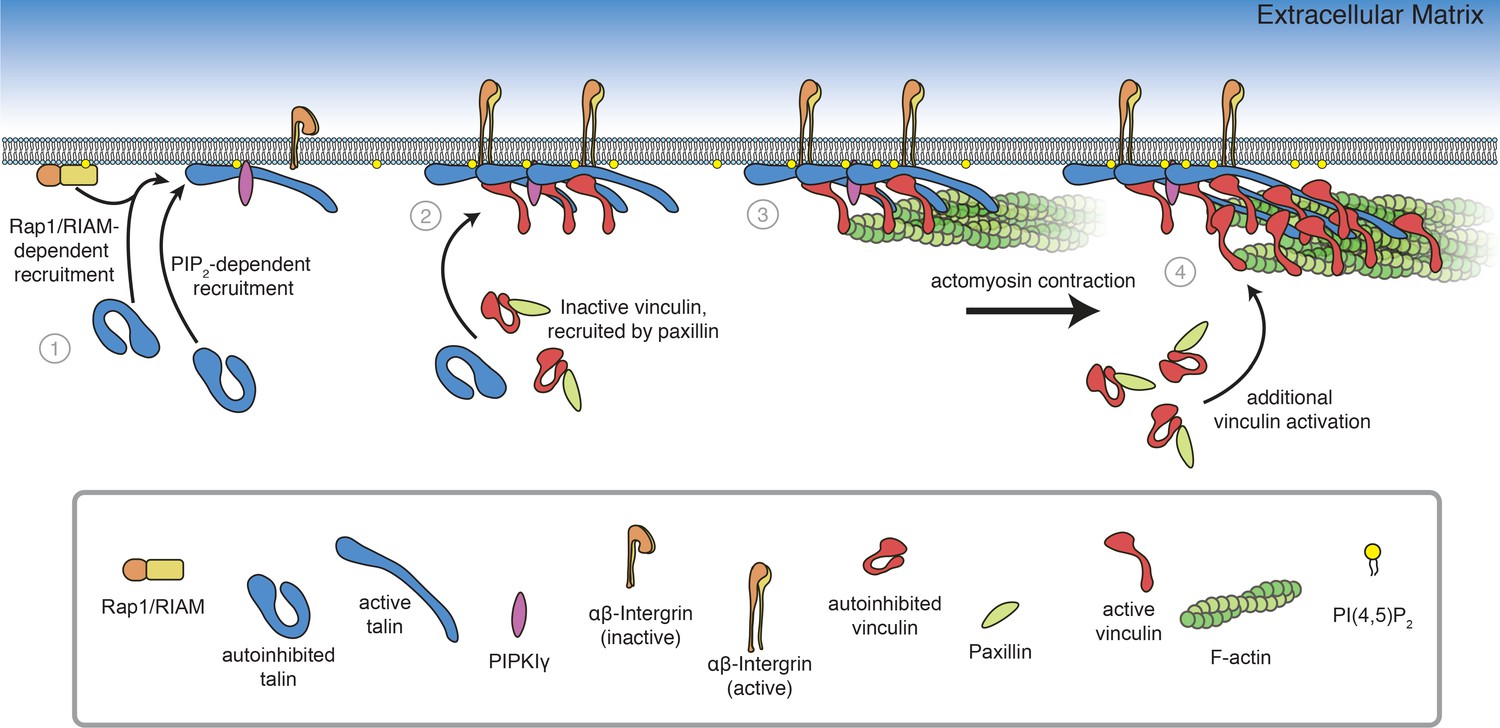
Model of FA assembly.
(1) Rap1/RIAM recruit talin to the membrane (Goult et al., 2013b; Gingras et al., 2019; Bromberger et al., 2019), where talin binds and activates PIPKIγ, inducing local PI(4,5)P2 synthesis (Di Paolo et al., 2002; Ling et al., 2002) and additional talin activation at the membrane. (2) Membrane-bound talin binds to and activates integrin receptors and vinculin, recruited by paxillin (Case et al., 2015). (3) Talin-vinculin complexes link actin to the membrane. Actomyosin contraction places talin and vinculin under tension (Grashoff et al., 2010; Kumar et al., 2016). (4) Mechanosensitive domains in the talin rod unfold, revealing additional binding sites for vinculin, triggering additional protein engagement, and leading to FA maturation (del Rio et al., 2009, Yao et al., 2015, Atherton et al., 2020).
Author response image 1
Comparison of talin1 and talin2 in an actin bundling (low speed; 10,000 x g) and binding (high speed; 100,000 x g) co-sedimentation assay with pre-polymerized filamentous actin (2.
5 µM) and purified FA proteins (2.5 µM).
Tables
Key resources table
| Reagent type (species) or resource | Designation | Source or reference | Identifiers | Additional information |
|---|---|---|---|---|
| Gene (Homo sapiens) | TLN2 | Human Genome Nomenclature Database | HGNC:15447 | |
| Gene (Homo sapiens) | VCL | Human Genome Nomenclature Database | HGNC:12665 | |
| Strain, strain background (Escherichia coli) | BL21-Gold (DE3) | Agilant | Cat# 230132 | |
| Strain, strain background (Escherichia coli) | XL1-Blue | Agilant | Cat# 200249 | |
| Recombinant DNA reagent | pCB-a-bax33-hsTln2-3C-SNAP-6His | This paper, Subcloned from gift from Carsten Grashoff | includes L435G mutation to reduce calpain cleavage | |
| Recombinant DNA reagent | pCB-a-bax33-hsTln2ABS2-3C-SNAP-6His | This paper | L435G, K925E, Q926E, Q933E, R1502E, R1512E, K1524E | |
| Recombinant DNA reagent | pCB-a-bax33-hsTln2ABS3-3C-SNAP-6His | This paper | L435G, K2244D, K2245D, K2246D | |
| Recombinant DNA reagent | pCB-a-bax33-hsTln2ABS2/3-3C-SNAP-6His | This paper | L435G, K925E, Q926E, Q933E, R1502E, R1512E, K1524E, K2244D, K2245D, K2246D | |
| Recombinant DNA reagent | pCB-a-bax33-hsTln2N:R3-3C-SNAP-6His | This paper | Tln2(1-910) with L435G mutation | |
| Recombinant DNA reagent | pCB-a-bax33-hsVcl-3C-SNAP-6His | This paper, Subcloned from gift from Carsten Grashoff | ||
| Recombinant DNA reagent | pCB-a-bax33-hsVcl2A-3C-SNAP-6His | This paper | N773A,E775A | |
| Recombinant DNA reagent | pCB-a-bax33-hsVclD1-3C-SNAP-6His | This paper | Vcl(1-258) | |
| Rcombinant DNA reagent | pCB-a-bax33-hsVclHead-3C-SNAP-6His | This paper | Vcl(1-823) | |
| Recombinant DNA reagent | pCB-a-bax33-hsVclTali-3C-SNAP-6His | This paper | Vcl(878–1066) | |
| Recombinant DNA reagent | pCB-a-bax33-hsVclTail3Q-3C-SNAP-6His | This paper | Vcl(878–1066) K944Q, R944Q, K1061Q | |
| Recombinant DNA reagent | pCB-a-bax33-hsVcl3Q-3C-SNAP-6His | This paper | K944Q, R945Q, K1061Q | |
| Peptide, recombinant protein | 3C-6his protease | This lab | Purified from E. coli- BL21-Gold (DE3) | |
| Peptide, recombinant protein | Actin Rabbit skeletal muscle alpha actin | Hypermol | Cat# 8101–01 | |
| Peptide, recombinant protein | Actin-ATTO488 Rabbit skeletal muscle alpha actin | Hypermol | Cat# 8153–02 | |
| Peptide, recombinant protein | Actin-ATTO488-TIRF Rabbit skeletal muscle alpha actin | Hypermol | Cat# 8153–03 | |
| Peptide, recombinant protein | Actin-biotin Rabbit skeletal muscle alpha actin | Hypermol | Cat# 8109–01 | |
| Peptide, recombinant protein | VBS (vinculin activating peptide) | Hypermol | Cat# 8317–01 | Derived from C-terminal talin sequence |
| Peptide, recombinant protein | NeutrAvidin | Thermo Fischer Scientific | 31000 | |
| Chemical compound, drug | mPEG-silane, MW 2000 | Laysan Bio Inc | Cat# MPEG-SIL-2000–1 g | |
| Chemical compound, drug | mPEG-silane-biotin. MW 3400 | Laysan Bio Inc | Cat# Biotin-PEG-SIL-3400–1 g | |
| Chemical compound, drug | Methyl Cellulose | Acros Organics | Cat# 10287200 | viscosity 4000 c |
| Peptide, recombinant protein | Glucose Oxidase Type II | Sigma Aldrich Chemie GmbH | G6125 | From aspergillus |
| Peptide, recombinant protein | Catalase | Sigma Aldrich Chemie GmbH | E3289 | From bovine liver |
| Software, algorithm | FIJI | https://imagej.net/Fiji/Downloads | ||
| Software, algorithm | Prism | Graphpad | https://www.graphpad.com/scientific-software/prism/ | |
| Other | DOPC (18:1 (Δ9-Cis) PC) | Avanti Polar Lipids | Cat# 850375 | 1,2-dioleoyl-sn-glycero-3-phosphocholine |
| Other | DOPE (18:1 (Δ9-Cis) PE) | Avanti Polar Lipids | Cat# 850725 | 1,2-dioleoyl-sn-glycero-3-phosphoethanolamine |
| Other | DOPS (18:1 PS) | Avanti Polar Lipids | Cat# 840035 | 1,2-dioleoyl-sn-glycero-3-phospho-L-serine (sodium salt) |
| Other | TopFluor TMR PC | Avanti Polar Lipids | Cat# 810180 | 1-oleoyl-2-(6-((4,4-difluoro-1,3-dimethyl-5-(4-methoxyphenyl)-4-bora-3a,4a-diaza-s-indacene-2-propionyl)amino)hexanoyl)-sn-glycero-3-phosphocholine |
| Other | Brain PI(4,5)P2 | Avanti Polar Lipids | Cat# 840046 | L-α-phosphatidylinositol-4,5-bisphosphate (Brain, Porcine) (ammonium salt) |
| Other | 18:0-20:4 PI(4,5)P2 synthetic | Avanti Polar Lipids | Cat# 850165 | 1-stearoyl-2-arachidonoyl-sn-glycero-3-phospho-(1'-myo-inositol-4',5'-bisphosphate) |
| Other | sticky-Slide VI 0.4 | Ibidi | Cat# 80608 |
Additional files
Download links
A two-part list of links to download the article, or parts of the article, in various formats.
Downloads (link to download the article as PDF)
Open citations (links to open the citations from this article in various online reference manager services)
Cite this article (links to download the citations from this article in formats compatible with various reference manager tools)
Phosphoinositides regulate force-independent interactions between talin, vinculin, and actin
eLife 9:e56110.
https://doi.org/10.7554/eLife.56110


