Nucleosome-CHD4 chromatin remodeler structure maps human disease mutations
- Max Planck Institute for Biophysical Chemistry, Department of Molecular Biology, Germany
Figures
Figure 1 with 4 supplements

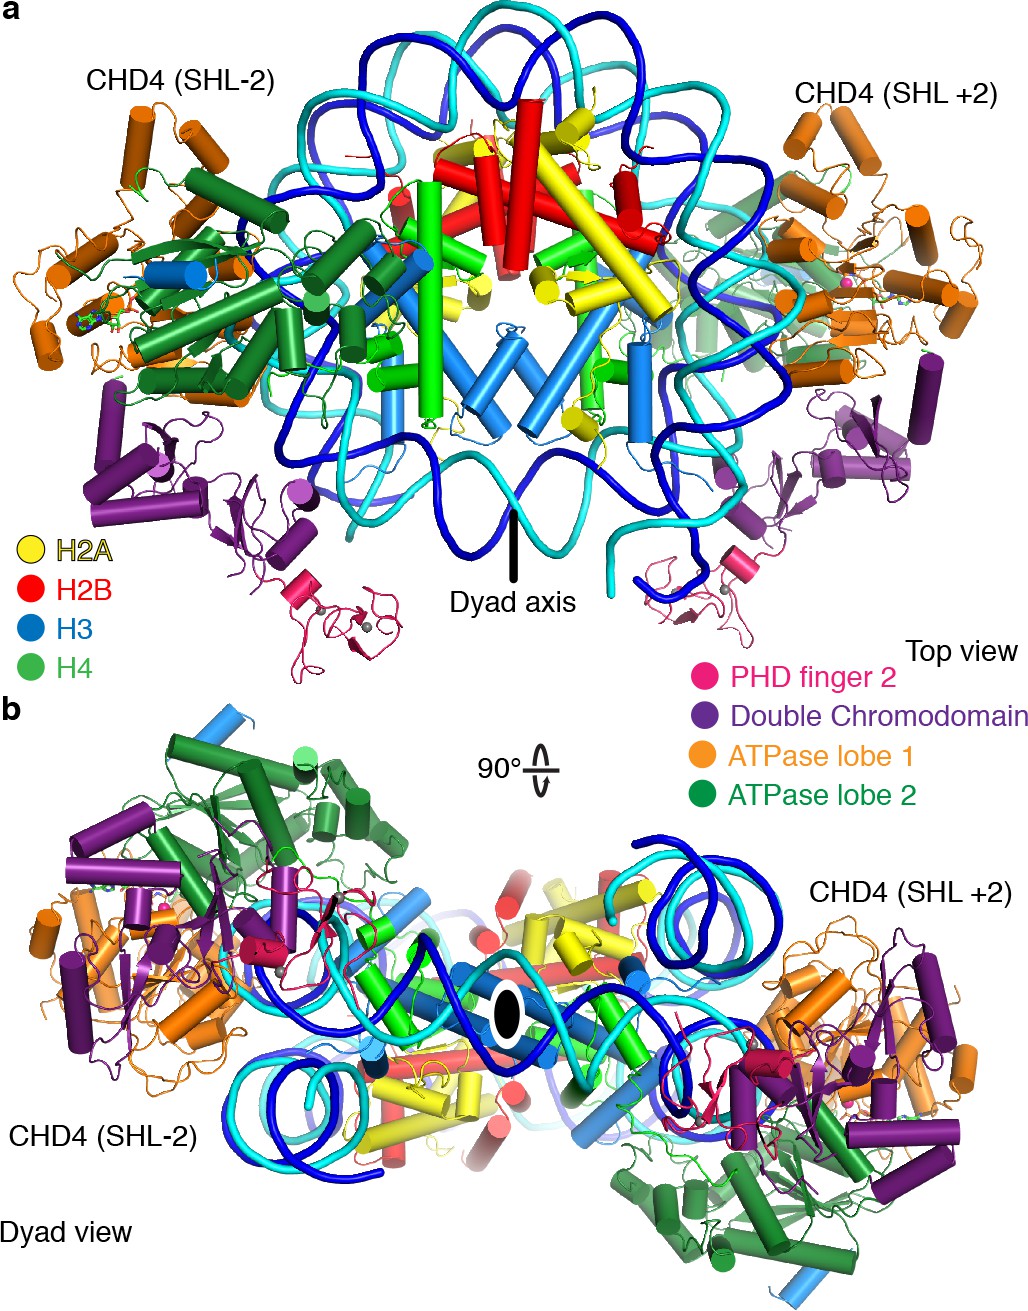
Structure of the nucleosome-CHD4 complex.
(a) Schematic of domain architecture of CHD4. Domain borders are indicated. (b-d) Cartoon model viewed from the top (b), dyad (c), and side (d). Histones H2A, H2B, H3, H4, tracking strand, guide strand, CHD4 PHD finger 2, double chromodomain, ATPase lobe 1, and ATPase lobe 2 are colored in yellow, red, light blue, green, blue, cyan, pink, purple, orange, and forest green, respectively. Color code used throughout. The dyad axis is indicated as a black line or a black oval circle. Magnesium and zinc ions shown as pink and grey spheres, respectively. AMP-PNP shown in stick representation.
Figure 1—figure supplement 1
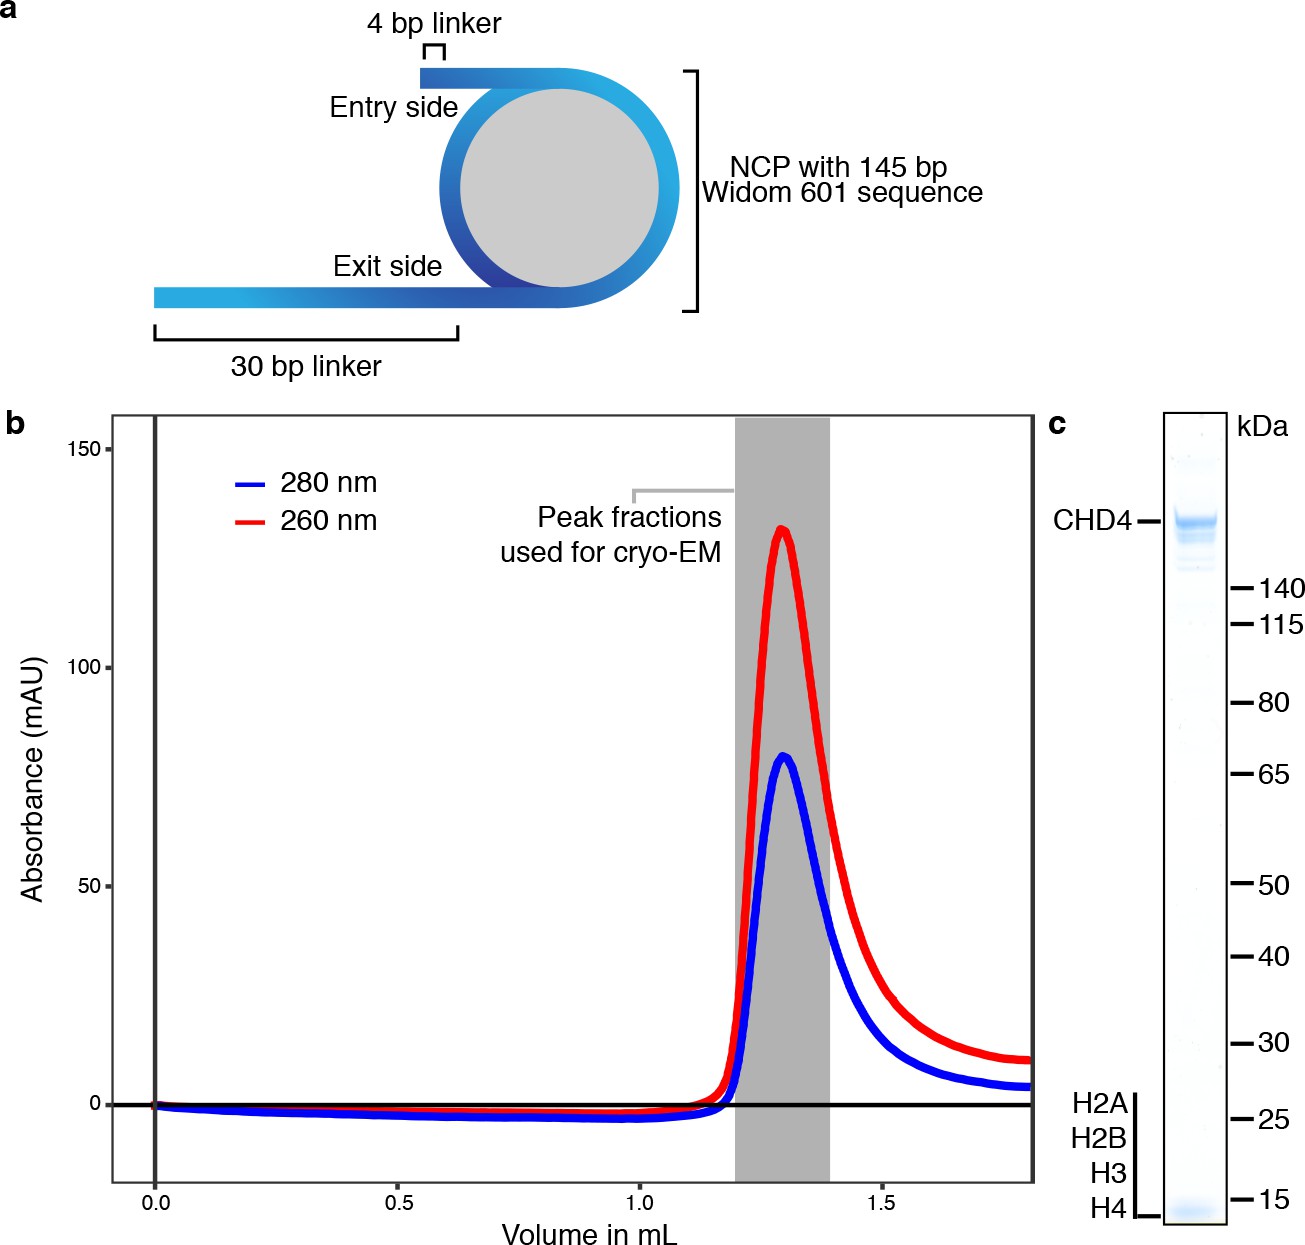
Formation of the nucleosome-CHD4 complex.
(a) Schematic of DNA construct to form nucleosome-CHD4 complex. Extranucleosomal DNA length, entry, and exit sides are indicated. (b) Formation of the nucleosome-CHD4 complex on a Superose 6 Increase 3.2/30 size exclusion chromatography column. Red and blue curve shows absorption at 260 nm and 280 nm milli absorption units, respectively. (c) SDS-PAGE gel with peak fraction containing the formed nucleosome-CHD4 complex.
Figure 1—figure supplement 2
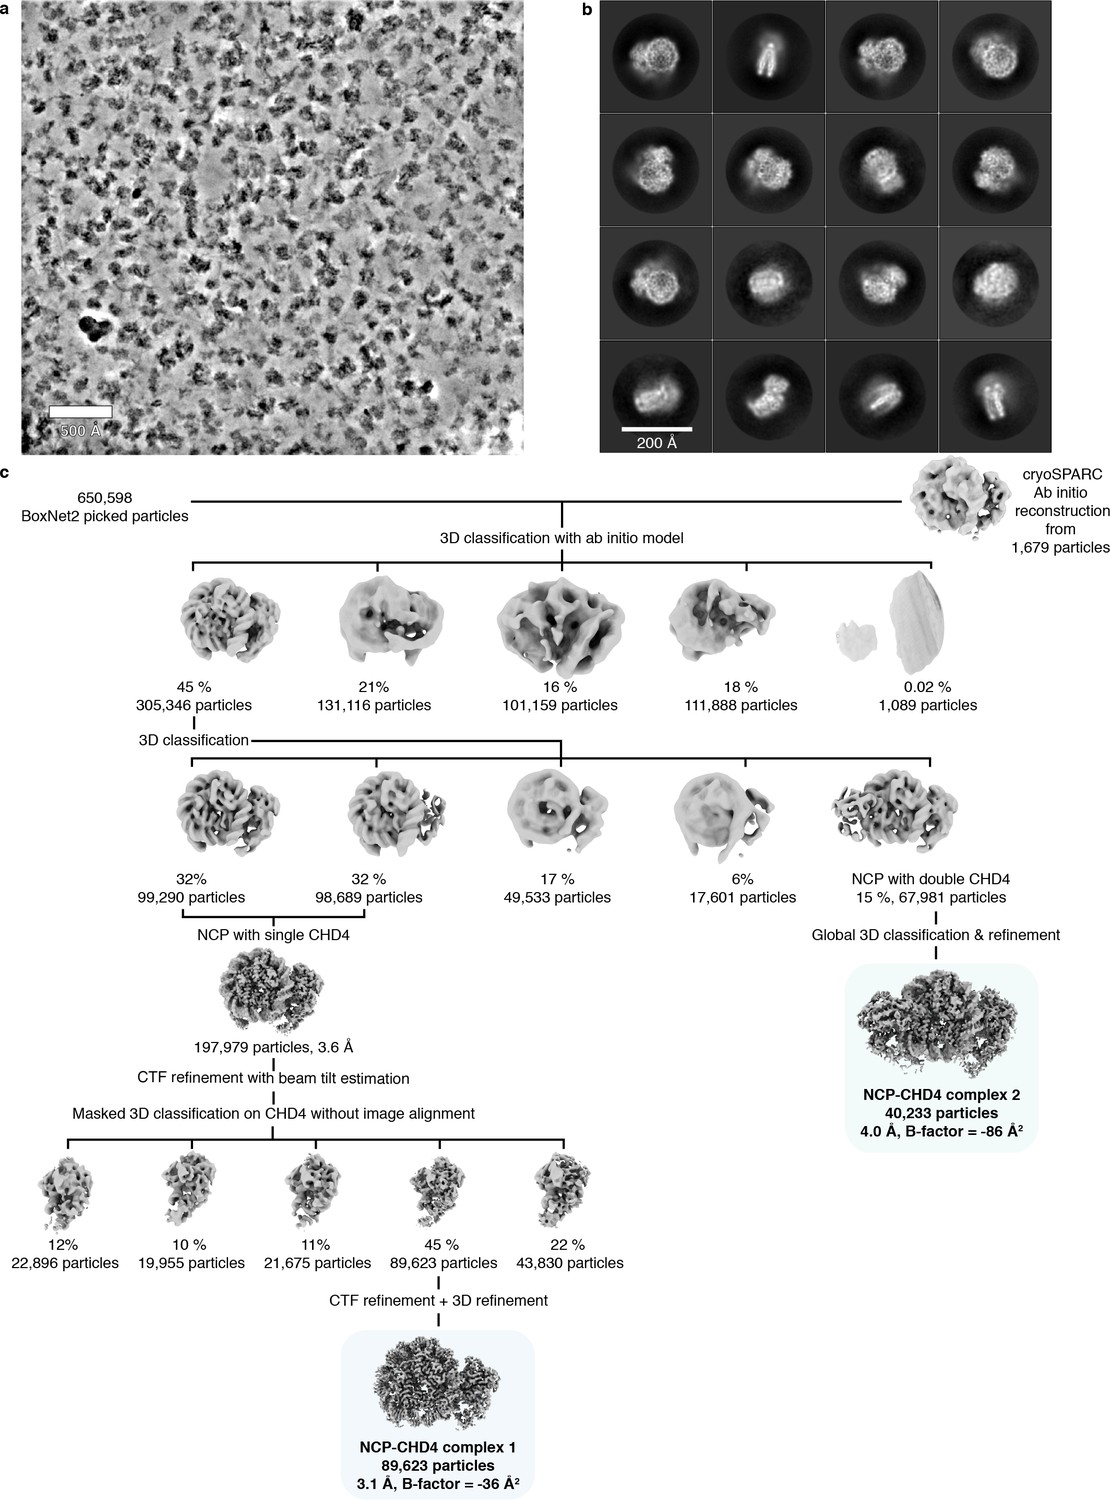
Cryo-EM structure determination.
(a) Representative micrograph of data collection. The micrograph was denoised using Warp (Tegunov and Cramer, 2018). Scale bar with a length of 500 Å is shown. (b) 2D classes of single copy CHD4 bound to a nucleosome. Scale bar with a length of 200 Å is shown. (c) Classification tree employed to obtain cryo-EM density of CHD4 bound to a nucleosome. Particle numbers and class distribution percentages are indicated. Final reconstructions are highlighted.
Figure 1—figure supplement 3
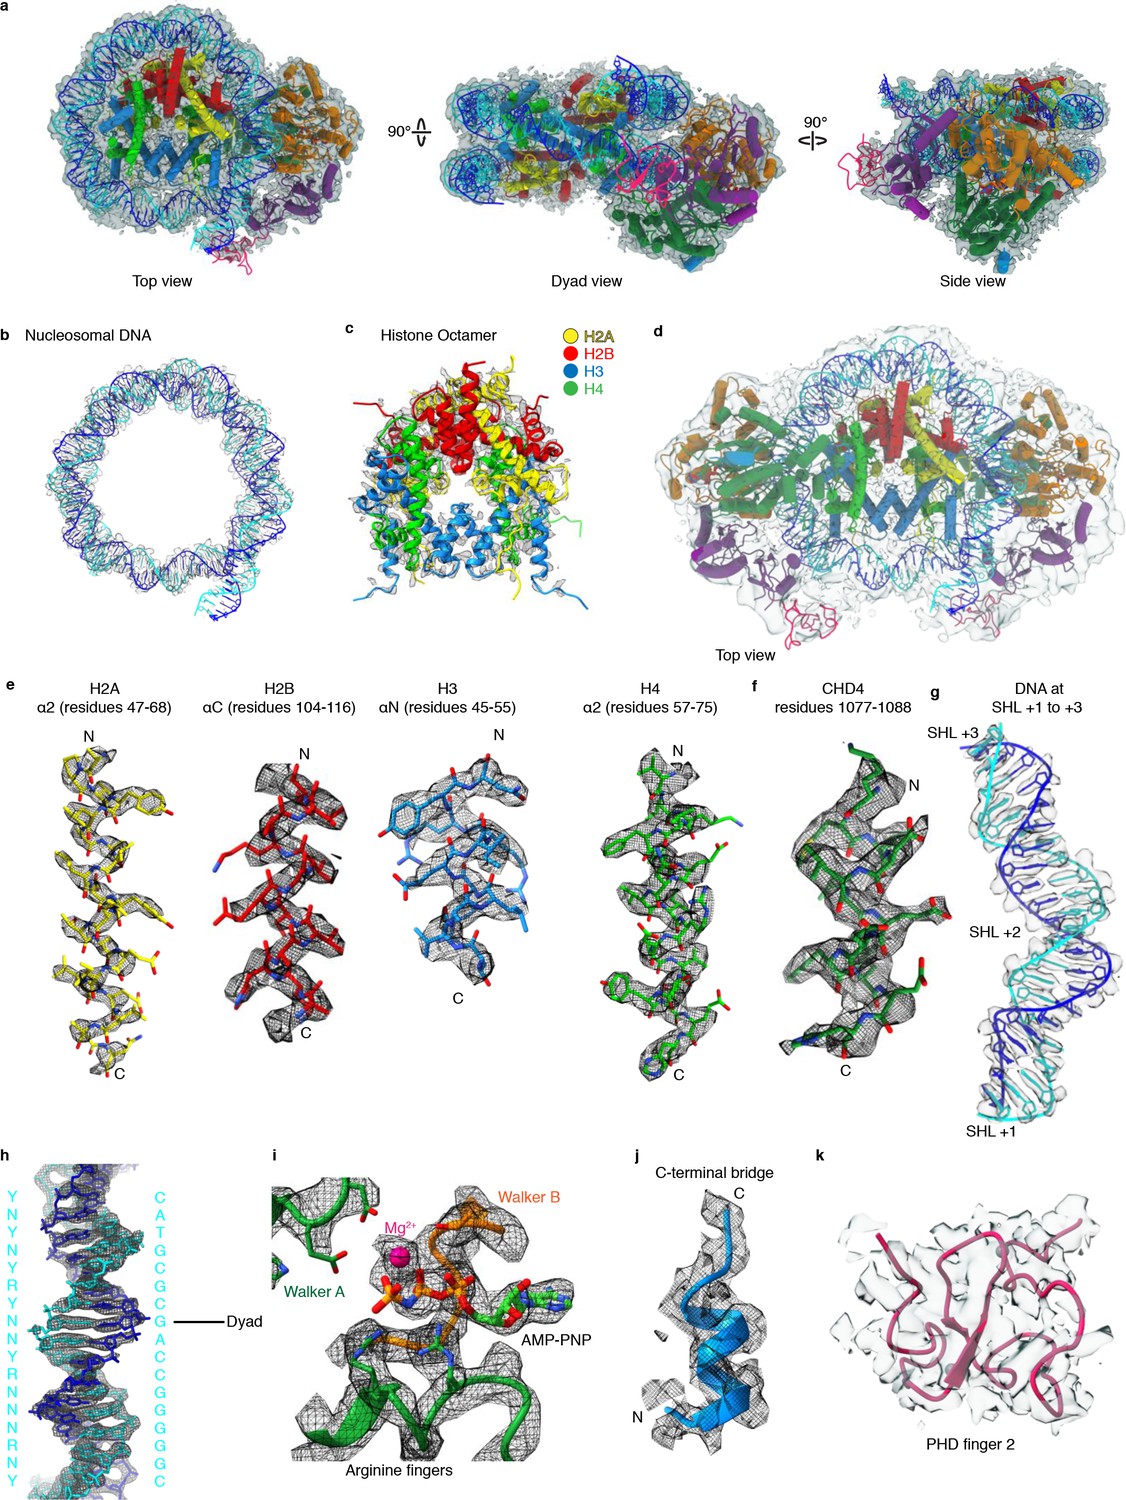
Cryo-EM densities.
(a) Cartoon model of CHD4-nucleosome structure with corresponding post-processed Coulomb potential map shown in silver. (b) Nucleosomal DNA with Coulomb potential map. (c) Histone octamer with Coulomb potential map (d) Cartoon model of two copies of CHD4 engaged with the nucleosome and corresponding Coulomb potential map. (e) Representative density of histone residues. (f) Representative density of CHD4 residues. (g) Coulomb potential map of density near DNA at SHL +2. (h) DNA density around dyad axis with fitted DNA model. Base identities used to fit register and directionality are indicated on the left. N, R, and Y indicate any nucleotide, purine, or pyrimidine, respectively. Matching sequence provided on the right. (i) Active site density with fitted AMP-PNP and coordinated Mg2+ ion. (j) Density of C-terminal bridge helix. (k) Cartoon model of PHD finger 2 with corresponding local resolution filtered Coulomb potential map.
Figure 1—figure supplement 4
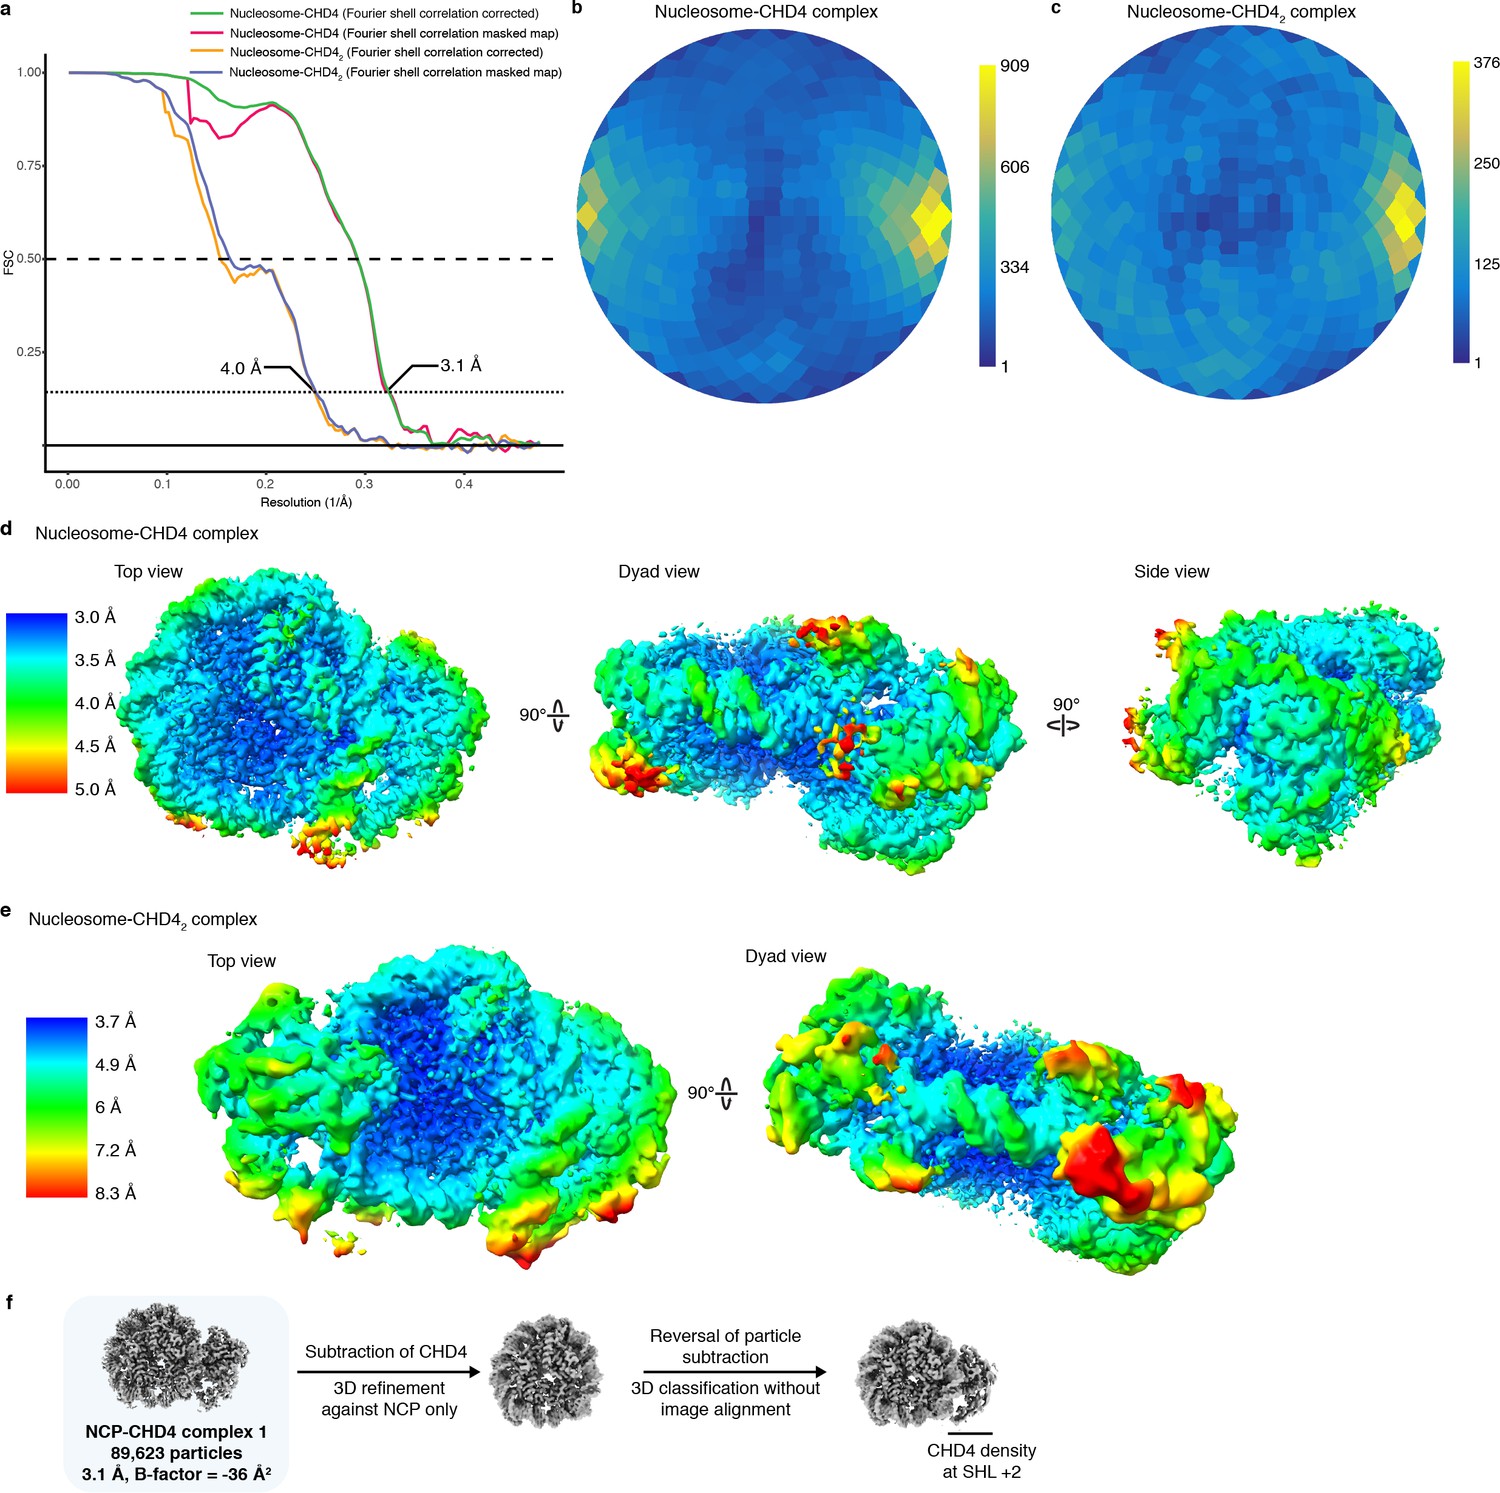
Data quality and metrics.
(a) FSC curves. (b–c) Angular distribution plots. (d-e) Local resolution of CHD4 structures. Densities are colored according to resolution as indicated. (f) Procedure employed to test for mixture of CHD4 bound at SHL +2 and SHL −2. Density was only observed on one site of the NCP, indicating that CHD4 binds the NCP only at SHL +2.
Figure 2
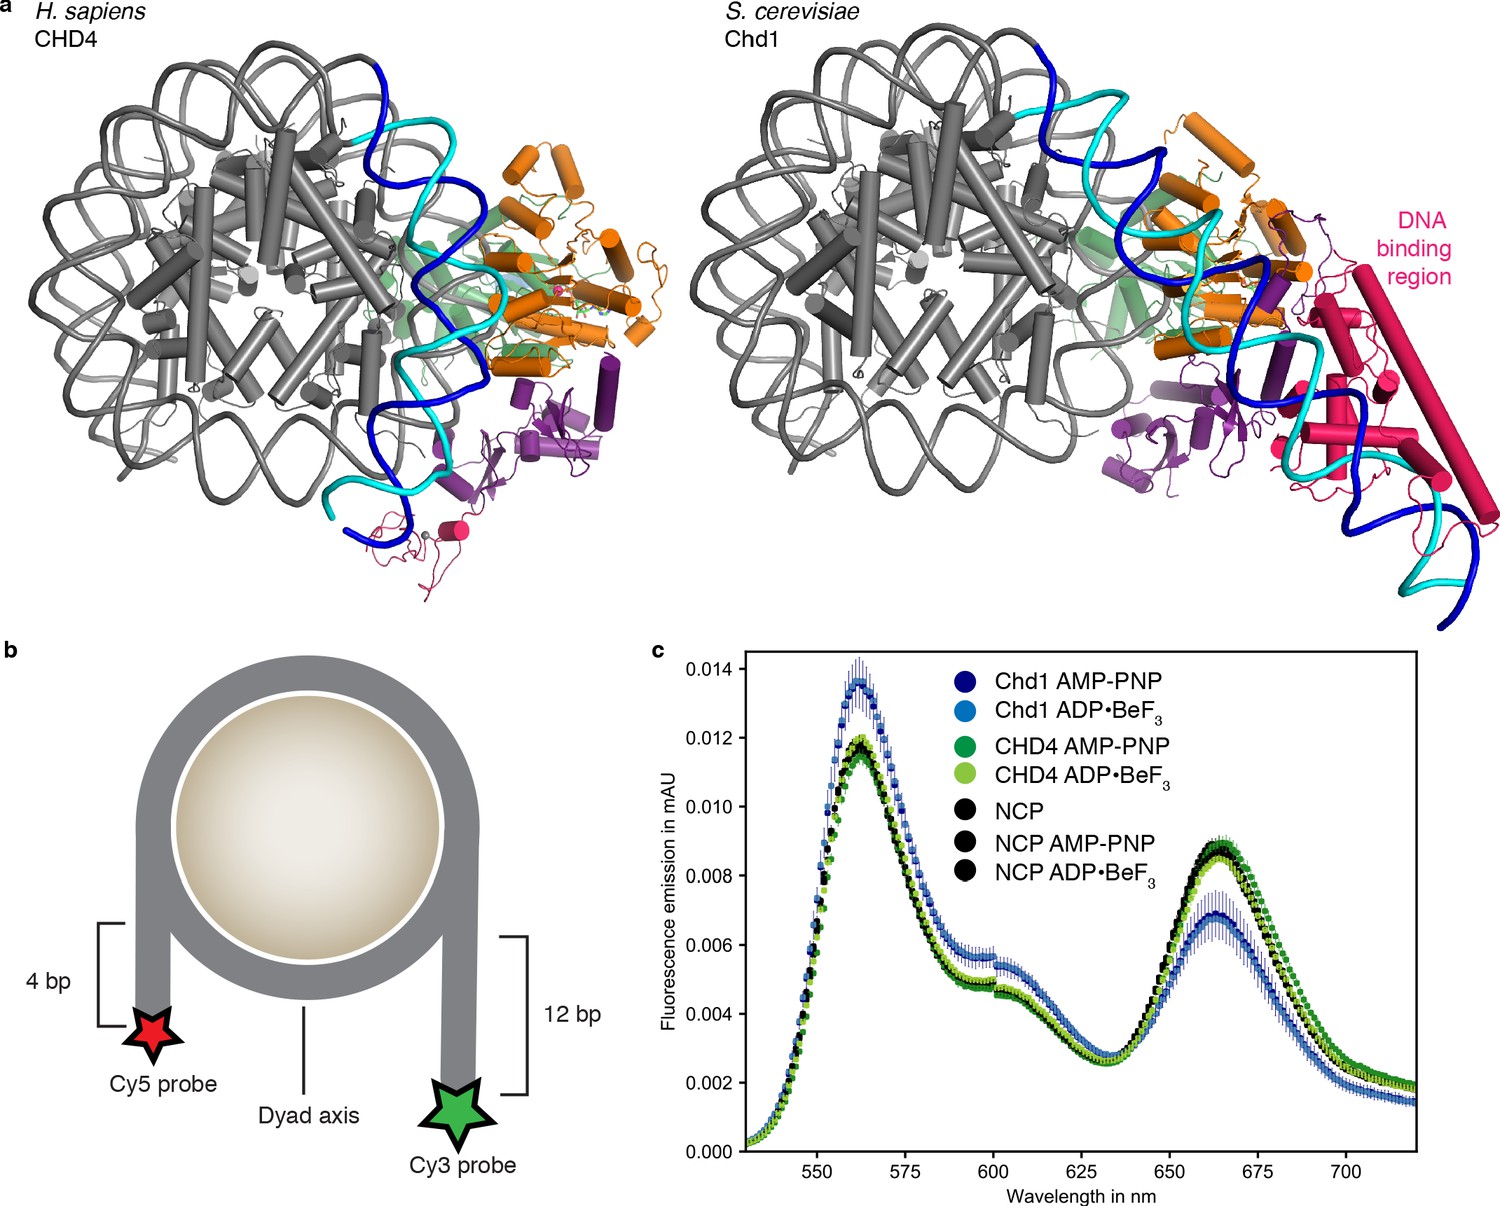
Comparison with nucleosome-Chd1 structure.
(a) CHD4 (left) does not possess a DNA-binding region and does not detach DNA from the second gyre. Chd1 (right) detaches DNA from SHL −7 to −5, stabilizes the detached DNA via its DNA-binding region, and introduces a ~ 60° bend with respect to the canonical DNA position observed in the nucleosome-CHD4 structure. (b) Schematic of experimental FRET setup. (c) Fluorescence emission spectra produced after excitation at 510 nm of Cy3/Cy5 labeled nucleosome in the presence of S. cerevisiae Chd1 (residues 1–1247) or H. sapiens CHD4 and AMP-PNP or ADP·BeF3 show unwrapping of nucleosomal DNA by Chd1 but not by CHD4.
-
Figure 2—source data 1
FRET source data.
Average and standard deviation data for Figure 2.
- https://cdn.elifesciences.org/articles/56178/elife-56178-fig2-data1-v2.xlsx
Figure 3 with 1 supplement
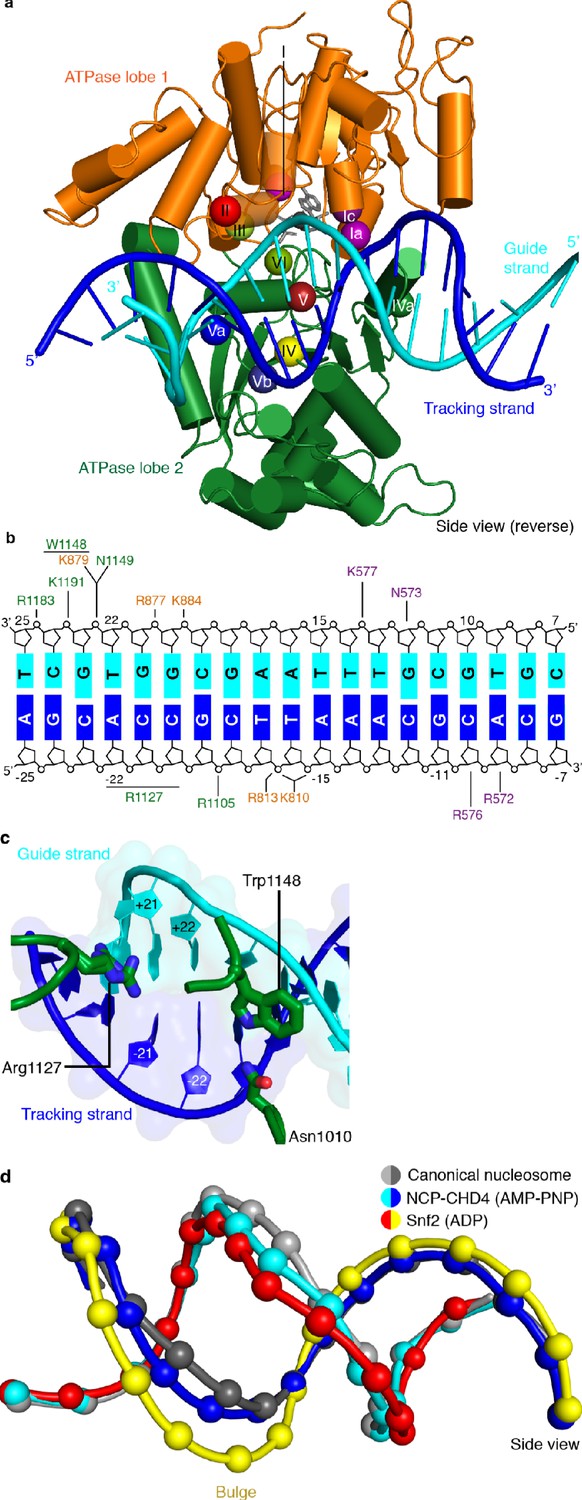
CHD4-DNA interactions and DNA distortion.
(a) CHD4 interacts extensively with nucleosomal DNA around SHL +2. ATPase lobe 1 and lobe 2 of CHD4 are shown. Guide and tracking strands are indicated. ATPase motifs are shown as colored spheres and labelled. (b) Schematic depiction of DNA interactions of the double chromodomain, ATPase lobe 1 and lobe 2. (c) Asn1010, Trp1148 and Arg1227 insert into the minor groove between DNA tracking and guide strand. The two conformations of the Arg1127 side chain are shown. Nucleic acids are shown as cartoons with their respective surfaces. (d) Detailed cartoon representation of DNA distortion at SHL +2. Canonical nucleosome (PDB code 3LZ0, grey), AMP-PNP bound NCP-CHD4 structure (this study, blue and cyan), and ADP bound nucleosome-Snf2 structure (PDB code 5Z3O, red and yellow) are shown. Phosphate atoms shown as spheres.
Figure 3—figure supplement 1
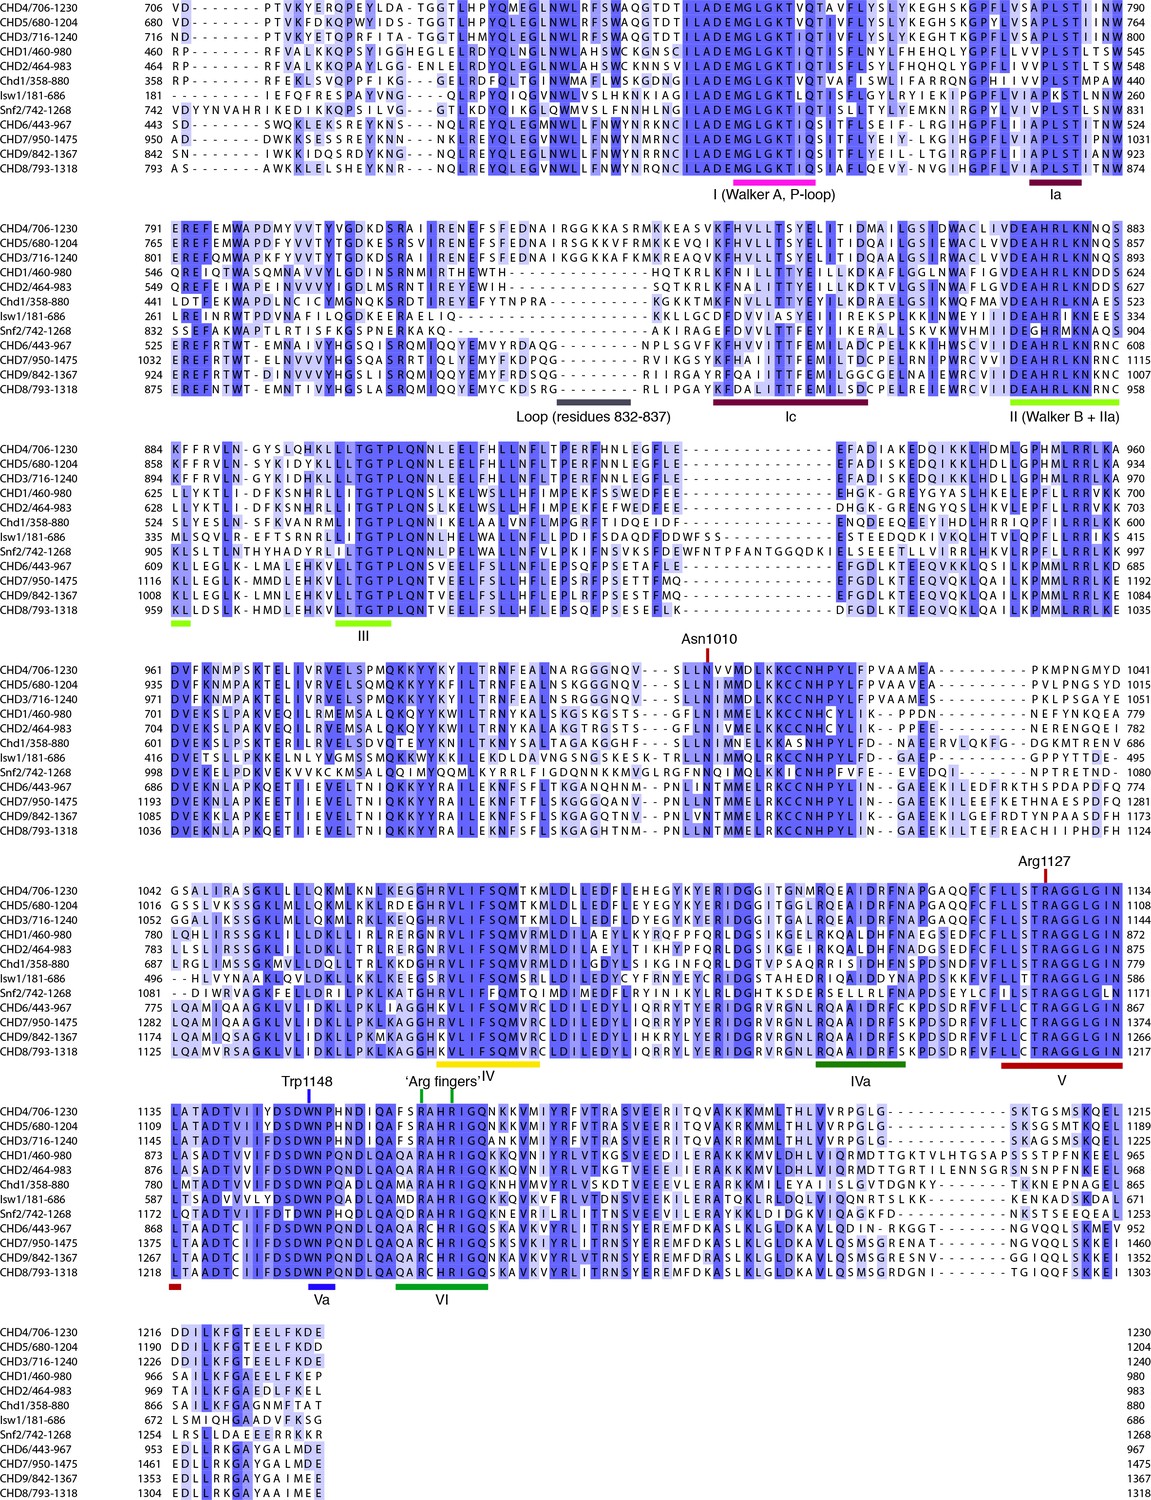
Comparison of CHD4 with Chd1 and other chromatin remodelers.
Sequence alignment of ATPase regions in H. sapiens CHD4 (706–1230), CHD5 (680–1204), CHD3 (716–1240), CHD1 (460–980), CHD2 (464–983), S. cerevisiae Chd1 (358-880), S. cerevisiae Isw1 (181-686), S. cerevisiae Snf2 (742–1268), H. sapiens CHD6 (443–967), CHD7 (950–1475), CHD9 (842–1367), and CHD8 (793–1318). Important elements and ATPase motifs are indicated. Sequence colored according to identity. Dark and light shades of blue indicate high and low conservation, respectively. Alignment generated with MAFFT (Katoh and Standley, 2013) and visualized using JalView (Waterhouse et al., 2009).
Figure 4
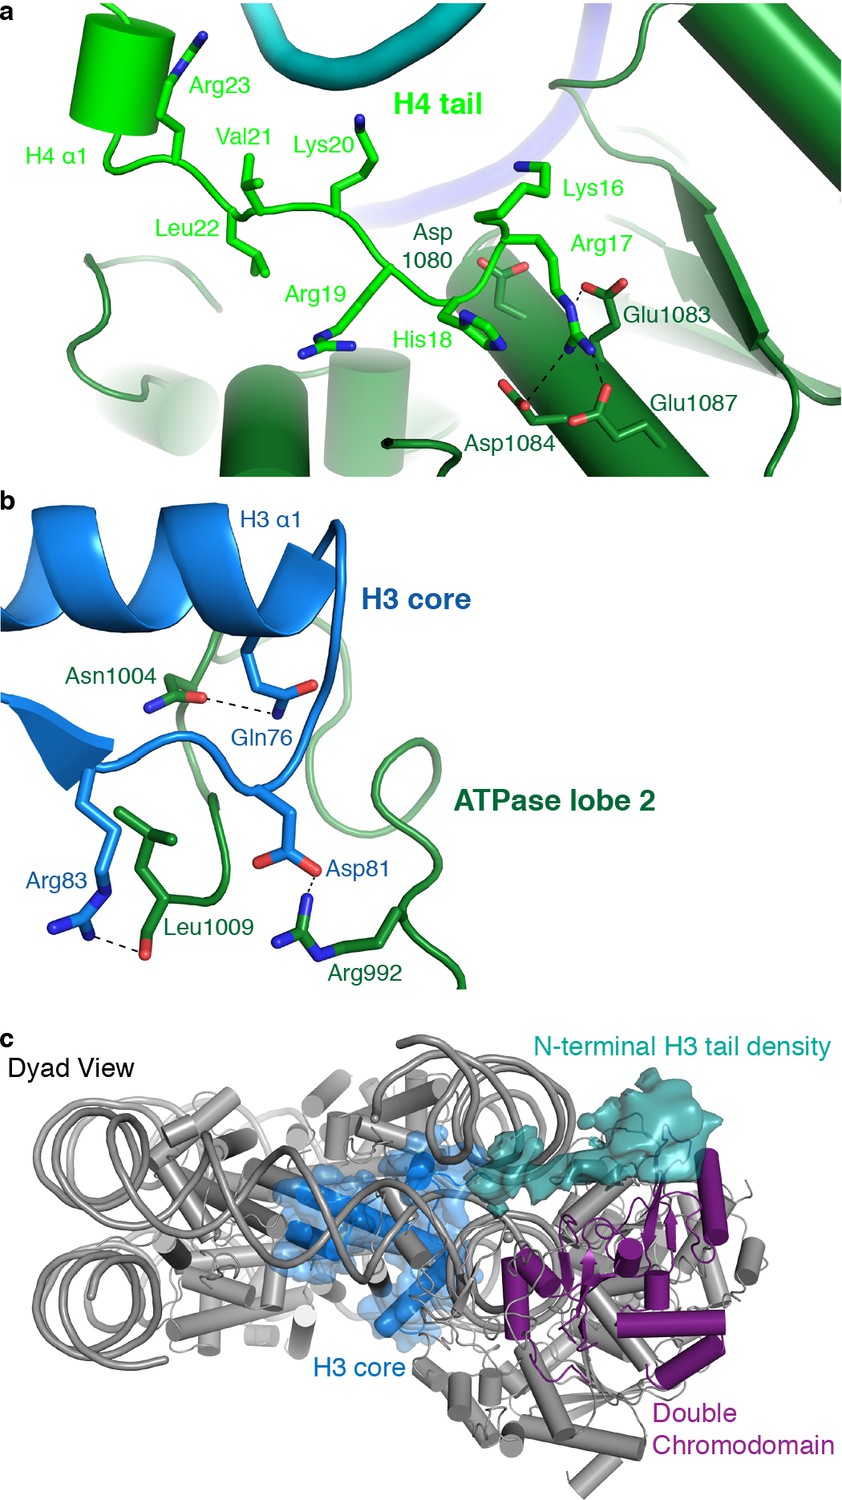
CHD4 contacts H3 and H4.
(a) ATPase lobe 2 interacts extensively with the H4 tail. (b) A loop in ATPase lobe 2 contacts H3 alpha helix 1 and neighboring residues. (c) The double chromodomain of CHD4 contacts the H3 N-terminal tail. H3 core is shown in blue, H3 tail density from the low-pass filtered final map (7 Å) in teal, and the double chromodomain in purple.
Figure 5
The nucleosome can bind two copies of CHD4.
Cartoon model of the nucleosome-CHD42 structure viewed from the top (a), and dyad view (b).
Figure 6
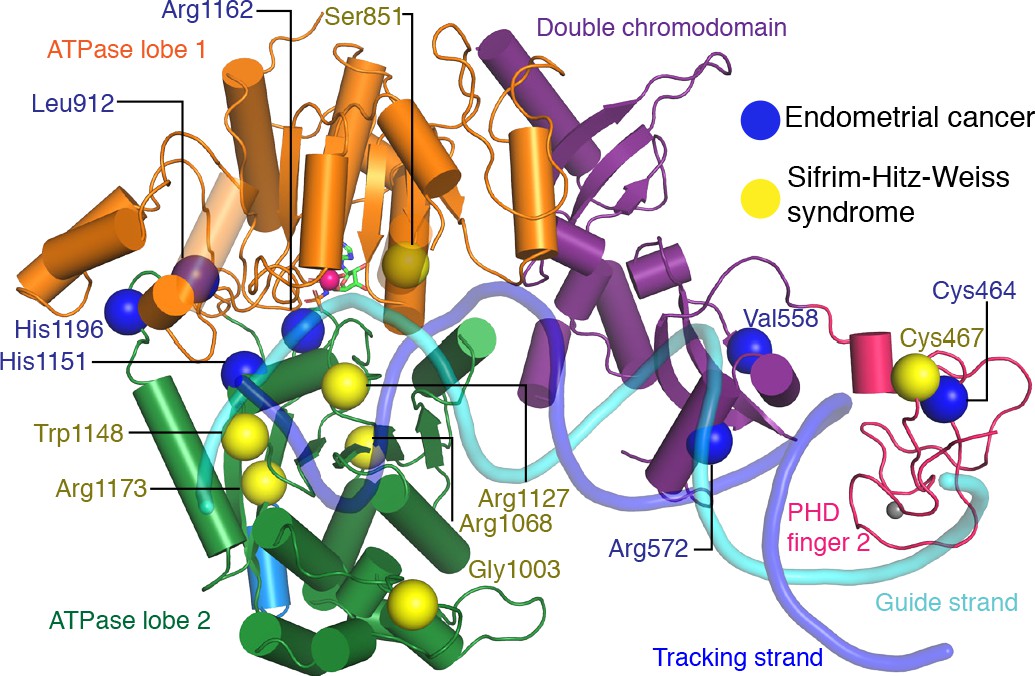
CHD4 mutations in cancer and Sifrim-Hitz-Weiss syndrome.
Missense mutations that occur in endometrial cancer (blue spheres) and Sifrim-Hitz-Weiss syndrome (yellow spheres) mapped onto the CHD4 structure. Residue numbering is indicated. Nucleosomal DNA at SHL +2 is shown in a semi-transparent cartoon representation.
Videos
Video 1
Cryo-EM density and structure of the nucleosome-CHD4 complex.
Video 2
Cryo-EM density and structure of the nucleosome-CHD42 complex.
Tables
Table 1
Cryo-EM data collection, refinement and validation statistics.
| Nucleosome-CHD4 complex (EMD-10058) (PDB 6RYR) | Nucleosome-CHD42 complex (EMDB-10059) (PDB 6RYU) | ||
|---|---|---|---|
| Data collection and processing | |||
| Magnification | 130,000 | 130,000 | |
| Voltage (kV) | 300 | 300 | |
| Electron exposure (e–/Å2) | 43–45 | 43–45 | |
| Defocus range (μm) | 0.25–4 | 0.25–4 | |
| Pixel size (Å) | 1.05 | 1.05 | |
| Symmetry imposed | C1 | C1 | |
| Initial particle images (no.) | 650,599 | 650,599 | |
| Final particle images (no.) | 89,623 | 40,233 | |
| Map resolution (Å) FSC threshold | 3.1 0.143 | 4.0 0.143 | |
| Map resolution range (Å) | 3.0–5 | 3.7–8.3 | |
| Refinement | |||
| Initial models used (PDB code) | 3LZ0, 5O9G, 2L75, 4O9I, 6Q3M | 3LZ0, 5O9G, 2L75, 4O9I, 6Q3M | |
| Map sharpening B factor (Å2) | −36 | −86 | |
| Model composition Non-hydrogen atoms Protein residues Nucleotides Ligands | 17,834 1463 298 4 | 23,598 2180 298 8 | |
| B factors (Å2) Protein Nucleotide Ligand | 45.28 71.82 60.10 | 95.29 112.27 125.7 | |
| R.m.s. deviations Bond lengths (Å) Bond angles (°) | 0.003 0.638 | 0.005 1.028 | |
| Validation MolProbity score Clashscore Poor rotamers (%) | 1.54 5.69 0.08 | 1.92 6.52 1.64 | |
| Ramachandran plot Favored (%) Allowed (%) Disallowed (%) | 96.50 3.50 0.0 | 94.16 5.84 0.0 | |
Table 2
CHD4 mutations in cancer and Sifrim-Hitz-Weiss syndrome.
| Mutated Residue | Location | Predicted effect based on structure | Biochemical observations | |
|---|---|---|---|---|
| Cancer | ||||
| Cys464Tyr | PHD finger 2 | Disruption of Zn2+ binding in PHD finger 2 | Reduction in ATPase activity (Kovač et al., 2018) | |
| Val558Phe | Double chromodomain | Reduced ATPase activity (Kovač et al., 2018) | ||
| Arg572Gln | Double chromodomain | Disruption of contact with tracking strand | Reduced DNA binding affinity, Loss of full remodeling activity and ATPase activity (Kovač et al., 2018) | |
| Leu912Val | ATPase lobe 2 | No prediction made | Reduction of ATPase activity (Kovač et al., 2018) | |
| His1151Arg | ATPase lobe 2 | In close proximity to motif Va, might disrupt contact of Trp1148 | Reduction of ATPase activity, abolishment of remodeling activity (Kovač et al., 2018) | |
| Arg1162Gln | ATPase lobe 2, motif VI | Located in ATPase motif VI (arginine finger), Disruption of interaction with ATP | Reduction of ATPase activity (Kovač et al., 2018) | |
| His1196Tyr | ATPase lobe 2 | Located in the C-terminal bridge region, Removes negative regulation | Speed of chromatin remodeling is increased and better nucleosome centering capability (Kovač et al., 2018) | |
| Leu1215 | ATPase lobe 2/C-terminal bridge | Not located in modeled region | ||
| Sifrim-Hitz-Weiss syndrome (Sifrim et al., 2016; Weiss et al., 2016) | ||||
| Cys467Tyr | PHD finger 2 | Disruption of Zn2+ binding in PHD finger 2 | ||
| Ser851Tyr | ATPase lobe 1 | |||
| Gly1003Asp | ATPase lobe 2 | Disruption of contact with H3 | ||
| Arg1068His | ATPase lobe 2 | Disruption of structural integrity of RecA fold | ||
| Arg1127Gln | ATPase lobe 2 | Disruption of contact with DNA minor groove, equivalent arginine residue in SMARCA4 is implicated in ‘Coffin Siris syndrome’ | ||
| Trp1148Leu | ATPase lobe 2, motif Va | Disruption of contact with guide strand | Uncoupling of ATPase activity and chromatin remodeling (Liu et al., 2017) | |
| Arg1173Leu | Destabilization | |||
| Val1608Ile | Not located in modeled region |
Additional files
Download links
A two-part list of links to download the article, or parts of the article, in various formats.
Downloads (link to download the article as PDF)
Open citations (links to open the citations from this article in various online reference manager services)
Cite this article (links to download the citations from this article in formats compatible with various reference manager tools)
Nucleosome-CHD4 chromatin remodeler structure maps human disease mutations
eLife 9:e56178.
https://doi.org/10.7554/eLife.56178


