Moyamoya disease factor RNF213 is a giant E3 ligase with a dynein-like core and a distinct ubiquitin-transfer mechanism
- Research Institute of Molecular Pathology (IMP), Vienna BioCenter, Austria
- Vienna BioCenter Core Facilities, Vienna BioCenter, Austria
- Medical University of Vienna, Austria
Figures
Figure 1 with 4 supplements

Overall structure of the AAA-E3 ligase RNF213.
(a) Conservation and domain organization of RNF213. (b) Composite cryo-EM maps of wt and R4753K RNF213 resulting from focused refinements. (c) Architecture of RNF213, shown in orthogonal views (top row; first view matches orientation of panel b), illustrated as ribbon model using a domain-based color mode similar as in (a). The lower panel depicts the collection of dissected RNF213 domains.
Figure 1—figure supplement 1
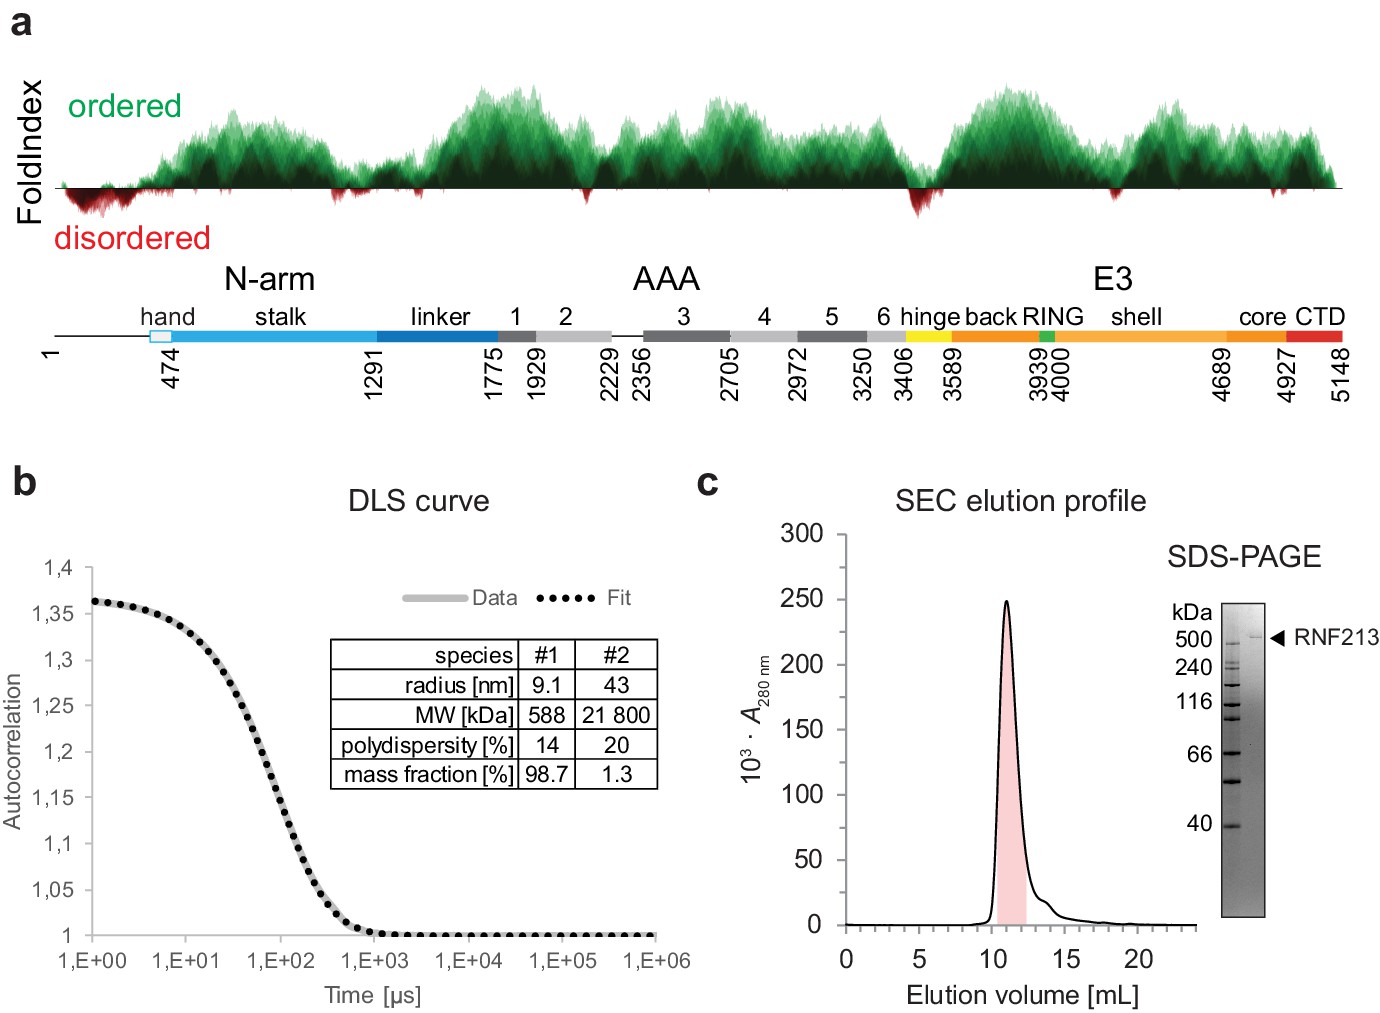
In silico and in vitro characterization of RNF213.
(a) Prediction of folded (green, above the axis) and disordered (red, below the axis) regions. The prediction is based on the FoldIndex score. (b, c) Dynamic light scattering (DLS) and size exclusion chromatography (SEC) analysis of the purified protein used for structural and biochemical analysis. The SDS-PAGE gel highlights the purity of the sample.
Figure 1—figure supplement 2
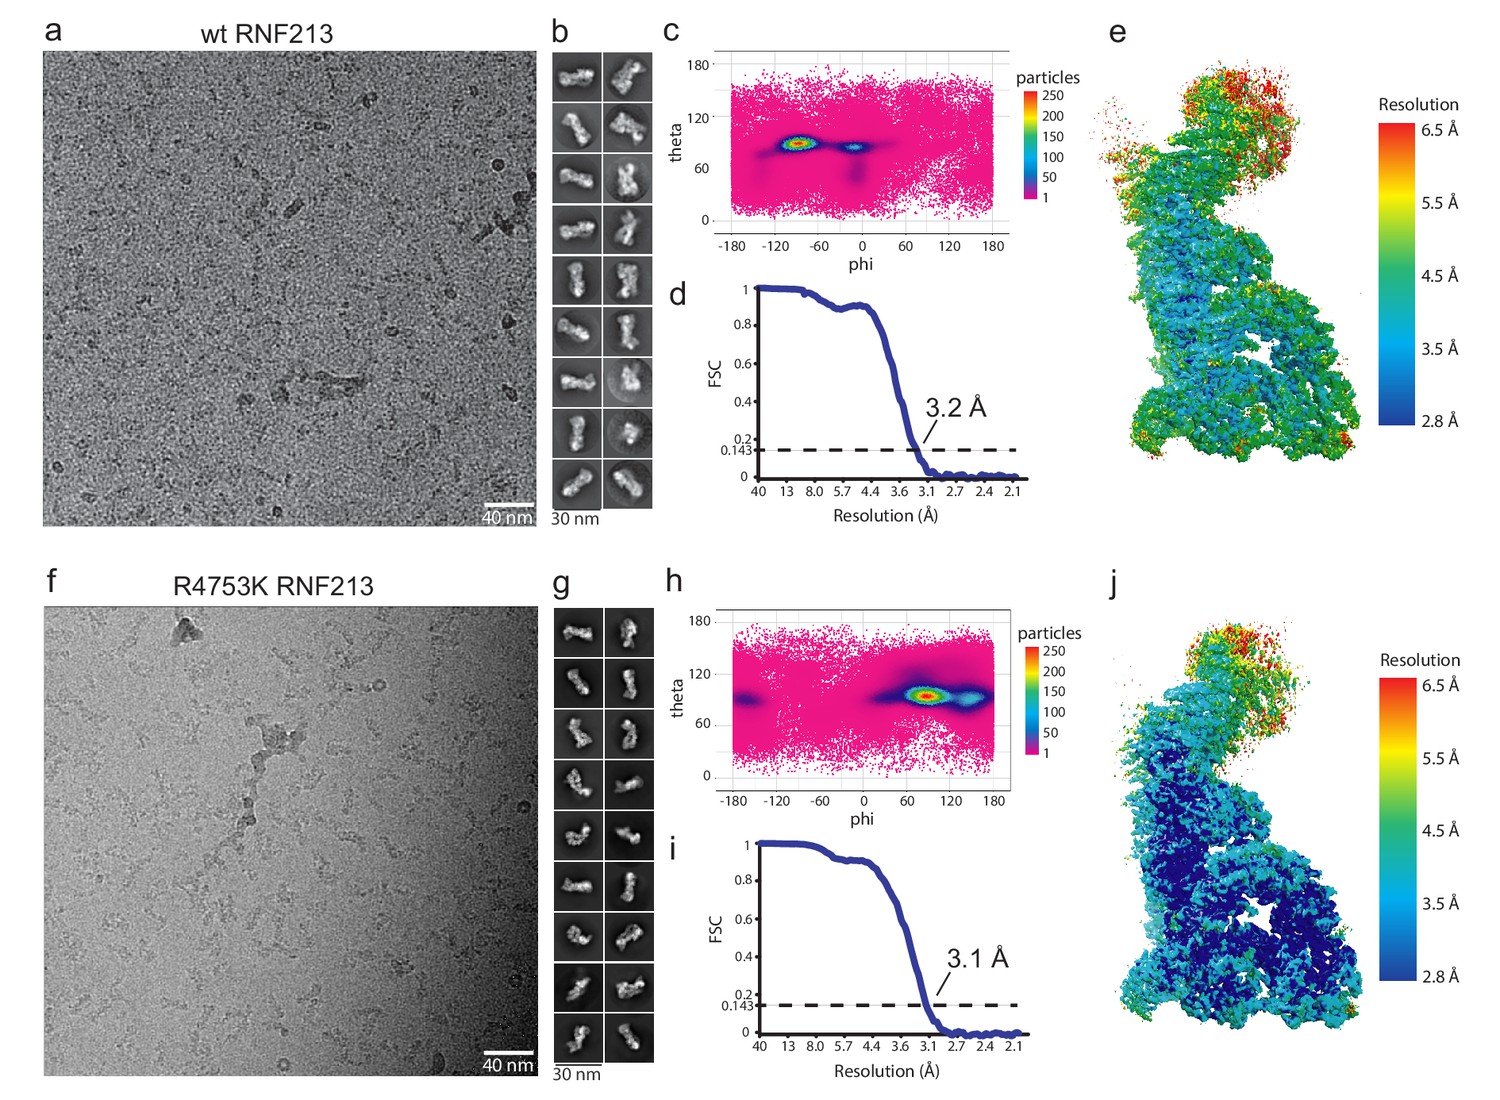
Cryo-EM analysis of RNF213.
(a) Cryo-EM analysis of wt RNF213 showing a representative micrograph, (b) highest populated class averages, (c) angular distribution of individual wt particles, (d) Fourier Shell Correlation curve of the refined map showing a resolution of 3.2 Å and (e) local resolution map. (f) Cryo-EM analysis of R4753K RNF213 mutant showing a representative micrograph, (g) the highest populated class averages, (h) the angular distribution of individual mutant particles, (i) the Fourier Shell Correlation curve of the refined map showing a resolution 3.1 Å and (j) the local resolution map.
Figure 1—figure supplement 3
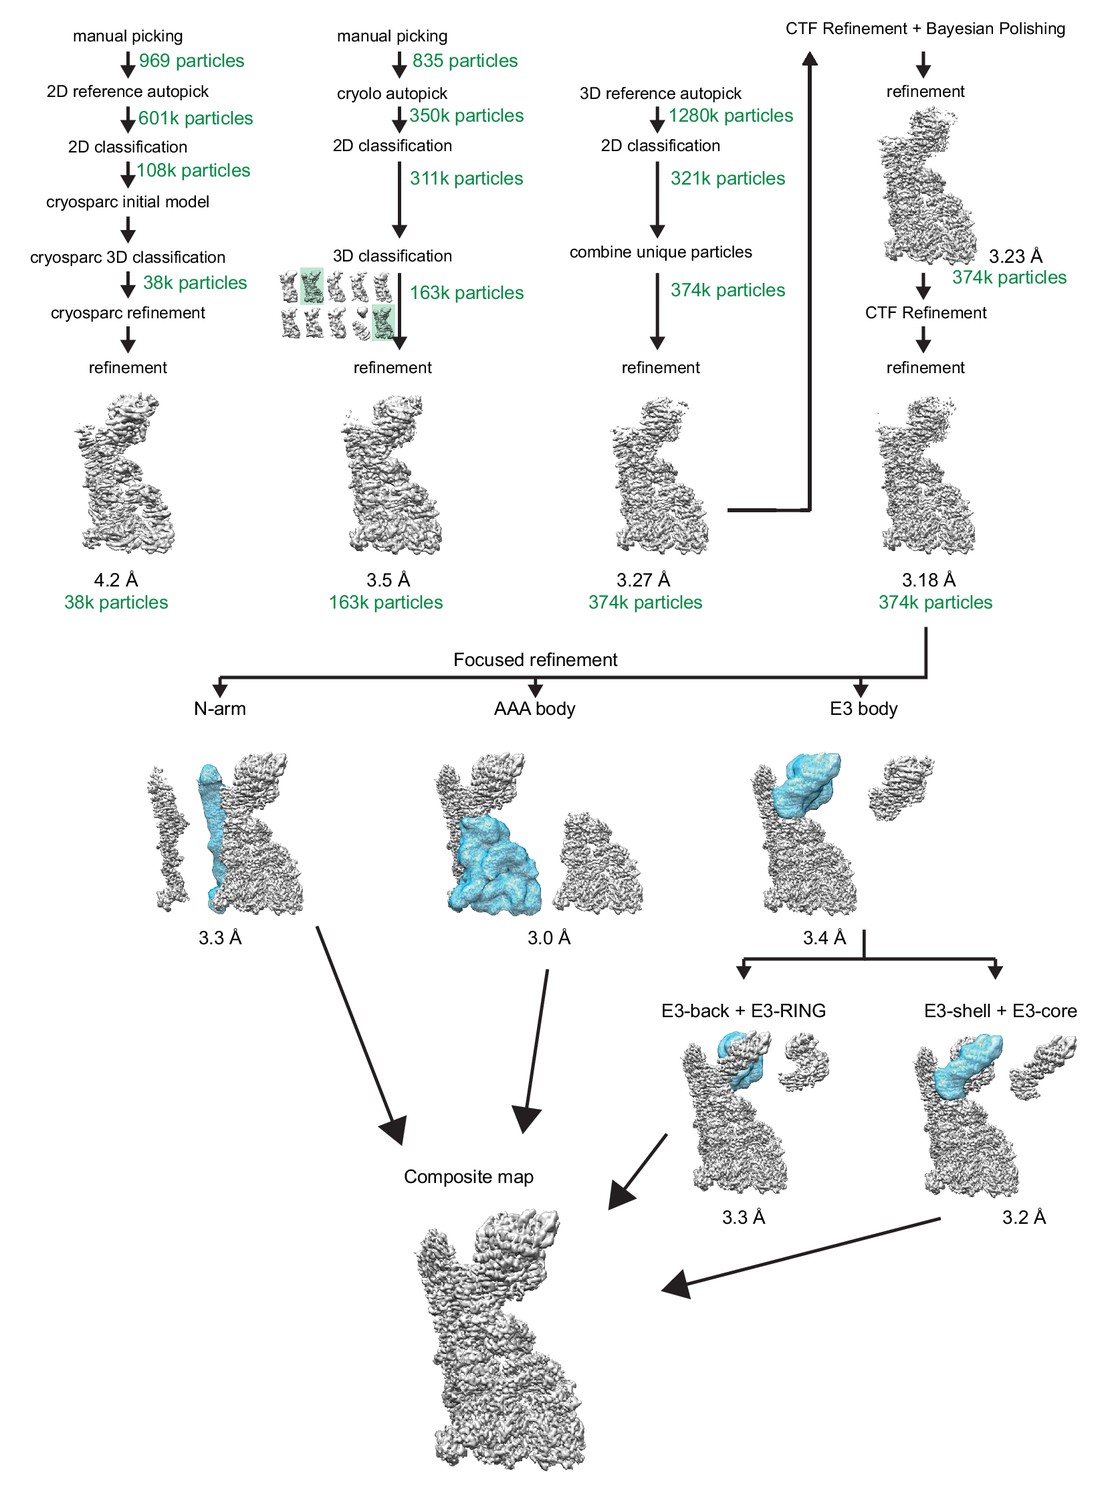
Reconstruction of RNF213 cryo-EM densities.
The scheme shows various computational steps that were performed to generate the final EM density maps, which were used to determine the molecular model of wt RNF213. Top: The iterative process leading to the overall EM density is shown. From left to right: 1) generating the initial EM density map, 2) generating the second density map following optimized particle picking guided by the first map, 3) picking additional particles using the projections of the second density map as a reference, and 4) generating the final overall EM density. Bottom: The focus refinement scheme is illustrated, showing both the mask used and the generated density from each refinement. The number of particles included in each step is noted in green. The achieved resolution (resolution cutoff at FSC = 0.143) is indicated below different models.
Figure 1—figure supplement 4
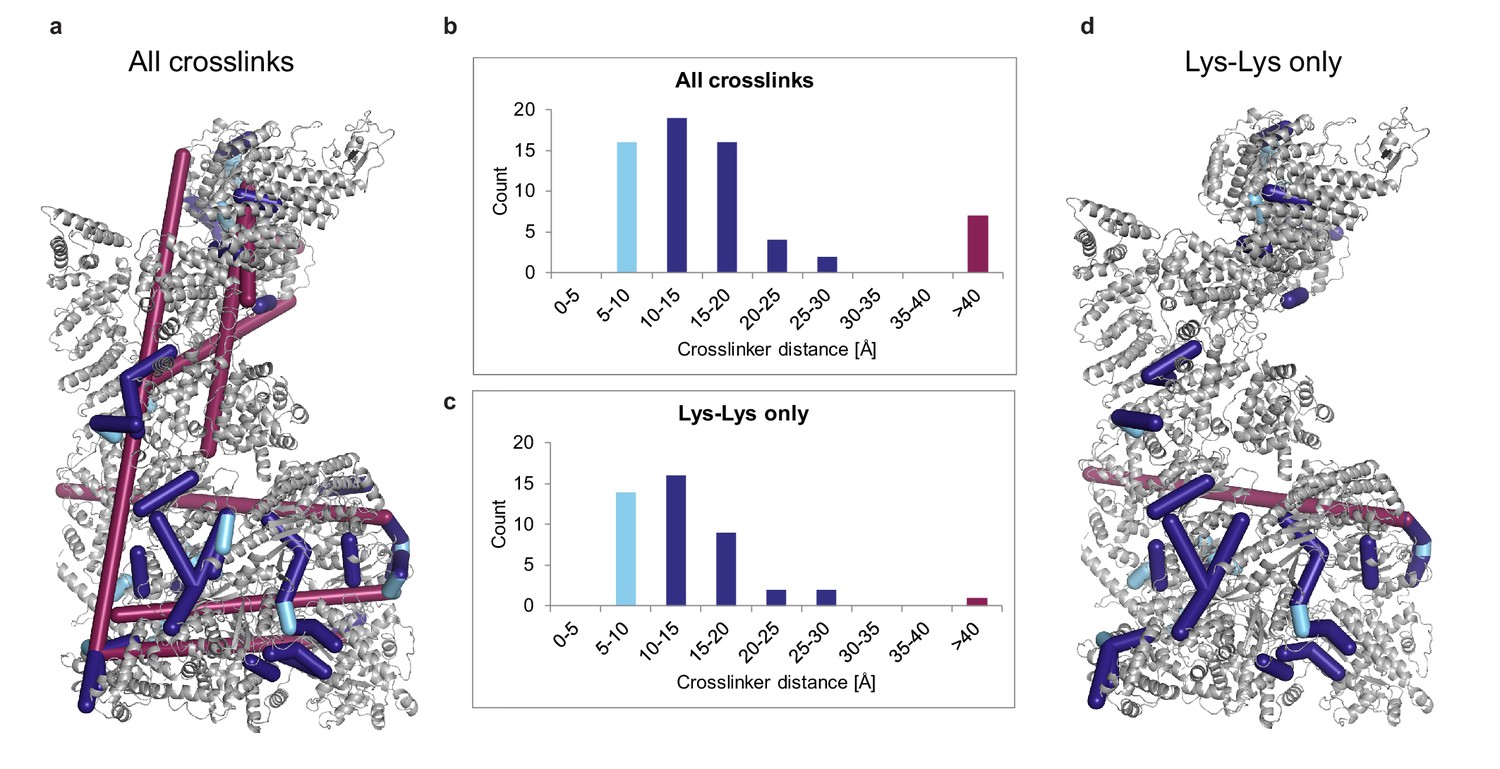
XL-MS analysis of RNF213.
(a) Ribbon plot of RNF213 with DSS-mediated crosslinks between Lys residues shown as rods. Crosslinks with permitted distances are shown in light blue (0–10 Å) or dark blue (10–30 Å), those with larger distance in lilac. Crosslinker length is calculated with respect to the N-atom of the lysine amino group, or the O-atom the serine, threonine, or tyrosine side chains. (b) Distance distribution of the crosslinks. These data show that the majority of the crosslinks is in the allowed range. (c, d) Corresponding plots but only showing crosslinks between lysine pairs. Here, only a single link did not fulfill distance constrains.
Figure 2 with 3 supplements
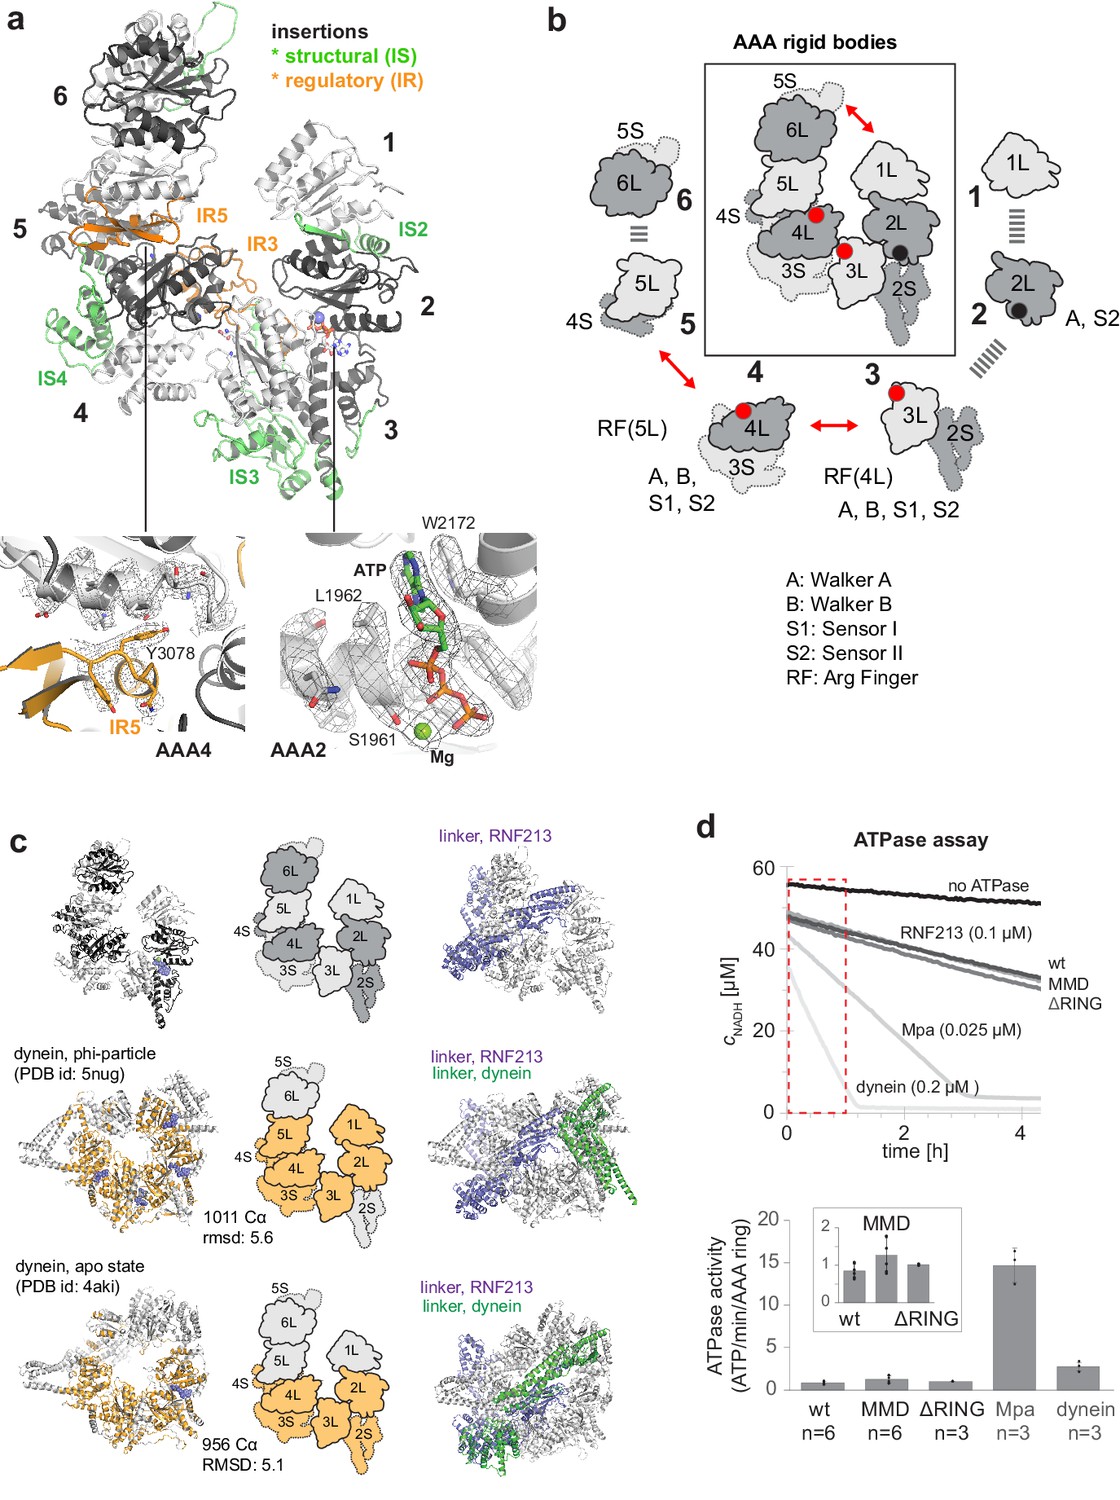
AAA core adopts a dynein-like fold.
(a) Organization of the 6 AAA domains, shown in alternating gray tones, highlighting insertions with structural (IS, green) and regulatory (IR, orange) roles. Orientation is similar as in Figure 1c. The insets below illustrate the EM density of the IR5 motif blocking via Tyr3078 nucleotide binding to AAA4 and the ATP molecule tightly bound at AAA2 (also shown in Video 1). (b) Schematic cartoon of the ATPase core emphasizing the AAA ‘rigid bodies’ formed between the L domain of one and the S domain of the previous unit (Wang et al., 2001). The catalytically competent ATPase sites (red dots), the ATP-bound AAA2 (black dot), and the respective functional motifs for ATP binding and hydrolysis are indicated. (c) Structural superposition of RNF213 (top row) with two dynein states (Phi particle, middle; apo dynein, bottom). The left panel illustrates the aligned dynein domains (orange), the middle shows the corresponding cartoon of the matching RNF213 AAA portions, and the right panel highlights the upstream linker of RNF213 (lilac) superimposed with phi-particle and apo dynein structures (AAA core, grey; linker, green). (d) ATPase assay comparing RNF213 variants with dynein and a processive ATPase, the unfoldase Mpa. The top panel illustrates representative NADH decay curves, with used protein concentrations being indicated. The region for calculating reaction rates is highlighted in red. The lower panel quantifies the respective ATPase rates calculated per AAA ring. Rates for tested RNF213 variants are also shown enlarged. Error bars indicate standard deviation.
Figure 2—figure supplement 1
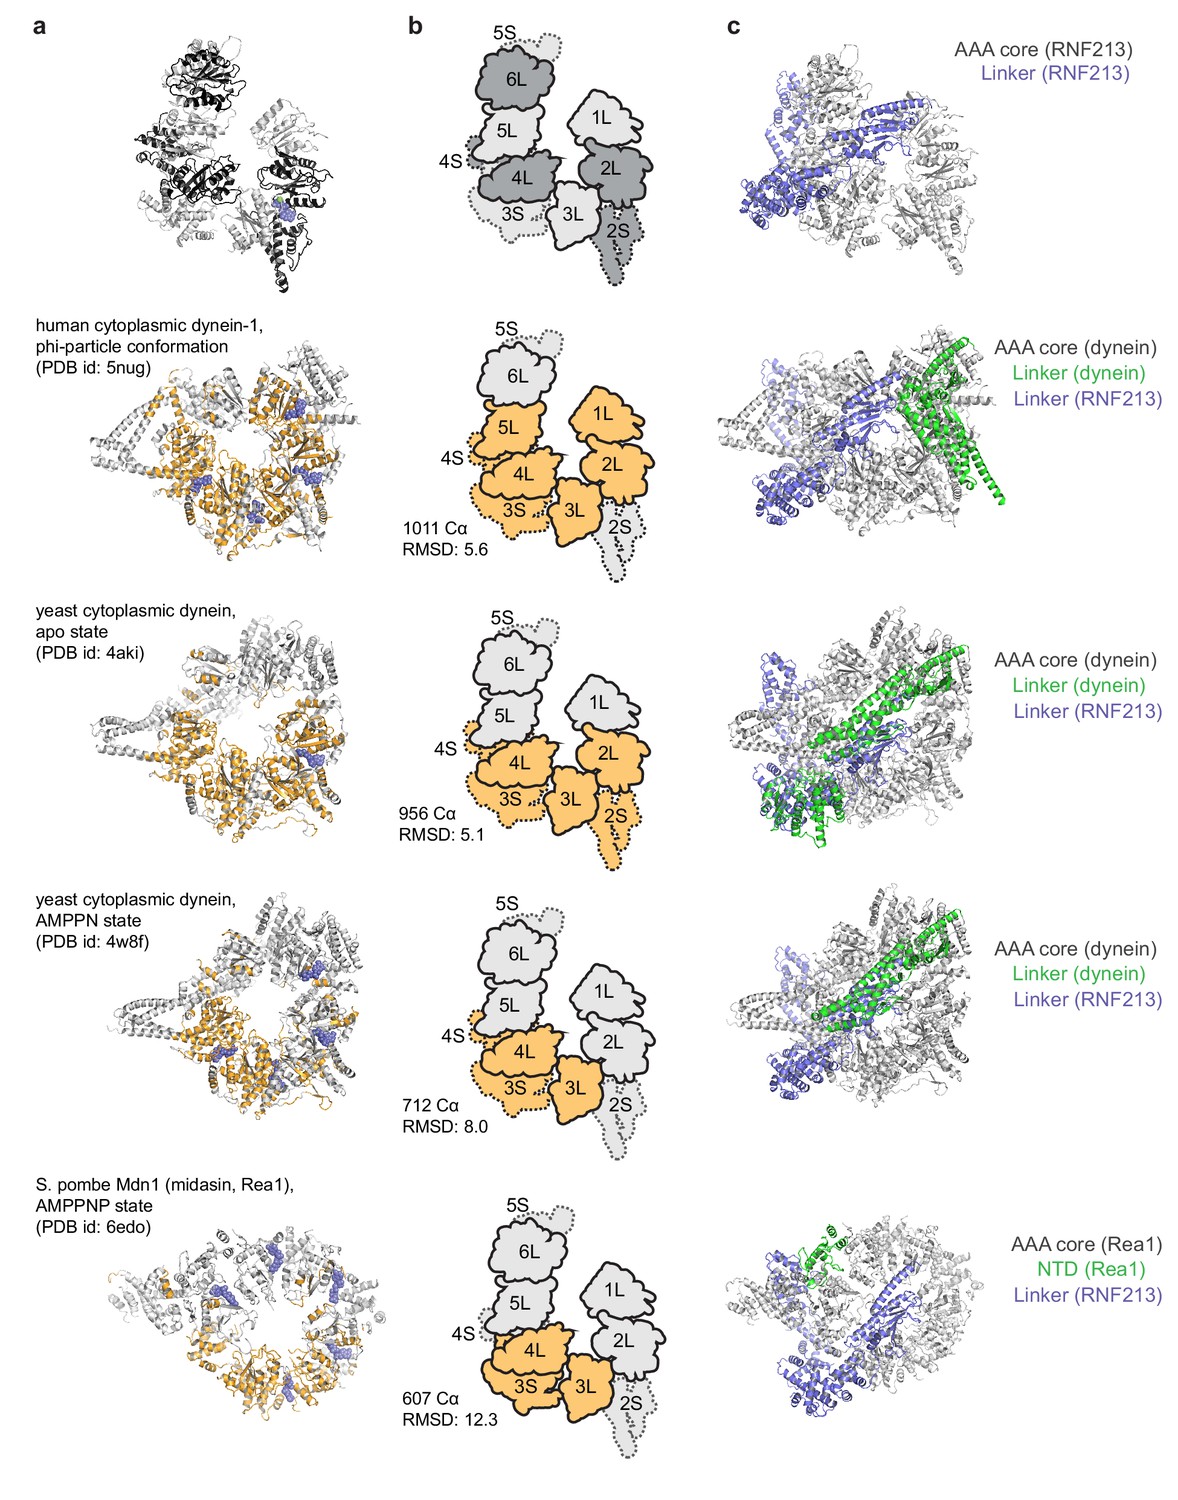
Structural comparison of RNF213 with dynein-like proteins, containing 6 AAA units in a single polypeptide.
(a) AAA cores of dynein Phi particle, dynein apo state, dynein AMPPNP-bound form, and Rea1, highlighting those residues in orange that could be aligned to RNF213 (top). The rms deviations and number of aligned Cα atoms are indicated. (b) Schematic cartoon of the RNF213 AAA core, emphasizing the aligned AAA units. Accordingly, RNF213 and dynein show the greatest similarity in the AAA2/3/4 part. (c) AAA cores of RNF213, dynein and Rea1 as in panel a) are shown together with their N-terminal linker (green), superimposed with the RNF213 counterpart (lilac). The pictures highlight the similar linker architecture in RNF213 and dynein.
Figure 2—figure supplement 2
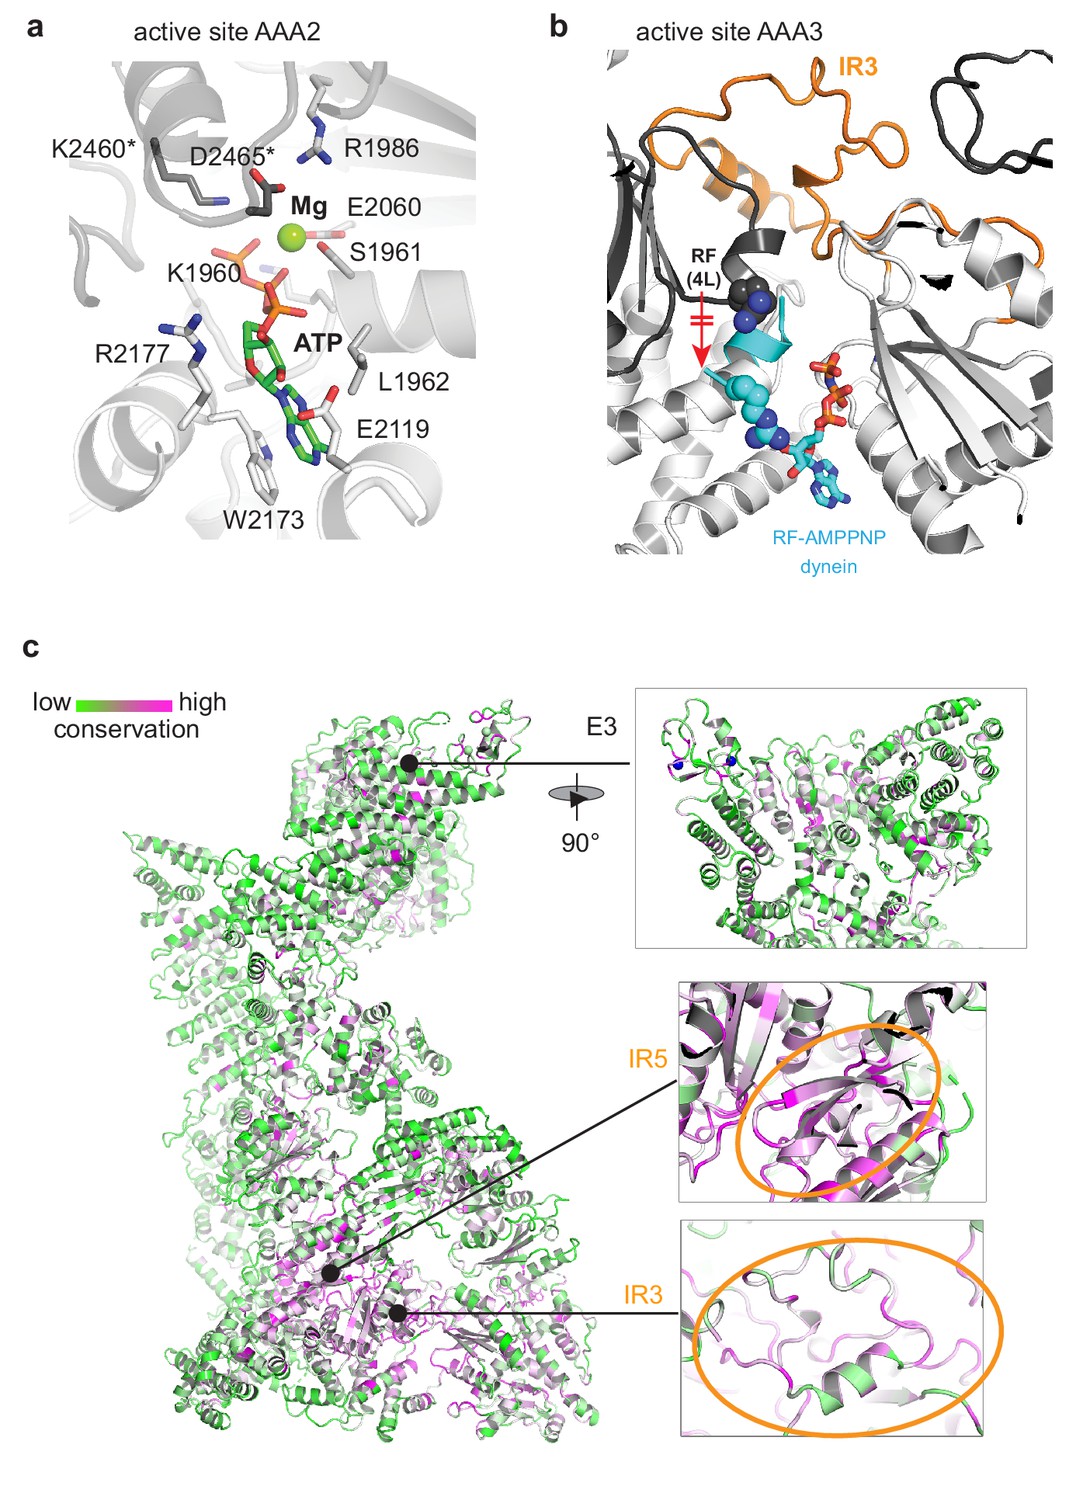
Conservation pattern of RNF213 mapped to the cryo-EM structure.
(a) Atomic model of the AAA2 active site, tightly engaging ATP/Mg. Residues of the adjacent AAA rigid body are marked (*). (b) IR3 stabilizes the inactive state of AAA3 by trapping the arginine finger (RF) in a remote position from the AAA3 active site. For comparison, the aligned RF motif of the dynein AMPPNP structure (PDB ID 4w8f) is shown in cyan together with the bound nucleotide. (c) Conservation pattern of the full-length protein colored according to the degree of sequence conservation from low (green) to high (magenta). This plot illustrates that the core of the AAA ring represents the most highly conserved portion of RNF213. The zoomed-in inserts illustrate the conservation of the central E3 part, where only few functional motifs are conserved including the Zn-coordinating residues of the RING (top), the conservation of the IR5 motif (orange circle) and the conservation of the IR3 motif (orange circle). Notably, for IR3, specifically those residues that extend to the protein interior are conserved, whereas the conservation of surface-exposed residues varies.
Figure 2—figure supplement 3
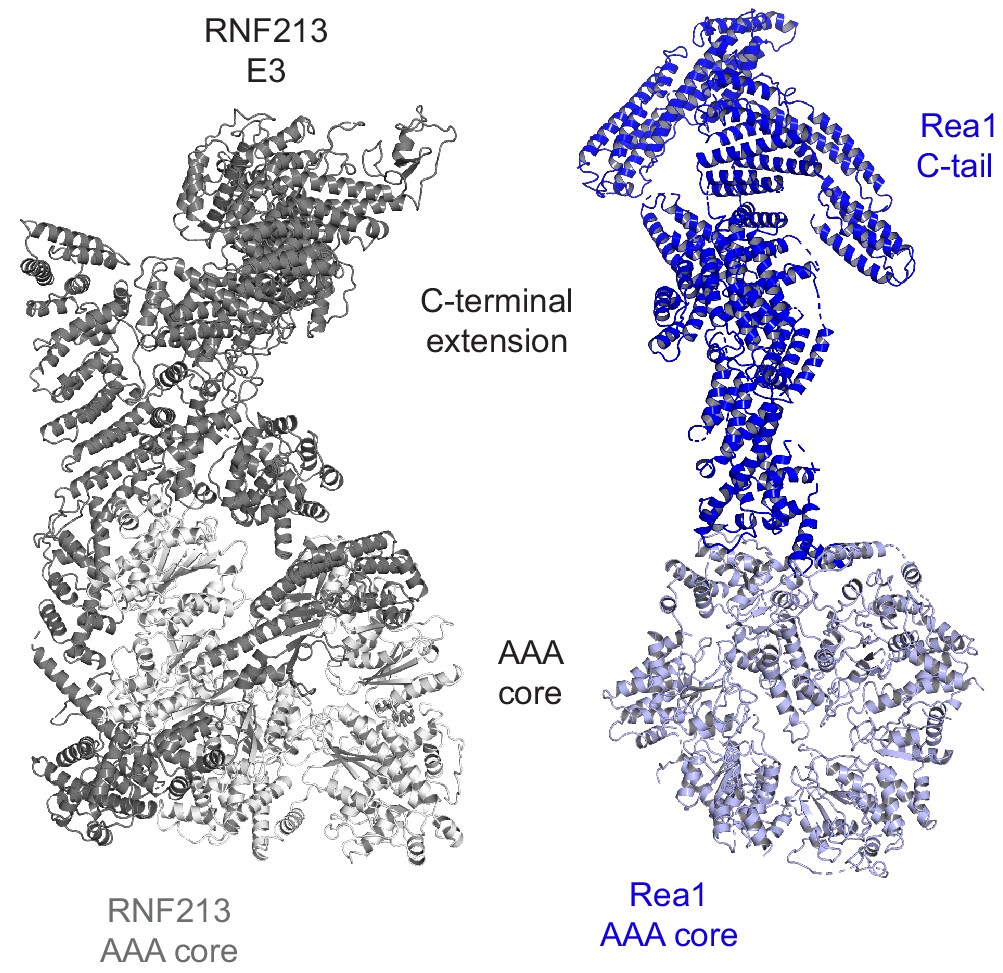
Structural comparison of RNF213 and Rea1.
The picture compares the overall organization of the two AAA6 proteins. From the aligned AAA rings, large C-terminal extensions project into the periphery. In case of RNF213, the tilted AAA6 domain guides the C-terminal E3 extension into a different direction aligning it with the N-arm, which is absent in Rea1.
Figure 3 with 1 supplement
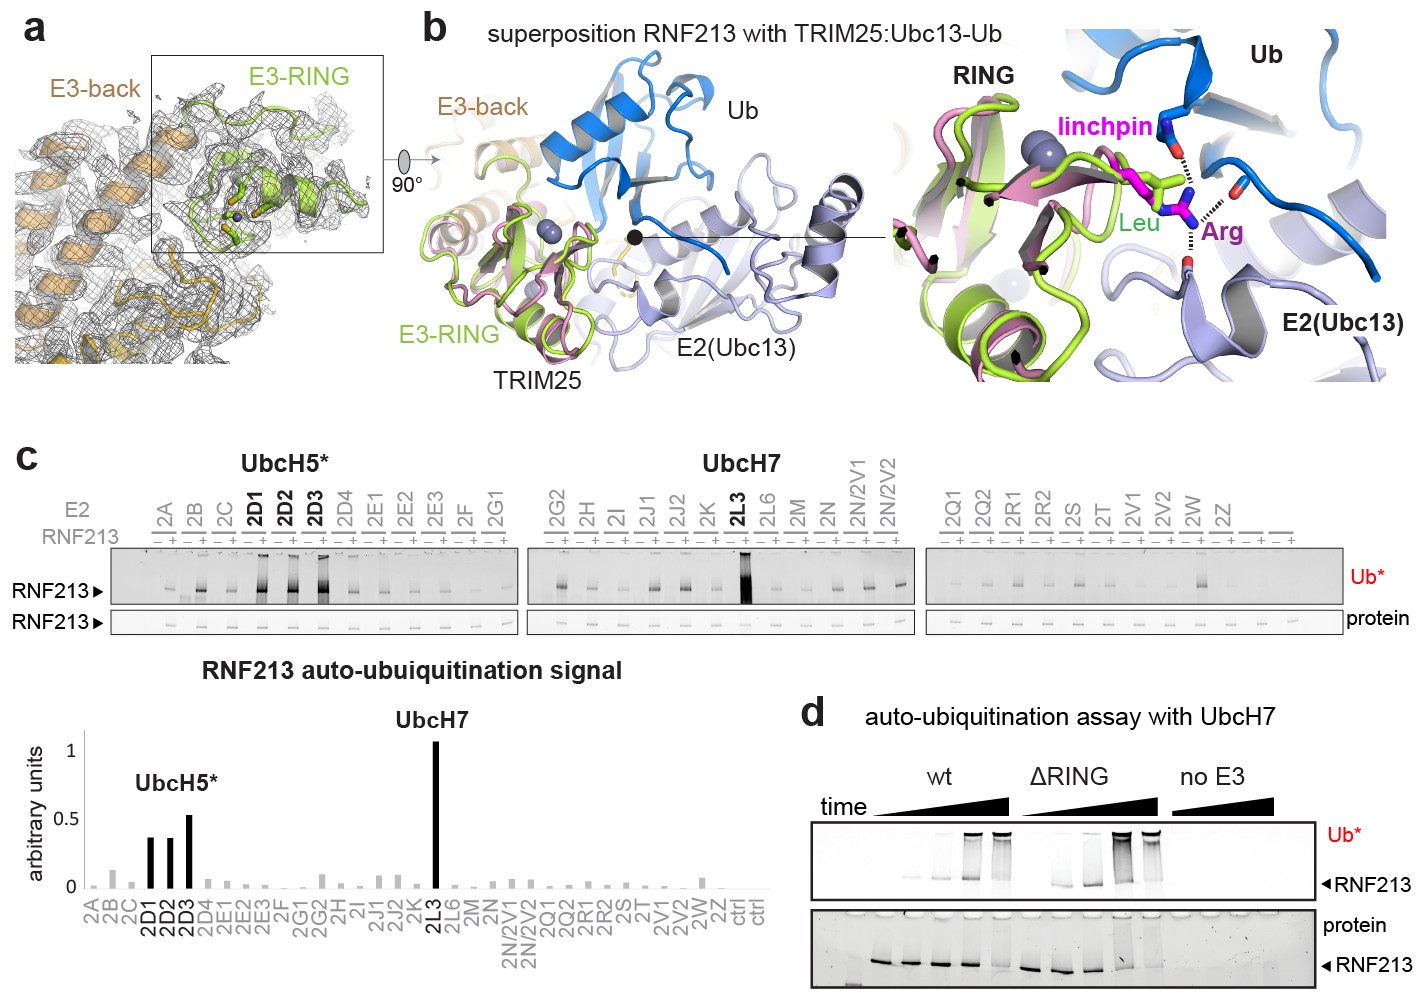
E3 ligase function of RNF213.
(a) EM density of the RNF213 RING (green ribbon) and its engaging structural elements in the E3 domain. (b) Superposition with the TRIM25/Ubc13 ~Ub complex (PDB id 5eya; colored in brown, slate, blue, respectively), showing the relative orientation of the three domains in the activated ‘closed’ conformation. Zn2+ ions are shown as spheres. The right panel illustrates the catalytic effect of the Arg linchpin in TRIM25, aligning Ub and Ubc13 (important hydrogen bonds are indicated as dashed lines). The corresponding RNF213 linchpin, Leu3986, cannot undergo such interactions. (c) E2 screen, monitoring RNF213 auto-ubiquitination with various E2 enzymes. The panel below shows the quantification of the RNF213-associated poly-Ub signal, revealing the pronounced E3 activity with UbcH7 relative to the indicated UbcH5 variants. (d) Auto-ubiquitination assay comparing the activities of wt and ΔRING RNF213 in the presence of UbcH7. Equivalent results are seen with UbcH5c (Figure 3—figure supplement 1).
Figure 3—figure supplement 1
Auto-ubiquitination activity of RNF213 in the presence of UbcH5c.
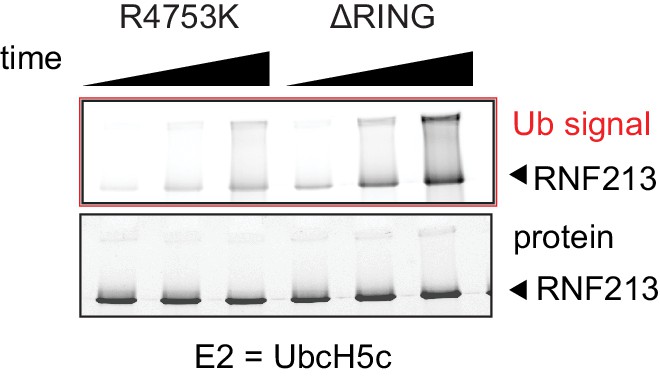
UbcH5c dependent auto-ubiquitination activity of R4753K MMD and ΔRING mutants. Like the wt protein, both mutants retain E3 activity with UbcH5c.
Figure 4 with 1 supplement
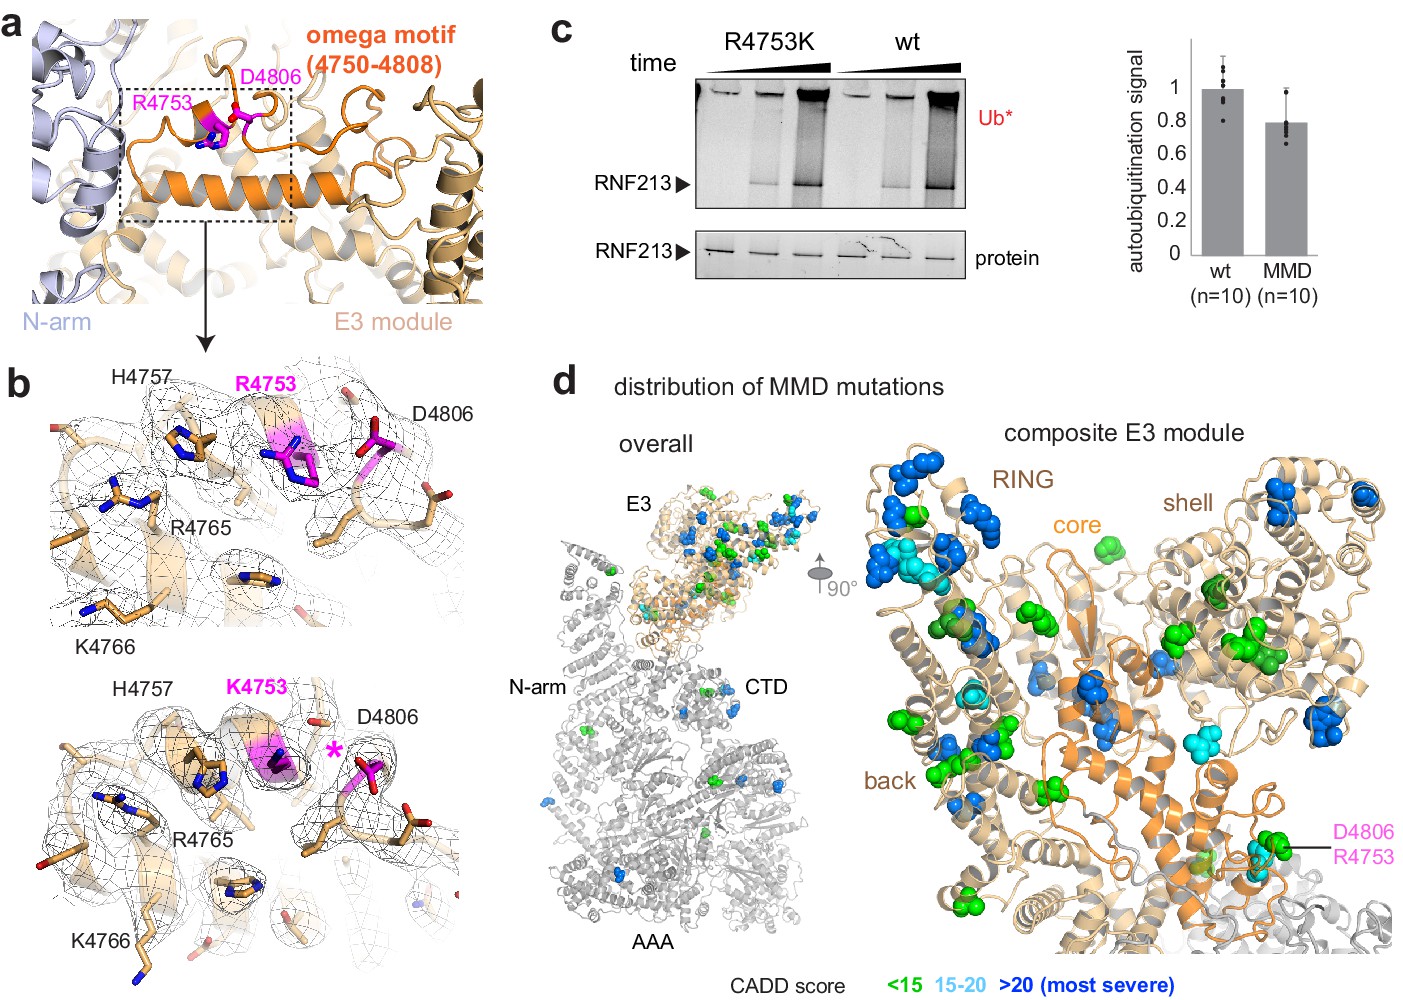
Structural analysis of MMD mutations.
(a) Arg4753 stabilizes the ‘omega’ motif (orange), located in the periphery of the E3 domain. Arg4753 and its partner residue Asp4806 are highlighted. (b) Focused cryo-EM maps of wt (top) and R4753K (bottom), showing that the introduced mutation disrupts the Arg4753-Asp4806 salt bridge (pink), leading to local structural changes. Affected side chains are labelled. (c) Auto-ubiquitination assay with UbcH7 comparing the wt and the R4753K mutant. The bar plot represents the quantification of the poly-ubiquitination signal (Ub*), resulting from ten replicated measurements. Error bars indicate standard deviation. (d) MMD-associated mutations (colored spheres) mapped on the cryo-EM structure of RNF213 cluster in the E3 domain, though separated in sequence by ~1000 residues. The zoomed-in window (right panel) shows that all four portions of the E3 module (core sub-domain shown in orange) carry MMD mutations. Residues are colored by CADD score (0–15 green, 15–20 cyan, 20+ blue; listed in Supplementary file 2). The most pathologic mutations (blue) are individually labeled in Figure 4—figure supplement 1.
Figure 4—figure supplement 1
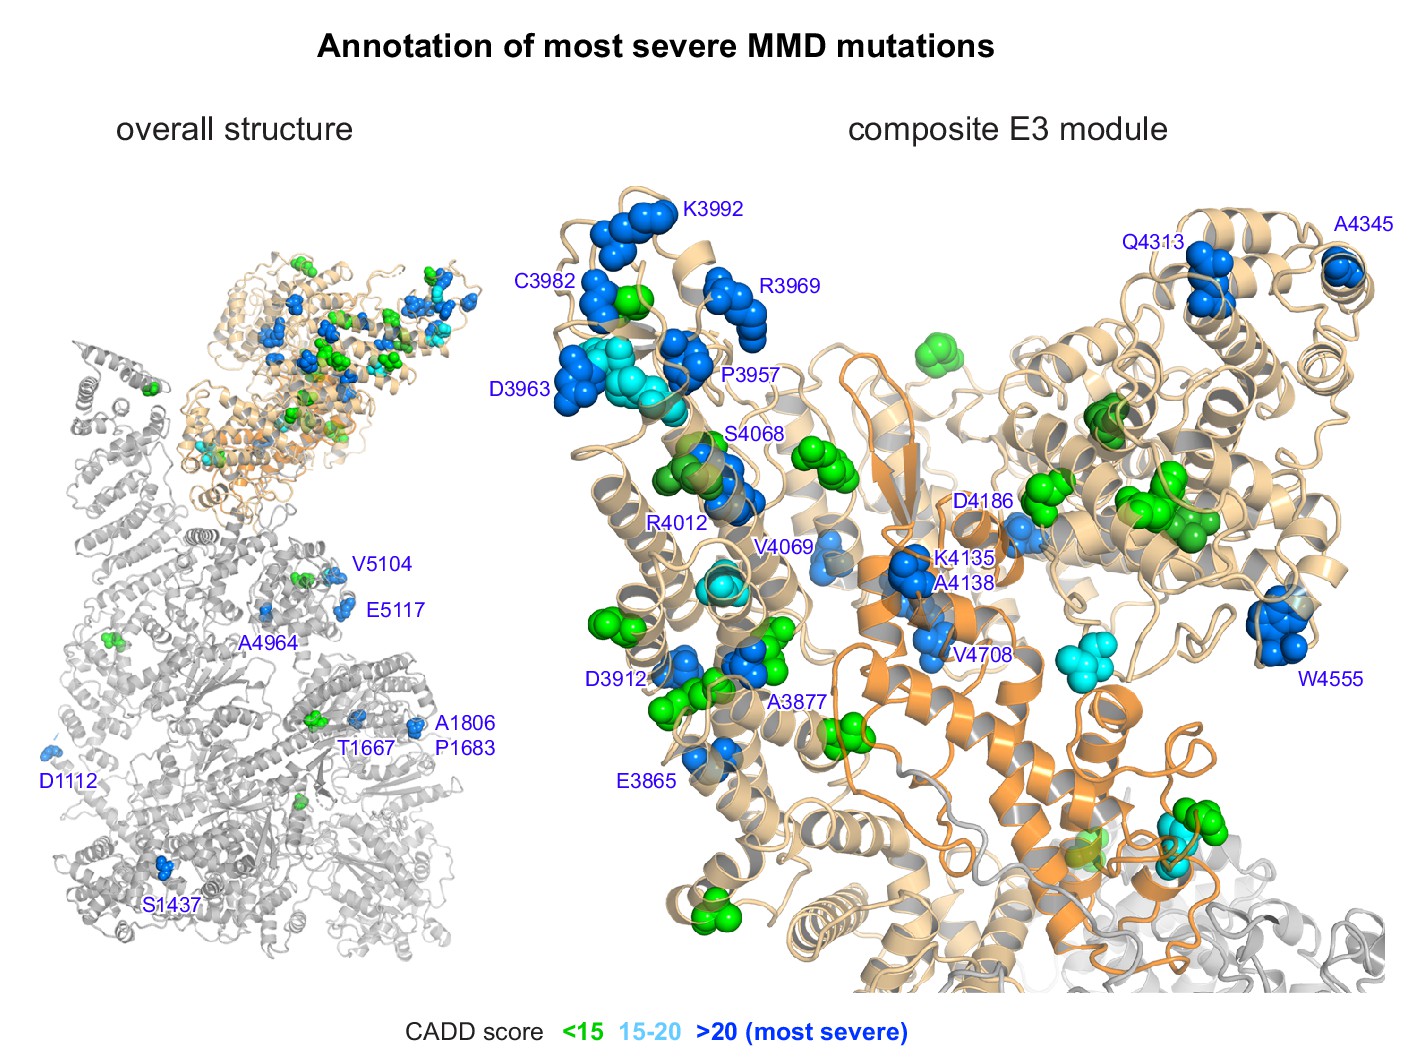
Cryo-EM structure of RNF213 with labeled MMD mutations.
For clarity, only the most severe mutations with a CADD score >20 are labeled (blue). The left panel shows the overall structure, the right an enlarged view on the composite E3 module.
Author response image 1
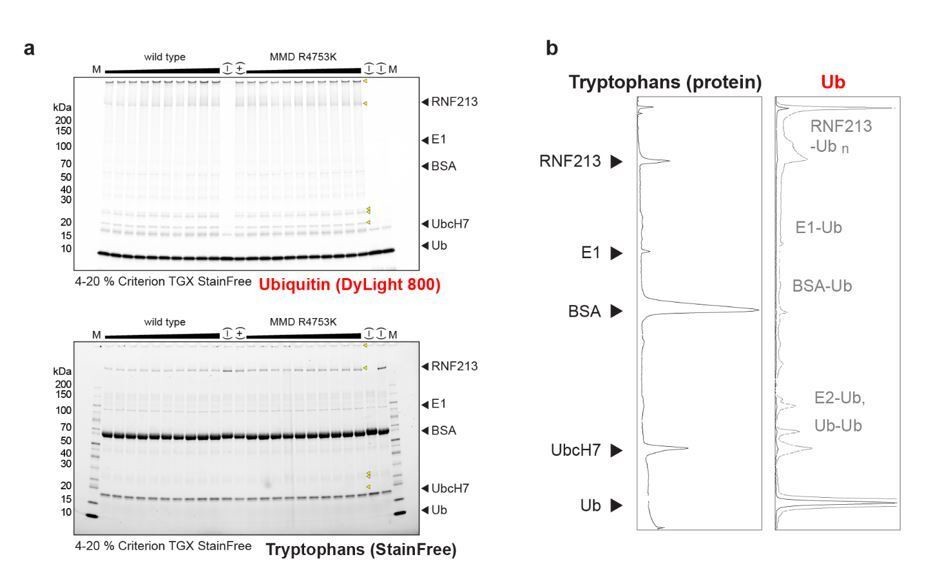
Full gel images used to quantify wt and R4753K RNF213 auto-ubiqitination activity.
(a) The ubiquitin signal (via DyLight 800 label, top panel) and the total protein signal (via tryptophan Stain-Free in-gel labeling, bottom panel) are shown separately. Yellow triangles point to ubiquitinated species. The shallow gradient on top indicates the concentration of RF213 used (80%-120% of the nominal value 0.4 µM). (b) Densitometric plot of the positive control, shown in lane 13:(+). Despite RNF213 being a minor protein component in the mix, the majority of ubiquitin is transfered onto RNF213 rather than on more abundant species like BSA or the E2. For the densitometry of the Ub signal, the saturated signal excluding free ubiquitin is shown in grey.
Videos
Video 1
Dynamics of the RNF213 molecule.
The movie shows representative states seen in negative staining EM, in which the E3 module moves relative to the rest of the protein, most noticeably changing the distance between the E3 module and the proximal end of the N-arm.
Video 2
Cryo-EM density in the central AAA region.
The movie illustrates the nucleotide binding site of AAA2 and the regulatory insertions IR5 (orange) and IR3 (orange) located near the AAA4 and AAA3 active sites, respectively. The bound ATP (AAA2) is highlighted in green.
Video 3
Overall structure of RNF213.
The movie shows the overall architecture of RNF213 by highlighting the different domains from N- to C-terminus and their respective cryo-EM densities.
Tables
Table 1
Cryo-EM data collection, refinement and validation statistics.
| Wild type (EMDB-10429) (PDB 6TAX) | R4753K (EMDB-10430) (PDB 6TAY) | |
|---|---|---|
| Data collection and processing | ||
| Magnification | 130kx | 130kx |
| Voltage (kV) | 300 | 300 |
| Electron exposure (e–/Å2) | 59.9 | 47.3 |
| Defocus range (μm) | –1.5 to –3.5 | –0.8 to –2.0 |
| Pixel size (Å) | 1.04 | 1.04 |
| Symmetry imposed | C1 | C1 |
| Initial particle images (no.) | ||
| Final particle images (no.) | 374683 | 426312 |
| Map resolution (Å) FSC threshold | 3.2 0.143 | 3.2 0.143 |
| Map resolution range (Å) | 3.1-6.5 | 2.9-6.5 |
| Refinement | ||
| Initial model used (PDB code) | none | none |
| Model resolution (Å) FSC threshold | 3.3 0.5 | 3.3 0.5 |
| Model resolution range (Å) | 3.1-6.5 | 2.9-6.5 |
| Map sharpening B factor (Å2) | –50 | –50 |
| Model composition Non-hydrogen atoms Protein residues Ligands | 35241 4383 ATP, Zn, Mg | 35235 4382 ATP, Zn, Mg |
| B factors (Å2) Protein Ligand (ATP) | 86 64 | 64 50 |
| R.m.s. deviations Bond lengths (Å) Bond angles (°) | 0.011 1.17 | 0.007 1.01 |
| Validation MolProbity score Clashscore Poor rotamers (%) | 1.9 5.9 0.5 | 1.7 4.6 0.2 |
| Ramachandran plot Favored (%) Allowed (%) Disallowed (%) | 90.1 9.8 0.2 | 91.8 8.2 0.1 |
Key resources table
| Reagent type (species) or resource | Designation | Source or reference | Identifiers | Additional information |
|---|---|---|---|---|
| Gene (Mus musculus) | RNF213 | RefSeq | HGNC:14539; RefSeq: NP_001035094.2 | |
| Strain, strain background (Escherichia coli) | DH10EmBacY | Geneva Biotech | DH10EmBacY | Strain propagated locally from source commercial stock |
| Strain, strain background (Escherichia coli) | BL21(DE3) | Sigma-Aldrich | CMC0016; RRID:NCBITaxon_ 469008 | Strain propagated locally from source commercial stock |
| Strain, strain background (AcMNPV) | EmBacY | Geneva Biotech | ||
| Cell line (Spodoptera frugiperda) | Sf9 | Thermo Fisher Scientific | IPLB-Sf-21-AE; RRID:CVCL_0549 | Strain propagated locally from source commercial stock |
| Cell line (Trichoplusia ni) | High Five | Thermo Fisher Scientific | BTI-TN-5B1-4; RRID:CVCL_C190 | Strain propagated locally from source commercial stock |
| Recombinant DNA reagent | pCLA00001 | This paper | addgene: 138607; RRID:Addgene_ 138607 | Bac-to-Bac compatible plasmid with wt RNF213 |
| Recombinant DNA reagent | pCLA00002 | This paper | addgene: 138608; RRID:Addgene_138608 | Bac-to-Bac compatible plasmid with MMD RNF213 |
| Recombinant DNA reagent | pCLA00003 | This paper | addgene: 138609; RRID:Addgene_138609 | Bac-to-Bac compatible plasmid with ΔRING RNF213 |
| Peptide, recombinant protein | RNF213 wild type | This paper | NP_001035094.2: p. = | Internal ID:Mys1b |
| Peptide, recombinant protein | RNF213 MMD | This paper | NP_001035094.2: p.R4753K | Internal ID:Mys18a |
| Peptide, recombinant protein | RNF213 ΔRING | This paper | NP_001035094.2: p.3941_3999delinsGSGSG | Internal ID:Mys_Mm_20a |
| Peptide, recombinant protein | Ub_fluor | This paper | NP_066289.3 (1–76): p.1_2insGPLCGS | Cysteine-labelable ubiquitin, based on DOI:10.1038/s41589-019-0426-z |
| Commercial assay or kit | DSS-H12/D12 | Creative Molecules | 001S | Cross-linking reagent used for XL-MS |
| Commercial assay or kit | DyLight 800 Maleimide | Thermo Fisher Scientific | 46621 | |
| Other | 4–20% Criterion TGX Stain-Free Protein Gel | Bio-Rad | 5678095 | For ubiqutination assay analysis |
| Other | Quantifoil R2/2 Cu 200 | Quantifoil | Quantifoil R2/2 Cu 200 | EM grid used for wt RNF213 |
| Other | UltrAuFoil R2/2 Au 200 | Quantifoil | UltrAuFoil R2/2 Au 200 | EM grid used for MMD RNF213 |
| Software, algorithm | FoldIndex | doi:10.1093/bioinformatics/bti537 | RRID:SCR_018390 | |
| Software, algorithm | CADD | doi:10.1093/nar/gky1016 | RRID:SCR_018393 | https://cadd.gs.washington.edu/snv |
| Software, algorithm | hhpred | doi:10.1093/nar/gki408 | RRID:SCR_010276 | https://toolkit.tuebingen.mpg.de/tools/hhpred |
| Software, algorithm | MUSCLE | doi:10.1093/nar/gkh340 | RRID:SCR_011812 | https://www.drive5.com/muscle/ |
| Software, algorithm | Fiji | other | RRID:SCR_002285 | https://fiji.sc/ |
| Software, algorithm | Sphire | other | RRID:SCR_018391 | http://sphire.mpg.de/ |
| Software, algorithm | gctf | doi:10.1016/j.jsb.2015.11.003 | RRID:SCR_016500 | https://www.mrc-lmb.cam.ac.uk/kzhang/ |
| Software, algorithm | ctffind | doi:10.1016/j.jsb.2015.08.008 | RRID:SCR_016732 | https://grigoriefflab. umassmed.edu/ |
| Software, algorithm | Relion | doi:10.7554/eLife.42166 | RRID:SCR_016274 | https://www3.mrc-lmb.cam.ac.uk/relion/ |
| Software, algorithm | cryoSPARC | doi:10.1038/nmeth.4169 | RRID:SCR_016501 | https://cryosparc.com/ |
| Software, algorithm | UCSF Chimera | doi:10.1016/j.jsb.2006.06.010 | RRID:SCR_004097 | https://www.cgl.ucsf.edu/chimera/ |
| Software, algorithm | MotionCor2 | doi:10.1038/nmeth.4193 | RRID:SCR_016499 | https://emcore.ucsf.edu/ucsf-motioncor2 |
| Software, algorithm | cryolo | doi:10.1038/s42003-019-0437-z | RRID:SCR_018392 | https://sphire.mpg.de/wiki/ |
| Software, algorithm | O | doi:10.1107/s0108767390010224 | RRID:SCR_018394 | http://xray.bmc.uu.se/~alwyn/TAJ/Home.html |
| Software, algorithm | USCF ChimeraX | doi:10.1002/pro.3235 | RRID:SCR_015872 | https://www.rbvi.ucsf.edu/chimerax/ |
| Software, algorithm | Pymol | other | RRID:SCR_000305 | https://pymol.org/2/ |
| Software, algorithm | Phenix | doi:10.1107/S2059798318006551 | RRID:SCR_014224 | https://www.phenix-online.org/ |
| Software, algorithm | xiSEARCH | doi:10.1074/mcp.M115.049296 | RRID:SCR_018395 | https://www.rappsilberlab.org/software/xisearch/ |
| Software, algorithm | MS amanda | doi:10.1021/pr500202e | RRID:SCR_018396 | http://ms.imp.ac.at/?goto=msamanda |
| Software, algorithm | IMP-apQuant | doi:10.1021/acs.jproteome.8b00113 | RRID:SCR_018397 | http://ms.imp.ac.at/index.php?action=apQuant |
Additional files
-
Supplementary file 1
Multiple alignment of RNF213 orthologs.
Sequences were retrieved from NCBI non redundant protein database or from UniProt reference proteomes with the following accessions: Mus musculus (NCBI: ref|NP_001035094.2), Homo sapiens (Uniprot: sp|Q63HN8), Gallus gallus (NCBI: ref|XP_015151083.1), Xenopus laevis (Uniprot: tr|A0A1L8ETH7), Danio rerio (Uniprot: sp|A0A0R4IBK5); sequences were aligned with MAFFT version 7.427 (27), and visualized with Jalview26. Alpha helices (grey) and beta strands (black) are derived from the cryo-EM structure and shown on top. Residues with no structural data are indicated by a dashed line. At the bottom, positions with MMD mutations are marked by polygons, where green represents a low (<15), magenta an intermediate (<20) and red a high CADD score (>=20). Arrows indicate domain borders. Within the AAA+ domains, functional residues for nucleotide binding and hydrolysis are indicated by letters (A, Walker A; B, Walker B; S1, sensor I; S2, sensor II; RF, arginine finger). Regions IR3, IR5, and the E3-RING are enframed.
- https://cdn.elifesciences.org/articles/56185/elife-56185-supp1-v1.pdf
-
Supplementary file 2
RNF213 variants associated with MMD.
For each variant, listed are the corresponding residue in mouse RNF213, whether the residue is conserved between mouse and human, the cDNA variants considered, and the CADD score for the least-scoring cDNA variant. The domain each residue belongs to is also indicated. CADD scores >= 20 are highlighted in red. Variant annotations refer to the RNF213 isoform 1 (RefSeq NM_001256071.3, human genome assembly GRCh38.p13). The lower panel shows the distribution per RNF213 module, highlighting the accumulation of MMD mutations in the composite E3 domain.
- https://cdn.elifesciences.org/articles/56185/elife-56185-supp2-v1.docx
-
Supplementary file 3
Imaging and reconstruction details of wt and R4753K RNF213.
- https://cdn.elifesciences.org/articles/56185/elife-56185-supp3-v1.docx
-
Supplementary file 4
Processed crosslinking MS data of wt RNF213.
- https://cdn.elifesciences.org/articles/56185/elife-56185-supp4-v1.xlsx
-
Transparent reporting form
- https://cdn.elifesciences.org/articles/56185/elife-56185-transrepform-v1.docx
Download links
A two-part list of links to download the article, or parts of the article, in various formats.
Downloads (link to download the article as PDF)
Open citations (links to open the citations from this article in various online reference manager services)
Cite this article (links to download the citations from this article in formats compatible with various reference manager tools)
Moyamoya disease factor RNF213 is a giant E3 ligase with a dynein-like core and a distinct ubiquitin-transfer mechanism
eLife 9:e56185.
https://doi.org/10.7554/eLife.56185


