Social interactions drive efficient foraging and income equality in groups of fish
- Department of Neurobiology, Weizmann Institute of Science, Israel
- Department of Molecular and Cellular Biology, Harvard University, United States
Figures
Figure 1 with 2 supplements
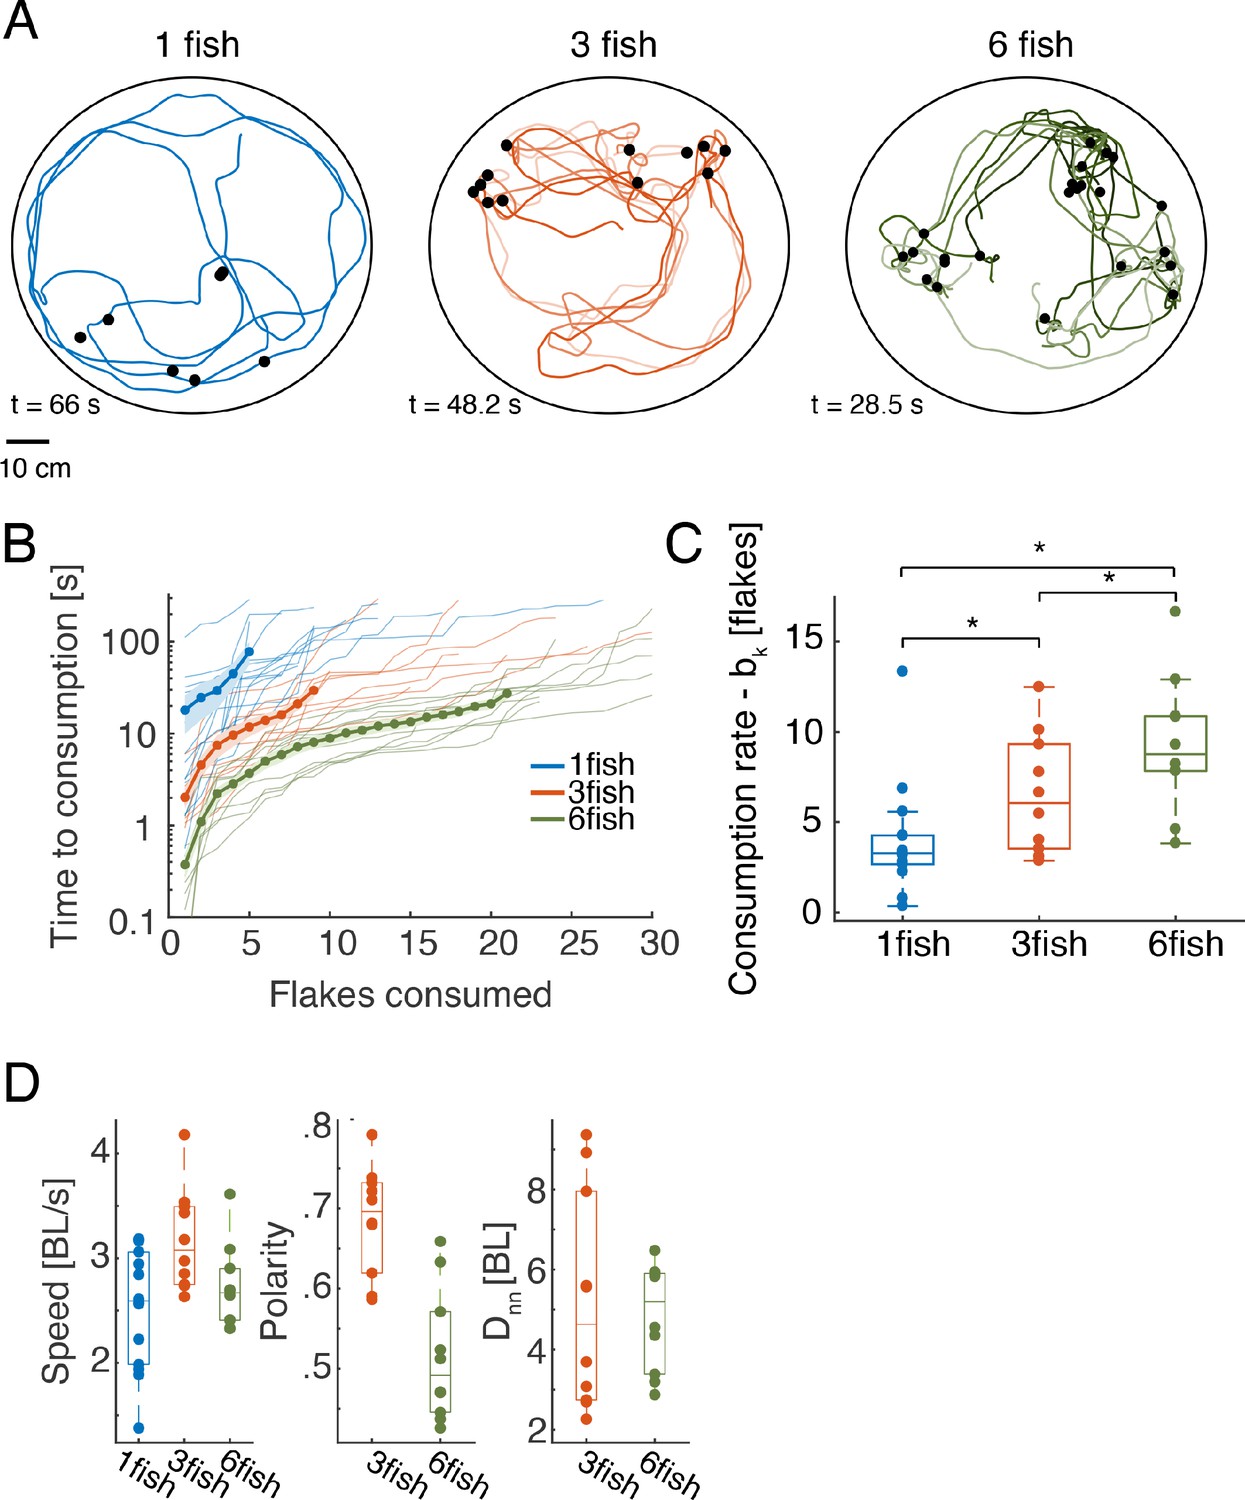
Individual and group foraging by adult zebrafish.
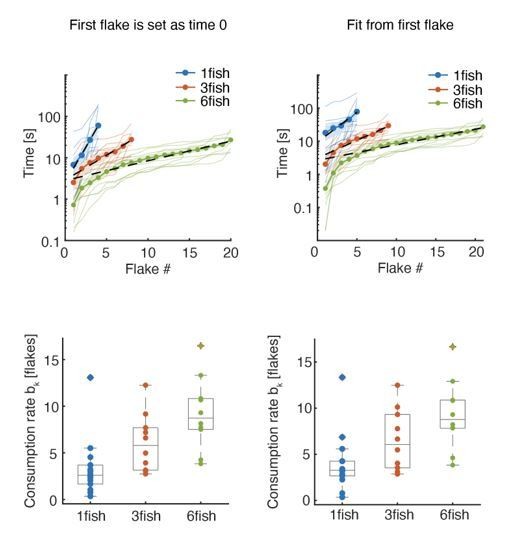
(A) Example trajectories of groups of one, three, and six fish foraging for food flakes. Colored lines show the trajectories of individual fish, black dots show the location of flakes consumed by the fish. (B) Time of consumption of the ith flake in the arena is shown for each of the groups tested (thin lines show N = 14, 10, and 10 groups of one, three, and six fish, correspondingly) overlaid with the mean of all groups for every group size (thick line); light shaded areas represent SEM. (Because individual groups of the same size did not always consume the same total number of flakes, averages were calculated over the first 5, 9, and 21 flakes consumed by the groups of one, three, and six fish, respectively, and the number of consumed flakes is truncated at 30 for clarity; the full curves are shown in Figure 1—figure supplement 1C; We emphasize that all analyses were conducted on the full curves). (C) Boxplots show the rate of flake consumption bk that was fitted for each of the groups shown in B. Middle horizontal lines represent median values and box edges are the 1st and 3rd quartiles; asterisks denote p<0.05 under Wilcoxon’s rank-sum test, N = 14,10,10 groups of fish. (D) Average speed, polarity, and nearest neighbor distance for individual fish and for the groups. Horizontal lines represent median values and box edges are the 1st and 3rd quartiles.
Figure 1—figure supplement 1
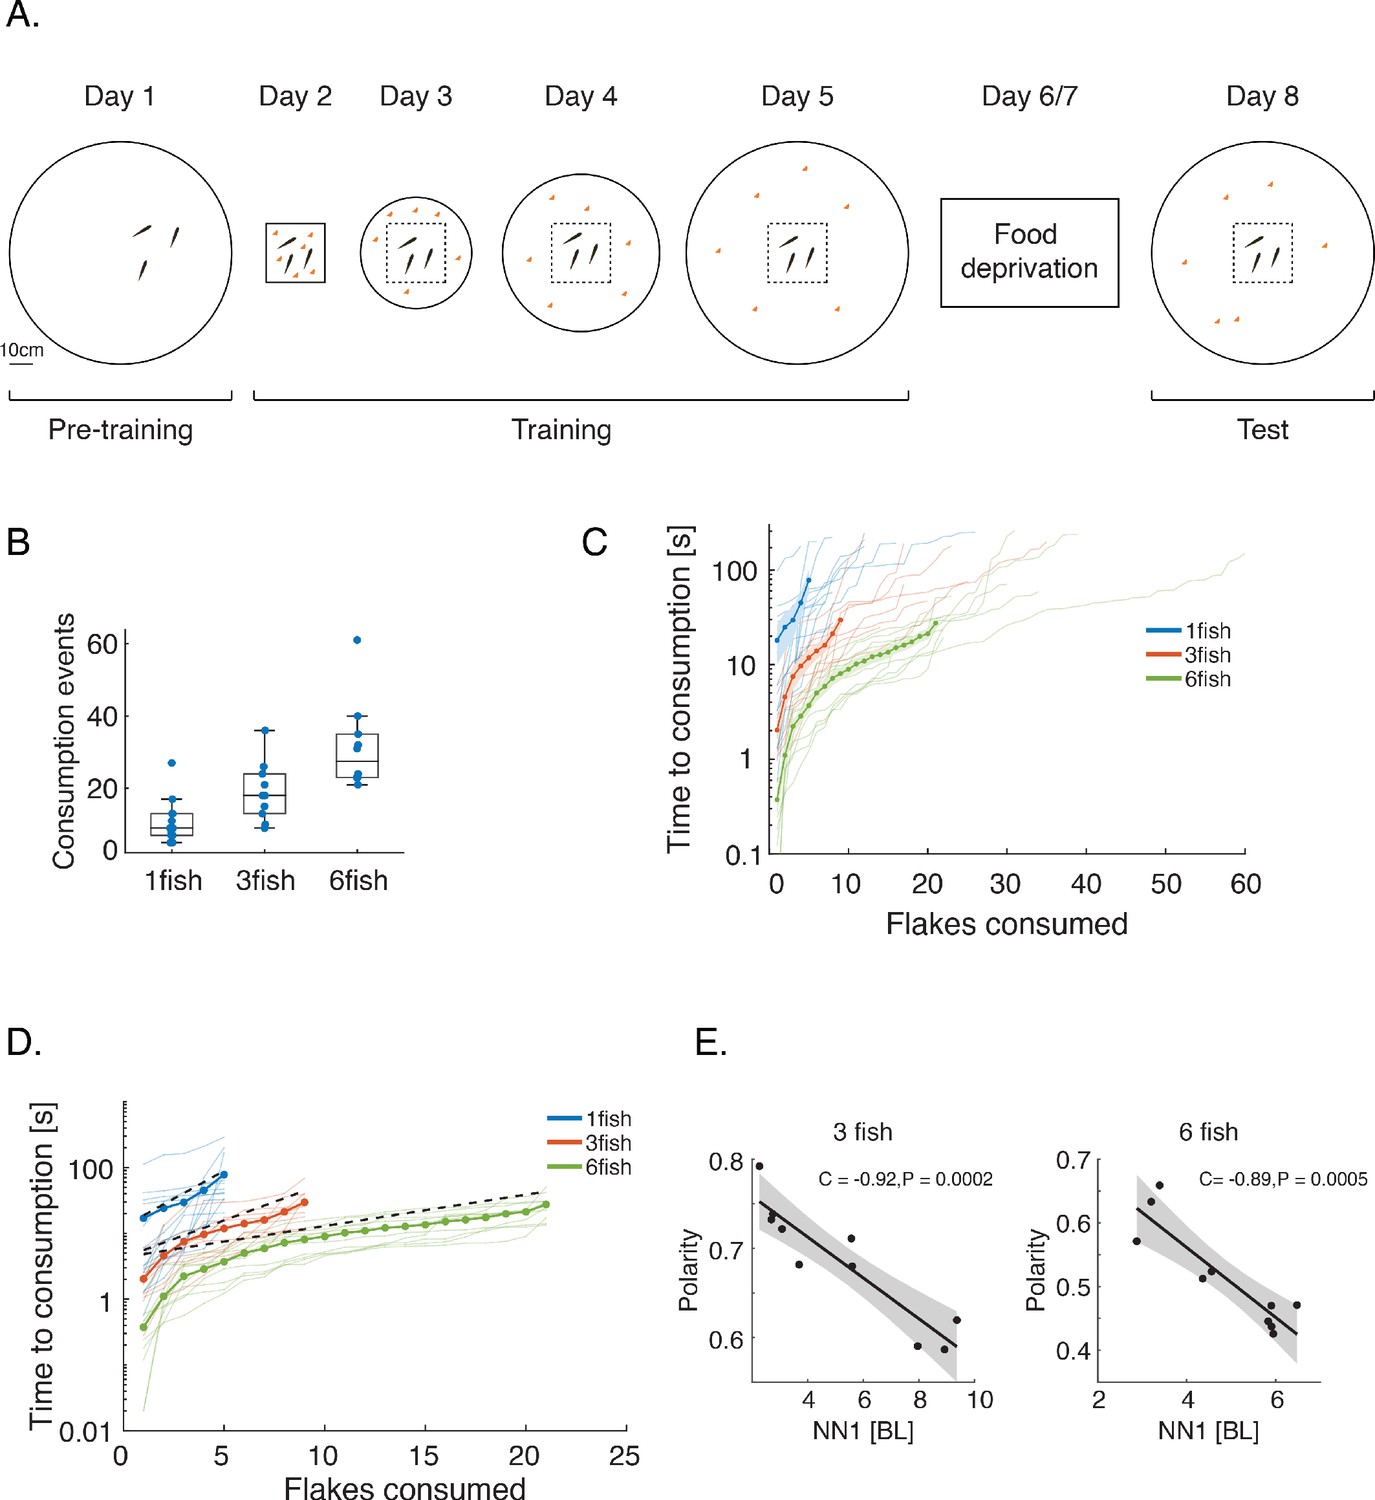
Experimental design for studying free foraging behavior in zebrafish groups.
(A) To facilitate food searching behavior we conducted a 5-day gradual acclimation procedure: After being introduced to the experimental arena with no food present (day 1), on each of the following days (days 2- 5) , fish were placed in a box in the middle of the arena, and then released to an experimental tank (which was enlarged each day) where small flakes of food (shown here by orange dots) were scattered on the water surface (Pratt et al., 2002; Berdahl et al., 2013; Ward et al., 2011; Clutton-Brock et al., 1999). Fish were given 5 min to explore the tank and consume the flakes. Next, fish were deprived of food for two days (days 6–7) in their home tanks. On day 8, we tested foraging behavior of the fish in the large experimental tank; fish images in this panel are not to scale. (B) Number of consumption events recorded for each of the groups tested. Horizontal lines show the median values of consumption events, and the rectangles show the 1st and 3rd quartiles. (C) Same data as in Figure 1B, showing all consumption events for all group sizes (soft lines) and the averages for the first 5, 9, and 21 flakes as depicted in Figure 1B (dotted lines). (D) Same as in Figure 1B, but showing in addition the expected average rate of simulated independent groups (dotted black lines) (see Figure 3 and Materials and methods), indicating that social interactions increase foraging rates in real groups. (E) Average group polarity is strongly correlated with average nearest neighbor distance in groups of 3 and 6 fish (Pearson’s correlation coefficient, for 10 groups in each case). Dark lines represent the best fit linear model and shaded area is the 95% confidence interval of the model.
Figure 1—video 1
Foraging behavior of fish in a group.
Example group of six fish foraging together for small flakes of food scattered on the water surface. Red circles represent flakes not eaten yet by the fish, colors represent individual fish in the group.
Figure 2 with 2 supplements
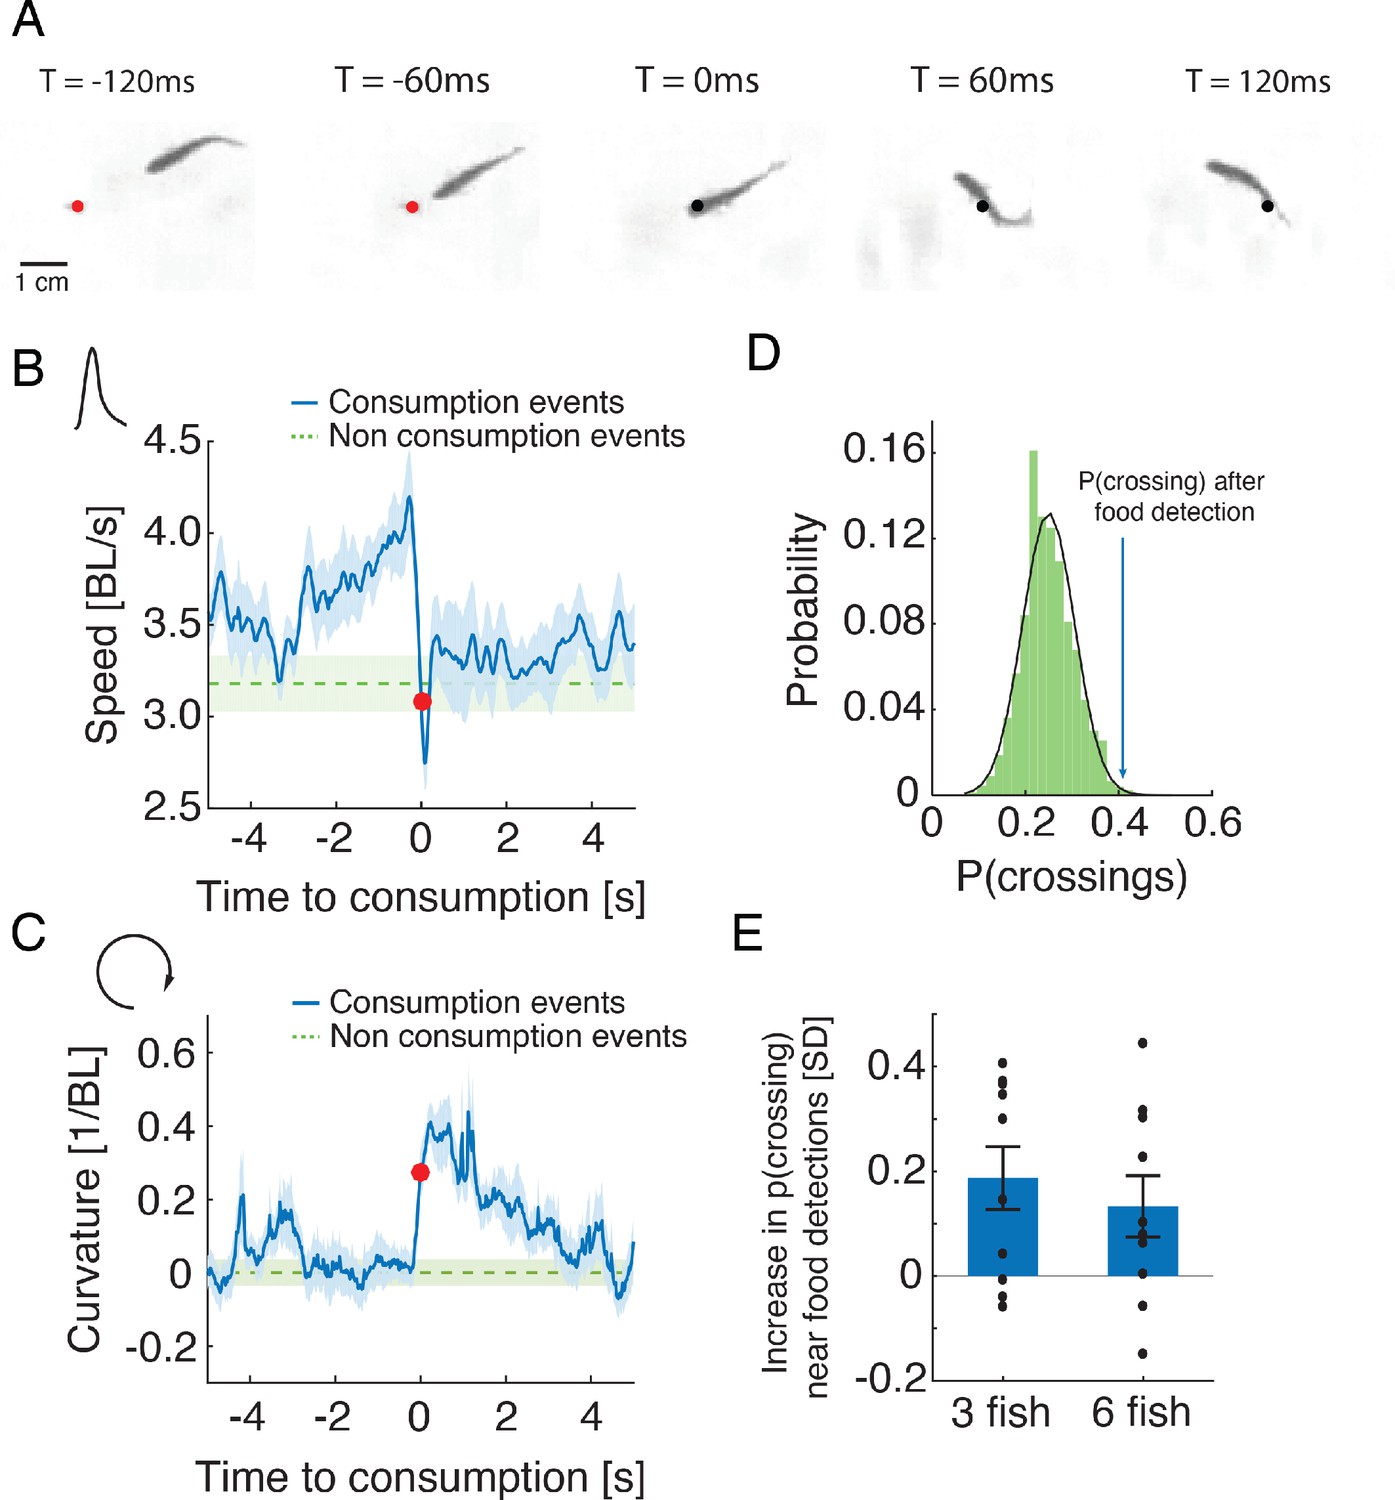
Stereotypical maneuvers before and during flake consumption by one fish attracts its neighbors.
(A) An example of the stereotypical behavior of one fish (in a group of three) showing flake detection and consumption. Flake position is shown by a red circle before consumption and by a black circle after it has been eaten. (B–C) Stereotypical behaviors around flake consumption (denoted by time 0 and marked by a red dot) include a transient increase in speed (shown in body length (BL) per second), followed by a sharp decrease (in B); this is accompanied by an increase in the curvature of the trajectory (in C). Bold blue lines are mean speed and curvature profiles over all detection events of groups of three fish, and dotted green lines show a reference value calculated from random points along the trajectories not related to consumption events (curvature values were normalized such that the average curvature is zero). Light blue and green shadings show SEM. (D) Probability of neighbors to cross within 2 BLs from the location of a previous flake consumption, within 1–4 s following a consumption event, for one group of three fish (blue arrow), compared to the distribution of such neighbor crossing events, if flake consumption events were ignored (Materials and methods). This reference distribution of crossings is well fitted by a Gaussian distribution (mean = 0.25, SD = 0.056), which is shown by a overlaid black line. (E) Crossing probabilities for groups of three and six fish show significant increase from the baseline neighbor crossing distribution of each group, similar to C; 0 represent the mean of the baseline crossing distributions, error bars represent SEM.
Figure 2—figure supplement 1
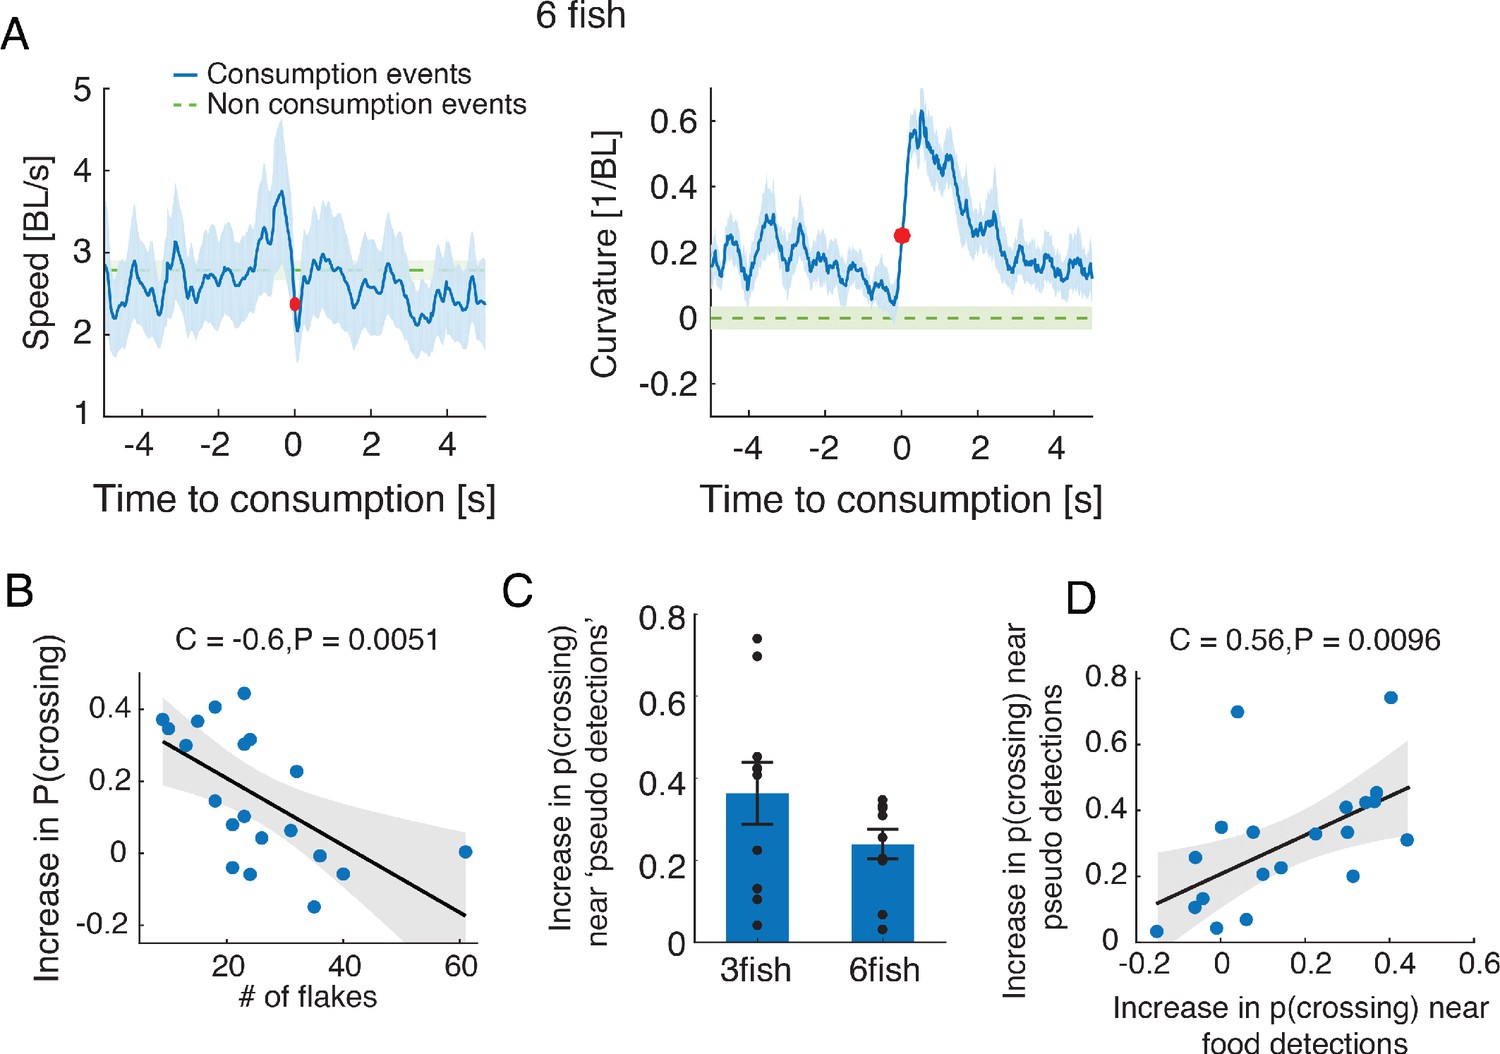
Stereotypical maneuvers before and during flake consumption by one fish attracts its neighbors.
(A) Average speed and curvature near flake consumption of groups of six fish, similar to Figure 2B–C. (B) Increase of probability of fish to be attracted to the location of neighbors’ previous flake consumption decreased as flakes were more abundant in the arena. Pearson’s correlation coefficient, N = 20 (since no significant difference in this relationship was found between groups of three and six fish, both group sizes are included in the same analysis); The shaded area shows the 95% confidence interval of the linear regression model in black. (C) Fish showed a significant increase in tendency to swim towards neighbors when the latter changed their speed in a way that resembled flake consumption events (‘pseudo consumptions’)(p<0.005 for both group sizes, N = 10,10 for groups of three and six fish; Wilcoxon’s signed rank test). (D) The tendency to swim towards flake consumption events and pseudo consumptions was significantly correlated over groups, N = 20 groups (10 groups of three fish and 10 groups of six fish, no differences between group sizes); the shaded area shows the 95% confidence interval of the linear regression model in black.
Figure 2—video 1
Stereotypical maneuvers of fish during flake detection and consumption.
Zoom in on a single fish (swimming in a group of three fish) showing two consecutive events of flake detection and consumption. The fish speeds up toward the flake and turns sharply during consumption.
Figure 3 with 1 supplement
Comparing social and independent foraging using model simulations.
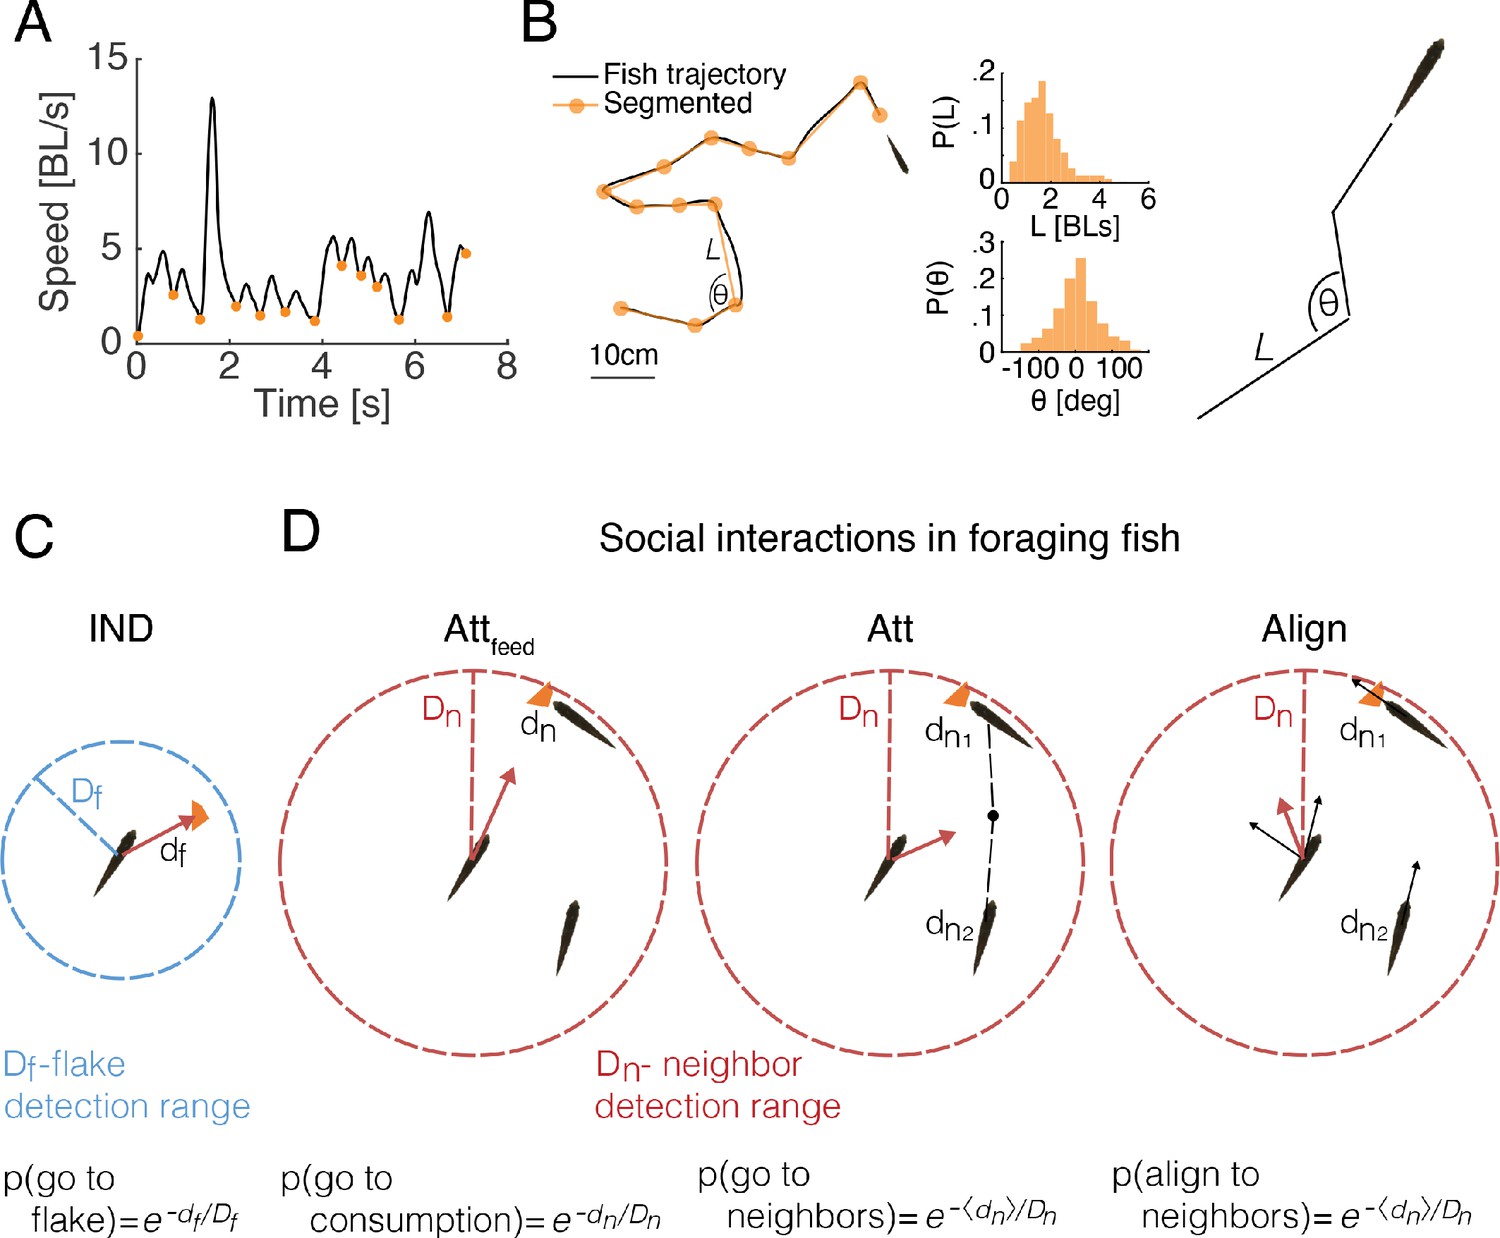
(A) An example of the speed profile of an individual fish in a group. Orange dots mark local minima and are used to segment the continuous motion into discrete events. (B) Left: A snippet of a fish trajectory, corresponding to the speed profile in A and its segmentation into discrete steps (orange line). Middle: Distributions of step size and angle change , between discrete steps over three fish in one of the groups (Materials and methods). Right: sketch of a simulated fish trajectory composed of successive drawings of and from the empirical distributions. (C) A sketch of the independent model of fish foraging: At each time step, if there was a flake within a fish’s detection range ( depicted by the blue circle), the fish oriented towards the flake with a probability p(go to flake). (D) Sketches of the different social interactions between fish. Each fish may detect consumption of flakes by another fish (left), if that fish was within the neighbor detection range ( red circle). The observing fish was then attracted to the consumption point with probability p(go to consumption). Additionally, a fish may respond to the swimming behavior of its neighbors within , regardless of flake consumption, by swimming towards the average position of the neighbors (middle) with probability p(go to neighbors) or by aligning its swimming direction (right) with the neighbors that are within , p(align to neighbors). Different combinations of these possible social interactions comprise the six different social models that we tested (Figure 3—figure supplement 1C, Materials and methods).
Figure 3—figure supplement 1
Models of fish foraging behavior.
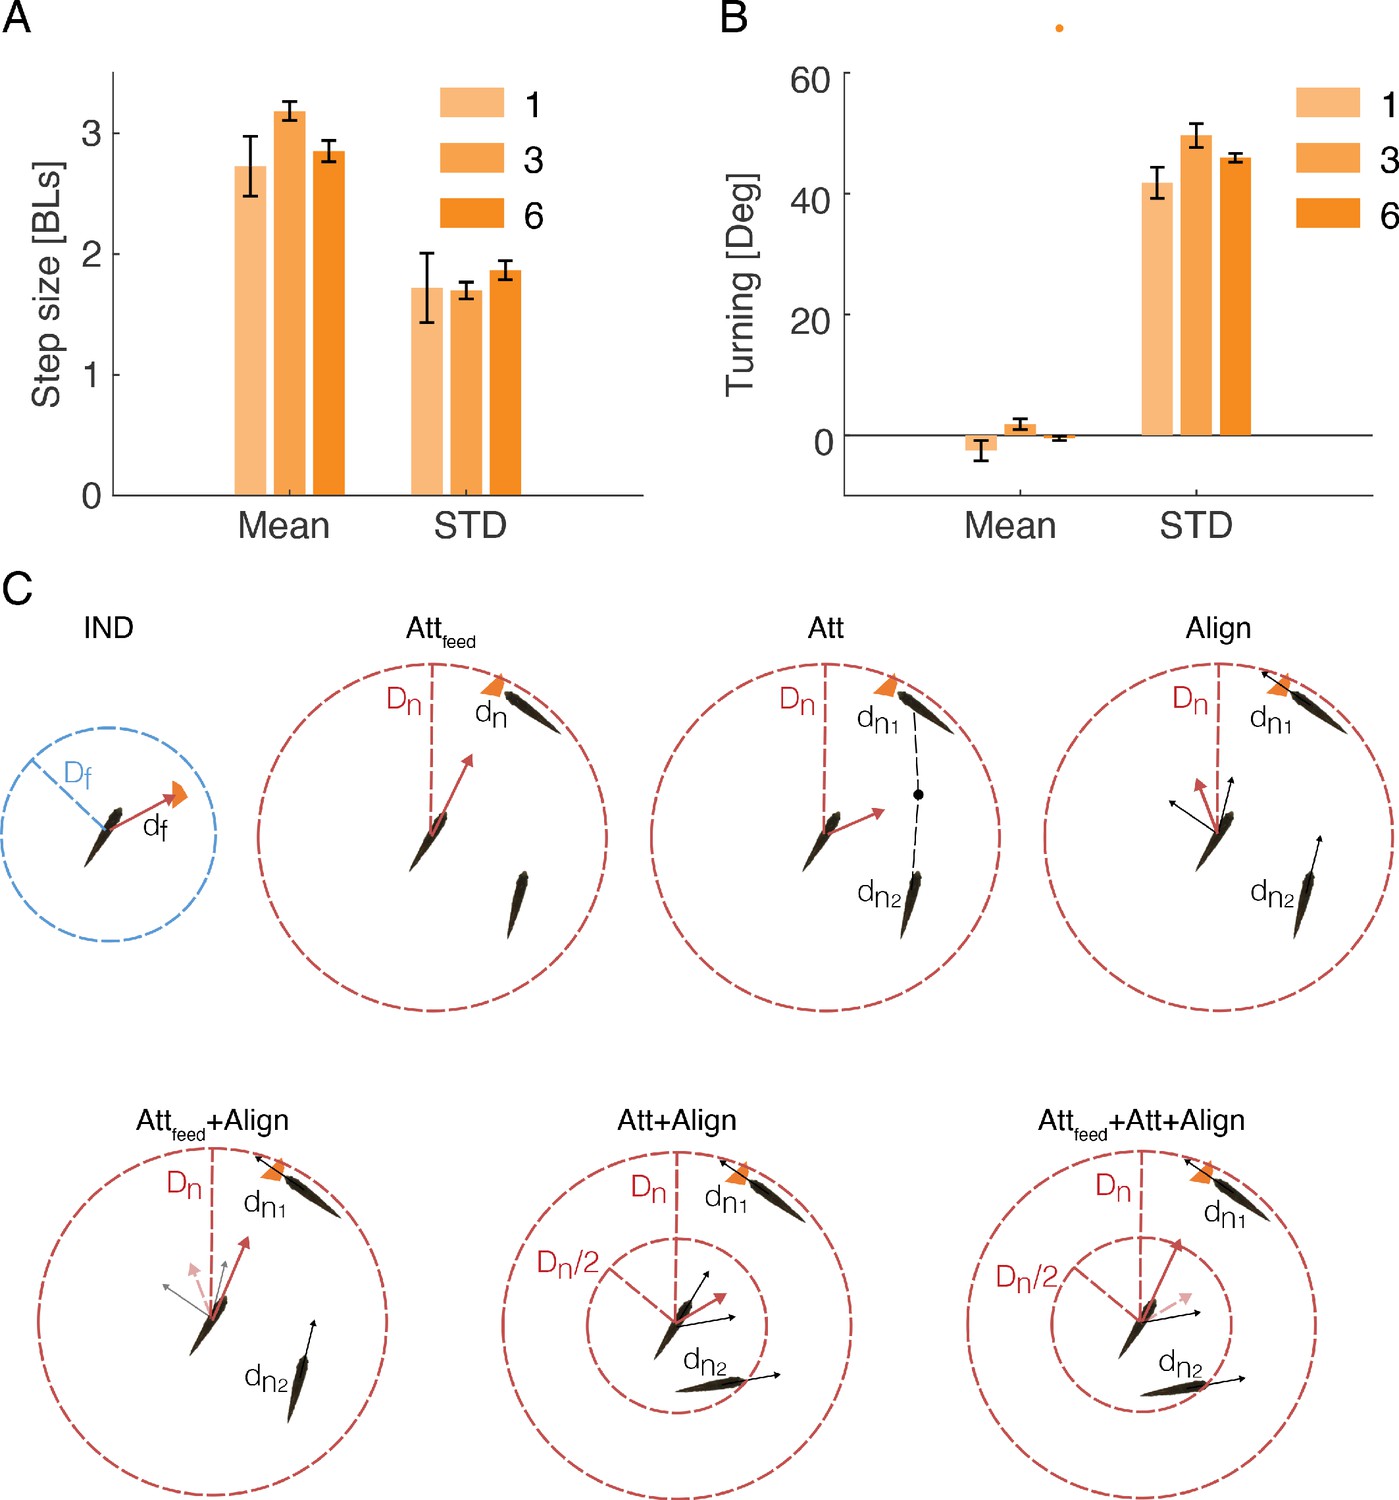
(A) Averages of the mean and standard deviation of the step size distributions estimated for all fish of the same group size (Figure 3B); error bars represent SEM. (B) Same as in A but for the distributions of turns. (C) Sketches of all models used in the study: In the IND model fish swims towards flakes that were closer than the flake detection range . In all social models, if flakes were not detected within , fish responded to the behavior of conspecifics that were within the neighbor detection range . In the Attfeed model, fish oriented toward neighbors’ flake consumptions. In the Att model, fish oriented toward the center of mass of neighbors. In the Align model, fish oriented toward the average swimming direction of their neighbors. In the Attfeed+Align model, fish responded first to neighbors’ previous consumptions. If no consumption events were detected, fish responded as in the Align model. In the Att+Align model, fish responded as in the Align model to neighbors within , and as in the Att model to neighbors within . If there were other fish in both zones, the focal fish responded according to the average of the two response vectors. In the Attfeed+Att+Align model, fish responded first to neighbors’ previous consumptions. If no consumption events were detected, fish responded as in the Att+Align model.
Figure 4 with 1 supplement
Social models incorporating attraction to neighbors’ flake consumptions give the best fit to real foraging groups.
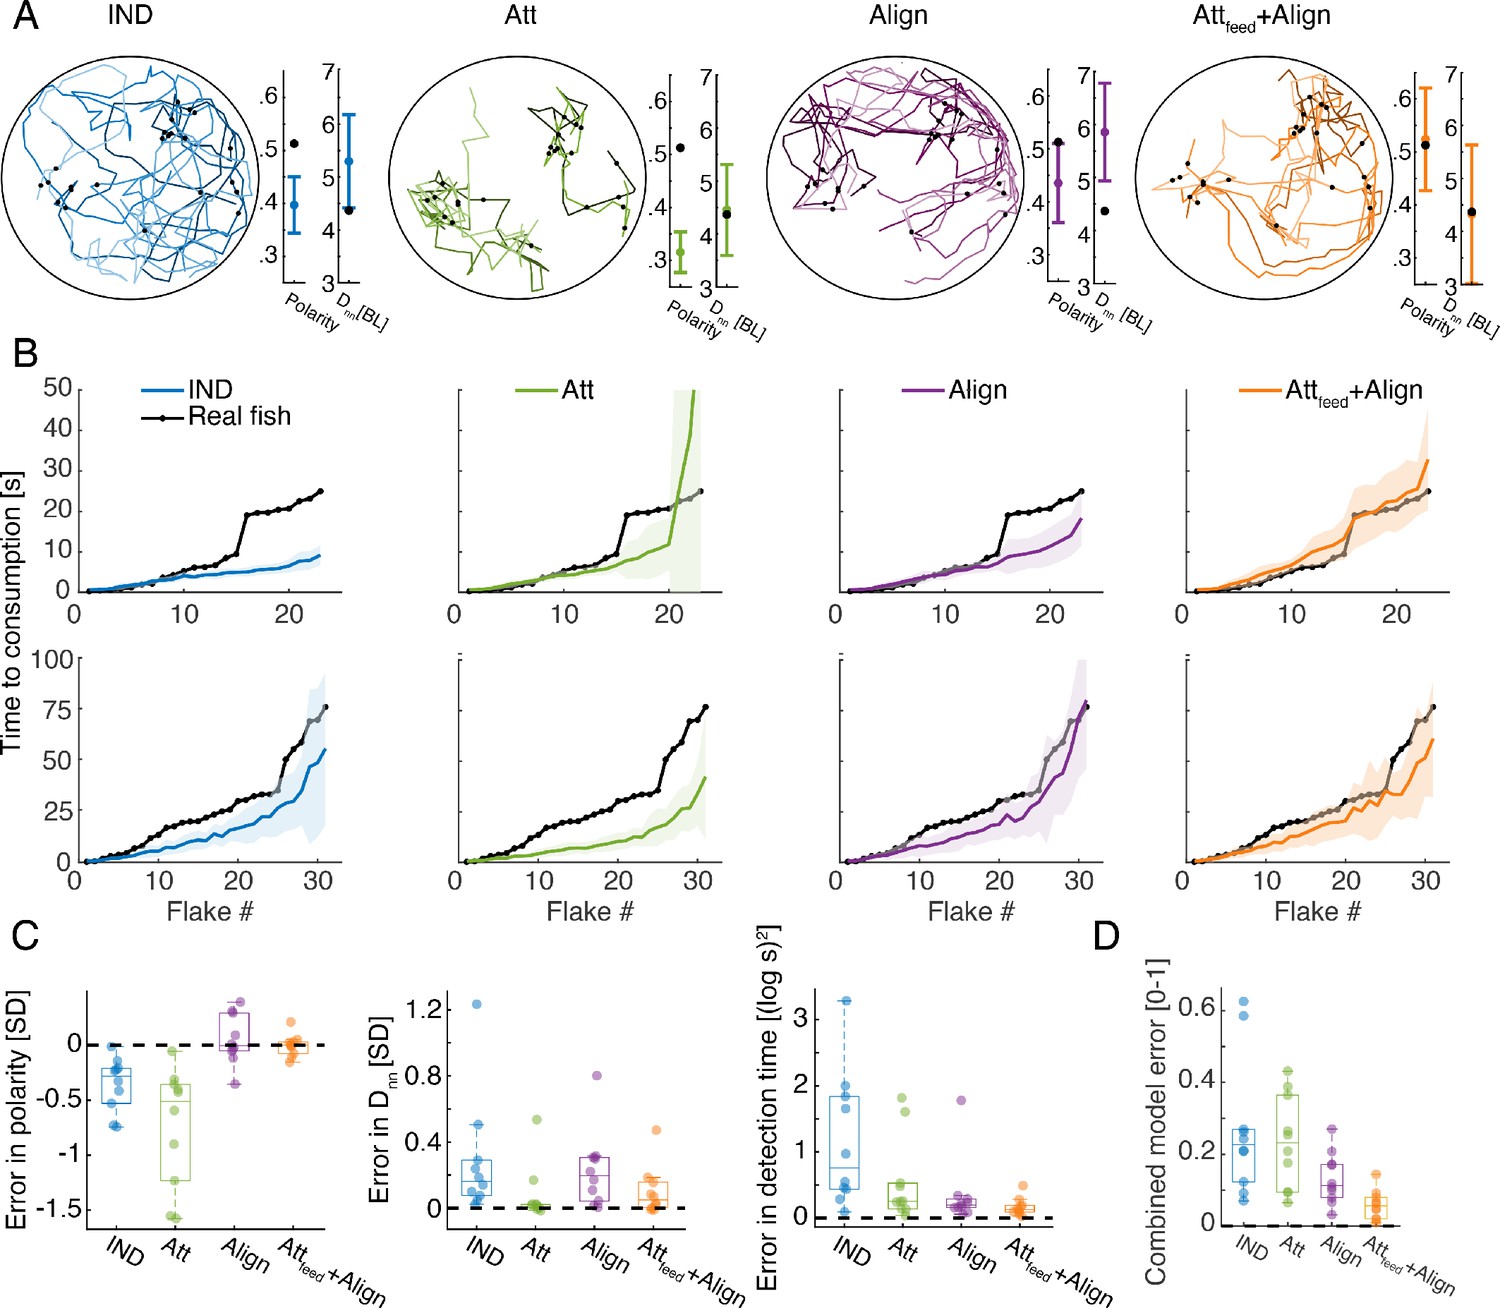
(A) Example trajectories from simulations of foraging of a group of six fish, for the IND, Att, Align, and the Attfeed+Align models that use the parameters that gave the best fit to real group foraging. Colored lines show different individual fish and black dots are flake positions. Next to the simulated trajectories, we plot the average group polarity and nearest neighbor distance in the simulations (colored dots), and the experimental values of the real foraging group (black dots); Error bars represent standard deviation (SD) in the simulation. (B) Flake consumption times (black dots) of two groups of six fish (Top row shows the group whose trajectories are shown in A) and the average and standard deviation of the best-fit models (bold colored lines represent averages; shaded areas represent SD). (C) Errors of best fit models for groups of six fish are shown for three statistics of interest: the polarity of the group , the nearest neighbor distance , and the consumption times where N is the number of flakes consumed. Dots represent different experimental groups; horizontal lines are median values and boxes represent the 1st and 3rd quartiles. Dotted line represents 0 error in prediction or a perfect fit to the data. (D) Combined error of each of the models presented in C. , where all error measures were scaled to be between 0 and 1, by dividing by the largest observed error for that measure. The Attfeed+Align model is significantly more accurate than the IND, Att, and Align models (p<0.005 for all, Wilcoxson’s signed rank test, N = 10 groups, Materials and methods). Each dot represents one group; horizontal lines are median values and boxes represent the 1st and 3rd quartiles.
Figure 4—figure supplement 1
Social models incorporating attraction to flake consumption by neighbors show the best fit to real foraging groups.
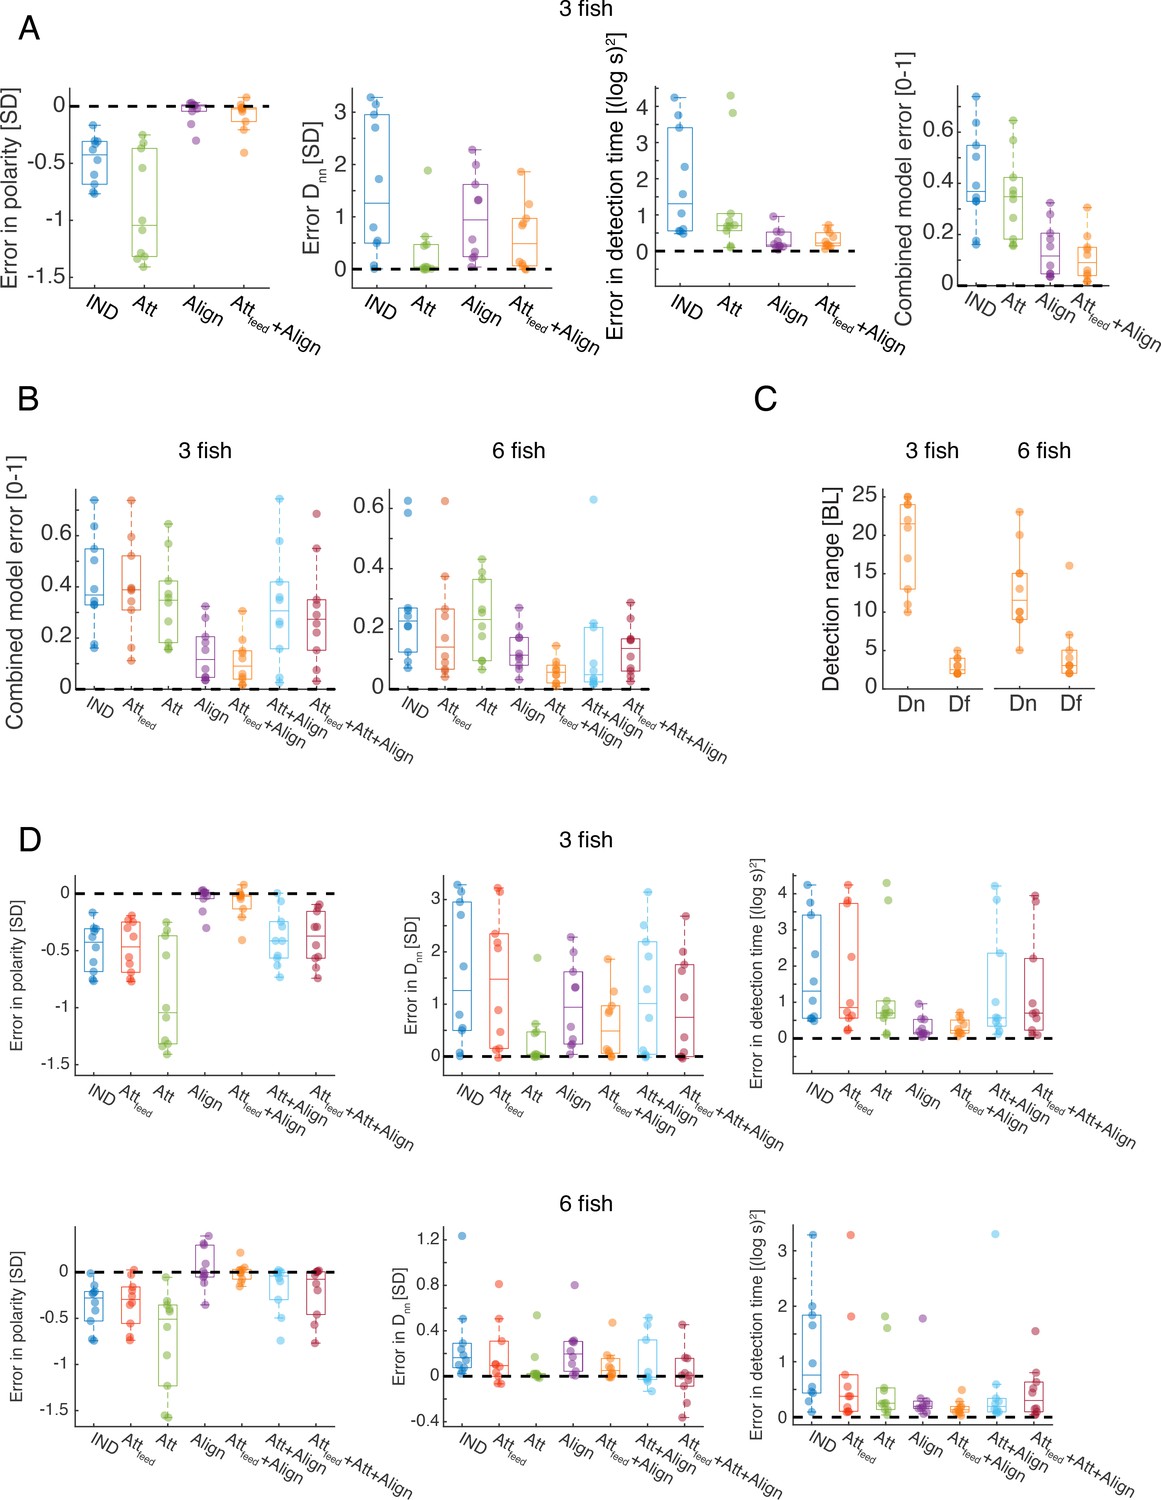
(A) Calculated error for the best fit models for groups of 3 fish, for three statistics of interest - nearest neighbor distance, group polarity and consumption times (See Figure 4C-D) and the combined error based on these three measures (right). Dots represent different experimental groups; horizontal lines are median values and boxes represent the 1st and 3rd quartiles. Dotted lines represent 0 error in prediction or a perfect fit to the data (Materials and methods). (B) Combined error values for all models tested for groups of three and six fish (Figure 4D, Materials and methods). The Attfeed+Align model is significantly more accurate than all other models for both group sizes (P < 0.005, Wilcoxson’s signed rank test, N=10 groups) except for the Att+Align model for groups of six fish (P=0.21). Dots represent different groups; horizontal lines are median values and boxes represent the 1st and 3rd quartiles. (C) The inferred detection ranges for both the flake detection range () and the neighbor detection range () for the Attfeed+Align model. Horizontal lines are median values and boxes represent the 1st and 3rd quartiles. (D) Calculated error for all models for groups of three fish (top row) and six fish (bottom row), for three statistics of interest - nearest neighbor distance, group polarity and consumption times (See Figure 4A-B). Dots represent different experimental groups; horizontal lines are median values and boxes represent the 1st and 3rd quartiles. Dotted lines represent 0 error in prediction or a perfect fit to the data (Materials and methods).
Figure 5 with 1 supplement
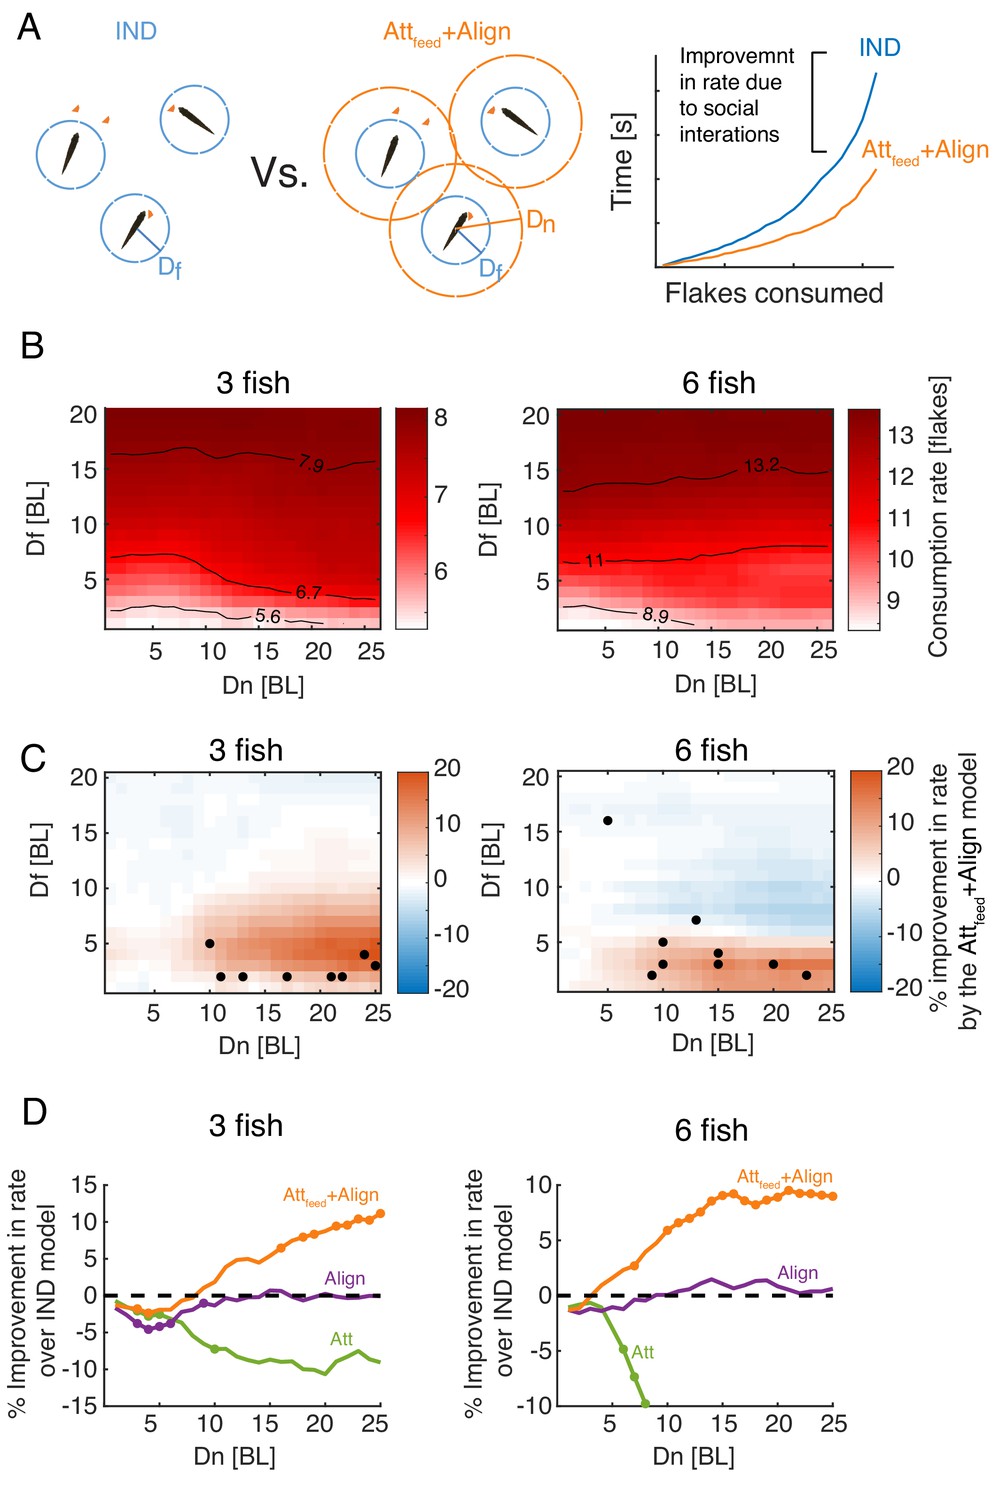
Attraction to neighbors’ feeding results in increased foraging efficiency.
(A) Left: Sketch of two groups of three fish foraging, with their different interaction ranges overlaid. For , the group is composed of independent foragers (IND model). Right: foraging efficiency was estimated by comparing the slope (b; see eq. 1) of the exponential function fitted to the rate of flake consumption of socially interacting agents (Attfeed+Align model) and independent (IND) foragers. (B) Average consumption rates, b, for different combinations of and ; the first column on the left () represent independent foragers. Contours denote 10, 50, and 90% of the highest observed rate. (C) Difference in foraging efficiency for groups that utilize social interactions (Attfeed+Align) compared to groups of independent foragers (IND) for all model parameters. Dots represent and values of simulated groups that best fitted real foraging groups. (D) Average improvement in the rate of flake consumption by socially interacting individuals compared to independent foragers. Colors indicate different social foraging strategies; dotted black line represent no change compared to independent foragers (IND); results were averaged over all simulations with which was the parameter range where real groups were matched by simulations. Colored dots represent statistically significant differences (P<0.05, Wilcoxon’s signed rank test).
Figure 5—figure supplement 1
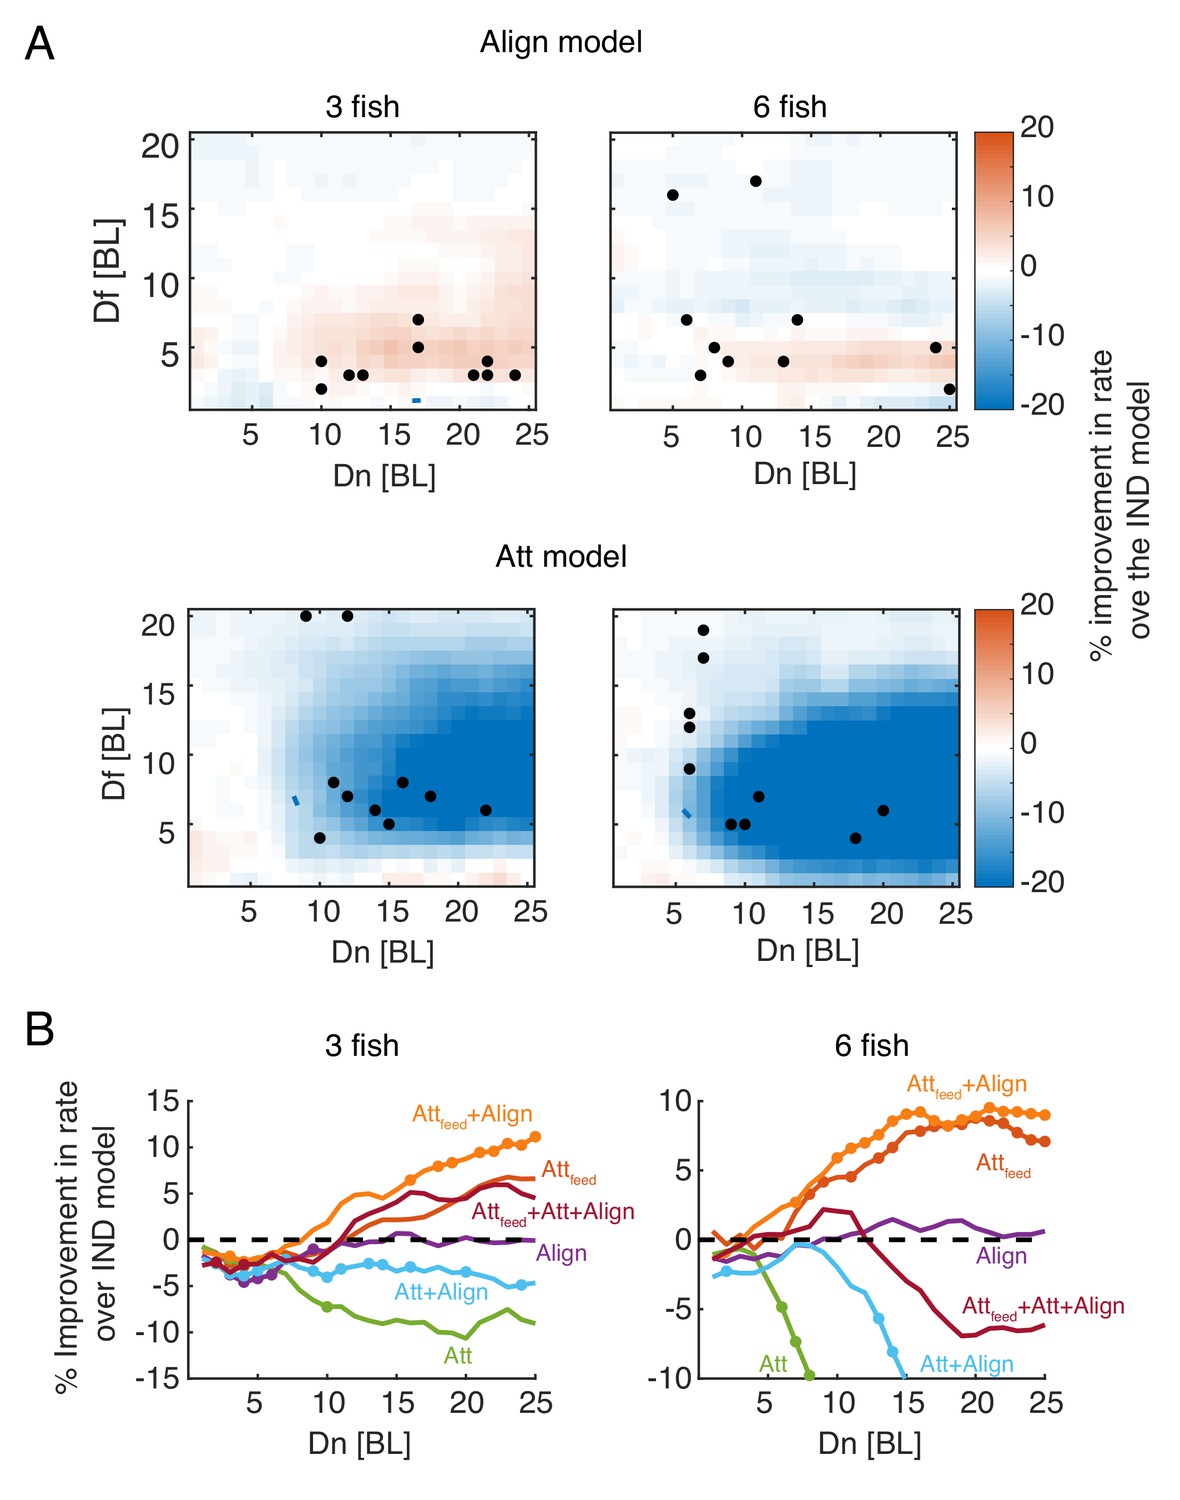
Foraging efficiency and attraction to neighbors’ consumption events.
(A) Difference in foraging efficiency for groups that use alignment (Align model, Top) or attraction (not related to neighbors’ flake consumptions, Att model, Bottom) compared to groups of independent foragers (IND) for all model parameters. Dots represent and values of simulated groups that best fitted real foraging groups. (B) Average improvement in the rate of flake consumption by socially interacting individuals compared to independent foragers. Colors indicate different social foraging strategies; dotted black line represent no change compared to independent foragers (IND); results were averaged over all simulations with which was the parameter range where real groups were matched by simulations; colored dots represent significant differences from the IND model (Wilcoxon’s signed rank test, N=10 groups for each group size). Note that only models that incorporate specific attraction to neighbors’ previous flakes consumptions (Attfeed and Attfeed+Align models) show increased foraging efficiency.
Figure 6 with 2 supplements
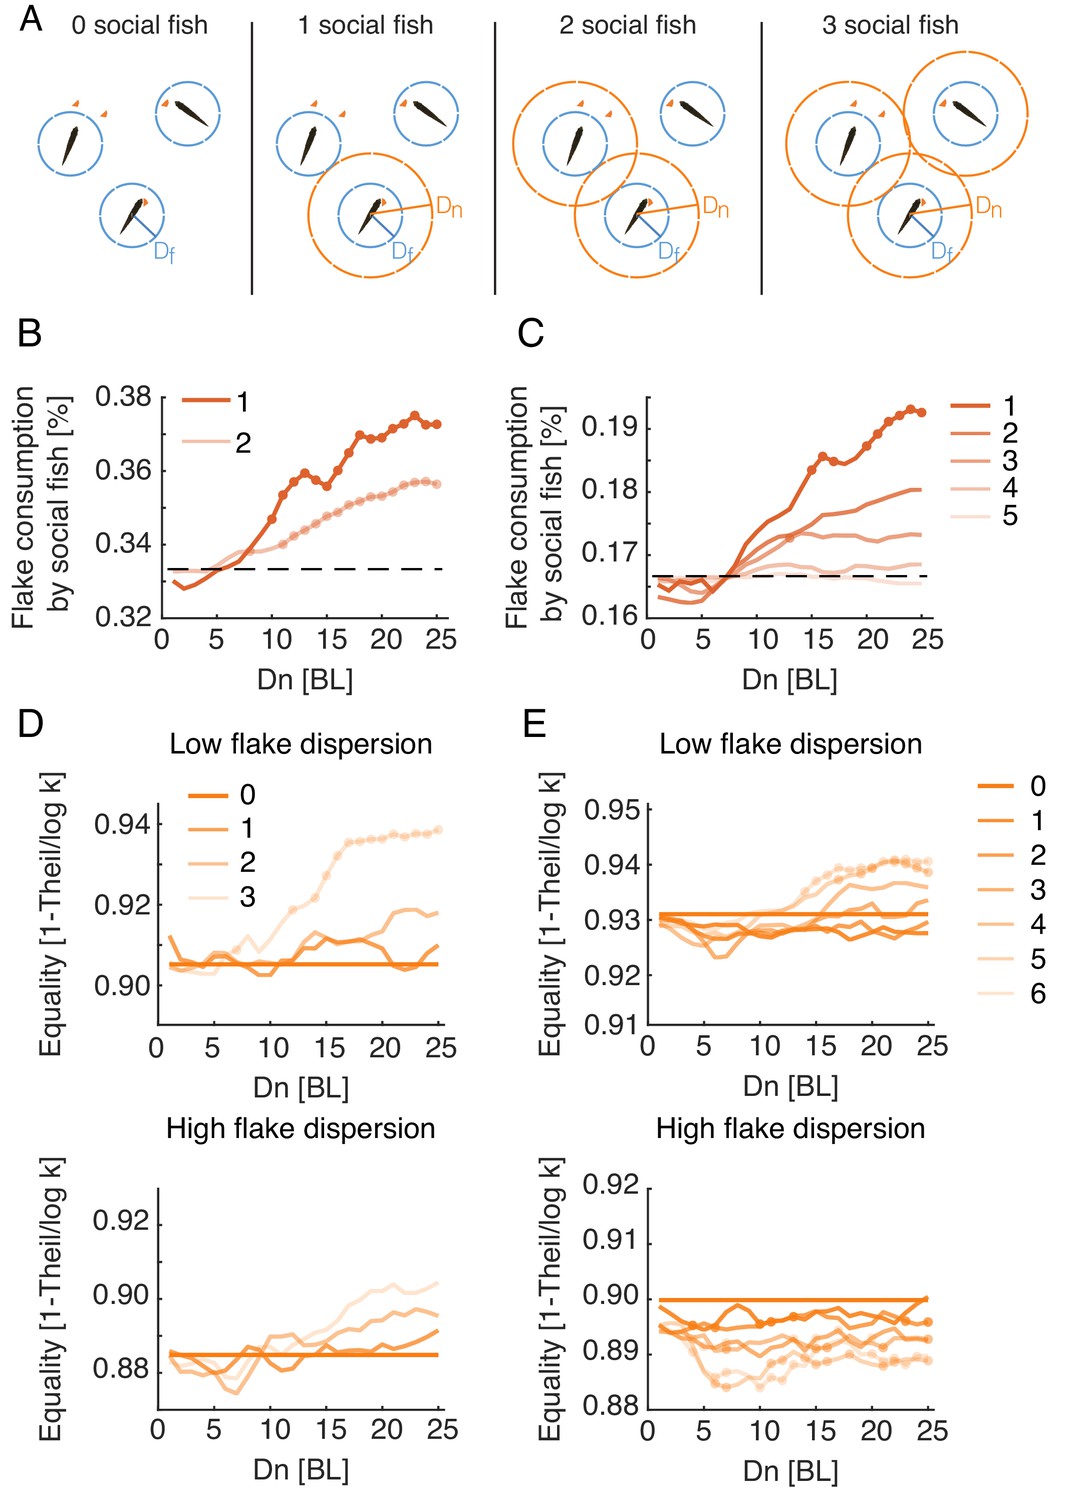
Social interactions promote individual foraging efficiency and income equality within groups.
(A) Sketch showing simulated groups of three fish with a varying number of foragers who use the Attfeed+Align strategy during foraging. (B, C) Average fraction of flakes consumed by the socially interacting individuals in the same simulated group. Colors indicate the number of social foragers in the group; dotted lines show the expected consumption values if resources were distributed equally among foragers; results were averaged over all simulations with , which was the parameter range where real groups were matched by simulations; dots represent significant increase in efficiency of social foragers over independent foragers within the group (Wilcoxon’s signed rank test, N=10, 10). (D, E) Equality of food distribution within groups, measured by (Eq. 2). Lighter colors represent a larger fraction of social foragers. Data is shown for both low flake dispersion environments (top), and high dispersion (bottom) (Figure 6—figure supplement 2B). Equality values were averaged over ; dots show a significant difference from independent foragers (0 social fish) (Wilcoxon’s signed rank test; N=5 for each group size and dispersion level).
Figure 6—figure supplement 1
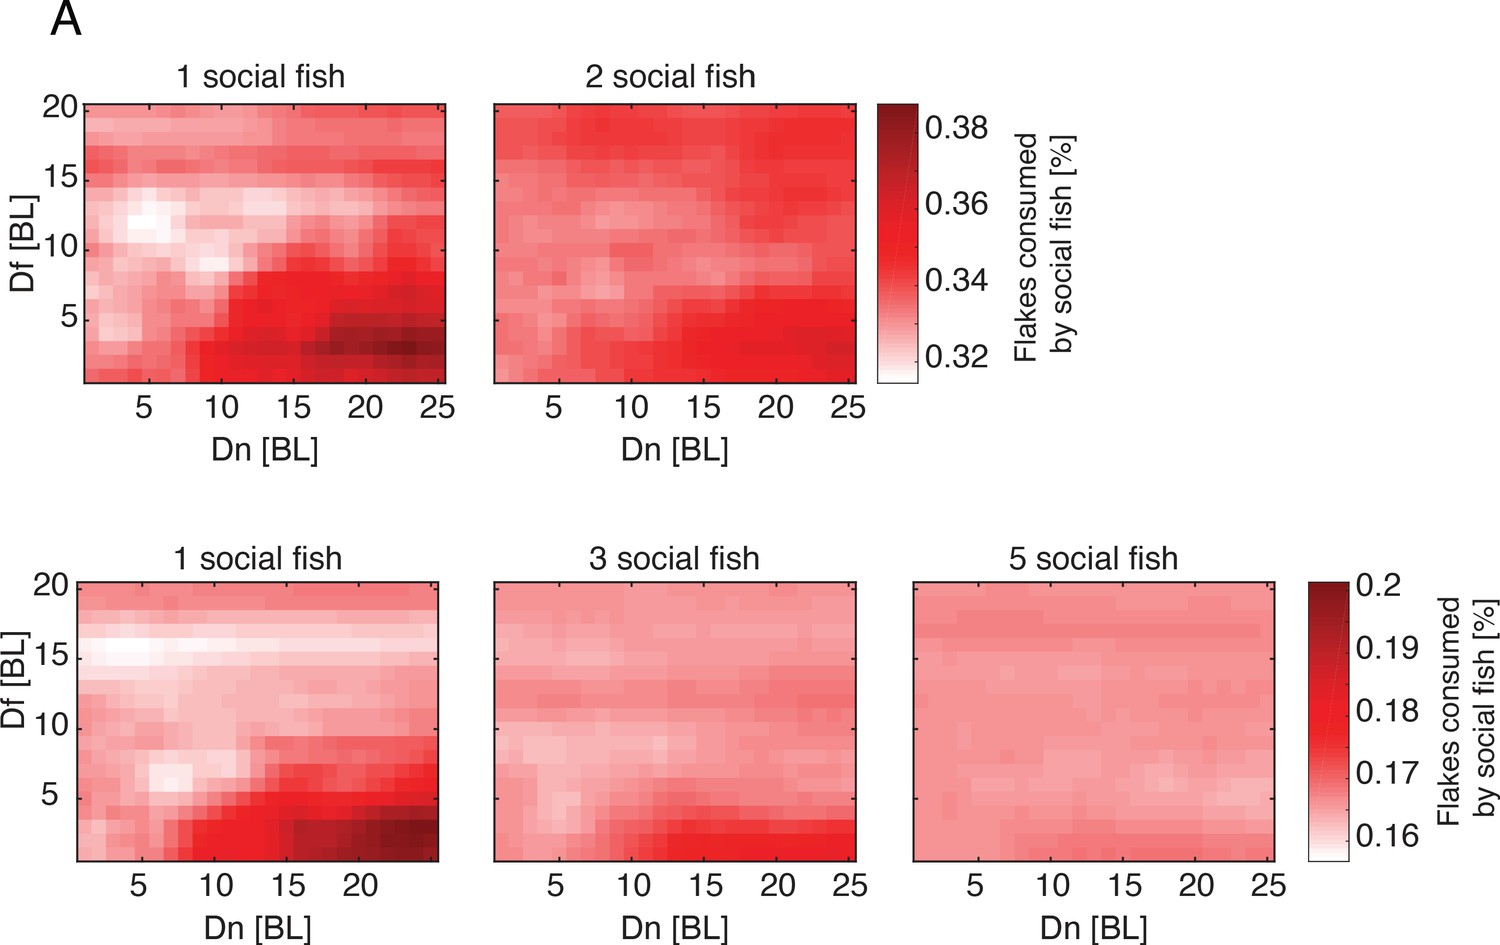
Social interactions improve foraging efficiency of individuals in groups.
(A) The mean fraction of flakes per fish that were consumed by foragers that used the Attfeed+Align strategy of the total flakes consumed by all fish in the group. Mean values are shown for all simulated values of and . Different panels show different fractions of social foragers out of the group. Results are shown for groups of three fish (Top row) and six fish (Bottom row).
Figure 6—figure supplement 2
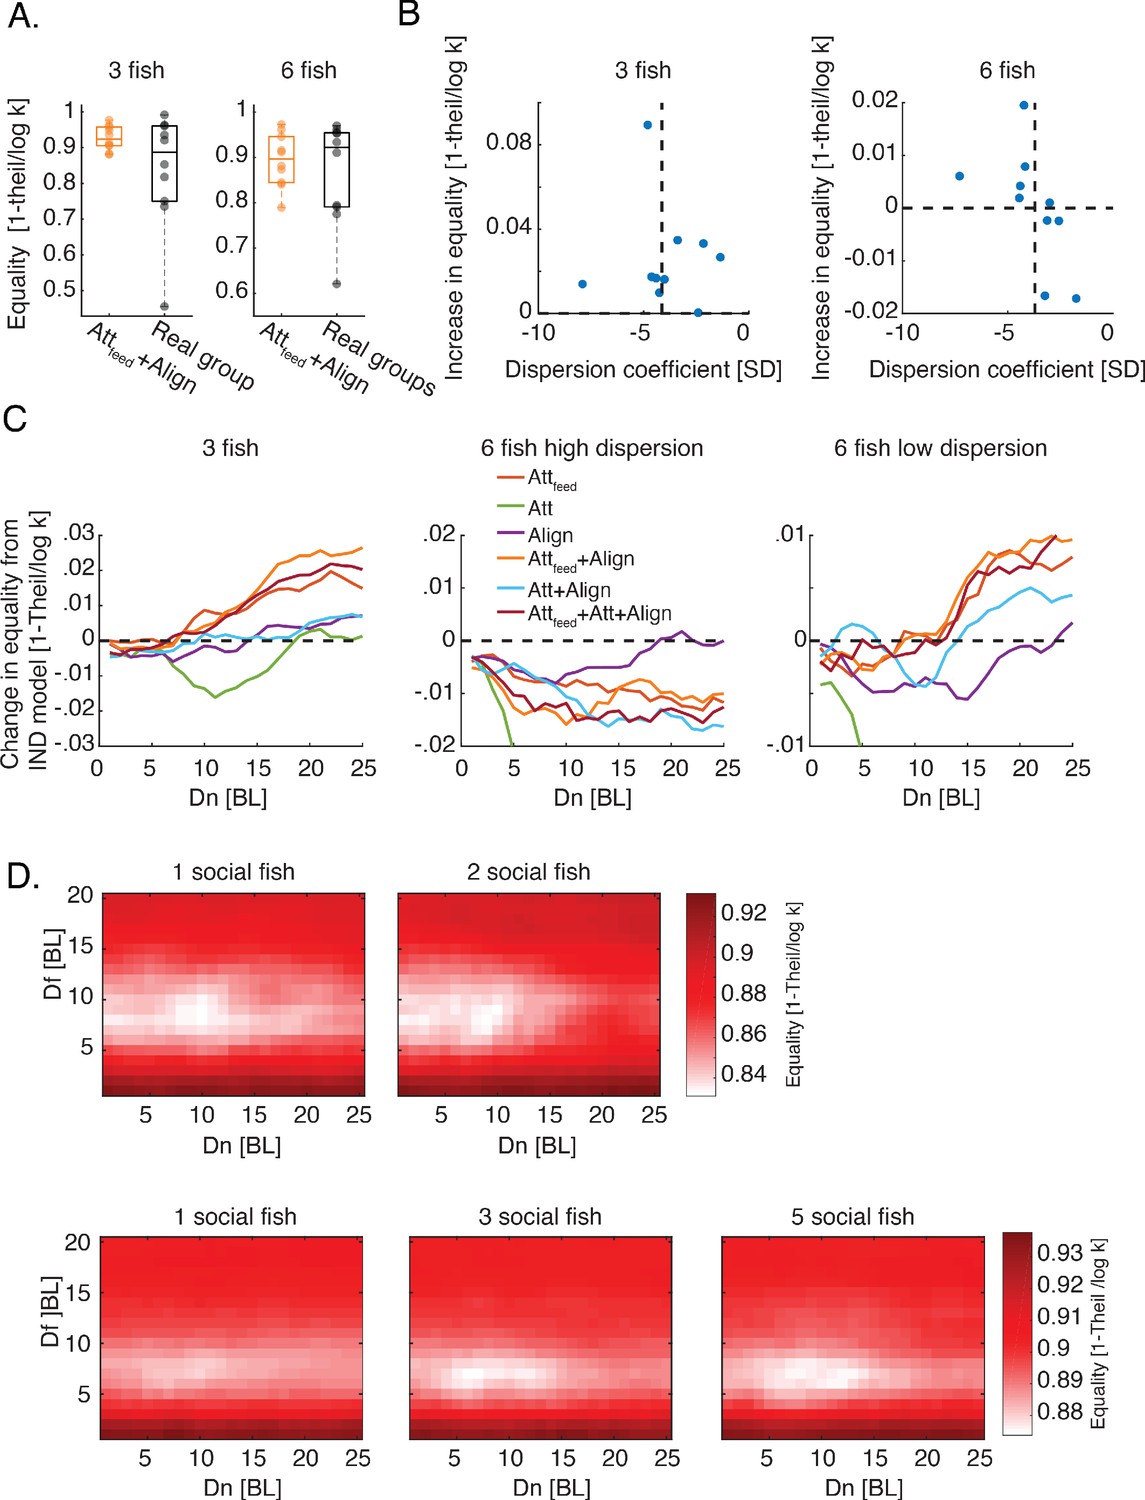
Social interactions improve income equality in groups.
(A) Equality of food consumption measured by (see eq. 2) is shown for real foraging groups (black) and simulated groups using the Attfeed+Align strategy (orange). Horizontal lines show median values, boxes represent the 1st and 3rd quartiles; no statistical differences were found between equality values in simulations and those of real groups of three fish (P=0.23, N=10) and six fish (P = 0.77, N = 10); Wilcoxon’s signed rank test. (B) Average Increase in equality for simulated groups of foragers using the Attfeed+Align strategy, compared to independent foragers for the maximal social interaction range tested () plotted against the estimated dispersion of flakes in the arena (Materials and methods). Horizontal dotted line represents 0 increase in equality and the vertical dotted line is the median dispersion value. Note that for groups of six fish, foraging for flakes with lower dispersion values (or high clustering) resulted in an increase in equality while foraging for flakes with higher dispersion showed a decrease in equality. (C) Average difference in equality values between different social foraging strategies and independent foragers (IND model). Equality values were averaged over and over simulations corresponding to different groups (N = 10 groups for three fish and N=5.5 for low and high flake dispersion in groups of six fish). Note that the largest increase in equality was for models that incorporate specific attraction to neighbor’s flake consumptions. (D) Equality of food distribution among foragers for all values for all mixed strategy groups of three and six fish. Different panels show different fractions of individuals using the Attfeed+Align strategy out of the total group; results are shown for groups of three fish (top row) and for groups of six fish (bottom row).
Figure 7 with 8 supplements
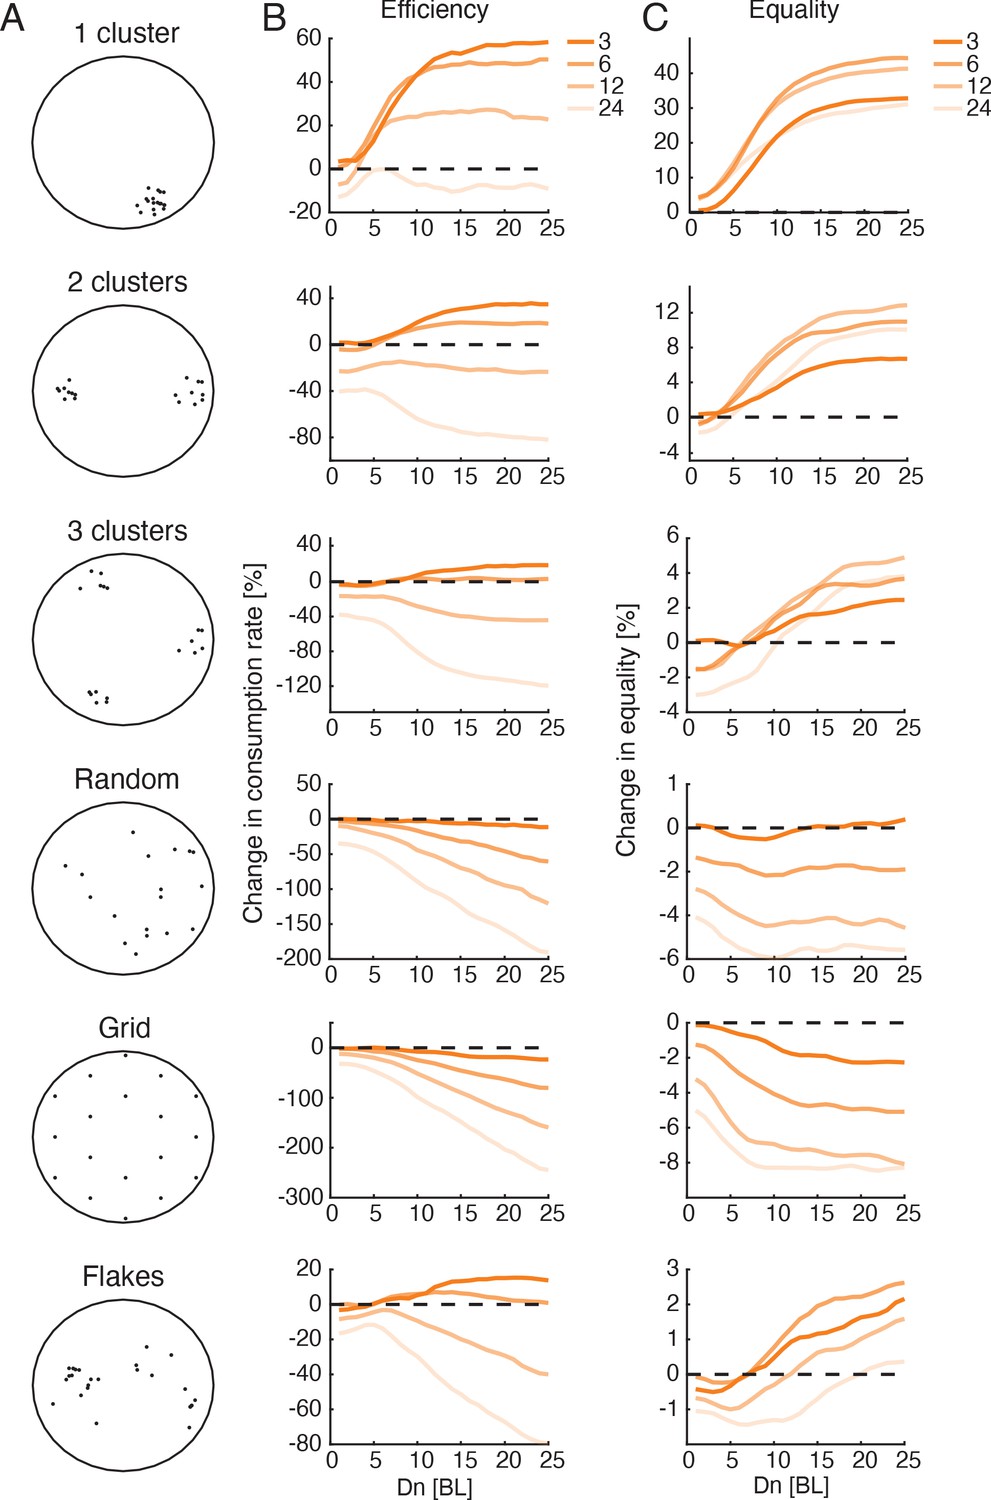
Optimal interaction range depends on group size and not on resource distribution.
(A) Sketches showing six different resource distributions used for foraging simulations, three with varying levels of clustering (1, 2, and 3 clusters), a random distribution, and uniform distribution (approximated by a hexagonal grid), and an example of the distribution of flakes taken from one of the experiments. (B) Improvement in group foraging rates (mean time to consumption per flake) of the Attfeed+Align model compared to independent foragers (IND model) for groups of 3, 6, 12, and 24 fish (dark to light colors) for the different spatial distributions (panels from top to bottom). Results were averaged over all simulations with (Figure 7—figure supplement 1, 100 repetitions per parameter combination, Materials and methods). (C) Same as in B but for the increase in equality of resources within groups.
Figure 7—figure supplement 1
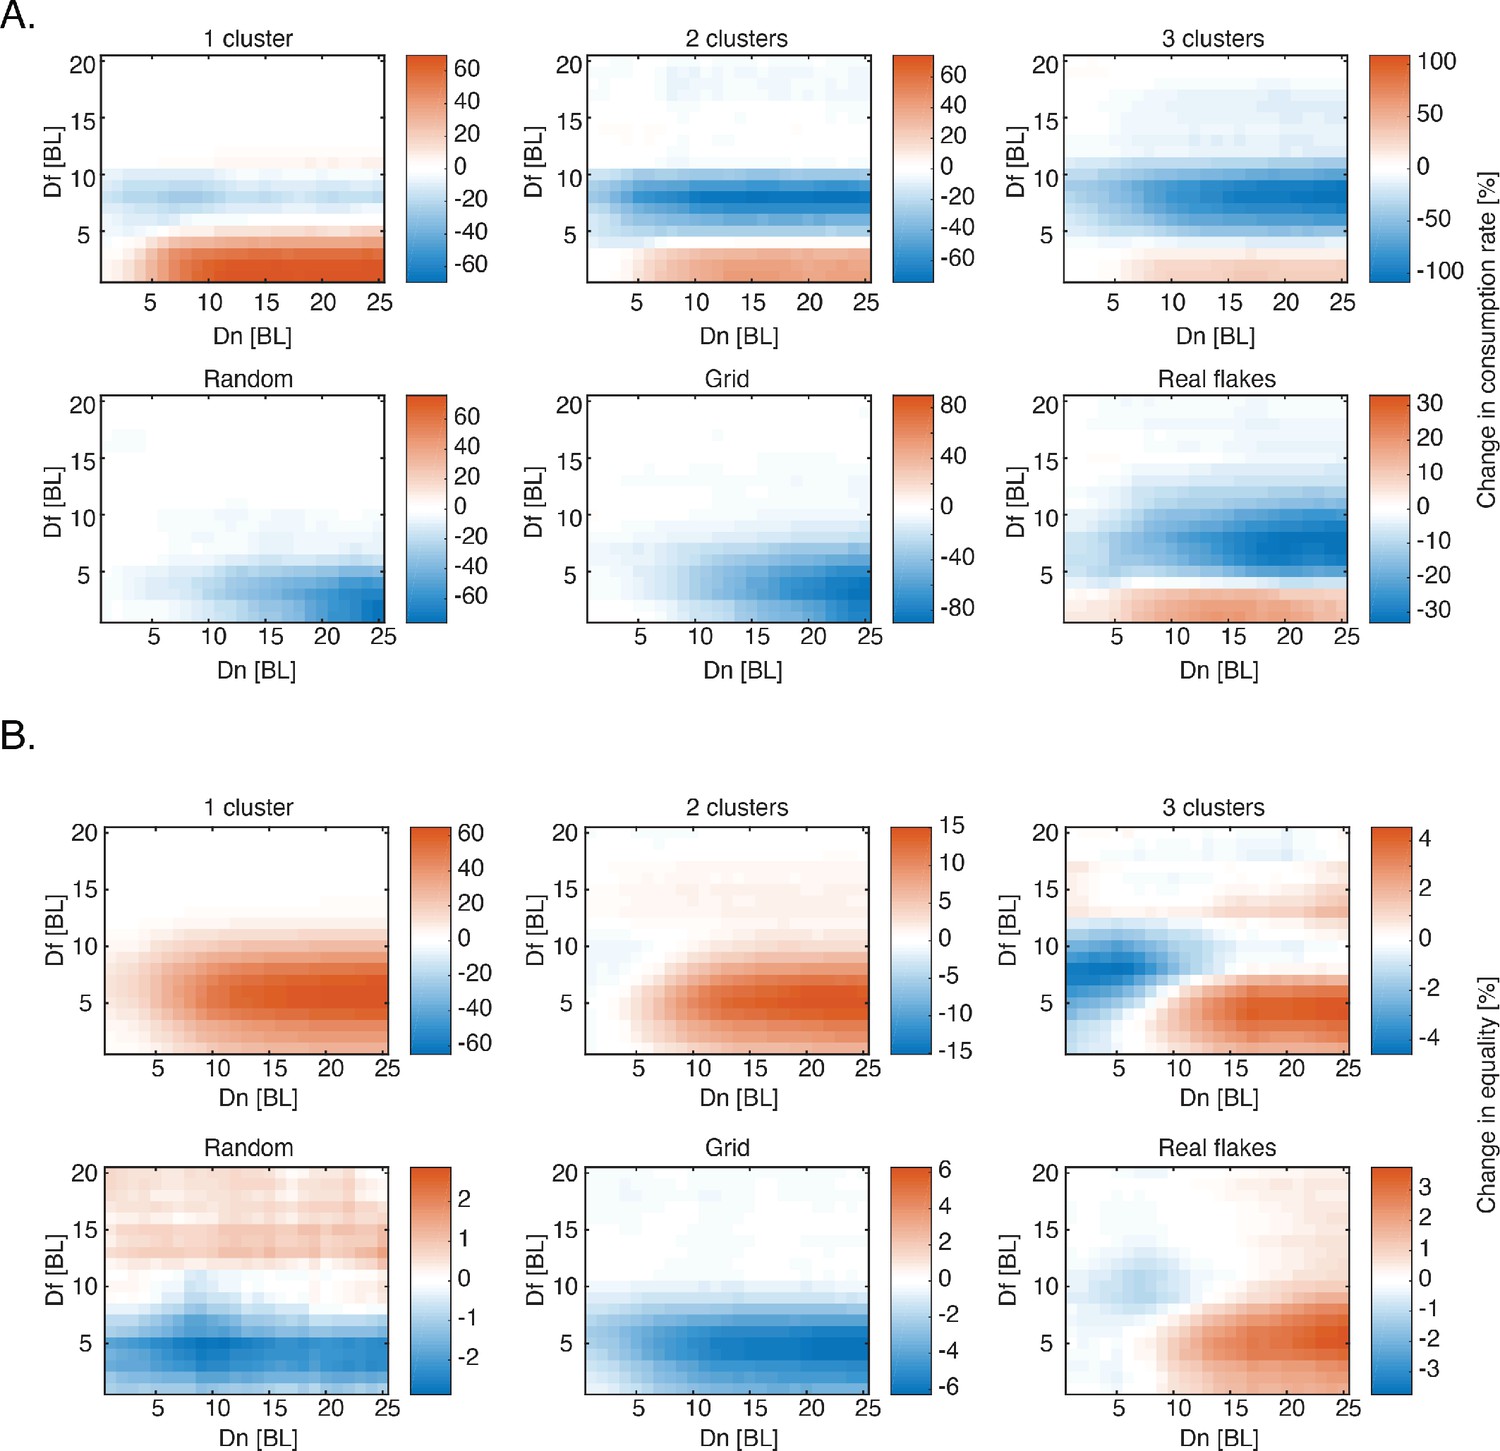
Simulating different distributions of food.
(A) The change in consumption rate of six socially interacting fish compared to independent ones (rate is calculated as number of flakes consumed / total search time) for all and values, for six different spatial distributions (Figure 7A); red colors represent increase in rate compared to independent foragers (100 repetitions for every parameter combination in every simulated distribution, Materials and methods). (B) Same as in A. only for the change in equality index (eq. 2). .
Figure 7—figure supplement 2
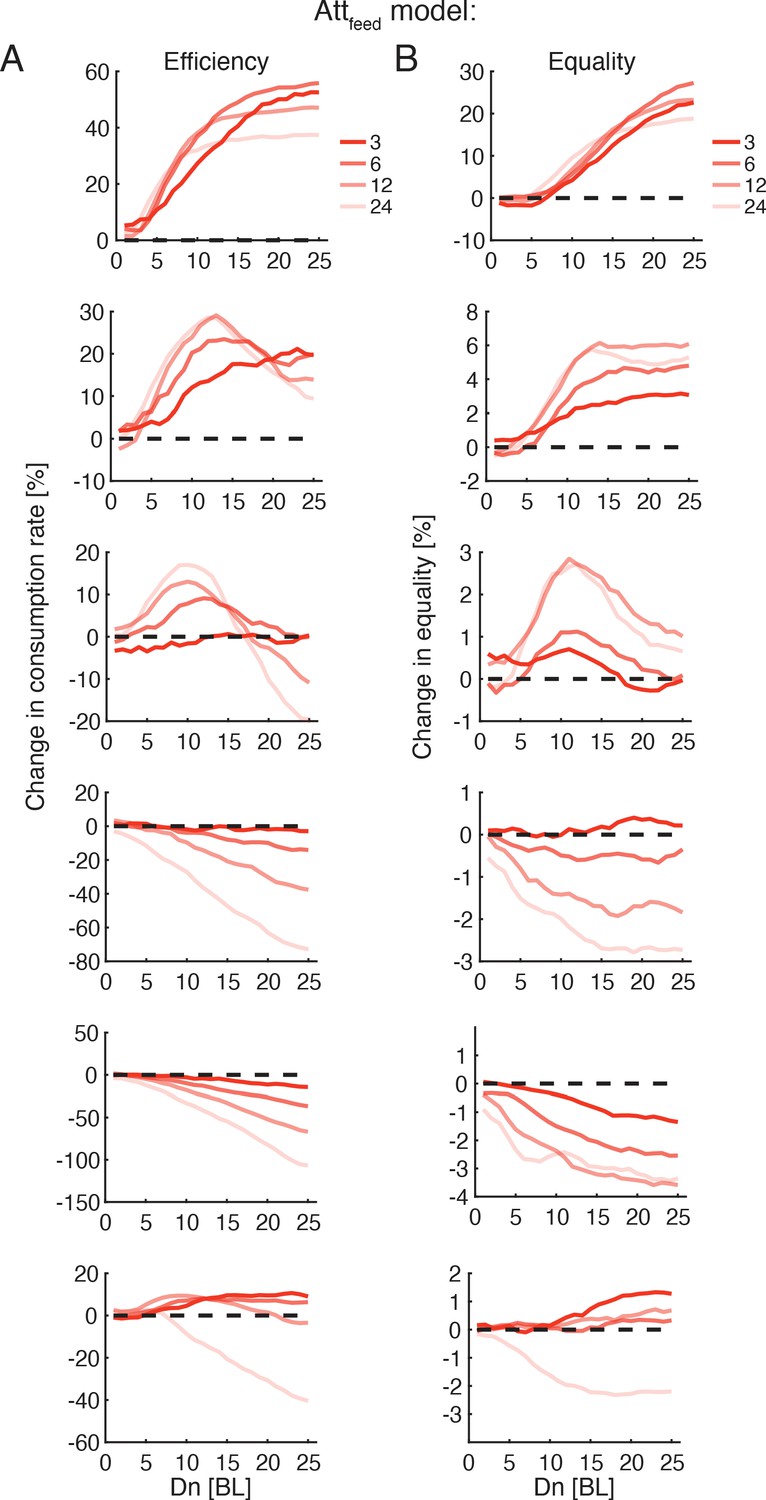
Optimal interaction range depends on group size and not on resource distribution.
(A) Improvement in group foraging rates (mean time to consumption per flake) of the Attfeed model compared to independent foragers (IND model) for groups of 3, 6, 12, and 24 fish (dark to light colors) for the different spatial distributions (panels from top to bottom - Figure 7A). Results were averaged over all simulations with (Figure 7—figure supplement 1, 100 repetitions per parameter combination, Materials and methods). (B) Same as in A but for the increase in equality of resources within groups. Note that the effects observed when only attraction to neighbors’ previous consumptions is included in the model are very similar to those in the Attfeed+Align model (see Figure 7), but also span the larger group sizes (12 and 24 fish).
Figure 7—video 1
Simulations of groups of six fish foraging in an arena with a single cluster of food flakes.
Comparison of simulated groups using social foraging (left: Attfeed+Align) and independent foragers (right - IND), for various spatial distributions of flakes: a single cluster (Figure 7—video 1), two clusters (Figure 7—video 2), three clusters (Figure 7—video 3), Uniform distribution (Figure 7—video 4) and a random distribution (Figure 7—video 5). In all simulations, all fish start at the center of the arena, and simulations end when all flakes are consumed (Materials and methods).
Figure 7—video 2
Simulations of groups of six fish foraging in an arena with 2 clusters of flakes.
Figure 7—video 3
Simulations of groups of six fish foraging in an arena with 3 clusters of flakes.
Figure 7—video 4
Simulations of groups of six fish foraging in an arena with a uniform distribution of flakes.
Figure 7—video 5
Simulations of groups of six fish foraging in an arena with random distribution of flakes.
Figure 7—video 6
Groups of 12 simulated fish foraging in an environment with 3 clusters of flakes.
Comparison of simulated 12 fish groups using social foraging (Attfeed+Align, left) and independent foragers (IND, right), seeking flakes arranged in three clusters. all fish start at the center of the arena, and simulations end when all flakes are consumed (Materials and methods).
Author response image 1
Author response image 2
Additional files
Download links
A two-part list of links to download the article, or parts of the article, in various formats.
Downloads (link to download the article as PDF)
Open citations (links to open the citations from this article in various online reference manager services)
Cite this article (links to download the citations from this article in formats compatible with various reference manager tools)
Social interactions drive efficient foraging and income equality in groups of fish
eLife 9:e56196.
https://doi.org/10.7554/eLife.56196


