A non-mosaic transchromosomic mouse model of down syndrome carrying the long arm of human chromosome 21
- Department of Biomedical Science, Institute of Regenerative Medicine and Biofunction, Graduate School of Medical Science, Tottori University, Japan
- Chromosome Engineering Research Center (CERC), Tottori University, Japan
- Department of Physiology, Johns Hopkins University School of Medicine, United States
- Department of Genetic Medicine, John Hopkins University School of Medicine, United States
- Department of Animal Nursing Science, Yamazaki University of Animal Health Technology, Hachioji, Japan
- Department of Physiological Chemistry and Metabolism, Graduate School of Medicine, The University of Tokyo, Japan
- Department of Molecular Hematology, Tohoku University Graduate School of Medicine, Japan
- Biomedical Research Institute, National Institute of Advanced Industrial Science and Technology (AIST), Japan
- Bioresource Engineering Division, RIKEN BioResource Research Center (BRC), Japan
- Departments of Pathology and Neurology, John Hopkins University School of Medicine, United States
- Department of Neuroscience, John Hopkins University School of Medicine, United States
- Department of Biomedical Engineering, Zhejiang University, China
- Department of Pathology, John Hopkins University School of Medicine, United States
- Department of Anthropology, Penn State University, United States
- Division of Biosignaling, School of Life Sciences, Faculty of Medicine, Tottori University, Japan
- Department of Anthropology, California State University, United States
Figures
Figure 1 with 1 supplement

Construction of TcMAC21 mice (HSA21q-MAC).
(A) Schematic diagram of HSA21q-MAC construction. (B) Chimeric mice obtained via injection of mouse ES cells carrying the HSA21q-MAC. The arrow indicates a GFP-positive, TcMAC21 mouse. (C) FISH of TcMAC21 lymphocytes (n = 4 and 20 metaphases analyzed in each sample). Digoxigenin-labeled human COT-1 DNA as FISH probe for HSA21q-MAC detection. (D) G-banding based karyotype of TcMAC21 containing the HSA21q-MAC. (E) WGS showing the positions of 4 deletions in HSA21q (A, B, C, and D). These are shown normalized to PCG numbers, not physical DNA length. The regions of homology with mouse chromosomes 16, 17 and 10 are indicated. (F) Summary of genome positions of deletions and numbers of affected PCGs and non-PCGs on the HSA21q-MAC (based on GRCh38.p12, BioMart-Ensembl, May 2019), and see Figure 1—source data 1 for details.
-
Figure 1—source data 1
WGS of TcMAC21.
Construction of TcMAC21 mice (HSA21q-MAC).
- https://cdn.elifesciences.org/articles/56223/elife-56223-fig1-data1-v2.xlsx
Figure 1—figure supplement 1
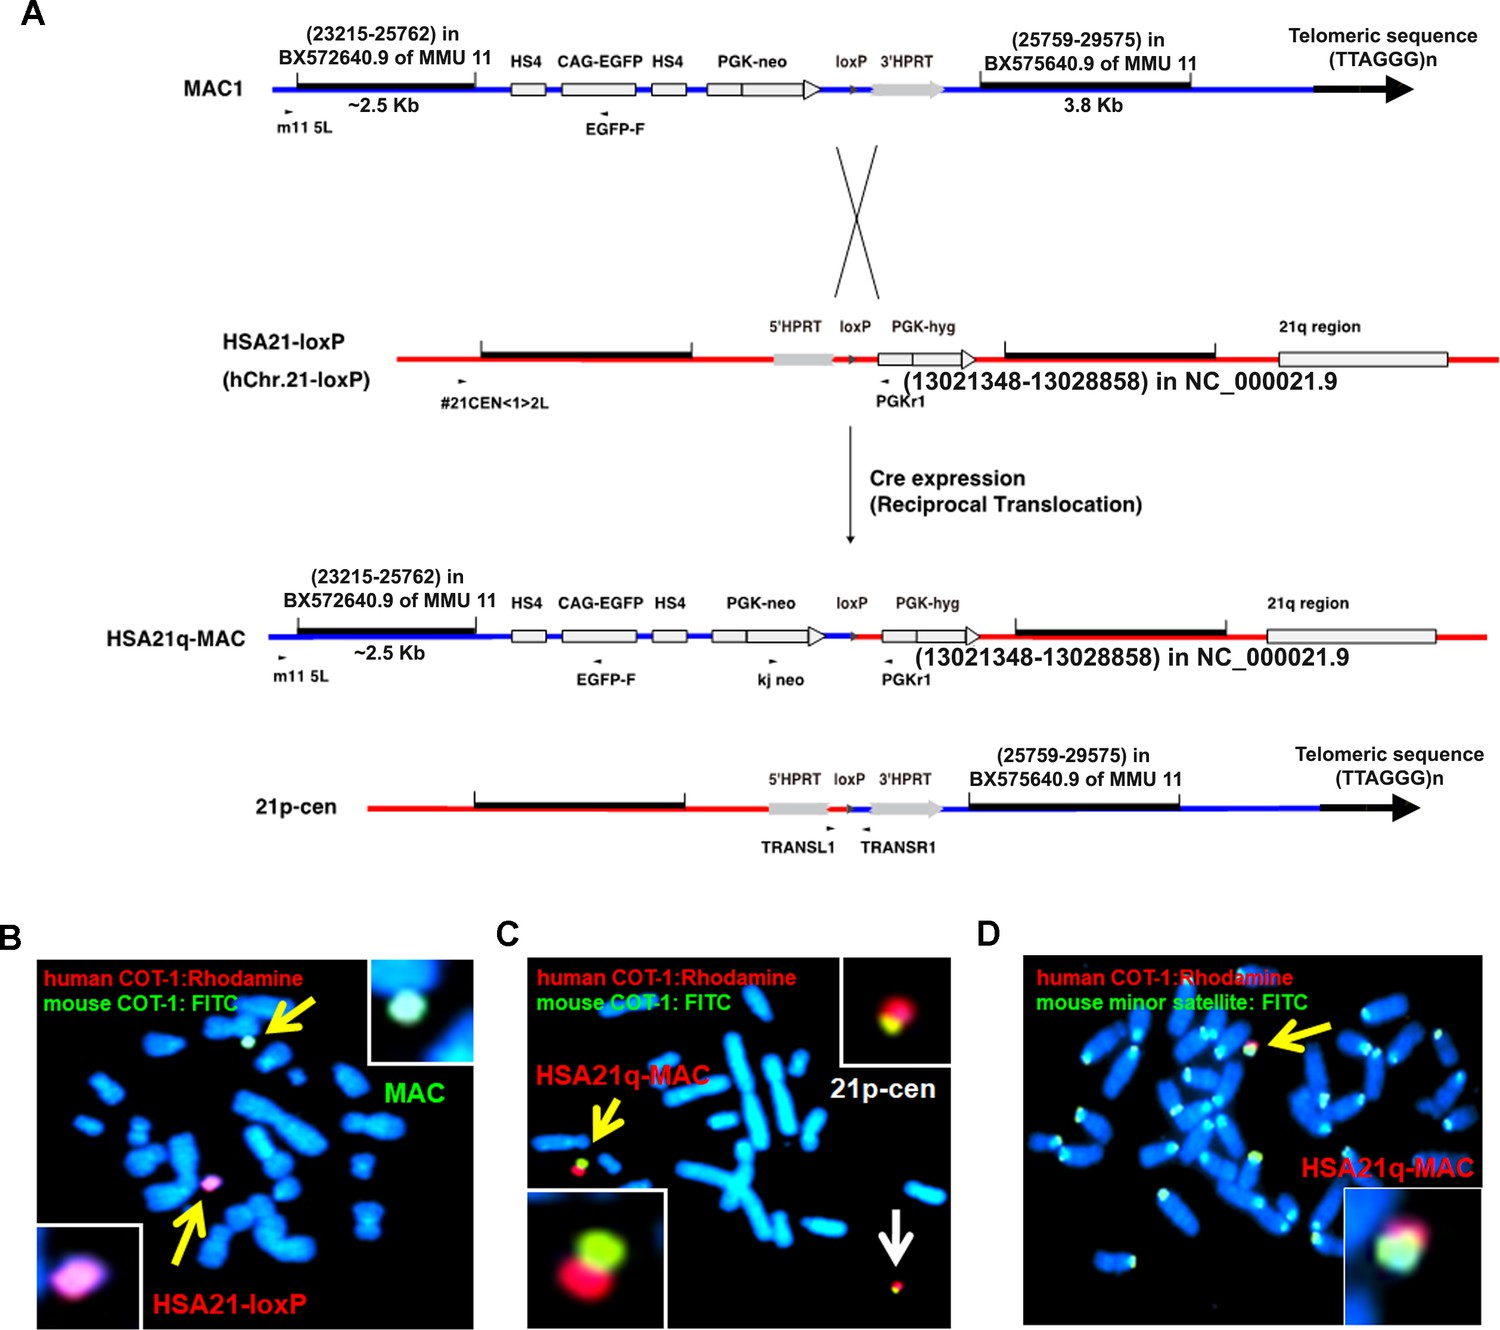
Construction of TcMAC21 mice (HSA21q-MAC).
(A) Information for vectors used to generate the hybrid chromosome, HSA21q-MAC. (B–D) FISH images to verify the critical steps: (B) before Cre-loxP mediated recombination, CHO cells containing a HSA21-loxP and a MAC; (C) after recombination, CHO cells containing the HSA21q-MAC (yellow arrow) and by-product (21p-cen) (white arrow); (D) mouse ES cell containing the HSA21q-MAC (yellow arrow). FISH probes: digoxigenin-labeled human COT-1 DNA for human chromosome detection (red, in B-D), biotin-labeled mouse COT-1 DNA for mouse chromosome detection (green, in B-C), biotin-labeled mouse minor satellite DNA for mouse centromere detection (green, in D), and chromosomal DNA counterstained with DAPI.
Figure 2
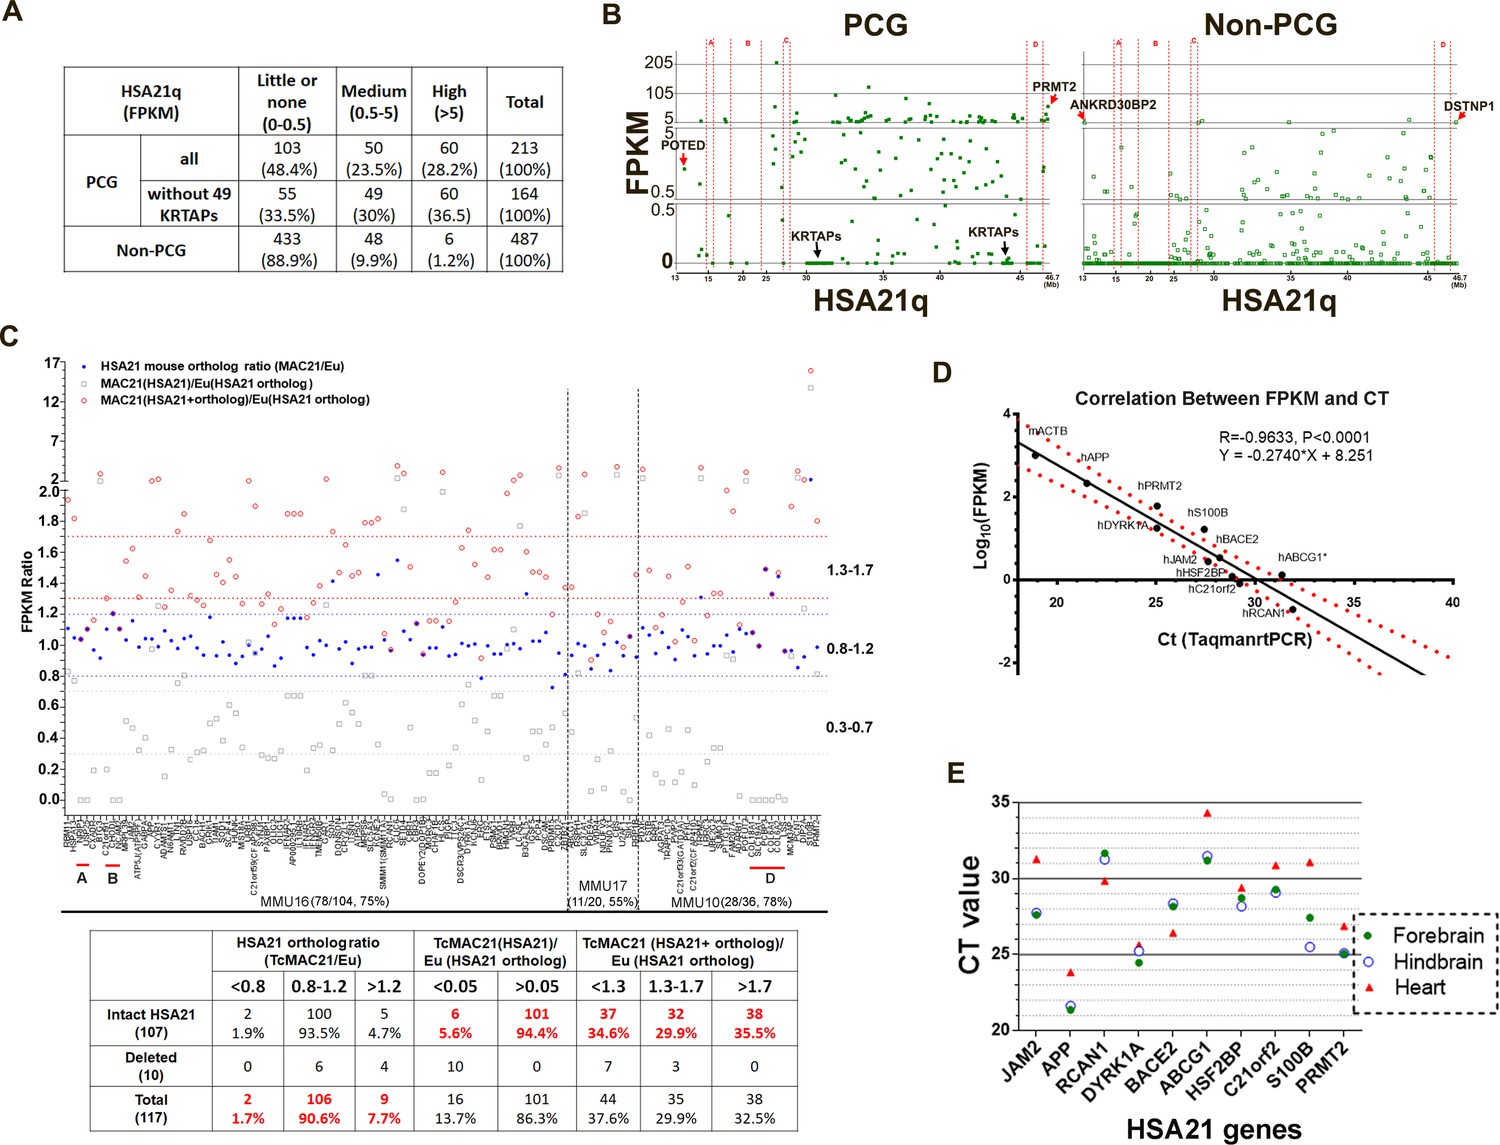
HSA21 expression pattern in P1 TcMAC21 brain.
(A) RNA-Seq summary of HSA21 PCG and non-PCG transcript levels in TcMAC21. (B) Transcript levels of individual PCG and non-PCGs across the length of HSA21q in TcMAC21. (C) HSA21 dosage imbalance analysis of TcMAC21 among 117 HSA21 mouse orthologs whose FPKM ≥1 in Eu. Three expression values are shown: 1. the FPKM ratio of HSA21 PCG of TcMAC21 to its ortholog of Eu (gray open squares); 2. the FPKM ratio of HSA21 mouse ortholog of TcMAC21 to that of Eu (blue dot); 3. the FPKM ratio of total expression (HSA21 PCG + its mouse ortholog) of TcMAC21 to the HSA21 mouse ortholog of Eu (red circles). The positions of deleted regions are indicated in red. Eu and Ts65Dn littermates, n = 2 per group. See also Figure 2—source data 1 for expression levels (FPKM) of all HSA21 and its orthologs in Eu and TcMAC21. (D) RNA-Seq verification by Taqman RT-PCR. Correlation between CT value from Taqman RT-PCR and Log10(FPKM) from RNA-Seq for 10 HSA21q genes and mouse actin (mACTB) in TcMAC21. (E) Taqman assay comparing expression of 10 HSA21 genes between forebrain, hindbrain, and heart using the same amount of total RNA. The sample size of Taqman assay in D and E is that n = 2 for TcMAC21 and n = 3 for Eu (negative control).
-
Figure 2—source data 1
RNA-seq of TcMAC21 and Eu.
HSA21 expression pattern in P1 TcMAC21 brain.
- https://cdn.elifesciences.org/articles/56223/elife-56223-fig2-data1-v2.xlsx
-
Figure 2—source data 2
Effects of HSA21 on gene expression of other mouse chromosomes analyzed by RNA-seq.
HSA21 expression pattern in P1 TcMAC21 brain, source data.
- https://cdn.elifesciences.org/articles/56223/elife-56223-fig2-data2-v2.docx
Figure 3 with 1 supplement
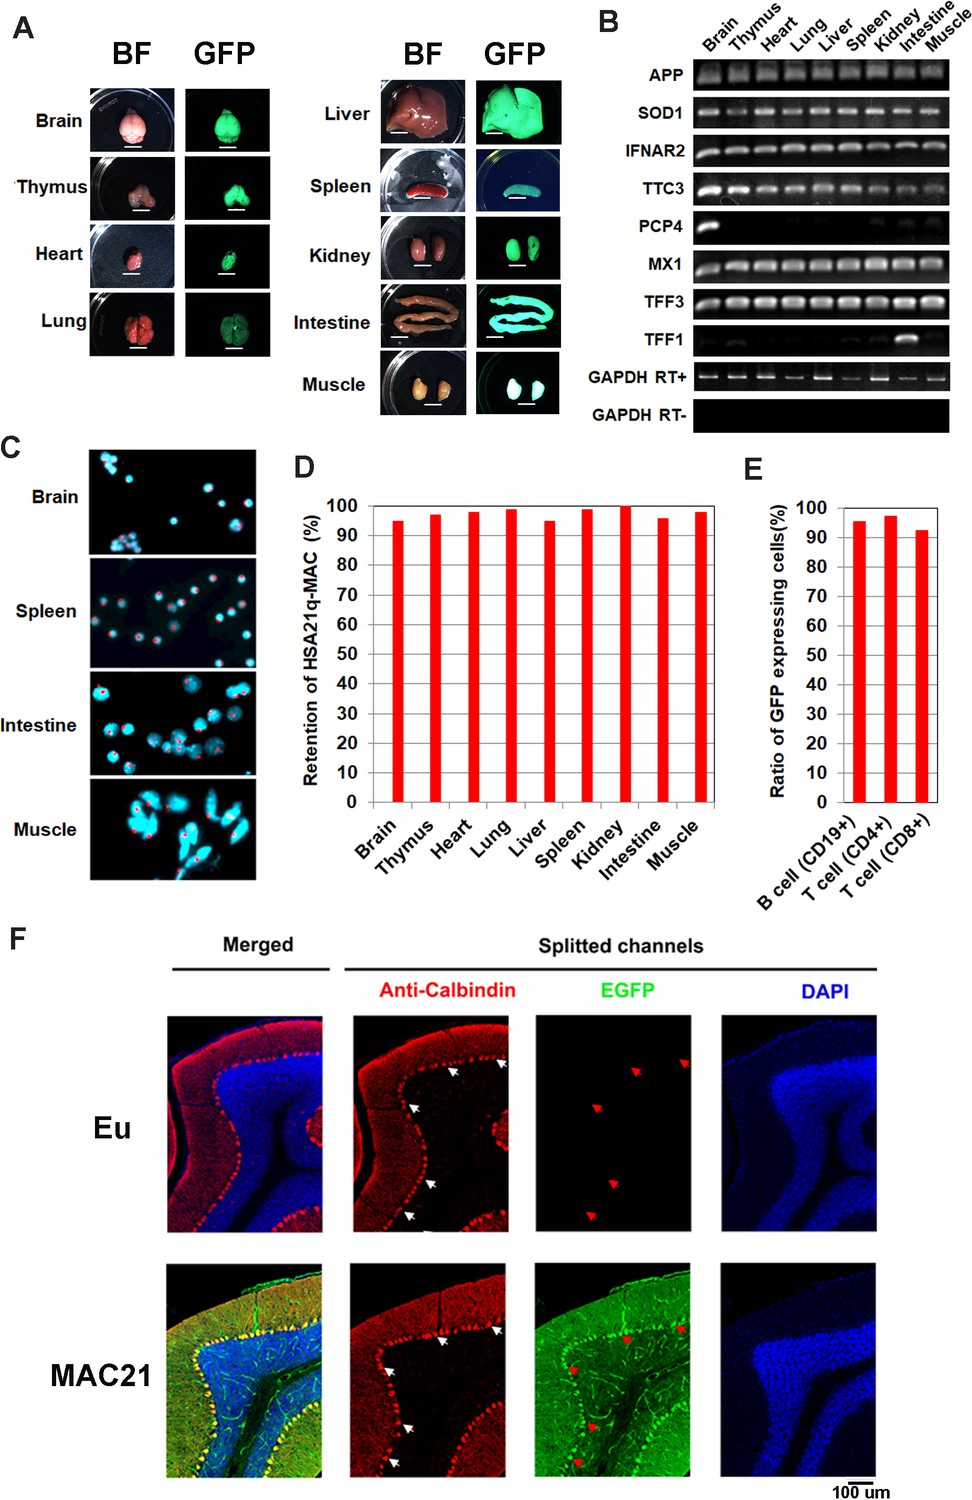
Mosaicism analysis in TcMAC21.
(A) UV light to illuminate GFP of nine organs from TcMAC21 (exposure time is 4 s and 0.2 s in spleen and the other tissues, respectively) (n = 2). BF, bright field. Scale bar (6 mm). (B) RT-PCR analyses for HSA21 gene expression in different TcMAC21 tissues (n = 2). (C) Representative FISH image of cells from TcMAC21 tissues with digoxigenin-labeled human COT-1 DNA as FISH probe for HSA21q-MAC (red) and with DAPI as a nuclear counterstain (blue). FISH of Eu tissues with human COT-1 showing no signal (Figure 3—figure supplement 1C). (D) Retention rate of the HSA21q-MAC in various TcMAC21 tissues analyzed by FISH (n = 2, 200 interphase cells analyzed in each sample). (E) Retention rate of the HSA21q-MAC in three lymphocyte populations analyzed by FCM (n = 2). See Figure 3—source data 2 for statistical tables used to generate D and E.(F) Mosaicism analysis of HSA21q-MAC in Purkinje cells (PC) of TcMAC21 by immunostaining. White arrows indicate cell bodies of randomly selected PC in RFP-channel, and red arrows indicate corresponding locations in GFP-channel. N = 3 per group, one 30 um brain slice per animal, and 100 randomly selected PCs per slice.
-
Figure 3—source data 1
HSA21 genes tested by human specific Taqman assay.
- https://cdn.elifesciences.org/articles/56223/elife-56223-fig3-data1-v2.docx
-
Figure 3—source data 2
Data tables for Figure 3D-E.
- https://cdn.elifesciences.org/articles/56223/elife-56223-fig3-data2-v2.xlsx
Figure 3—figure supplement 1

Mosaicism analysis.
(A) Tails from GFP negative and positive TcMAC21 littermates are analyzed using Taqman RT-PCR assay for testing expression of human-APP (hAPP, centromere-proximal), human-PRMT2 (hPRMT2, telomere-proximal), and mouse actin (mActin, endogenous control). N = 12 per group. (B) TcMAC21 and Eu pups are visualized with GFP flashlights. (C) FISH of kidney cells of Eu and TcMAC21 with human COT-1 (red), and chromosomal DNA counterstained with DAPI.
Figure 4 with 1 supplement
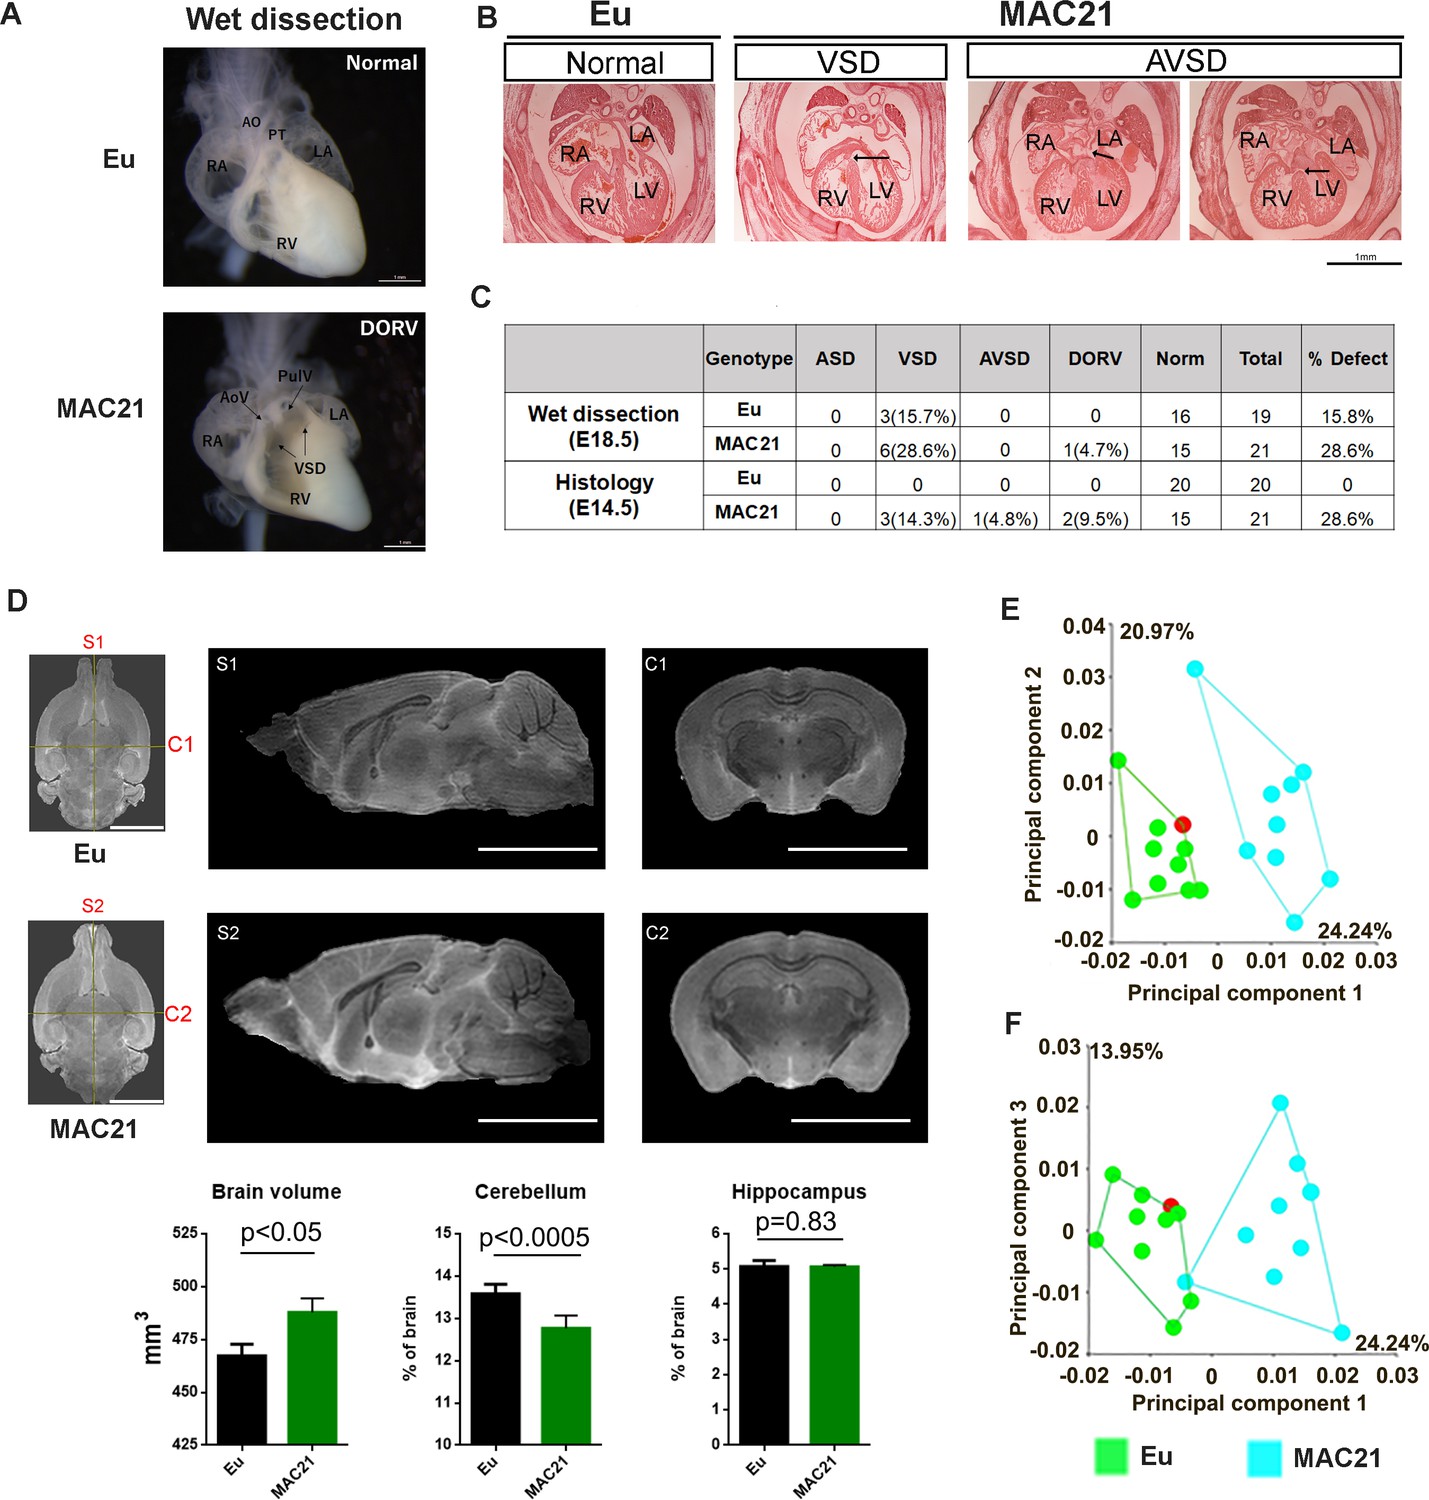
Morphological analysis of the heart, brain and skull in TcMAC21.
(A–C) CHD analysis. (A) Wet dissection of hearts from E18.5 Eu (top, normal) and TcMAC21(bottom, DORV and VSD (black arrow)), and a small slit-like conus VSD also seen in TcMAC21. Eu (n = 19), TcMAC21 (n = 21). (B) Histology of E14.5 Eu (normal) and two TcMAC21 mice with different heart defects, VSD and AVSD (black arrow indicating locations of defects); AO, aorta; AoV, aortic valve; LA, left atrium; LV, left ventricle; PT, pulmonary trunk; PulV, pulmonary valve; RA, right atrium; RV, right ventricle. Eu (n = 20), TcMAC21 (n = 21). (C) Summary data of CHD analysis. (D) Representative T2-weighted MR images (top, ex vivo) and statistical analysis of whole brain volume, percentage of cerebellum and hippocampus relative to brain; mid-sagittal slices from Eu (S1) and TcMAC21 (S2) and coronal slices from Eu (C1) and TcMAC21 (C2), scale bar (5 mm); n = 7 per group and data are analyzed by two-way ANOVA and expressed as mean ± SEM. (E–F) Results of a principal components analysis (PCA) of 3D geometric morphometric analysis of Eu and TcMAC21 cranial shape. PC1 shows a 24.2% separation between Eu and TcMAC21 mice while PC2 captures variation in each genotype. Eu (n = 10), TcMAC21 (n = 9).
-
Figure 4—source data 1
Absolute volume of brain structures in TcMAC21 and Eu.
- https://cdn.elifesciences.org/articles/56223/elife-56223-fig4-data1-v2.docx
-
Figure 4—source data 2
Percentage of brain volume in TcMAC21 and Eu.
- https://cdn.elifesciences.org/articles/56223/elife-56223-fig4-data2-v2.docx
Figure 4—figure supplement 1

Lateral ventricle in ex vivo and in vivo MRI.
(A) 3D rendering of Eu and TcMAC21 brains MRI images. No clear ventricle space is seen in PFA-fixed samples (ex vivo MRI) and clear ventricles and CSF are seen in live samples (in vivo MRI). LV: lateral ventricle, 3/4 V: the third and fourth ventricle; scale bar (5 mm) (B) Quantitative analysis of LV volume of live Eu and TcMAC21 mice. LV are visualized in four matching transverse levels of MRI images from the dorsal to the ventral (adjacent levels spaced 312.5 um apart, scale bar (5 mm)). Absolute and percentage of brain volumes of LV are compared (N = 3 pairs and data are analyzed by two-tailed t-test and expressed as mean ± SEM).
Figure 5 with 1 supplement
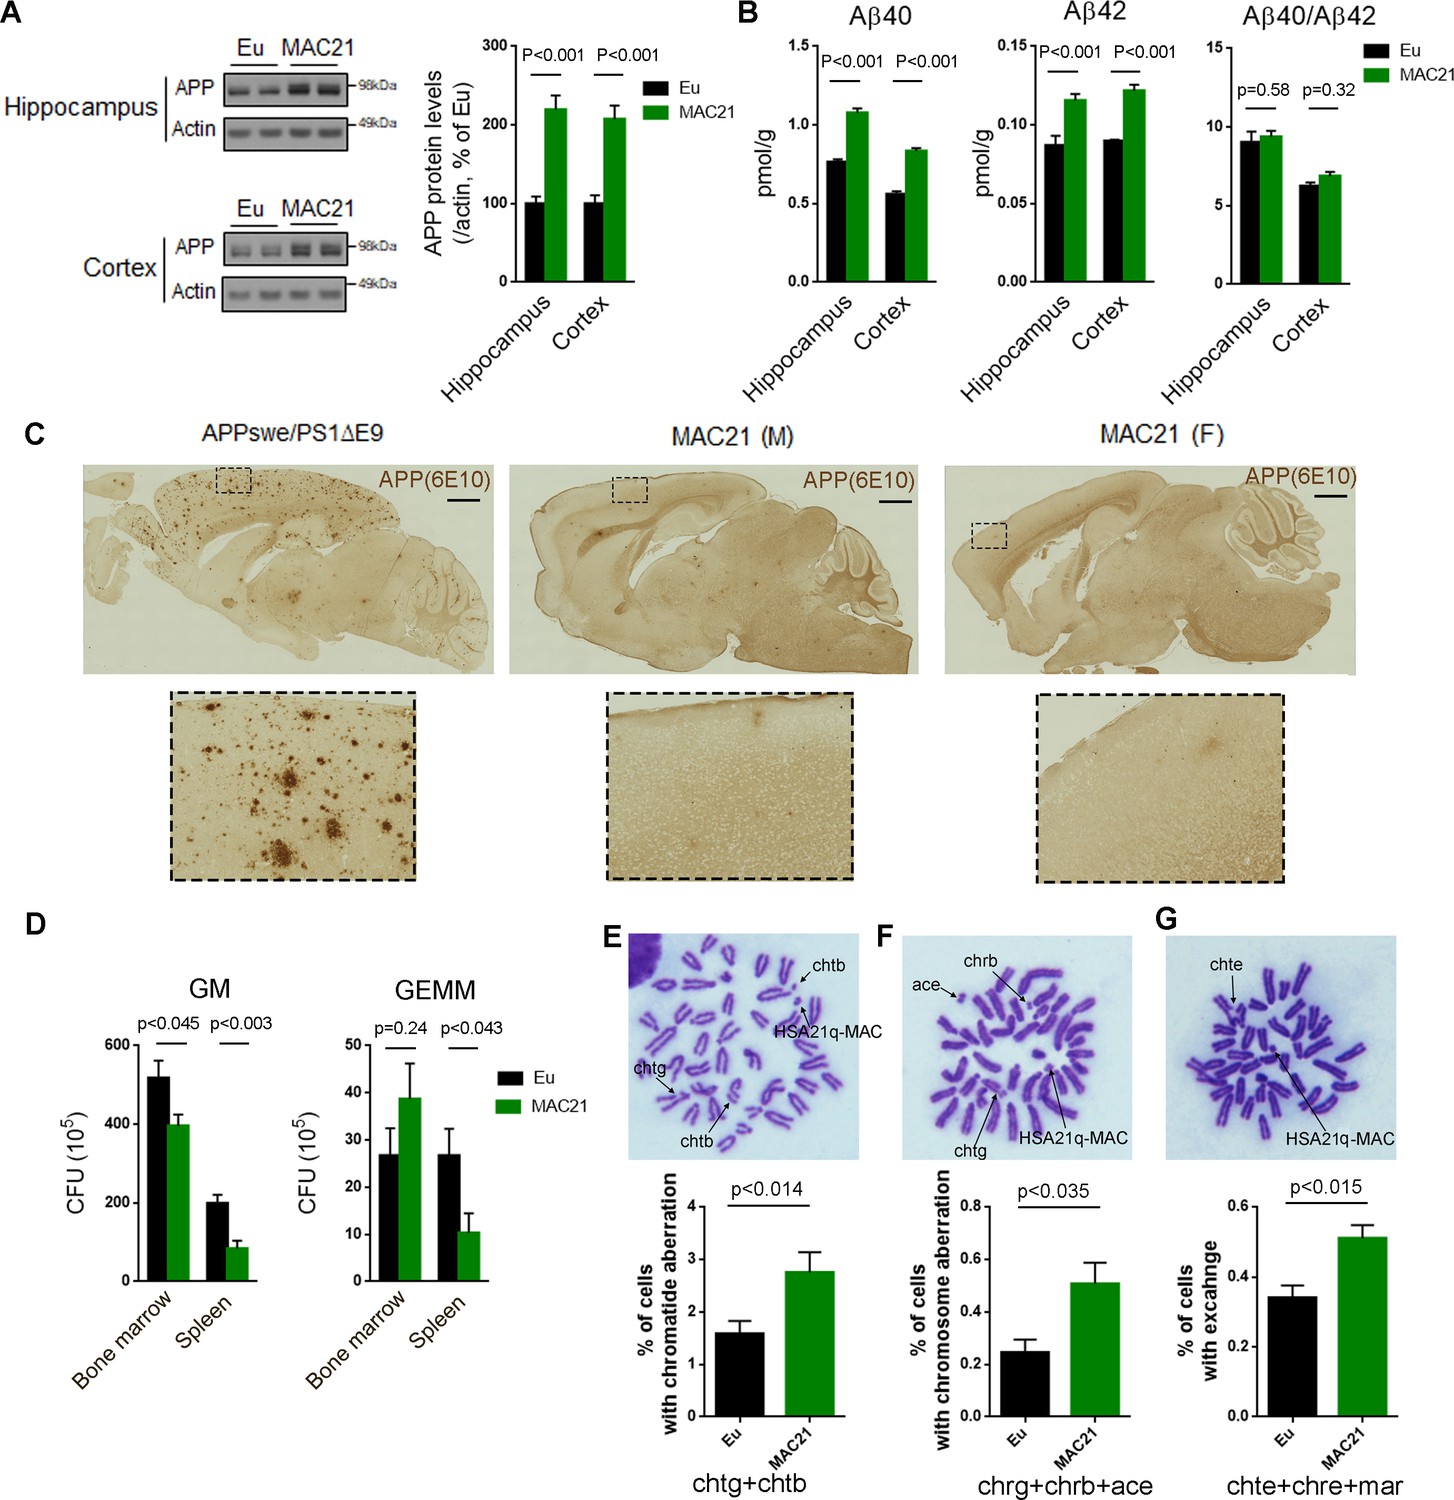
Evaluation of DS-like pathology in TcMAC21.
(A–C) APP protein levels and amyloid plaques in brains of 15–24 month-old TcMAC21 and Eu (n = 6 per group). (A) western blot of total APP in hippocampus and cortex. (B) ELISA of total Aβ40 and Aβ42 levels in hippocampus and cortex. (C) amyloid plaques visualized by immunostaining with β-amyloid antibody 6E10; APPswe/PS1∆E9 mouse is a positive control for plaque formation, scale bar (1 mm). (D) CFU level of GM and GEMM in TcMAC21 spleen and bone marrow (n = 6 per group). GM, granulocyte/macrophage; GEMM, granulocyte/erythroid/monocyte/megakaryocyte. (E–G) Chromatid and chromosome aberrations in bone marrow cells after X-ray irradiation (n = 3 per group). (E) Chromatid aberration. (F) Chromosome aberration. (G) Chromatid and/or chromosome exchange. chtg (chromatid gap); chtb (chromatid break); chrg (chromosome gap); chrb (chromosome break); ace (acentric fragment); chte (chromatid exchange); chre (chromosome exchange); mar (marker chromosome, including dicentric chromosome, ring chromosome, robertsonian translocation, and other abnormal size of chromosome). All data are analyzed by two-tailed t-test and expressed as mean ± SEM.
-
Figure 5—source data 1
Peripheral blood analyses in TcMAC21 and Eu.
- https://cdn.elifesciences.org/articles/56223/elife-56223-fig5-data1-v2.docx
Figure 5—figure supplement 1

Hematological phenotypes.
(A) Histological analysis of spleen (R and W indicate red pulp and white pulp, respectively). (B–D) Colony assay of spleen and bone marrow. (B) representative colony images of bone marrow; statistical analysis of colony-formation unites (CFU) of erythroid (E), granulocyte/erythroid/monocyte/megakaryocyte (GEMM), granulocyte/macrophage (GM), macrophage (M) and megakaryocyte (Meg) in bone marrow (C) and spleen (D), n = 6 per group unless otherwise stated in figures, and data are analyzed by two-tailed t-test and expressed as mean ± SD.
Figure 6 with 1 supplement
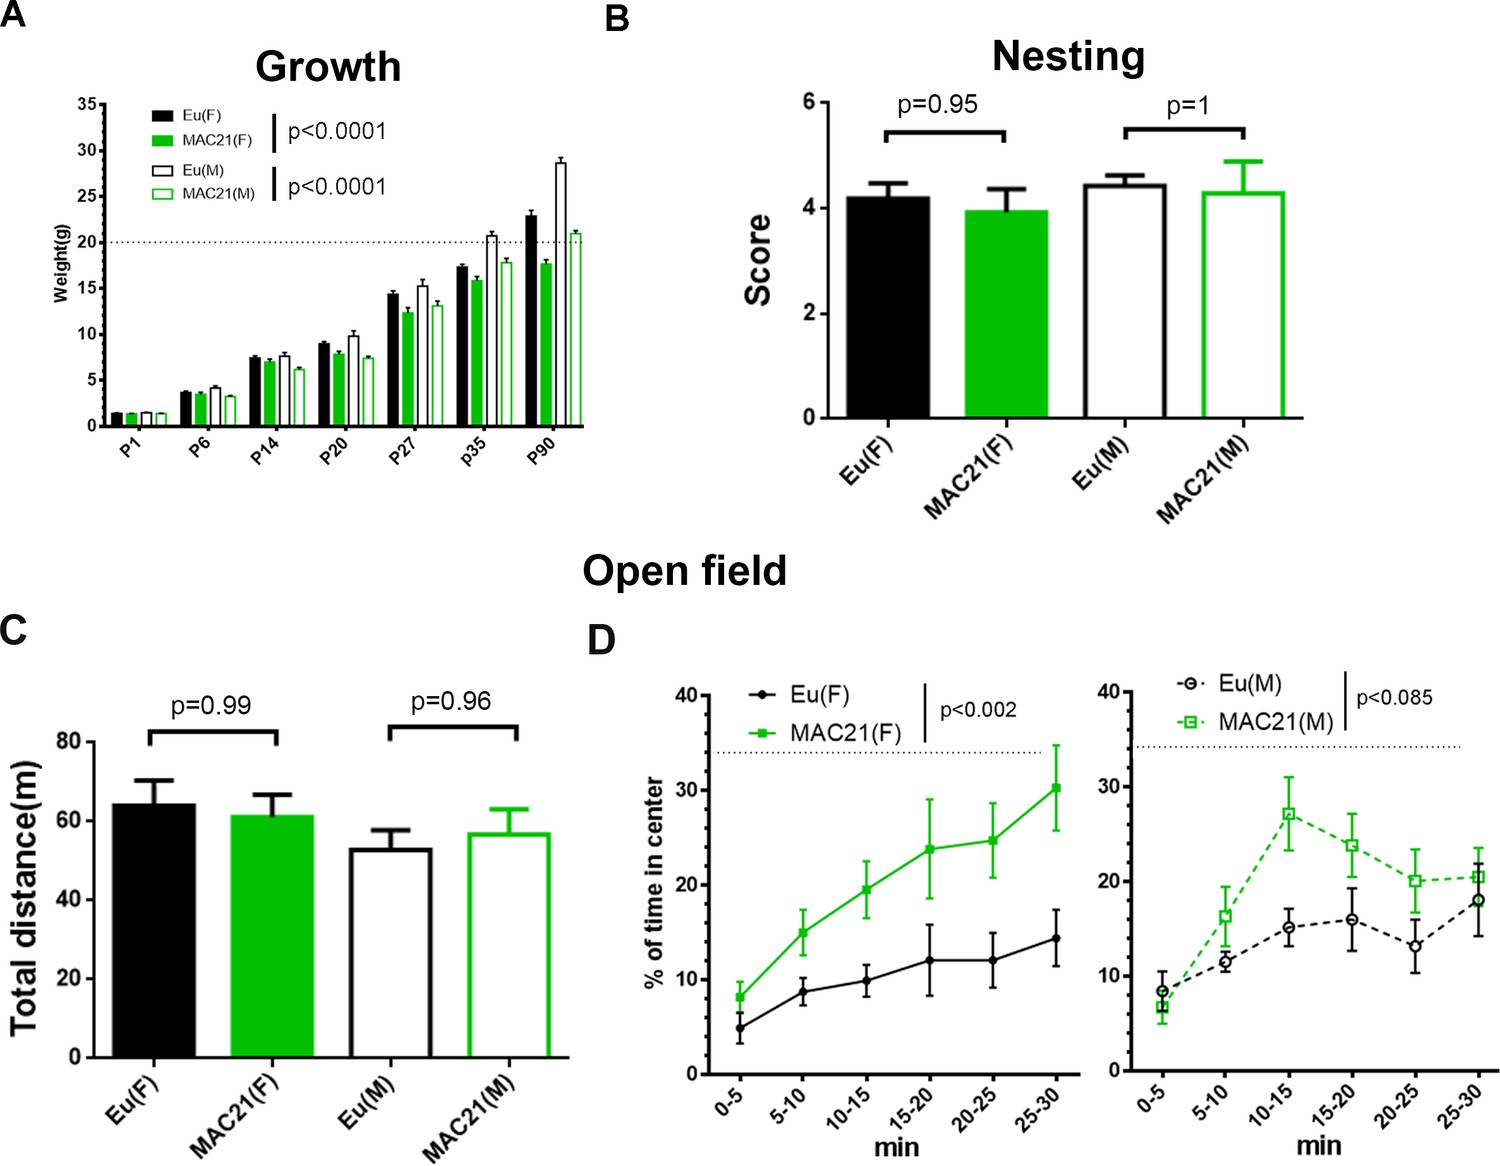
Growth profile, nesting and open field in TcMAC21.
(A) The mass of TcMAC21 and Eu at P1, P6, P14, P20, P27, P35 and P90 (n ≥ 9 per group; two-way ANOVA and Tukey’s post-hoc). (B) Nesting (female: Eu (n = 19), TcMAC21 (n = 13); male: Eu (n = 7), TcMAC21 (n = 7); one-way ANOVA and Tukey’s post-hoc). (C–D) 30 min open field (female: Eu (n = 12), TcMAC21 (n = 11); male: Eu (n = 11), TcMAC21 (n = 12)). (C) Total travel distance (one-way ANOVA and Tukey’s post-hoc). (D) Dynamics of % of time spent in the central zone, and dash lines shows that the center zone covers 34% of the whole open field (repeated measures ANOVA with LSD-post-hoc). All data are expressed as mean ± SEM and see Figure 6—source data 2 for detailed statistical analysis.
-
Figure 6—source data 1
Husbandry information for TcMAC21.
- https://cdn.elifesciences.org/articles/56223/elife-56223-fig6-data1-v2.docx
-
Figure 6—source data 2
Statistics for Figure 6.
- https://cdn.elifesciences.org/articles/56223/elife-56223-fig6-data2-v2.xlsx
Figure 6—figure supplement 1
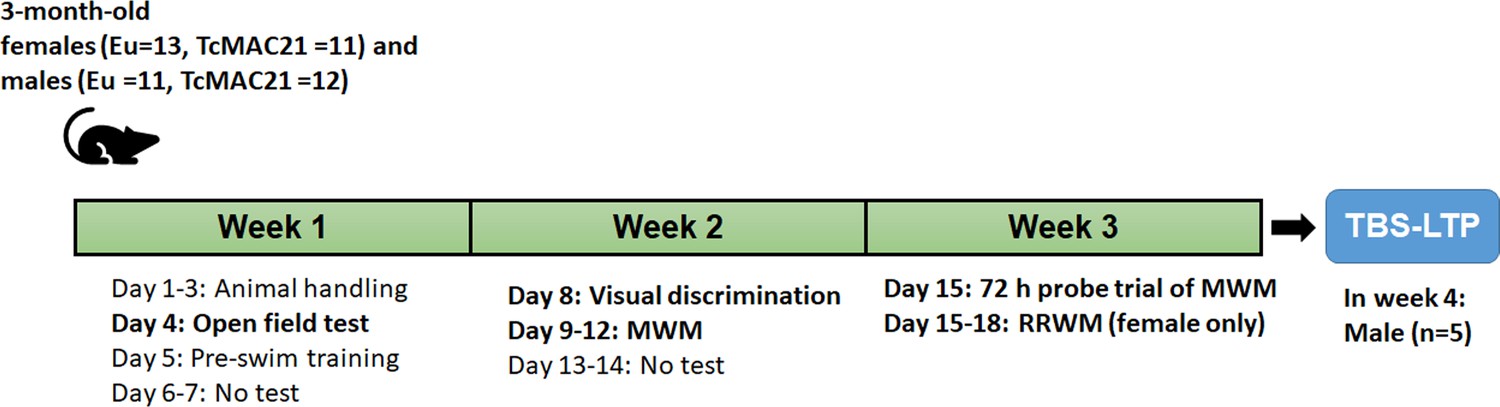
The experimental design for behavioral tests and electrophysiology to assess learning and memory in both Eu and TcMAC21.
Figure 7 with 3 supplements
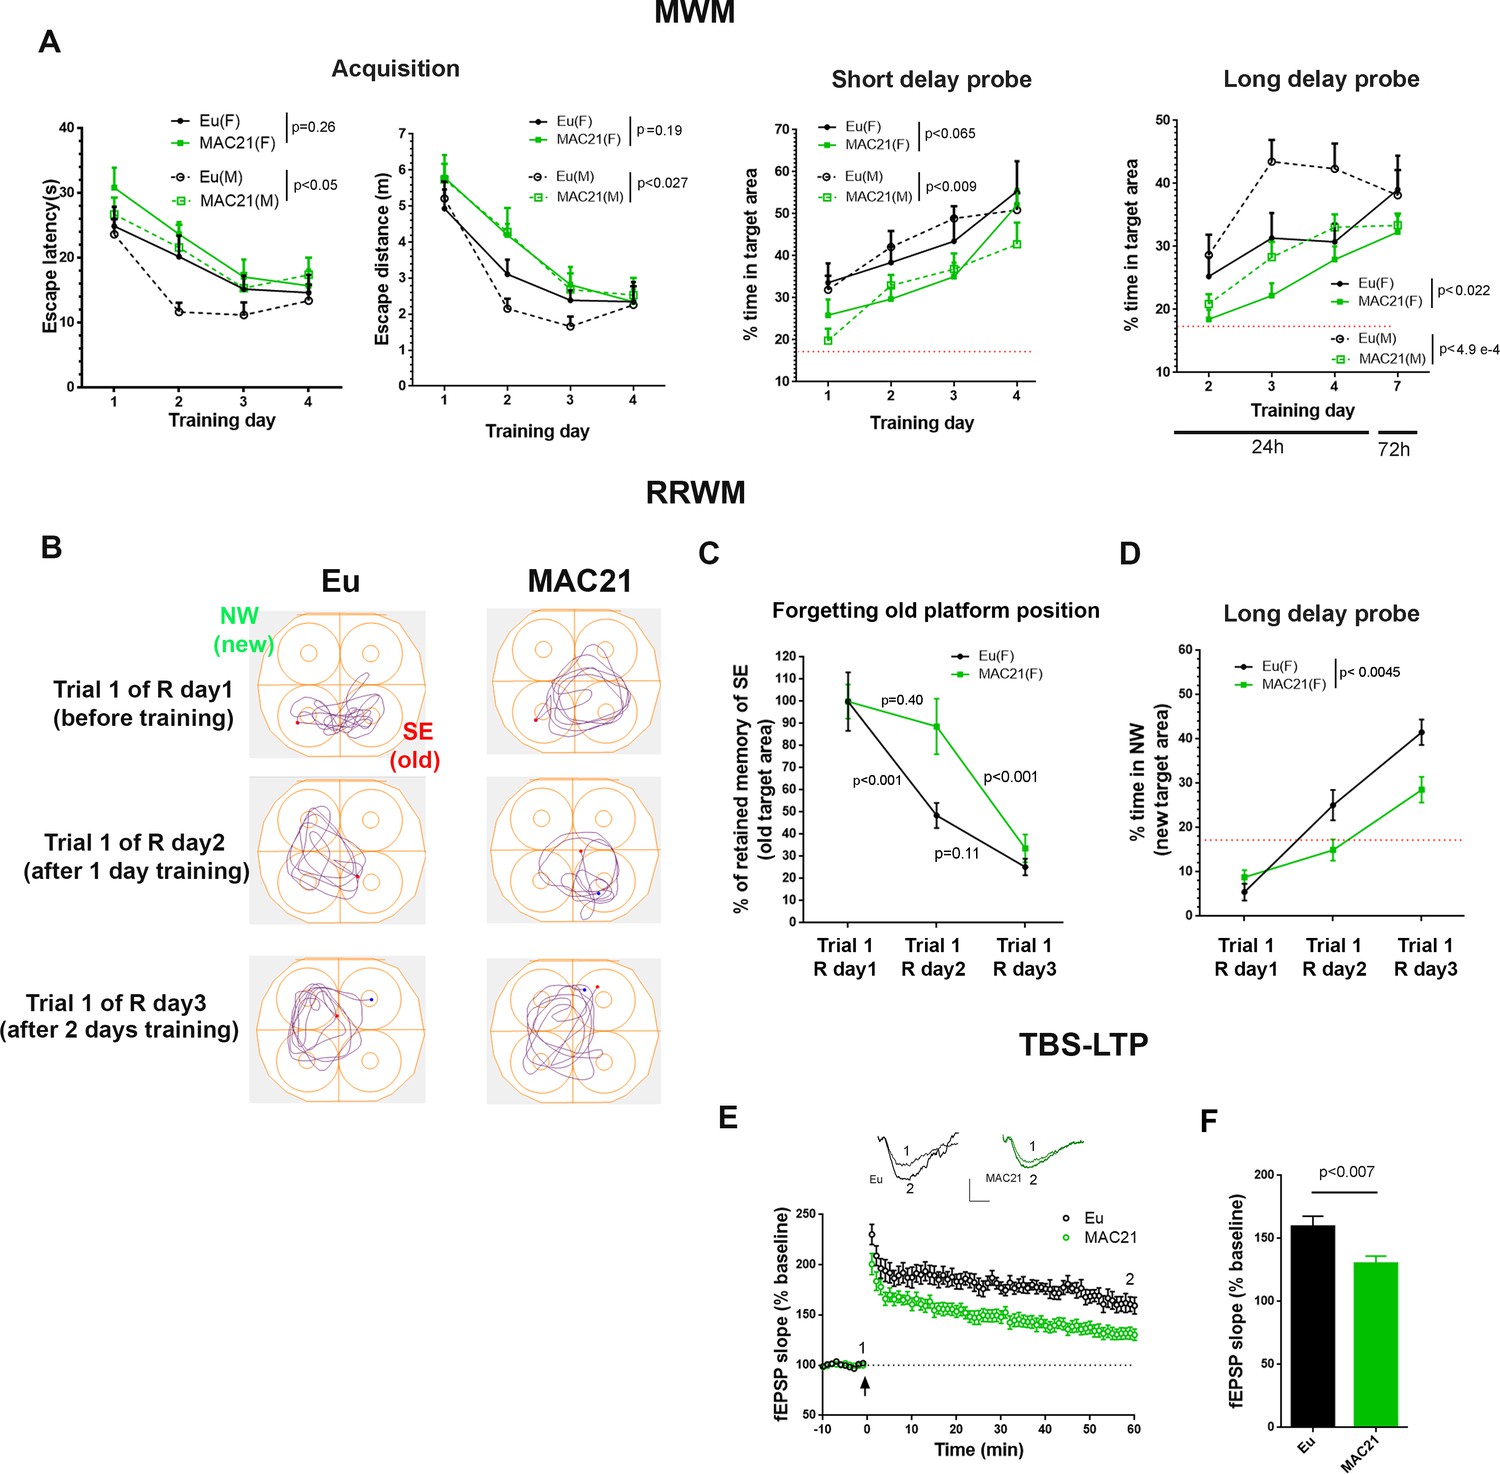
Learning and memory deficits in TcMAC21.
(A) MWM: acquisition trials (left, escape latency and escape distance), short delay probe (middle) and long delay probe (right). Red dash lines indicate 17% chance level (female: Eu (n=10), TcMAC21 (n=11); male: Eu (n=11), TcMAC21 (n=12)). (B–D) RRWM (female: Eu (n=8), TcMAC21 (n=9)). (B) Representative tracking plots of long delay probe trials of day 1 to day 3 of RRWM to visualize the progress of forgetting old platform SE position and learning new platform NW position. (C) Quantitative analysis of forgetting old platform SE position. Before RRWM training, each mouse’s “% of retained memory of SE of trial 1 of R day 1” is normalized as 100%. After RRWM day 1 training, “% of retained memory of SE of trial 1 of R day 2” of the mouse = “% of time in SE area in trial 1 of R day 2” / “% of time in SE area in trial 1 of R day 1” × 100%. After RRWM day 2 training, “% of retained memory of SE of trial 1 of R day 3” of the mouse = “% of time in SE area in trial 1 of R day 3” / “% of time in SE area in trial 1 of R day 1” × 100%. (D) Long delay probe trials from day 1 to day 3 of RRWM for comparing abilities of learning and memorizing new target platform NW position. (E–F) TBS-induced LTP at SC-CA1 synapses (male: Eu (n=5, 13 total slices), TcMAC21 (n=5, 14 total slices)). (E) Normalized fEPSP slopes are plotted every 1 min. Sample traces represent fEPSPs taken before TBS stimulation “1” and 60 min after TBS stimulation “2”. Arrow indicates LTP induction, and scale bars represent 0.5 mV (vertical), 5 ms (horizontal). (F) The amplitude of fEPSP slopes are averaged at 60 min after the stimulation. Repeated measures ANOVA with LSD-post hoc test in (A–D) and two-tailed t-test in (E–F), and data are expressed as mean ± SEM and see Figure 7—source data 1 for detailed statistical analysis.
-
Figure 7—source data 1
Statistics of Figure 7.
- https://cdn.elifesciences.org/articles/56223/elife-56223-fig7-data1-v2.xlsx
Figure 7—figure supplement 1
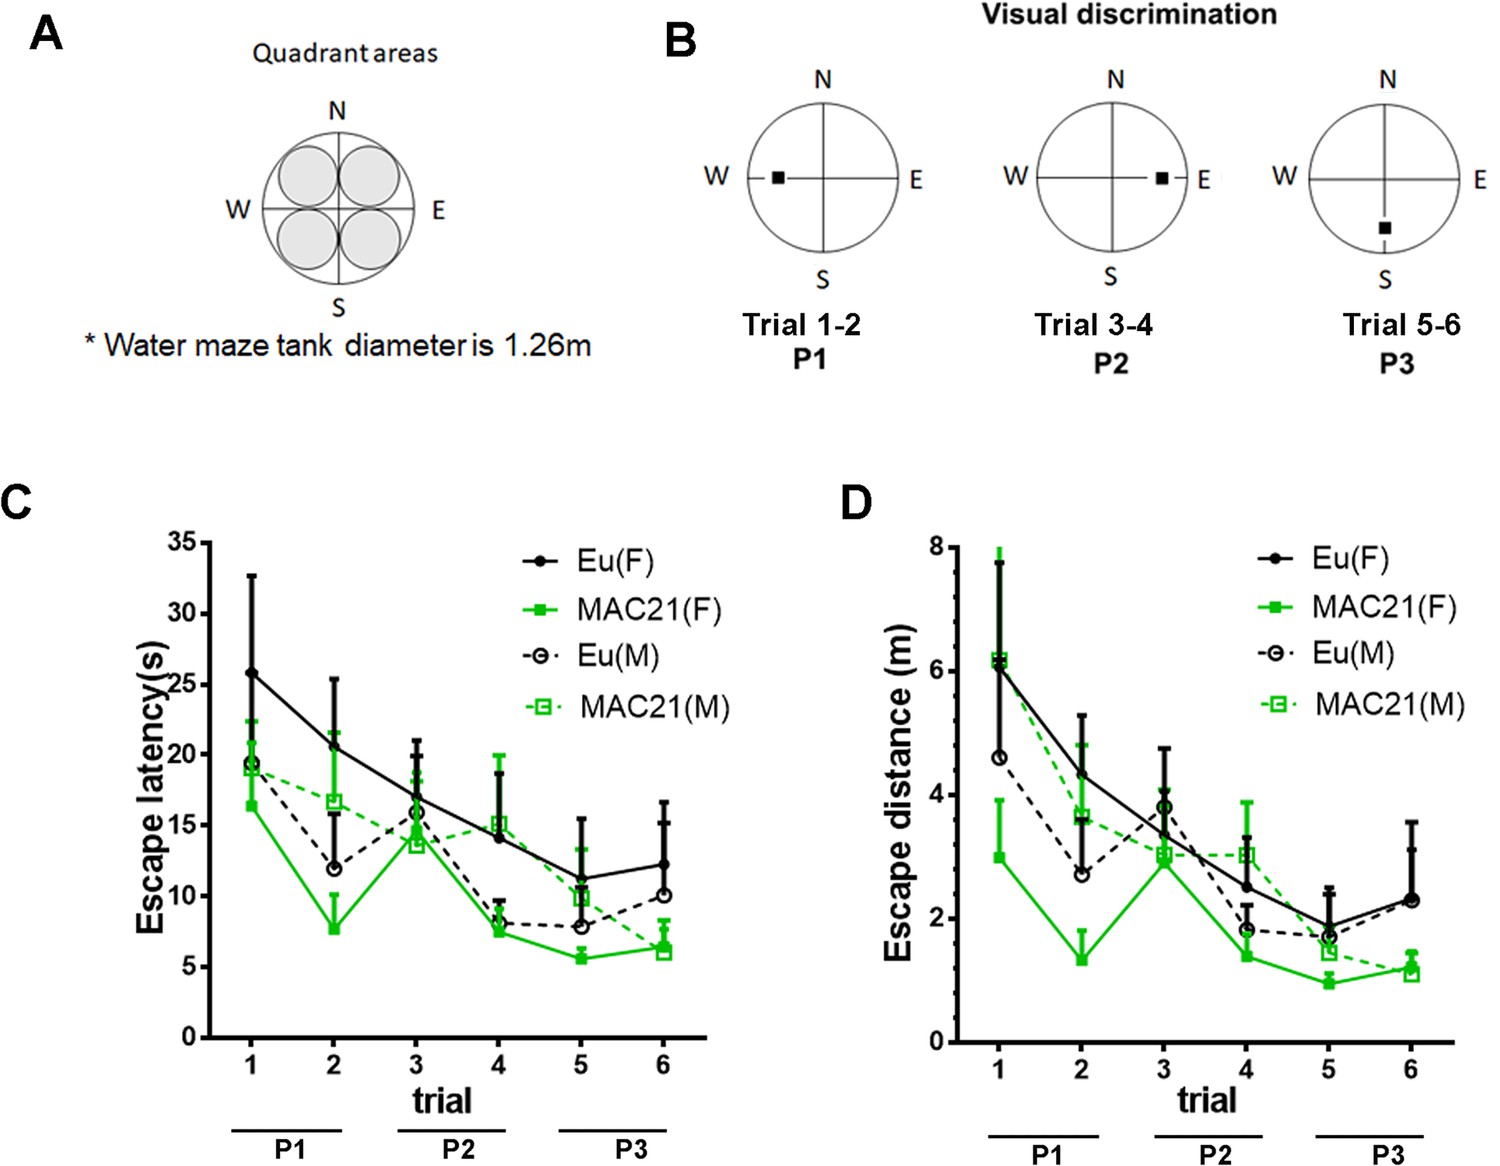
Visual discrimination.
(A) Water tank specifications. The inner circle, the target area, is defined as a circle inscribed in the platform quadrant, covering ~17% of water maze tank. (B) Design of visual discrimination: platform changes every two trials from W, to E, and to S. (C–D) Visual discrimination performance of TcMAC21 and Eu measured by escape latency (p=0.27, (C) and escape distance (p=0.19, (D). Female: Eu (n = 13), MAC21 (n = 11); male: Eu (n = 11), MAC21 (n = 12). Data are analyzed by repeated measures ANOVA with LSD post-hoc and expressed as mean ± SEM. See Figure 7—source data 1A for detailed statistical analysis.
Figure 7—figure supplement 2
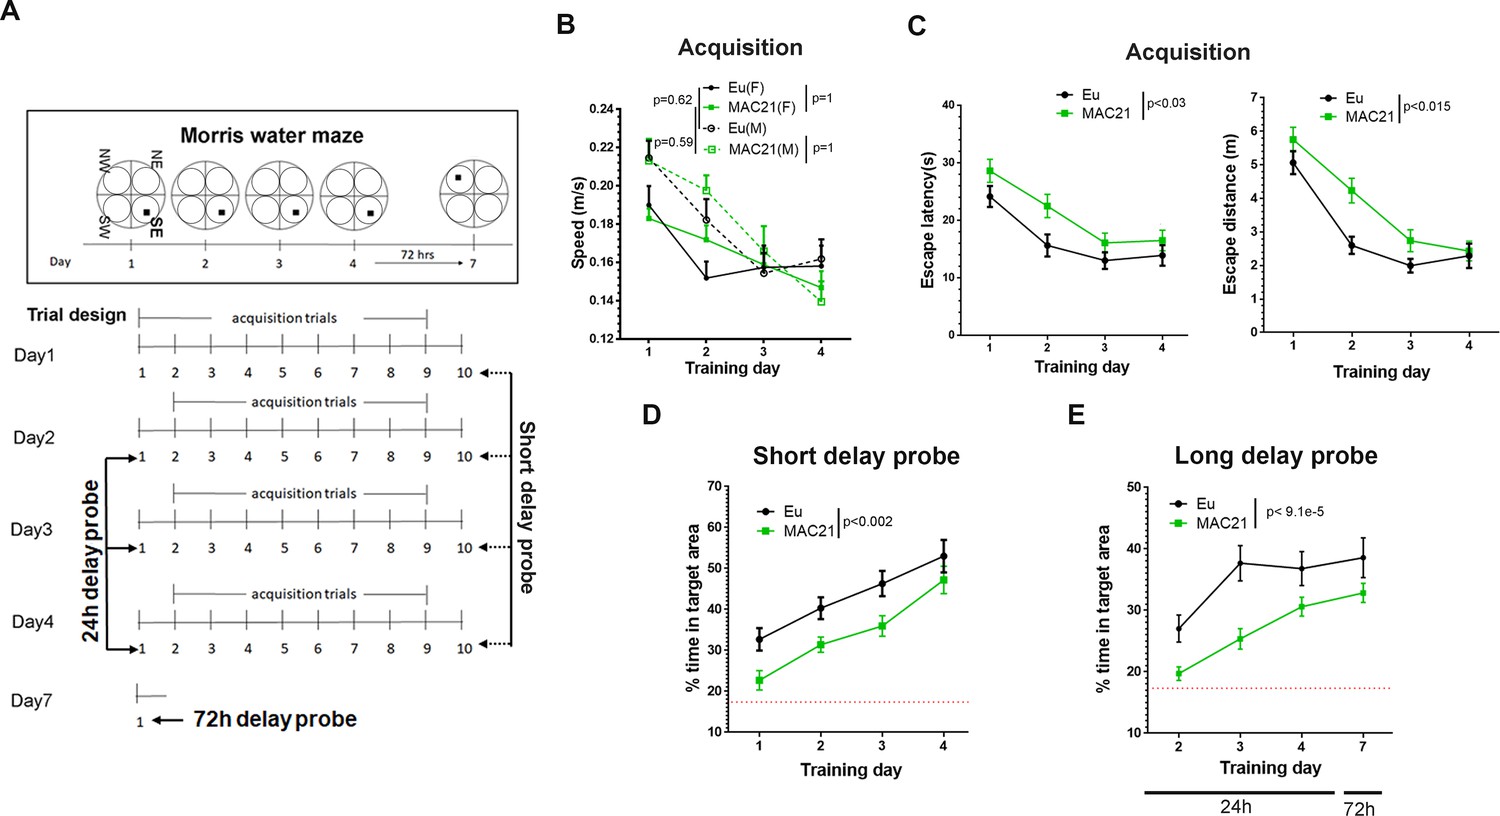
MWM.
(A) Scheme for classic MWM: four full days of training, each day has 10 trials including eight acquisition trials (trial 1–4 and trial 6–9 in day 1, trial 2–9 in day 2–4), short delay probe trials (~30 min delay, trial 10 in day 1–4), and long delay probe trials (24 hr long delay, trial 1 in day 2–4; 72 hr long delay, trial 1 in day 7). Trial 5 of day one is a probe trial drill and no data from trial 5 of Day one is used for analysis: the platform is lowered to a position that mice are not able to climb onto, and mice are allowed to swim for 10 s, and then a tester raises the platform and guide mice to the platform. (B) Swimming speed in MWM acquisition trials. (C–E) Analysis of MWM acquisition, short delay probe and long delay probe, and Data are analyzed by repeated measures ANOVA with LSD post-hoc and expressed as mean ± SEM of consolidated female and male. Female: Eu (n = 10), MAC21 (n = 11); male: Eu (n = 11), MAC21 (n = 12). See Figure 7—source data 1B for detailed statistical analysis.
Figure 7—figure supplement 3
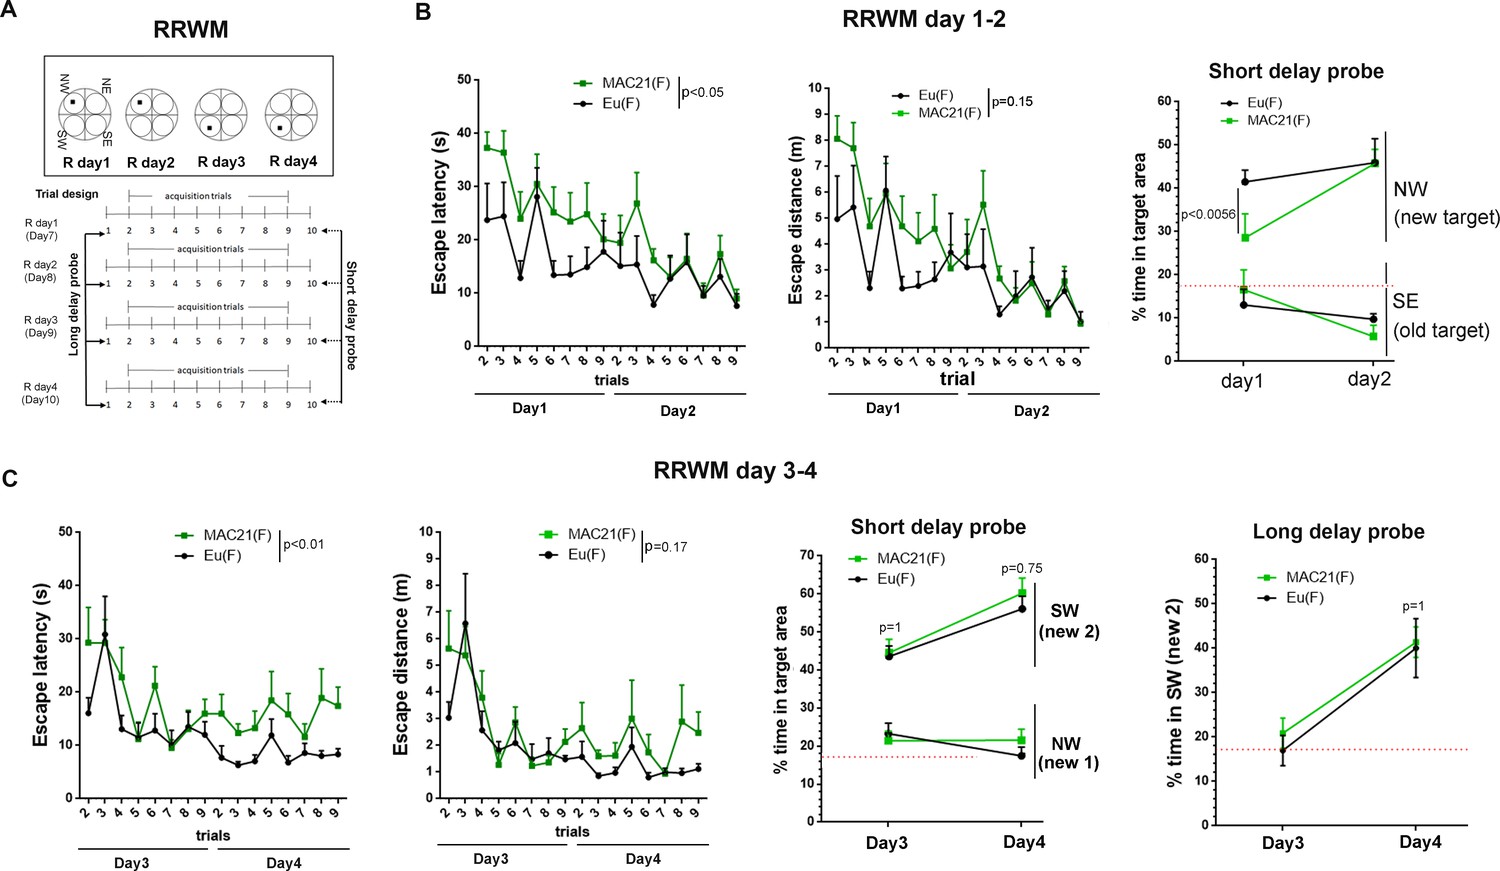
RRWM.
(A) RRWM scheme: four full days of training, the targeting platform is in NW (relocated from SE of MWM) during reversal session 1 (R day one and R day 2) and then relocated to SW during reversal session 2 (R day three and R day 4). Each day has 10 trials, including eight acquisition trials (trial 2–9) and two probe trials (trial 10 of R day 1–4 is 30 min short delay, Trial 1 of R day one also known as the 72 hr delay probe trial of MWM, Trial 1 of R day 2–4 is 24 hr long delay). (B) Acquisition and short delay probe trials in reversal 1. (C) Acquisition, short delay probe and long delay probe trials in reversal 2. Data are analyzed by repeated measures ANOVA with LSD post-hoc and expressed as mean ± SEM. Female: Eu (n = 8), TcMAC21 (n = 9), and see Figure 7—source data 1C for detailed statistical analysis.
Tables
Table 1
PCG content of HSA21p vs. HSA21q.
| HSA21p | gene start | HSA21q Paralog | gene start |
|---|---|---|---|
| FP565260.4 | 5011799 | DNMT3L | 44246339 |
| FP565260.3 | 5022493 | ICOSLG | 44217014 |
| GATD3B | 5079294 | GATD3A | 44133610 |
| FP565260.2 | 5116343 | GATD3A | 44133610 |
| FP565260.1 | 5130871 | PWP2 | 44107373 |
| FP565260.6 | 5155499 | TRAPPC10 | 44012309 |
| CU639417.1 | 5972924 | H2BFS | 43565189 |
| SIK1B | 6111134 | SIK1 | 43414483 |
| CBSL | 6444869 | CBS | 43053191 |
| U2AF1L5 | 6484623 | U2AF1 | 43092956 |
| CRYAA2 | 6560714 | CRYAA | 43169008 |
| SMIM11B | 7744962 | SMIM11A | 34375480 |
| FAM243B | 7768884 | FAM243A | 34400317 |
| SMIM34B | 7784482 | SMIM34A | 34418715 |
| KCNE1B | 7816675 | KCNE1 | 34446688 |
| BAGE2 | 10413477 | ||
| TPTE | 10521553 |
-
Table 1—source data 1
The analysis of HSA21 genes.
PCG content of HSA21p vs. HSA21q.
- https://cdn.elifesciences.org/articles/56223/elife-56223-table1-data1-v2.xlsx
Table 2
Comparison of TcMAC21 and other mouse models of DS.
| Issues | TcMAC21 | Tc1 | Ts65Dn | Ts1Cje | Dp(16)1Yey/+ or Dp1Tyb | Dp(10)1Yey/+; Dp(16)1Yey/+; Dp(17)1Yey/+ |
|---|---|---|---|---|---|---|
| Mosaicism | No | Yes | No | No | No | No |
| Freely segregating chromosome | Yes | Yes | Yes | No | No | No |
| Trisomic HSA21q PCG/orthologs (% of 213 HSA21q) | 199 (93.4%) | 158 (74.2%) | 110 (51.6%) | 68 (31.9%) | 122 (57.3%) | 180 (40;122;18) (84.5%) |
| Trisomic HSA21q PCG/orthologs, excluding KRTAPs | 150 | 109 | 92 | 68 | 104 | 160 |
| * Trisomic mouse PCGs with no human ortholog | 0 | 0 | 7 | 7 | 10 | 12 |
| † Trisomic or monosomic PCGs that are not HSA21 orthologs | 0 | 0 | Trisomic ~44 MMU17 | Monosomic ~ 7 MMU12 | 0 | 0 |
-
*Refer to data file S1A for the name and location of each mouse PCG conserved with Hsa21 (MMU10, 16, 17). Gene annotation is based on ‘GRCh38, P12’ and ‘GRCm.P6’.
†The reference of the translocation breakpoints of Ts65Dn and Ts1Cje is “Duchon A, Raveau M, Chevalier C, Nalesso V, Sharp AJ, Herault Y. Identification of the translocation breakpoints in the Ts65Dn and Ts1Cje mouse lines: relevance for modeling Down syndrome. Mamm Genome. 2011;22(11, 12):674–684.’ The number of genes is based on ‘GRCm.P6’.
Key resources table
| Reagent type (species) or resource | Designation | Source or reference | Identifiers | Additional information |
|---|---|---|---|---|
| Strain, strain background (Mus musculus) | TcMAC21 | This paper | See details in Table 3 | |
| Antibody | Anti-APP (mouse monoclonal) | Millipore | MAB348, RRID:AB_94882 | (1:500) |
| Antibody | Anti-β-Amyloid (6E10, mouse monoclonal) | Covance | SIG-39320, RRID:AB_662798 | (1:500) |
| Antibody | Anti-Calbindin (rabbit monoclonal) | Cell signaling | 13176, RRID:AB_2687400 | (1:250) |
| Commercial assay or kit | Human/rat β amyloid (Aβ40) | Wako | 294–64701 | |
| Commercial assay or kit | Human/rat β amyloid (Aβ42) | Wako | 290–62601 | |
| Commercial assay or kit | TaqMam Gene Expression Master Mix | Applied Biosystems | 4369016 | |
| Commercial assay or kit | RNeasy Mini Kit | Qiagen | 74104 | |
| Commercial assay or kit | NEBNext Poly (A) mRNA Magnetic Isolation Module | NEB | E7490 | |
| Commercial assay or kit | NEBNext Ultra II RNA Library Prep Kit | NEB | E7770 | |
| Commercial assay or kit | Lipofectamine 2000 Transfection Reagent | ThermoFisher | 11668027 | |
| Chemical compound, drug | Human COT-1 DNA | ThermoFisher | 15279–011 | |
| Chemical compound, drug | Mouse COT-1 DNA | ThermoFisher | 18440–016 | |
| Chemical compound, drug | Mouse minor satellite DNA | Gift of Dr. Vladimir Larionov (NIH) | ||
| Software, algorithm | MorphoJ | Klingenberg lab | ||
| Software, algorithm | R | R-project | ||
| Software, algorithm | Any-maze | Stoeltingco | ||
| Software, algorithm | GraphPad Prism | GraphPad | ||
| Software, algorithm | STATISTICA | TIBCO |
Table 3
Experimental animal information.
| Experiment | Genetic background | Age | Eu | TcMAC21 | |
|---|---|---|---|---|---|
| Figure 1 | WGS | B6;DBA | 1-month-old | Not tested | Male: N = 1 |
| Figure 2 | RNA-seq | B6;DBA | P1 | Male: N = 2 | Male: N = 2 |
| Figure 3 | GFP expression | B6;DBA | 1–10 month-old | Male: N = 2 | Male: N = 2 |
| Figure 3 | Mosaicism analysis by FISH | B6;DBA | 1–10 month-old | Male: N = 1 | Male: N = 2 |
| Figure 3 | Mosaicism analysis by FCM | ICR;B6;CBA | 10-month-old | Male: N = 1 | Male: N = 2 |
| Figure 3 | Mosaicism analysis by immunostaining | B6;DBA | 4.5-month-old | Male: N = 3 | Male: N = 3 |
| Figure 4 | CHD by wet dissection | B6;DBA | E18.5 | N = 19, gender unknown | N = 21, gender unknown |
| Figure 4 | CHD by histology | B6;DBA | E14.5 | N = 20, gender unknown | N = 20, gender unknown |
| Figure 4 | Brain MRI | B6;DBA | 4.5-month-old | Male: N = 7 | Male: N = 7 |
| Figure 4 | Craniofacial morphology by micro-CT | B6;DBA | 4.5-month-old | Male: N = 10 | Male: N = 9 |
| Figure 5 | Western, ELISA, and amyloid plaque staining | B6;DBA | 15–24 month-old | Male: N = 6 | Male: N = 6 |
| Figure 5 | Peripheral blood analyses | B6;DBA | 10–12 month-old | Male: N = 6 | Male: N = 5 |
| Figure 5 | Colony-forming cell assays | ICR;B6;DBA | 10-month-old | Male: N = 6 | Male: N = 6 |
| Figure 5 | Radiosensitivity test | ICR;B6;DBA | 16–18 week-old | Male: N = 3 | Male: N = 3 |
| Figure 6 | Nesting | B6;DBA | 3–4 month-old | Female: N = 16; Male: N = 7 | Female: N = 13; Male: N = 7 |
| Figure 6 | Open field | B6;DBA | 3-month-old | Female: N = 12; Male: N = 11 | Female: N = 11; Male: N = 12 |
| Figure 7 | Classic MWM | B6;DBA | 3-month-old | Female: N = 10; Male: N = 11 | Female: N = 11; Male: N = 12 |
| Figure 7 | RRWM | B6;DBA | 3-month-old | Female: N = 8 | Female: N = 9 |
| Figure 7 | TBS-LTP | B6;DBA | 3.5-month-old | Male: N = 5 | Male: N = 5 |
Table 4
Primer sequences for genomic PCR or RT-PCR analyses.
| Gene or aim | Primer name (forward) | Forward primer(5'−3') | Primer name (reverse) | Reverse primer(5'−3') | Product size | |
|---|---|---|---|---|---|---|
| Genomic PCR | MAC1 | m11 5L | TGACAGAGAGCTTCCTCCTGCCTCTGTA | EGFP-F | CCTGAAGTTCATCTGCACCA | 5.0 kb |
| Chr.21-loxP | #21CEN < 1 > 2L | AAATGCATCACCATTCTCCCAGTTACCC | PGKr1 | GGAGATGAGGAAGAGGAGAACA | 4.5 kb | |
| Cre-loxP recombination | TRANSL1 | TGGAGGCCATAAACAAGAAGAC | TRANSR1 | CCCCTTGACCCAGAAATTCCA | 409 bp | |
| Cre-loxP recombination | kj neo | CATCGCCTTCTATCGCCTTCTTGACG | PGKr1 | GGAGATGAGGAAGAGGAGAACA | ~600 bp | |
| D21S265 | SHGC-40F | GGGTAAGAAGGTGCTTAATGCTC | SHGC-40R | TGAATATGGGTTCTGGATGTAGTG | 178 bp | |
| APP | SHGC-31514F | CTGGGCAATAGAGCAAGACC | SHGC-31514R | ACCCATATTATCTATGGACAATTGA | 115 bp | |
| D21S260 | D21S260F | AGCTGTTCATGCTTCCATCT | D21S260R | AGAGCCCAGAATATTGACCC | 270 bp | |
| SOD1 | SHGC-6902F | ATTCTGTGATCTCACTCTCAGG | SHGC-6902R | TCGCGACTAACAATCAAAGT | 133 bp | |
| D21S261 | SHGC-3610F | AACACCTTACCTAAAACAGCA | SHGC-3610R | TGGACCTTTTGATTTTTCCT | 130 bp | |
| AML1 | SHGC-30487F | GTAACCTGGTTAACATAGGGTTTC | SHGC-30487R | GTAGGGGAGGCTAATGGCAT | 150 bp | |
| CBR1 | J04056F | GATCCTCCTGAATGCCTG | J04056R | GTAAATGCCCTTTGGACC | 245 bp | |
| SIM2 | WI-22186F | GGGCCTCATGGTAAGAGTCA | WI-22186R | GAAAAATGTCGGTGGTATCTCC | 250 bp | |
| HLCS | WI-15188F | TTCAGTACCTCCCCAGATGC | WI-15188R | CTTAGTAGTGCAGACCTTTACCCC | 125 bp | |
| TTC3 | WI-19945F | TGGACAAATATAAGGCATGTTCA | WI-19945R | GTCACCTTCCTCTGCCTTTG | 267 bp | |
| D21S394 | D21S394F | GGAGCCGGTTCTTCGAAGG | D21S394R | CAGCGTCCGGAATTCCTGC | 71 bp | |
| D21S336 | D21S336F | TCTGGTTCCCAGGATTGTAA | D21S336R | AGAGTTGCTGTAAGCATCAAAGT | 350 bp | |
| D21S55 | D21S55F | AGGCTCCTTCACCTCTTGAC | D21S55R | CATCCTCTTTGCATTAGG | 159 bp | |
| GIRK2 | GIRK2F | GTTTGTCTTCAGCTCACC | GIRK2R | CCCAAAATACTACACATCC | 266 bp | |
| ERG | M21535F | AATGGCGTCAGCCTCTCC | M21535R | CAGTTTGCCTTACGAGTGGTAGC | 254 bp | |
| ETS2 | SHGC-11267F | TACCATGCCAATGGTTTATAAGG | SHGC-11267R | ATGTGACTGGGAACATCTTGC | 177 bp | |
| D21S268 | D21S268F | CAACAGAGTGAGACAGGCTC | D21S268R | TTCCAGGAACCACTACACTG | 213 bp | |
| PCP4 | WI-14954F | GAATTCACTCATCGTAACTTCATTT | WI-14954R | CCTTGTAGGAAGGTATAGACAATGG | 126 bp | |
| D21S266 | D21S266F | CACAATGTAGATGTAGCACAGTTAG | D21S266R | TGAGTCTGAAGAAAGGCAAATGAAG | 166 bp | |
| D21S15 | D21S15F | GAGGATAAACCGATTCACAGCTAGGAATAC | D21S15R | GTGCACGTAATTAATGACCATGATATTGCT | 218 bp | |
| MX1 | WI-18875F | TGGACTGACGACTTGAGTGC | WI-18875R | CTCATGTGCATCTGAGGGTG | 143 bp | |
| TFF1 | SGC35308F | CAGGGATCTGCCTGCATC | SGC35308R | ATCGATCTCTTTTAATTTTTAGGCC | 183 bp | |
| PWP2 | SHGC-33273F | GATCTTGACCGGGAAAAGGG | SHGC-33273R | AACAAGTGGCAAAATGCATAC | 150 bp | |
| APECED | A009B16F | AAAATCCTCCCTTTAAGAGC | A009B16R | GGGTGTTAGGTACTGGCT | 118 bp | |
| PFKL | sts-X15573F | AGGGCTTCTGAGGCCAGC | sts-X15573R | AGGGCACTCTGTCCTCCTGC | 239 bp | |
| UBE2G2 | WI-11417F | TTCAACAGTCATTAGGTTCCACC | WI-11417R | GTGAGATCGGGAGAGGGAG | 129 bp | |
| RT-PCR | APP | WI-18826F | ACGTTTGTTTCTTCGTGCCT | WI-18826R | GCCCCGTAAAAGTGCTTACA | 136 bp |
| SOD1 | SHGC-6902F | ATTCTGTGATCTCACTCTCAGG | SHGC-6902R | TCGCGACTAACAATCAAAGT | 133 bp | |
| IFNAR2 | U29584F | CGAAGTTTCAGTCGGTGAG | U29584R | GGCATTCAGGTTTTATCCC | 181 bp | |
| TTC3 | WI-19945F | TGGACAAATATAAGGCATGTTCA | WI-19945R | GTCACCTTCCTCTGCCTTTG | 267 bp | |
| PCP4 | WI-14954F | GAATTCACTCATCGTAACTTCATTT | WI-14954R | CCTTGTAGGAAGGTATAGACAATGG | 126 bp | |
| MX1 | WI-18875F | TGGACTGACGACTTGAGTGC | WI-18875R | CTCATGTGCATCTGAGGGTG | 143 bp | |
| TFF3 | WI-7267F | GGCTGTGATTGCTGCCAG | WI-7267R | GTGGAGCATGGGACCTTTAT | 124 bp | |
| TFF1 | SGC35308F | CAGGGATCTGCCTGCATC | SGC35308R | ATCGATCTCTTTTAATTTTTAGGCC | 183 bp | |
| GADPH | RPC1 | CCATCTTCCAGGAGCGAGA | RPC2 | TGTCATACCAGGAAATGAGC | 722 bp |
Additional files
Download links
A two-part list of links to download the article, or parts of the article, in various formats.
Downloads (link to download the article as PDF)
Open citations (links to open the citations from this article in various online reference manager services)
Cite this article (links to download the citations from this article in formats compatible with various reference manager tools)
A non-mosaic transchromosomic mouse model of down syndrome carrying the long arm of human chromosome 21
eLife 9:e56223.
https://doi.org/10.7554/eLife.56223


