Speciation and the developmental alarm clock
- Department of Ecology & Evolutionary Biology, University of Toronto, Canada
- Department of Integrative Biology, University of Wisconsin – Madison, United States
Figures
Box 1—figure 1
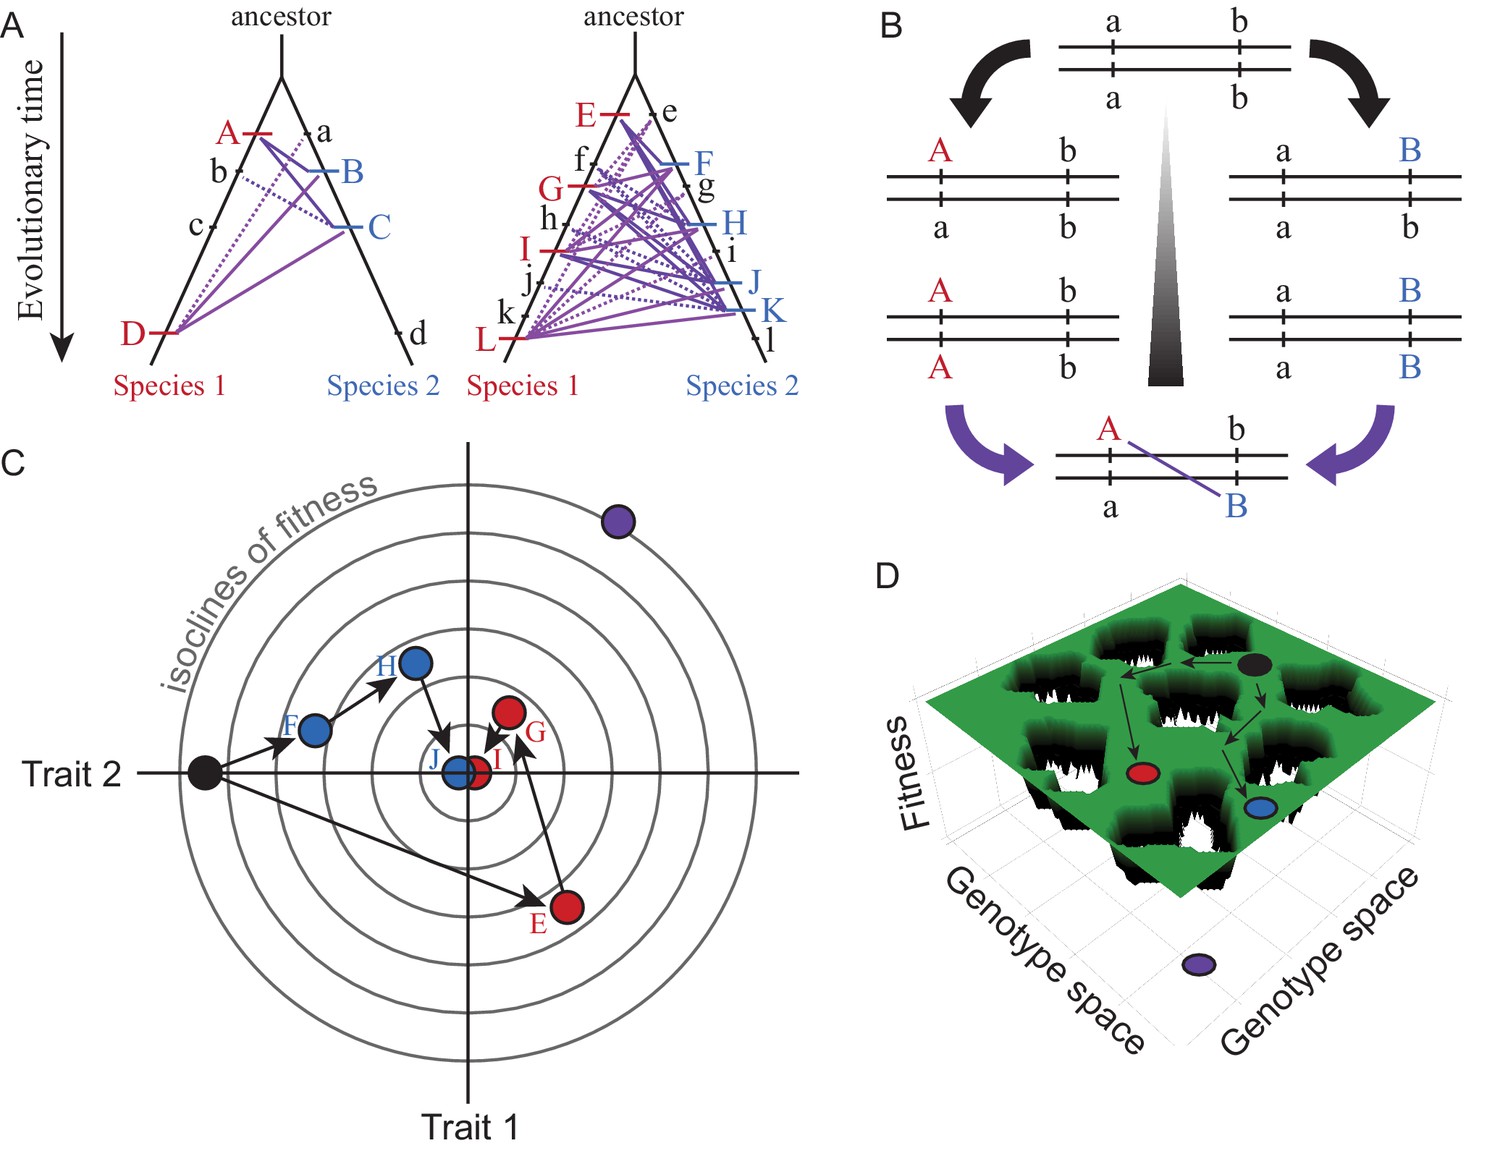
Visualizations of genetic divergence and incompatibilities.
Species trees in (A) show the history of substitutions for loci in two genetic networks that differ in molecular evolution (case on left with e.g. fewer genes, stronger purifying selection, less adaptation, greater modularity, or lower pleiotropic effects) and in the potential for DMIs (solid purple lines = potential DMI for derived-derived substitutions between species, dashed lines = potential derived-ancestral DMIs; lowercase = ancestral alleles, uppercase = derived substitutions unique to one lineage). The number of potential DMIs (purple) scales faster than linear with number of substitutions (red and blue hashes); faster evolving genetic networks may be more likely to experience this ‘snowball effect’ of reproductive isolation (Orr, 1995). DSD arises when the outward phenotype remains constant despite molecular divergence between descendant species. Panel (B) shows how two loci (a and b) that diverge can potentially create a DMI upon formation of F1 hybrids between descendant species. Panel (C) illustrates with a Fisher’s geometric model visualization, for two traits with a shared genetic architecture, how adaptive evolution with respect to one trait (Trait 1) can generate DSD in another (Trait 2). Concentric circles represent lines of equal fitness; filled dots (black = ancestor, red and blue = descendant species) indicate genotypes (letters as in A) that evolve via three substitutions (arrows) toward the fitness optimum at the center. Note the DSD in Trait 2 due to no net phenotypic difference relative to the ancestor at the end of the adaptive walk for both species, despite underlying genetic changes. Panel (D) shows evolution along ridges of equal fitness in a fitness landscape comprised of a genetic architecture with many genes. Genotypic paths evolve independently in different species (ancestral black to derived red and blue species), similarly to DSD, such that hybrids between them (purple) occupy a portion of genotype space with low fitness (‘holes’).
Box 2—figure 1
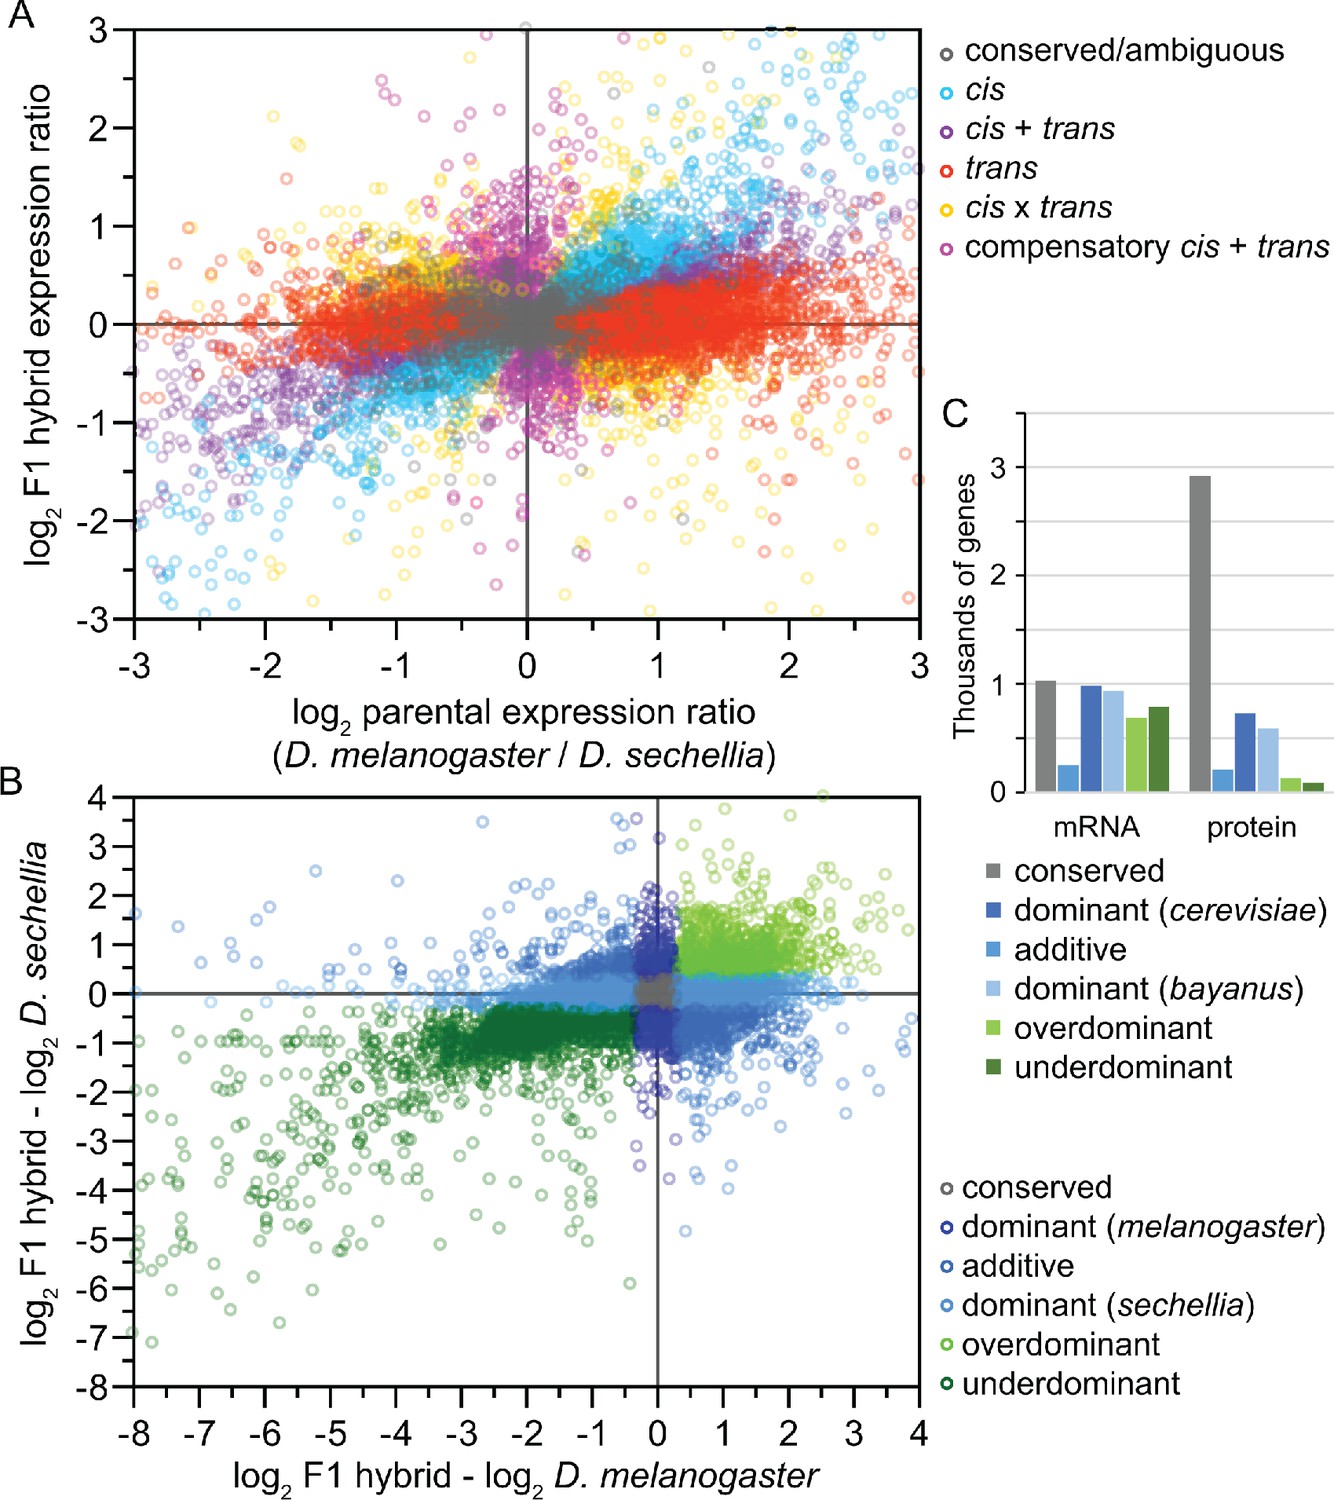
Analysis of inter-species hybrids can reveal genome-wide mechanisms of gene regulatory change.
(A) Comparison of allele-specific expression ratios in F1 hybrids to expression ratios for orthologous genes in parental individuals allows inference of expression changes due to local cis-acting regulatory differences, distant trans-acting changes, or distinct ways that both cis- and trans-regulatory divergence can jointly influence gene expression. (B) Another type of expression comparison between F1 hybrid individuals and parental species can characterize the dominance in allele-specific expression, with misexpression in hybrids reflecting disproportionately high (overdominant) or low (underdominant) gene expression. (C) The inference of misexpression in hybrids at the transcriptional level may be buffered at the translational level, leading to more severe misexpression of the transcriptome than proteome. Other approaches to using inter-species hybrids for deciphering the genetics of divergence in development include quantitative trait locus (QTL) mapping. Inter-species QTL analyses can incorporate screens with deletion libraries (Masly and Presgraves, 2007), recombinant inbred line (RIL) panels (Bedinger et al., 2011), near isogenic line (NIL) or introgression line panels (Guerrero et al., 2017), or multigeneration selection approaches such as X-QTL mapping (Ehrenreich et al., 2010). Panels A and B redrawn from data for Drosophila flies in McManus et al., 2010. Panel C data for Saccharomyces yeast from Wang et al., 2015.
Figure 1
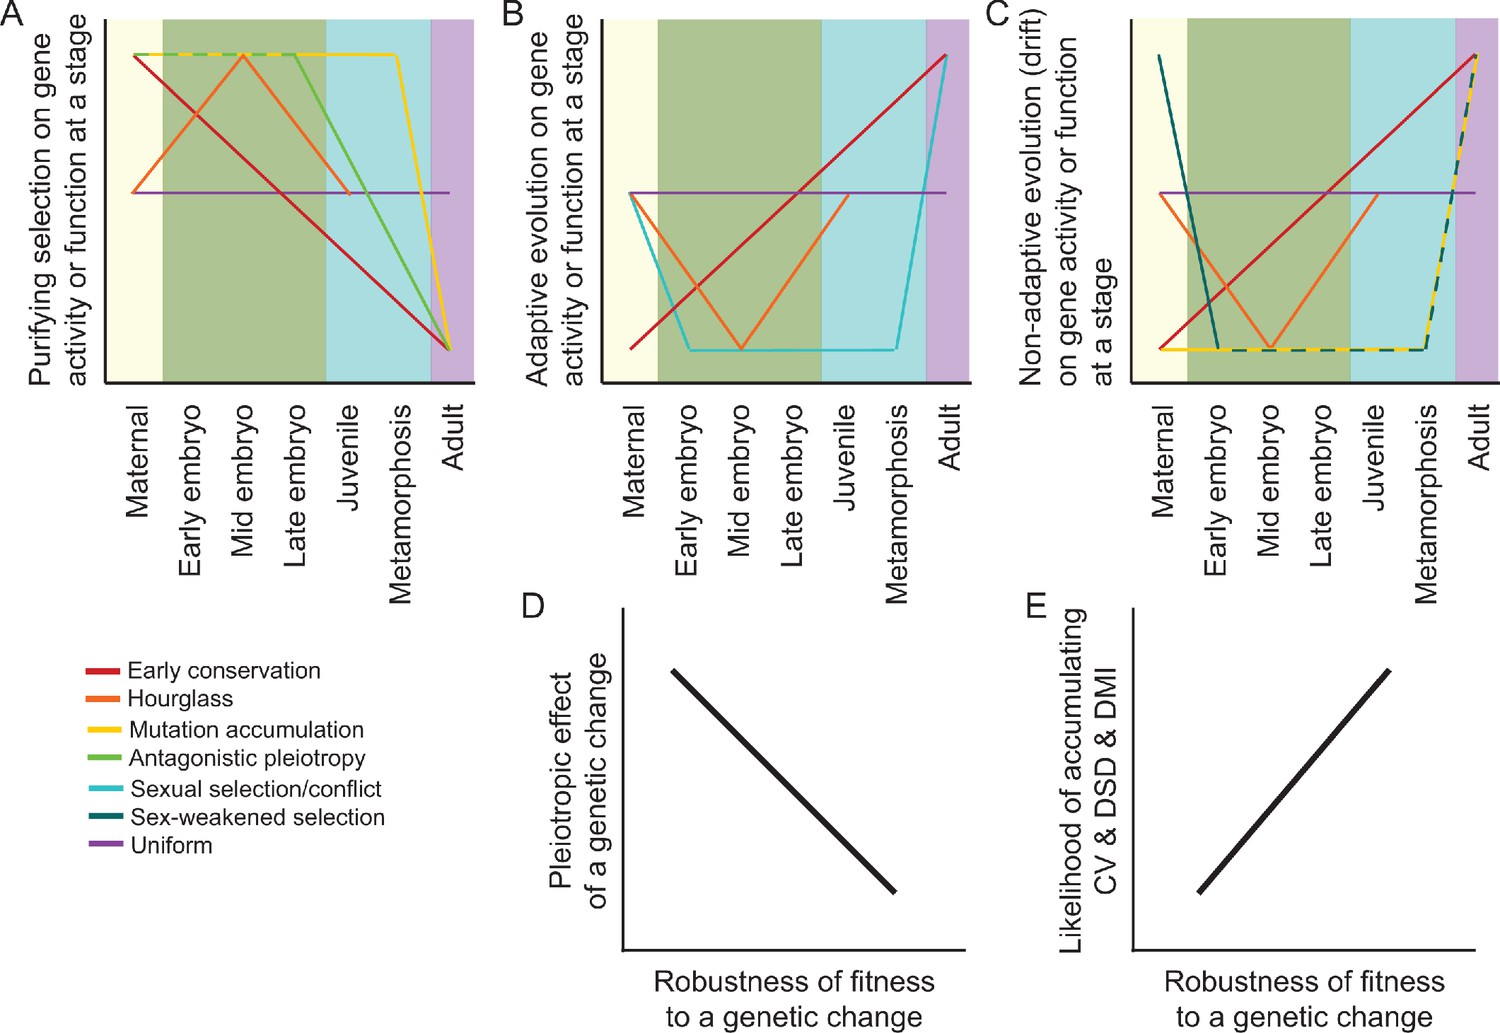
Predictions and hypotheses in the evolution of ontogeny and reproductive isolation.
(A–C) Models from population genetics and evo-devo suppose that some modes of natural selection may be more potent at particular life stages, as described in the main text. However, not all models make clear predictions about the ontogenetic dynamism of selection for all selection modes (purifying vs adaptive vs neutral) or for all stages of development. (D–E) Differential incidence of selection across development may be mediated by genetic architecture in terms of the pleiotropic effects of genetic changes and how that translates into the robustness of fitness-related traits. When fitness is disproportionately robust to changes to genes expressed at a given stage, then that stage will be more likely to accumulation cryptic genetic variation (CV) within species, divergence between species as developmental system drift (DSD), and to result in production of Dobzhansky-Muller incompatibilities (DMIs) in inter-species hybrid individuals.
Box 3—figure 1
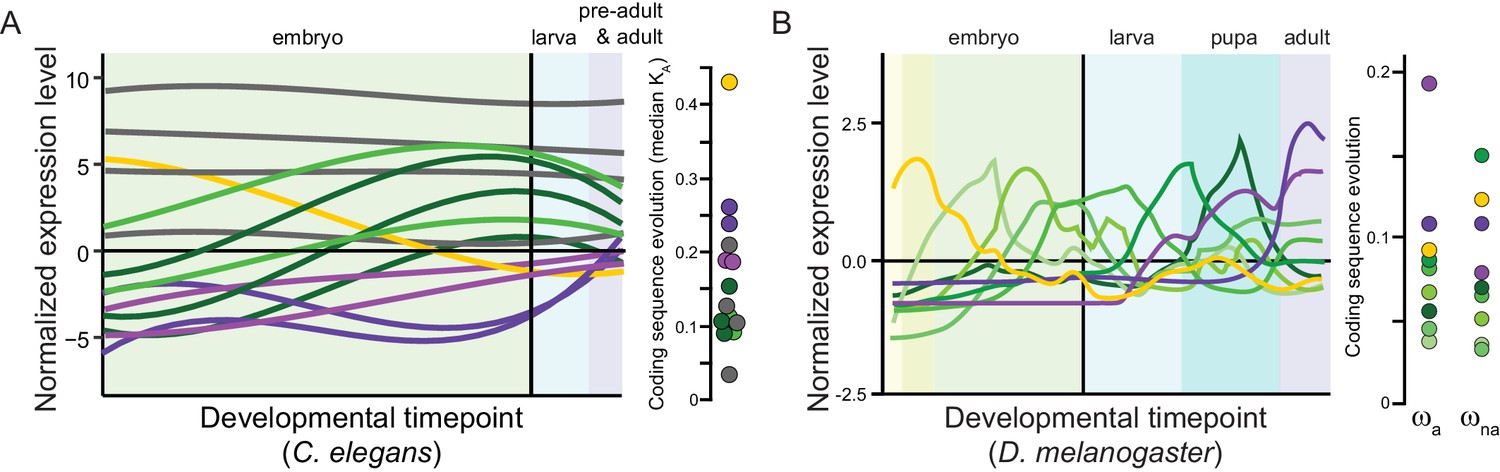
Panels (A) for C. elegans redrawn from Cutter et al., 2019 and (B) for Drosophila melanogaster from Coronado-Zamora et al., 2019 illustrate sets of genes with shared profiles of expression across development (non-linear timepoint scaling), and their rates of coding sequence evolution (D. melanogaster analysis excludes non-dynamic constitutive genes, gray for C. elegans; non-synonymous substitution rate KA, adaptive non-synonymous substitution rate ωa, non-adaptive non-synonymous substitution rate ωna).
Figure 2
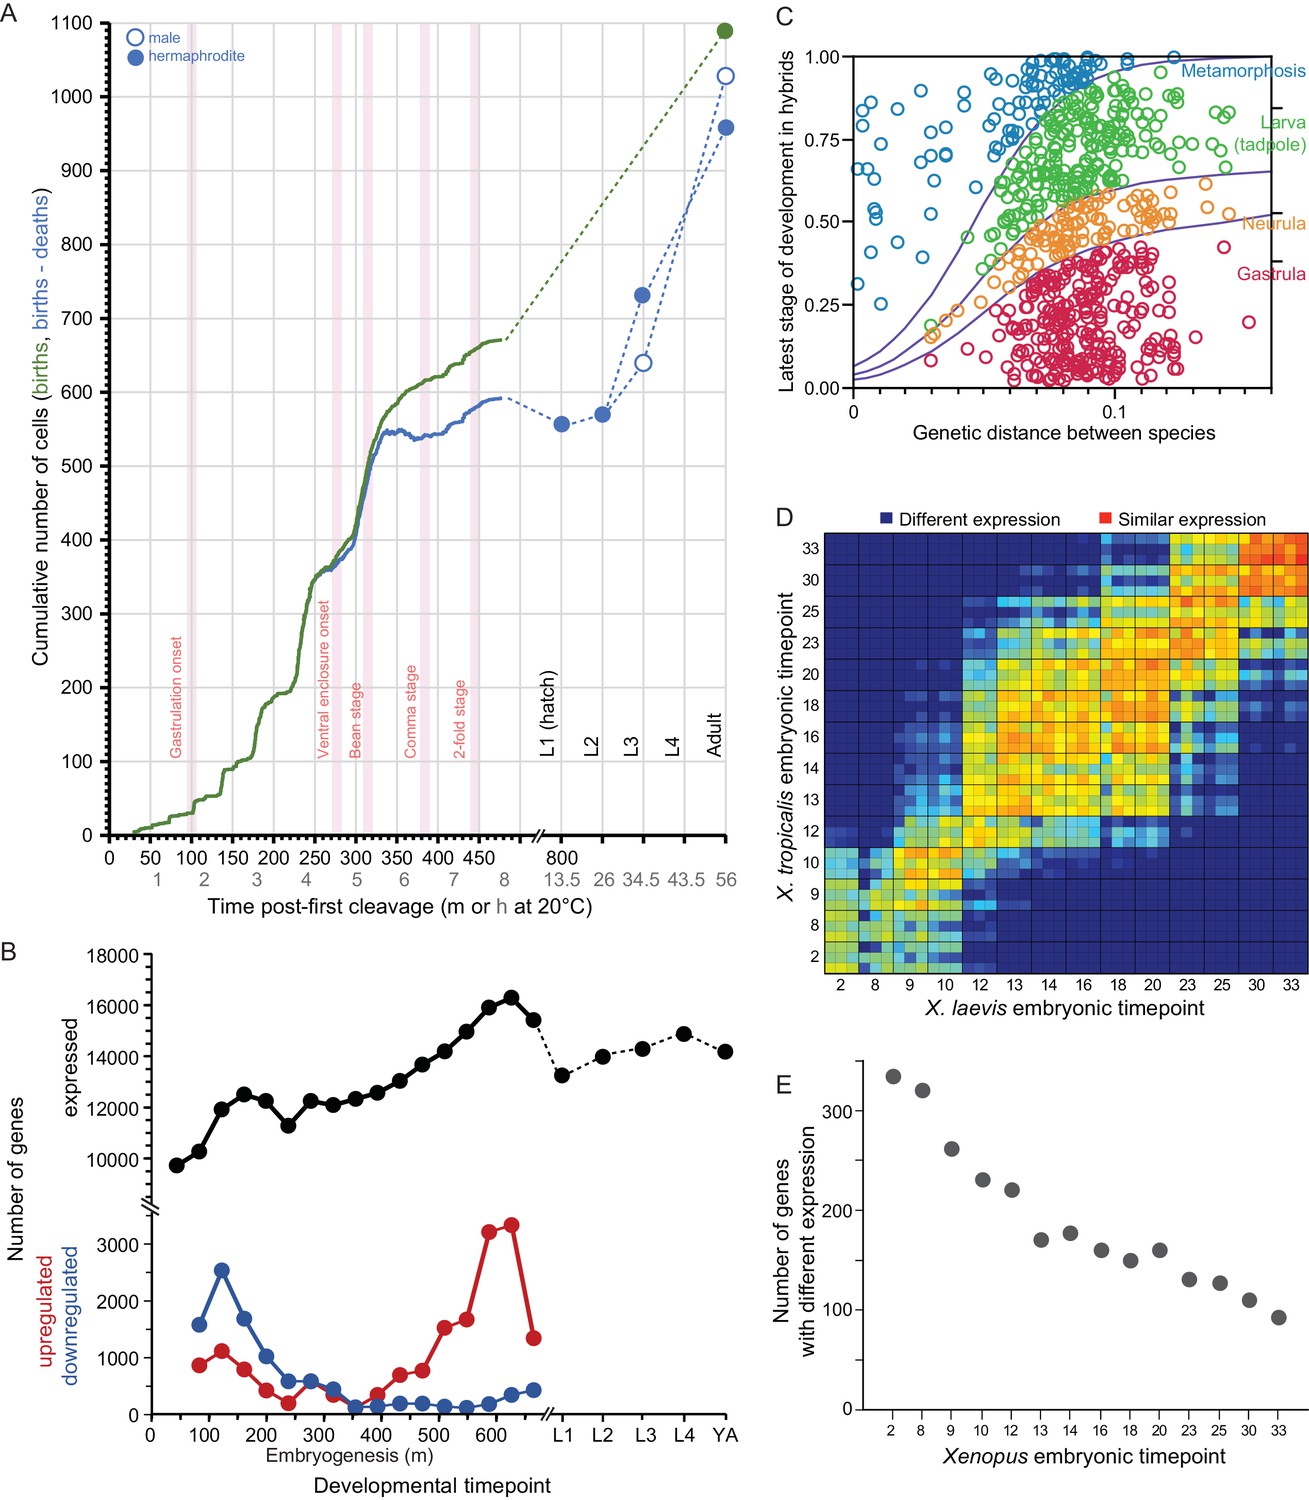
Developmental dynamics in C. elegans nematodes and in Bufo and Xenopus amphibians.
(A) C. elegans cell counts grow exponentially in early embryogenesis, before slowing later. Redrawn with data from Giurumescu et al., 2012 and wormatlas.org. (B) Gene expression changes dynamically over ontogeny in terms of number of genes expressed and the incidence of up- and down-regulated genes over time. Redrawn from Boeck et al., 2016. (C) Ontogenetic timing in the accumulation of reproductive isolation with genetic divergence for Bufo toads. Hybrid individuals between more closely-related species develop to later stages than do hybrids from distantly-related species pairs. Redrawn from Malone and Fontenot, 2008. (D–E) Xenopus gene expression level differentiation decreases over developmental time (yolk comprises ~½ of embryo volume; maternal-zygotic transition at stage ~8; yolk consumption begins around gastrulation). Redrawn from Yanai et al., 2011.
Tables
Table 1
Studies in the literature that characterize expression profiles across development (Supplementary file 1).
| Number of studies (%) | Number of species (%) | |||
|---|---|---|---|---|
| Developmental stage analyzed | ||||
| Embryogenesis only | 58 | 39.5% | 45 | 42.5% |
| Non-embryo stages | 37 | 25.2% | 17 | 16.0% |
| All ontogeny | 51 | 34.7% | 44 | 41.5% |
| Type of molecular time series data | ||||
| Transcriptome | 128 | 87.1% | 106 | 100.0% |
| Proteome | 7 | 4.8% | 5 | 4.7% |
| Other | 14 | 9.5% | 12 | 11.3% |
| Inter-species divergence feature | ||||
| Gene expression | 32 | 21.8% | 55 | 51.9% |
| DNA sequence | 5 | 3.4% | 14 | 13.2% |
| Non-comparative | 99 | 67.3% | 42 | 39.6% |
| Taxonomic group | ||||
| Angiosperm | 16 | 10.9% | ||
| Arthropoda | 26 | 17.7% | ||
| Chordata | 55 | 37.4% | ||
| Nematoda | 10 | 6.8% | ||
| Other group only | 30 | 20.4% | ||
| Multiple groups | 10 | 6.8% | ||
Additional files
-
Supplementary file 1
Summary of literature survey for studies analyzing ontogenetic profiles of transcriptome or proteome expression.
- https://cdn.elifesciences.org/articles/56276/elife-56276-supp1-v1.xlsx
Download links
A two-part list of links to download the article, or parts of the article, in various formats.
Downloads (link to download the article as PDF)
Open citations (links to open the citations from this article in various online reference manager services)
Cite this article (links to download the citations from this article in formats compatible with various reference manager tools)
Speciation and the developmental alarm clock
eLife 9:e56276.
https://doi.org/10.7554/eLife.56276


