Drosophila SWR1 and NuA4 complexes are defined by DOMINO isoforms
- Molecular Biology Division, Biomedical Center, Ludwig-Maximilians-University, Germany
- Bioinformatics Unit, Biomedical Center, Ludwig-Maximilians-University, Germany
- Department of Proteomics and Signal Transduction, Max Planck Institute of Biochemistry, Germany
- Wellcome Trust Centre for Cell Biology and Institute of Cell Biology, School of Biological Sciences, The University of Edinburgh, United Kingdom
Figures
Figure 1 with 1 supplement
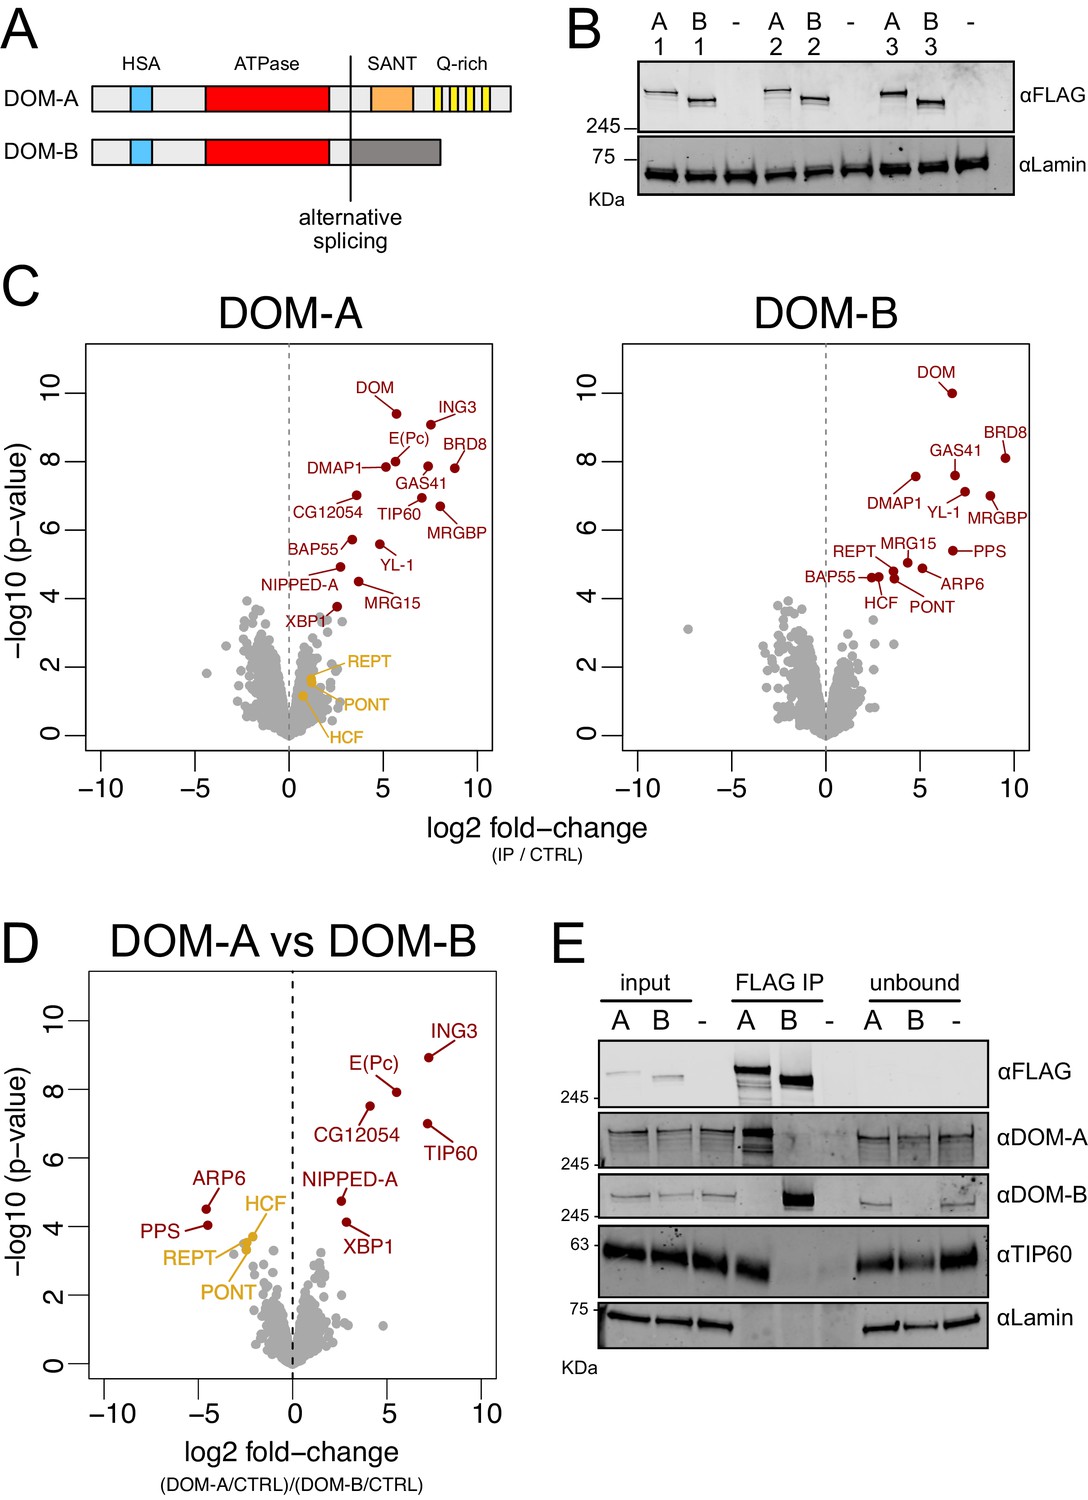
DOMINO isoform-specific affinity enrichment reveals distinct DOM-A and DOM-B complexes.
(A) Schematic representation of the DOM-A (dom-RA) and DOM-B (dom-RE) isoforms. The two proteins are derived through alternative splicing and differ in their C-termini. (B) Western blot showing the expression of 3XFLAG-tagged DOM-A and DOM-B in nuclear fractions derived from three different clonal S2 cell lines (A = DOM A, B = DOM B). Endogenously tagged proteins were detected using αFLAG antibodies. Nuclear extract from S2 cells lacking the tag (-) serves as negative control. Lamin: loading control. (C) Volcano plot showing -log10 p-value in relation to average log2 fold-change (n = 3 biological replicates) comparing FLAG AP-MS from 3XFLAG DOM-A or DOM-B cell lines (IP) versus ‘mock’ purifications from untagged S2 cells (CTRL). Red dots represent enriched proteins with FDR < 0.05 and log2 fold-change >0. Orange dots represent proteins significantly enriched in DOM-B AP-MS but not considered as DOM-B specific interactors. (D) Volcano plot as described in (C) comparing DOM-A FLAG AP-MS (DOM-A/CTRL) and DOM-B FLAG AP-MS (DOM-B/CTRL). Positive log2 fold-change indicate enrichment in DOM-A pulldown, while negative log2 fold-change indicate enrichment in DOM-B pulldown. Red dots represent isoform-specific enriched proteins with FDR < 0.05. Orange dots represent proteins enriched in DOM-B AP-MS but not considered as DOM-B specific interactors, due to lower statistical significance (FDR > 0.05). (E) Western blot validating the mass-spectrometry results. DOM-A clone #2 and DOM-B clone #1 cells were used. Untagged cells (-) serve as negative control. 2% of input and unbound fractions was loaded. Proteins were detected using the antibodies described in the panel.
Figure 1—figure supplement 1
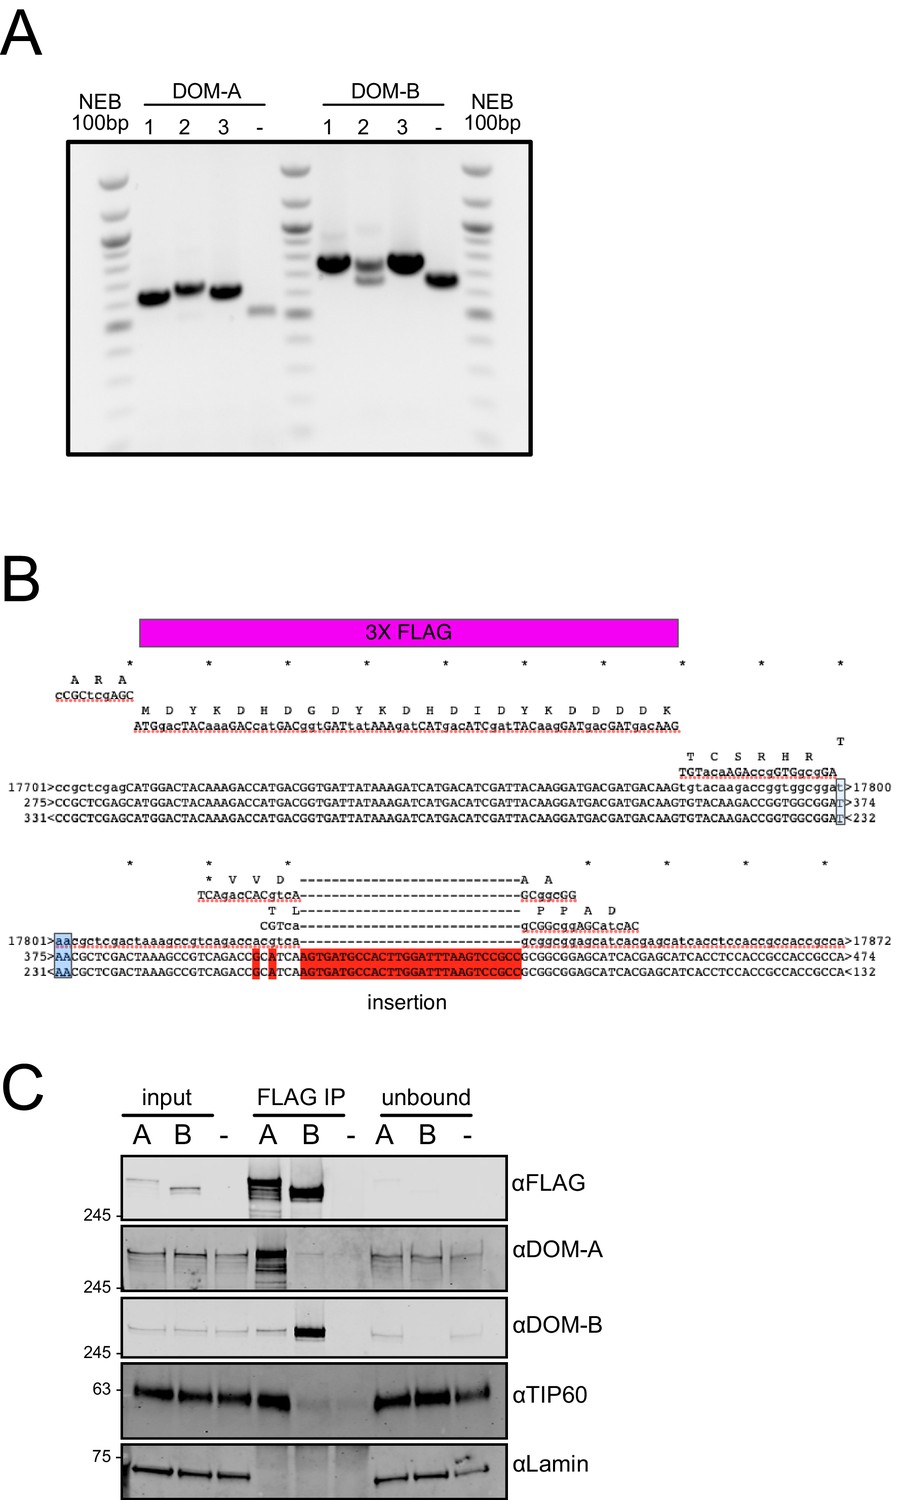
DOMINO isoform-specific affinity enrichment reveals distinct DOM-A and DOM-B complexes.
(A) Agarose gel analysis of CRISPR clones.The insertion of a 3XFLAG tag results in a PCR product 72 bp longer than in the untagged cells (-). The presence of two bands indicates heterozygosity. NEB 100 bp ladder servers a size marker. (B) Alignment results from Sanger sequencing of the genomic region encoding the C-terminus of DOM-A clone #2. The product was analyzed using 2 different sequencing primers. The insertion of the 3X FLAG tag is highlighted in purple. The additional insertion is highlighted in red. Stop codon is colored in light-blue. (C) Replicate western blot validating the mass-spectrometry results. DOM-A clone #1 and DOM-B clone #3 cells were used. 2% of input and unbound fractions was loaded. Untagged cells (-) serve as negative control. Proteins were detected using the antibodies described in the panel.
Figure 2 with 1 supplement
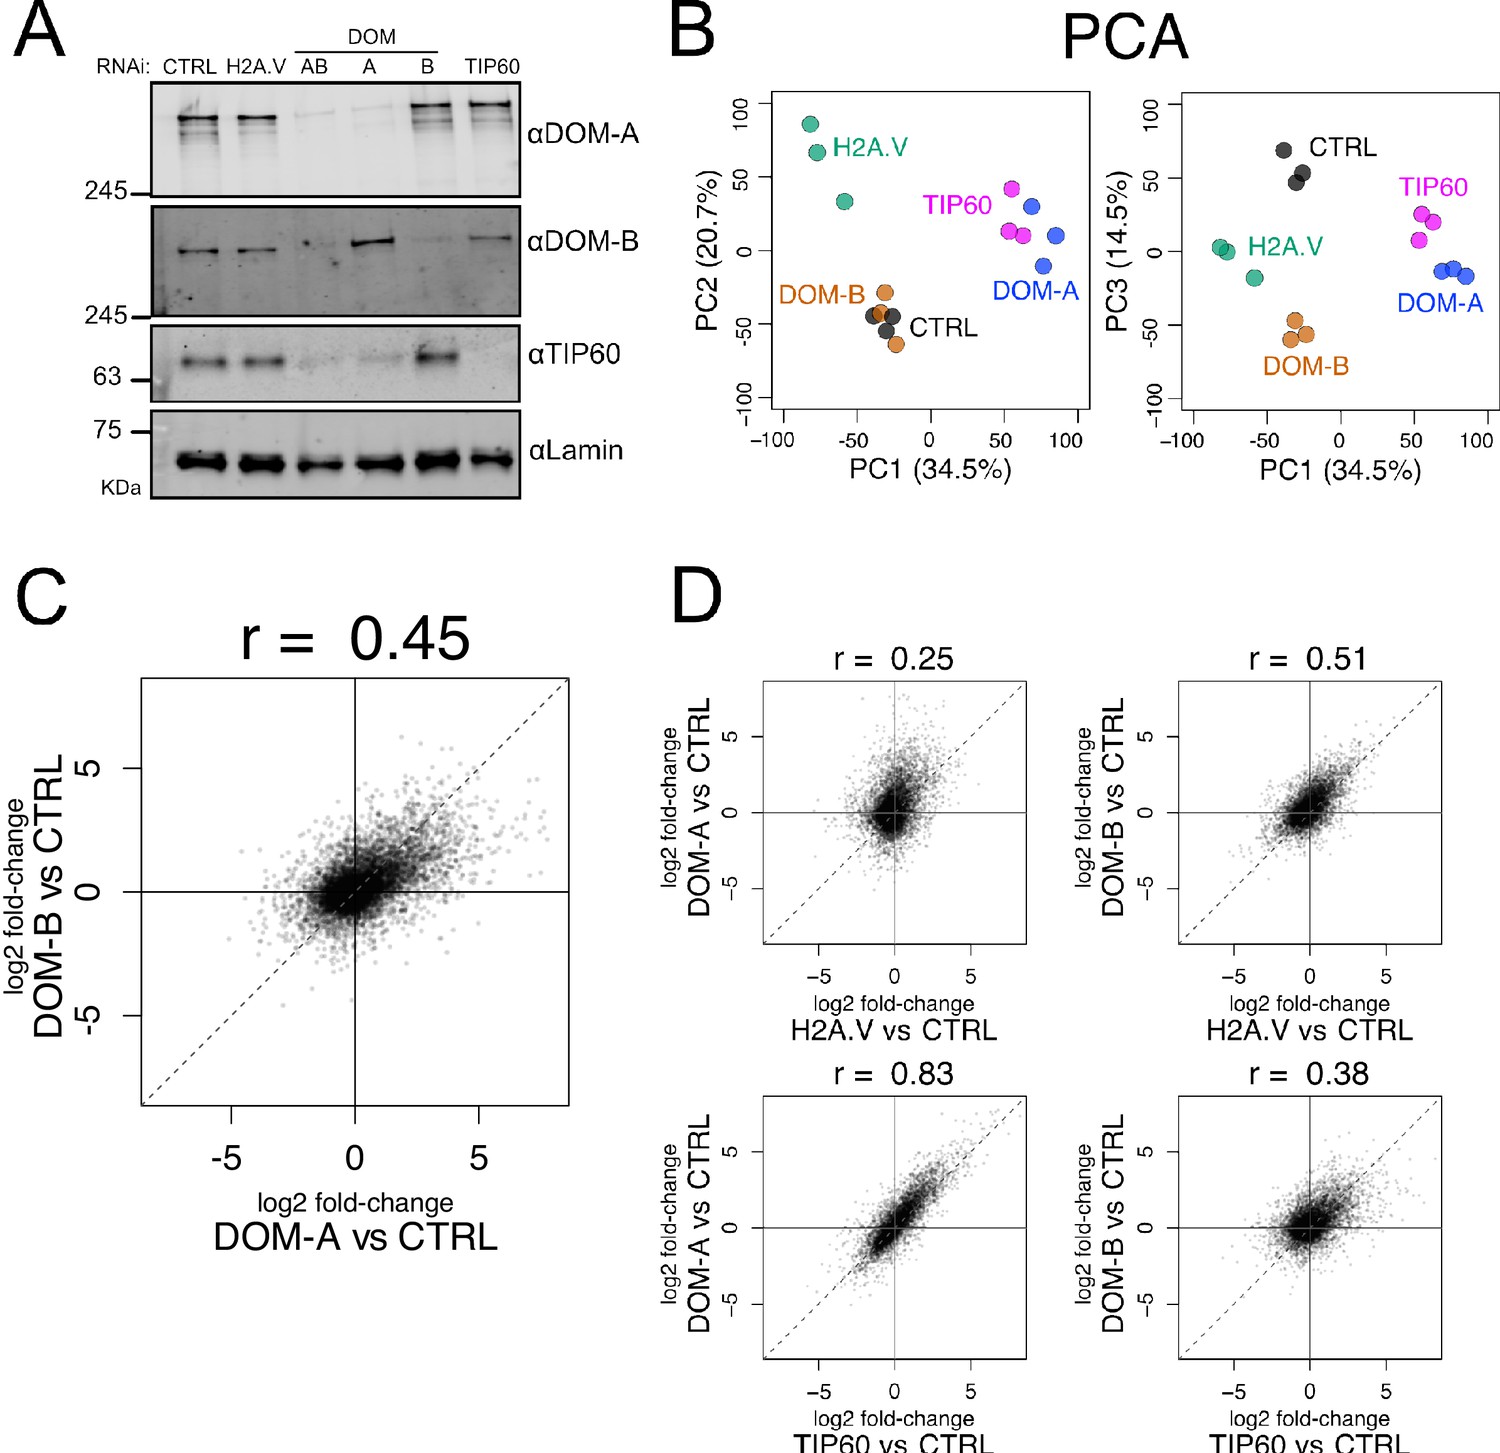
Isoform-specific depletion of DOM-A and DOM-B causes distinct transcriptional effects.
(A) Western blot showing the expression of DOM-A, DOM-B and TIP60 in nuclear extracts of Kc167 cells treated with dsRNA against GST (CTRL), H2A.V, both DOM isoforms (AB), DOM-A (A), DOM-B (B) and TIP60. Proteins were detected with specific antibodies. Lamin: loading control. (B) Principal Component Analysis (PCA) comparing transcriptome profiles derived from Kc167 cells treated with dsRNA against GST or GFP (CTRL), H2A.V, DOM-A, DOM-B and TIP60 (n = 3 biological replicates). Three components (PC1, PC2 and PC3) are shown. Percentage of variance is indicated in parenthesis. (C) Scatter plot comparing log2 fold-changes in expression of DOM-A against CTRL RNAi and log2 fold-changes in expression of DOM-B against CTRL RNAi for every gene analyzed (N = 10250). Spearman’s correlation coefficient (r) is shown above the plot. (D) Same as (C) but depicting the comparison between DOM-A or DOM-B RNAi and H2A.V or TIP60 RNAi.
Figure 2—figure supplement 1
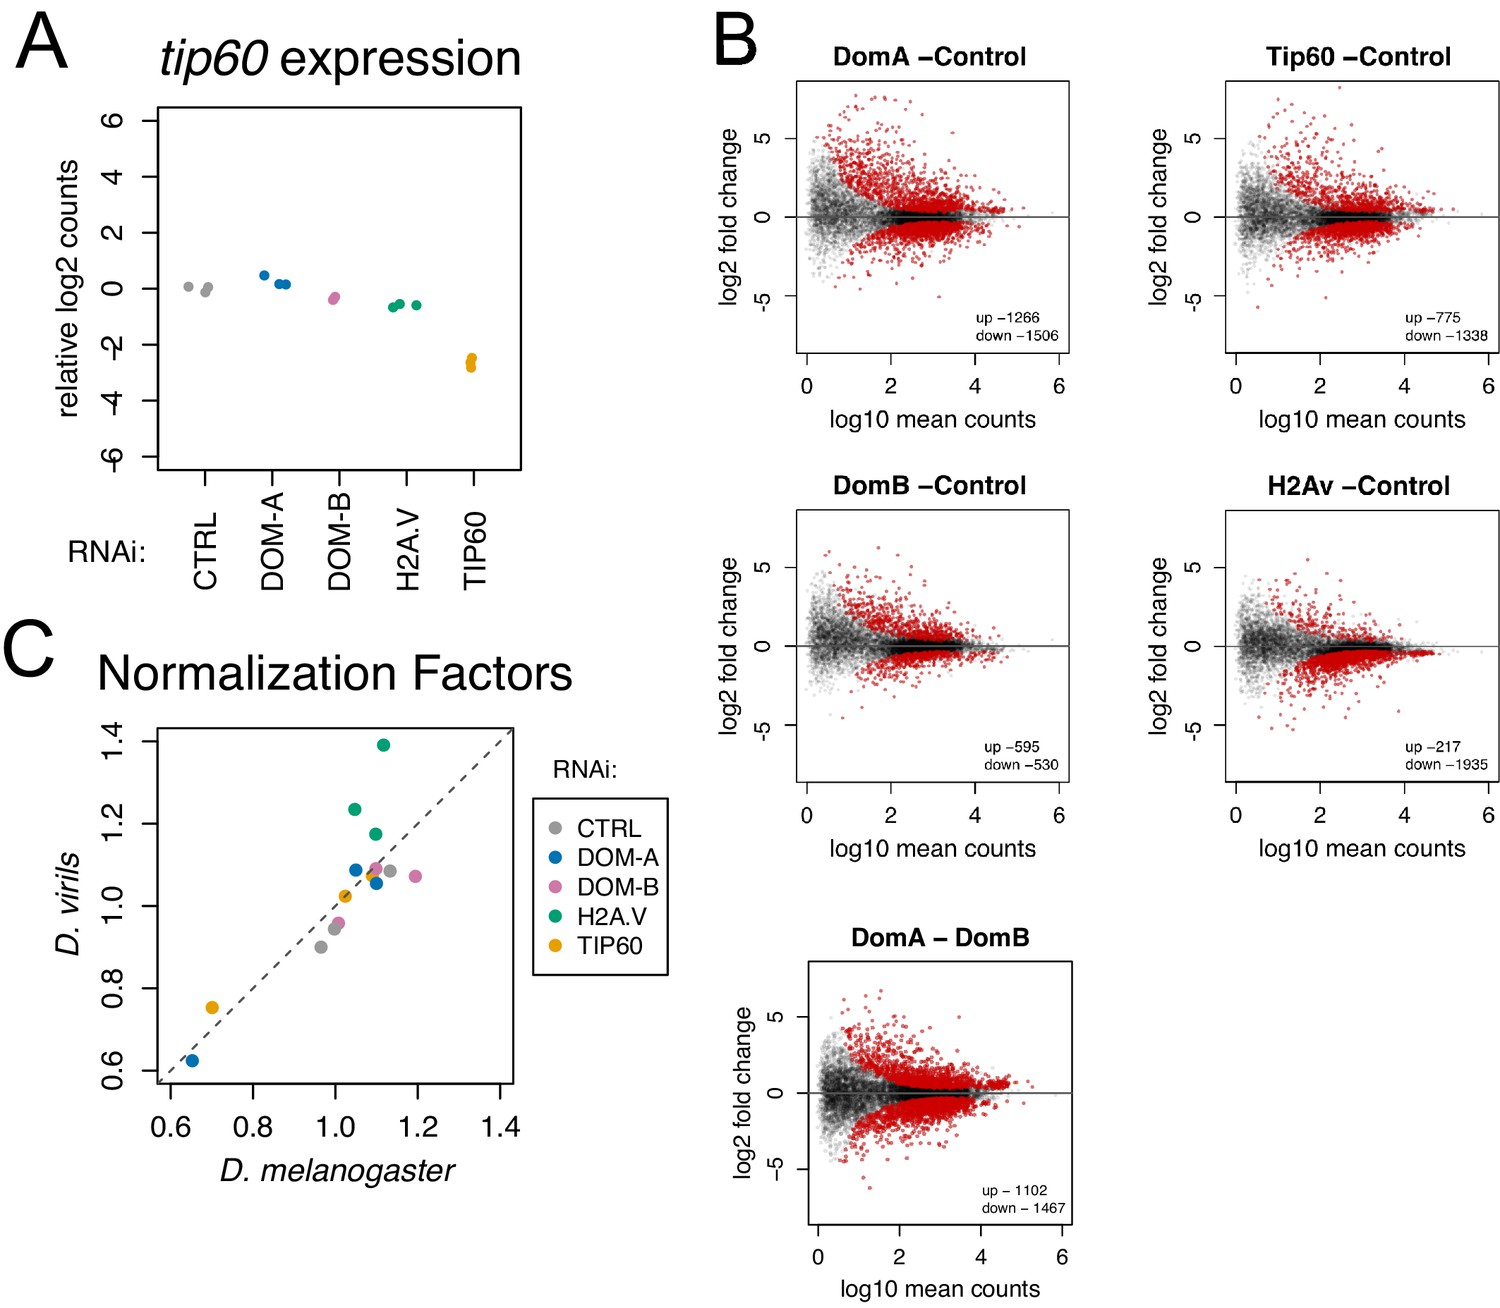
Isoform-specific depletion of DOM-A and DOM-B causes distinct transcriptional effects.
(A) Plot showing relative log2-expression of tip60 mRNA as measured by RNAseq upon knock-down of protein indicated on the x-axis and by color-coding. The values of 3 biological replicates are shown in the plot. (B) Differential gene expression analysis on coding genes from RNA-seq data. Scatter plots represent log2 fold-change of knock-down indicated in the plot title over CTRL knock-down for each gene (N = 10250) in relation to its mean expression (log10 mean counts). Red dots represent significant (adjusted p-value<0.01) up- or down- regulated genes. Last panel shows differentially expressed genes between DOM-A and DOM-B knock-down. (C) Scatter plot comparing normalization factors used to scale transcriptomes calculated either from the D. melanogaster or the D. virils (spike-in) genome. A deviation from the diagonal line indicates global upregulation (lower D. virils scale factor) or downregulation (higher D. virils scale factor) of transcription. The values of the 3 biological replicates are shown in the plot. Samples from the different knock-downs are color-coded.
Figure 3 with 1 supplement
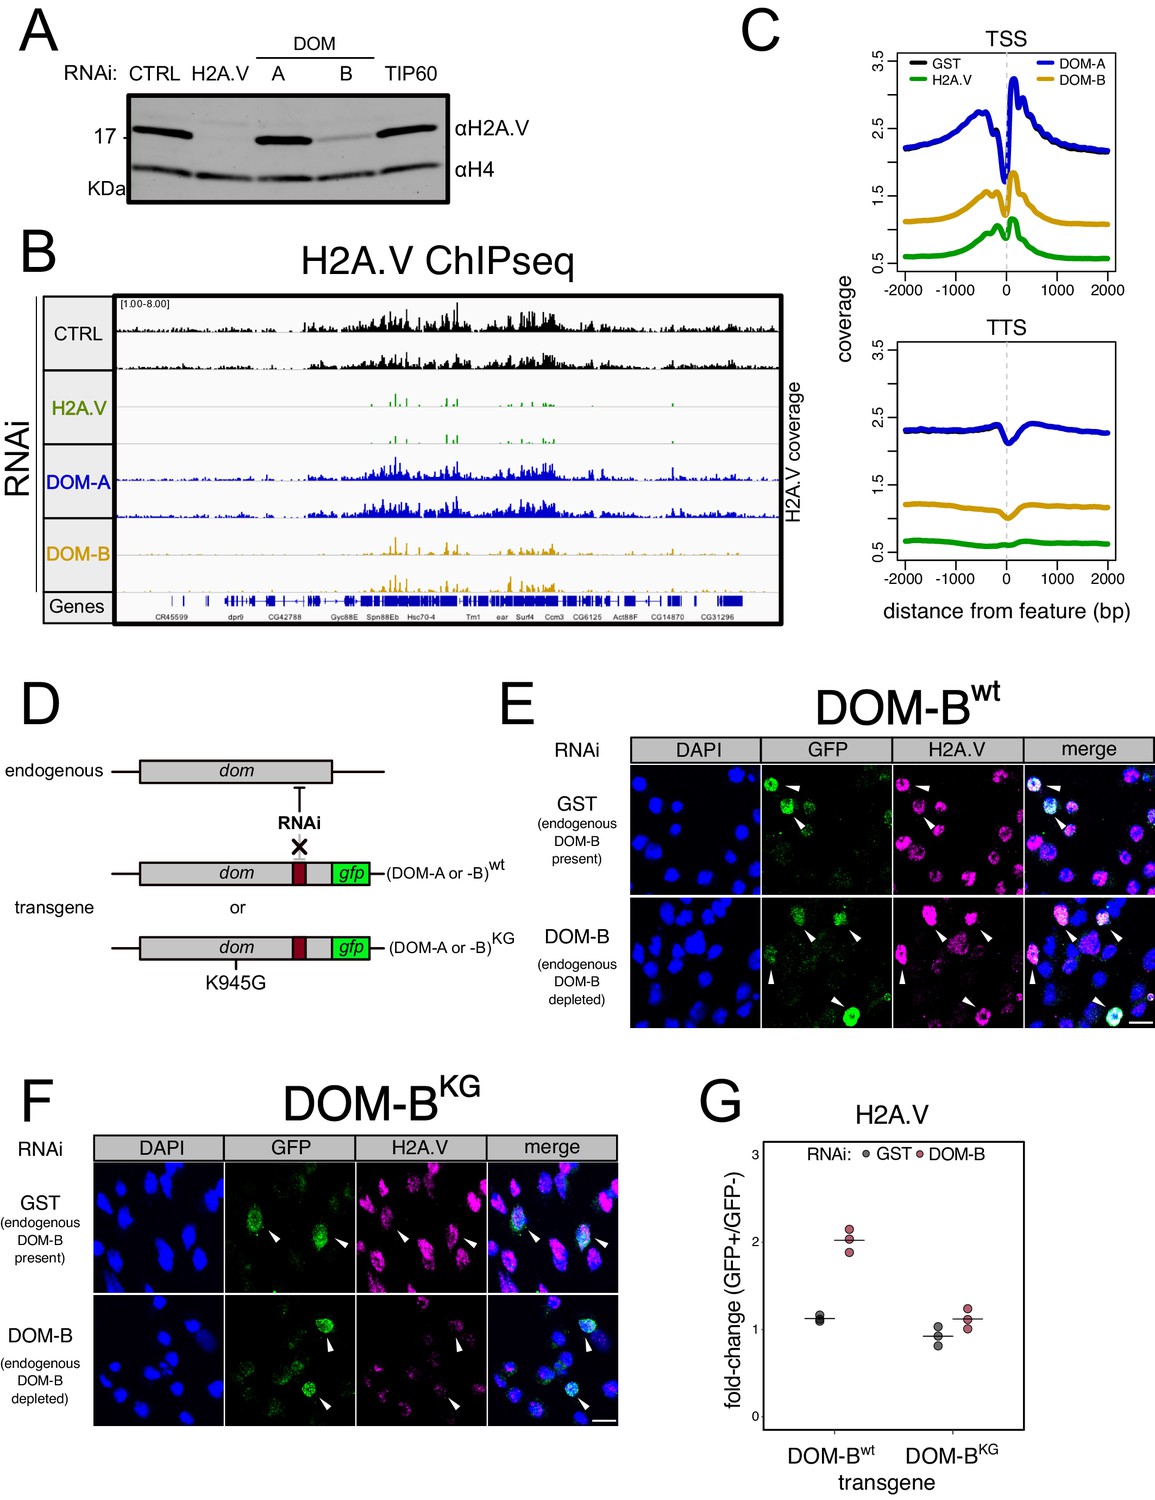
DOM-B is responsible for H2A.V incorporation into chromatin in an ATP-dependent manner.
(A) Western blot showing the expression of H2A.V in nuclear extracts derived from Kc167 cells treated with dsRNA against GST (CTRL), H2A.V, DOM-A (A), DOM-B (B) and TIP60. Histone H4 (H4): loading control. (B) Screenshot of genome browser illustrating a region on Chromosome 3R. Each track shows the spike-in and input normalized H2A.V ChIPseq signal derived from Kc167 cells treated with dsRNA as in (A). Two biological replicates are shown. (C) Composite plot showing spike-in and input normalized H2A.V coverage around Transcription Start Sites (TSS) and Transcription Termination Sites (TSS) (N = 10139). Each represent the average coverage (n = 2 biological replicates) of H2A.V in Kc167 cells treated with dsRNA as described in (A). (D) Schematic representation of the experimental setup to test the requirement for ATPase activity of DOM (A or B) for functionality. A transgene encoding a GFP-tagged wild type or mutant (K945G) DOM is codon-optimized to be resistant to specific dsRNA targeting. The transgene is transfected into Kc167 cells while the endogenous DOM (A or B) are depleted by RNAi. (E) Representative immunofluorescence pictures for the DOM-B complementation assay. Cells were treated either with control (GST) dsRNA (endogenous DOM-B present) or with a dsRNA targeting only the endogenous DOM-B (endogenous DOM-B depleted). Cells were transfected with a wild-type transgene encoding RNAi-resistant DOM-B. Cells were stained with DAPI and with GFP and H2A.V antibodies. Arrows indicate the cells where the transgene is expressed and nuclear. Scale bar: 10 μm F Same as (E) but cells were transfected with a mutant DOM-B (K945G) (G) Dot plot showing the quantification of the immunofluorescence-based complementation assay. Each dot represents the fold-change of mean H2A.V signal between GFP-positive (in which the transgene is expressed) and GFP-negative cells in one biological replicate (>100 total cells/replicate). Cells were treated with dsRNAs as in (E) Wild-type or mutant DOM-B transgenes are compared.
Figure 3—figure supplement 1
DOM-B is responsible for H2A.V incorporation into chromatin in an ATP-dependent manner.
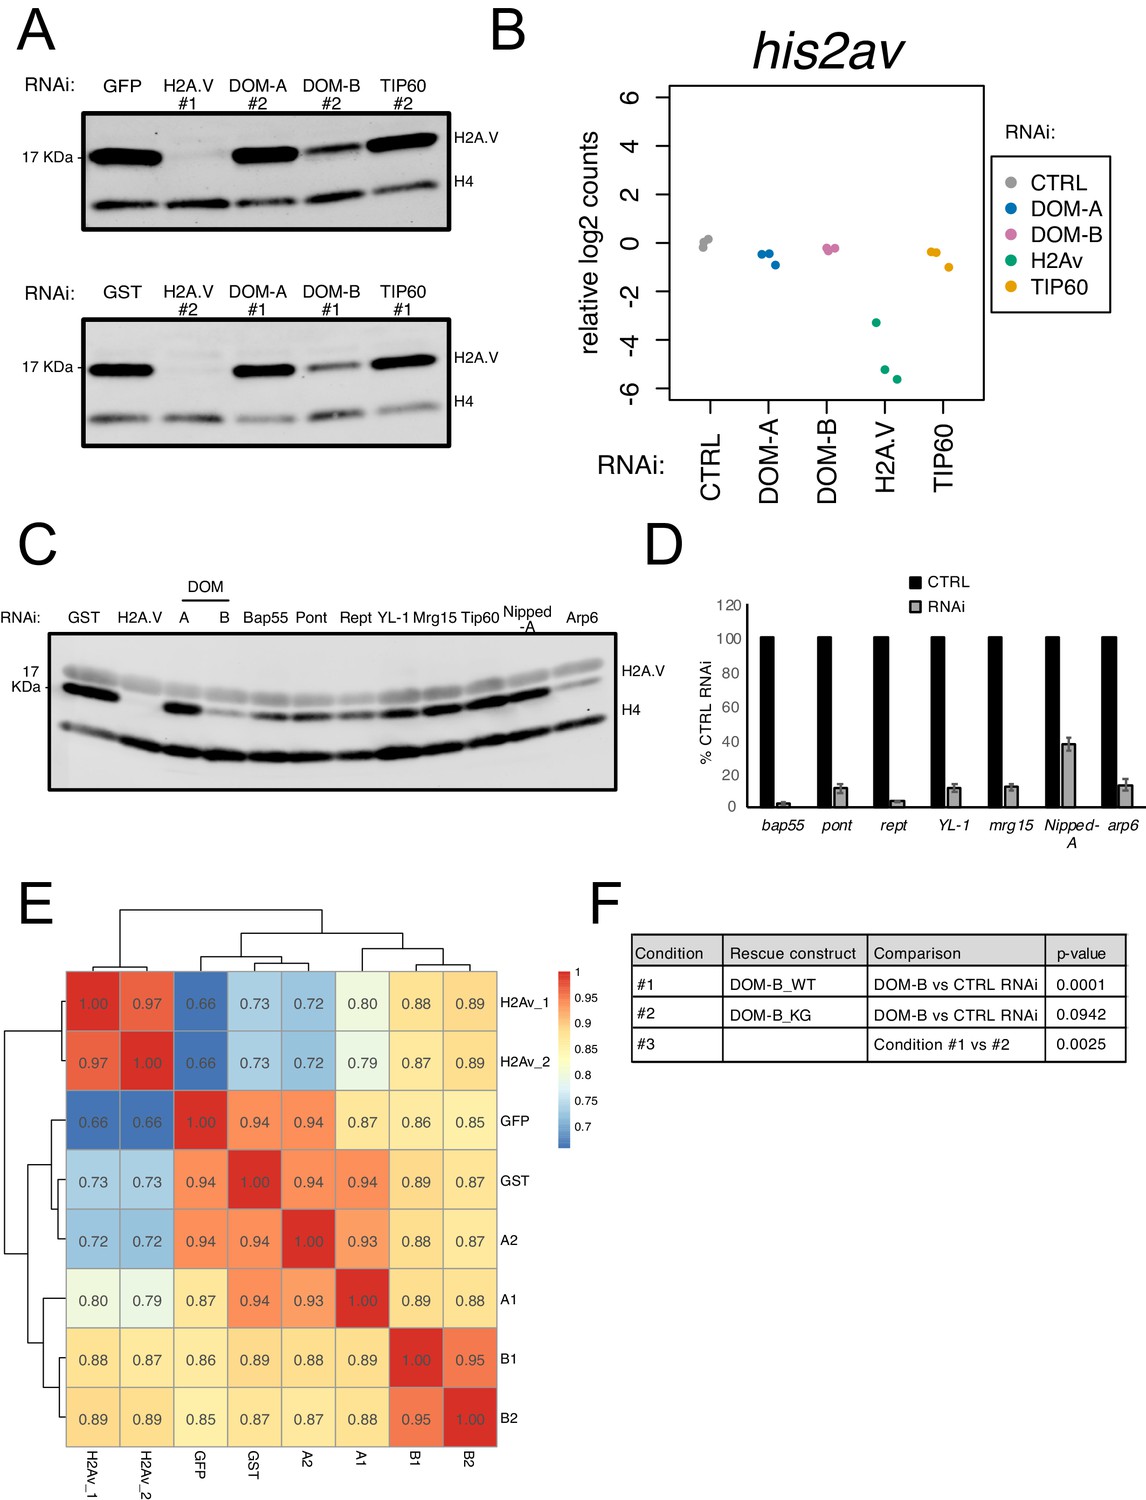
(A) Replicate western blot showing the expression of H2A.V in nuclear fractions derived from cells treated with dsRNA against GST/GFP, H2A.V, DOM-A, DOM-B and TIP60. Numbers indicate the dsRNA construct used (#1 or #2). Histone H4 (H4): loading control. (B) Plot showing relative log2-expression of his2av mRNA as measured by RNAseq upon knock-down of protein indicated on the x-axis and by color-coding. The values of 3 biological replicates are shown in the plot. (C) Western blot showing the expression of H2A.V in nuclear fractions derived from cells treated with dsRNA against some of the DOM interactors identified by mass-spectrometry (common between DOM-A and DOM-B or specific for one or the other isoform). Histone H4 (H4) serves as loading control. (D) Barplot showing % mRNA expression (normalized to CTRL RNAi) assessed by RT-qPCR for the DOM subunits targeted by RNAi as in (B). Error bars represent SEM (n = 3 biological replicates) E. Heatmap showing Spearman’s correlation coefficients between replicates and dsRNA treatments calculated for H2A.V ChIPseq normalized coverage signal around the Transcription Start Site (TSS) (±2000 bp) (N = 10139). Clustering is based on Euclidean distance. Individual biological replicates are shown. (F) Table listing calculated p-values (linear regression) for the comparisons depicted in Figure 3G.
Figure 4 with 1 supplement

The DOM-A.C acetylates H4K12.
(A) Heatmap shows scaled acetylation levels for various histone H4 residues (measured by mass-spectrometry) in Kc167 cells treated with dsRNA against GST or GFP (CTRL), H2A.V, DOM-A (A), DOM-B (B) and TIP60. Individual biological replicates are shown. Rows and columns are clustered based on Euclidean distance. (B) Screenshot of genome browser illustrating a region on Chromosome 3R. Each track shows spike-in and input normalized H4K12ac ChIPseq signal derived from Kc167 cells treated with dsRNA against GST or GFP (CTRL), TIP60, DOM-A, DOM-B and H2A.V. 3 biological replicates are shown for all RNAi except H2A.V (2 biological replicates). (C) Composite plot showing spike-in and input normalized H4K12ac coverage around Transcription Start Sites (TSS) and Transcription Termination Sites (TSS) (N = 10139). Each represent the average coverage (n = 2 biological replicates for H2A.V RNAi, n = 3 biological replicates for all the other knock-down) of H4K12ac in Kc167 cells treated with dsRNA as described in (A). (D) Representative immunofluorescence pictures for the DOM-A complementation assay. Cells were treated either with control (GST) dsRNA (endogenous DOM-A present) or with a dsRNA targeting the endogenous DOM-A (endogenous DOM-A depleted). In the top panel, cells were transfected with a wild-type transgene encoding for DOM-A. In the bottom panel, cells were transfected with a mutant (K945G) DOM-A transgene. Cells were stained with DAPI, and with GFP and H4K12ac antibodies. Arrows indicate the cells where the transgene is expressed and nuclear. Scale bar: 10 µm (E) Dot plot showing the quantification of the immunofluorescence-based complementation assay. Each dot represents the fold-change of mean H4K12ac signal between GFP-positive (in which the transgene is expressed) and GFP-negative cells in one biological replicate (>100 total cells/replicate). Cells were treated with dsRNAs as in (E) Wild-type or mutant DOM-A transgenes are compared. (F) Model for SWR1.C and NuA4.C specification in S. cerevisiae, D. melanogaster and H. sapiens.
Figure 4—figure supplement 1
The DOM-A.C acetylates H4K12.
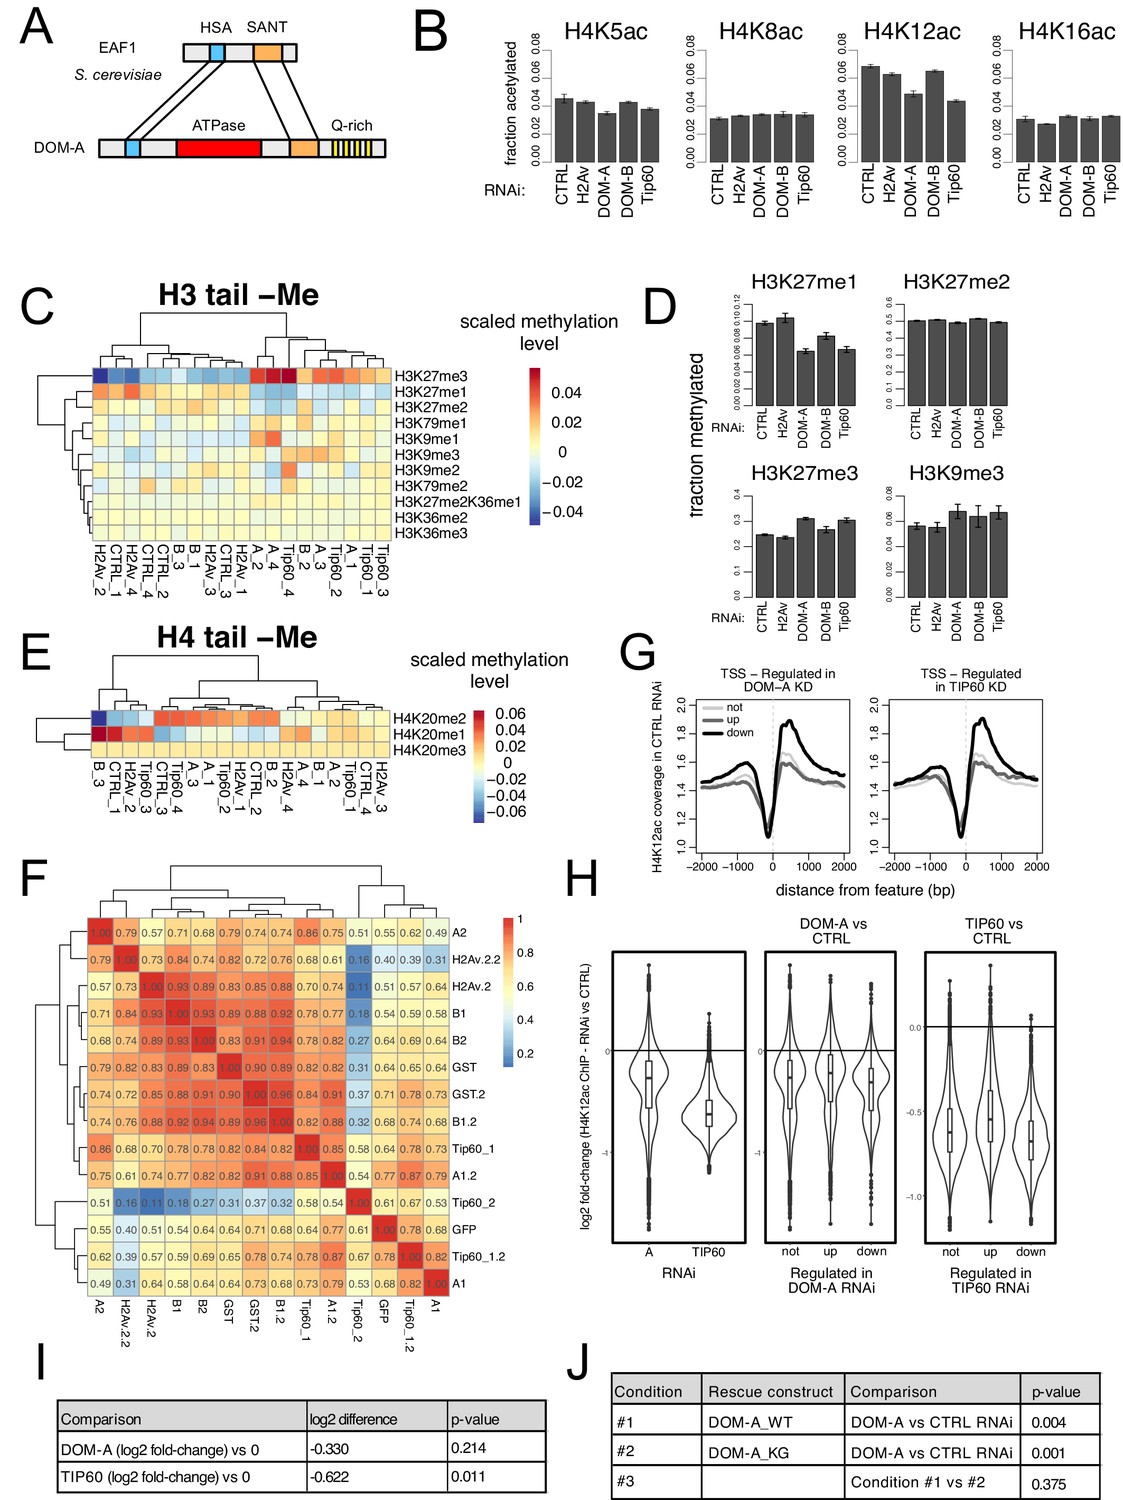
(A) Schematic comparison of S. cerevisiae EAF1 and D. melanogaster DOM-A. Conserved domain structure is highlighted, (B) Barplot showing the average fraction of acetylated peptide (over non-acetylated) (n = 3 for B, n = 4 for all the others) for 4 residues in histone H4 tail (K5, K8, K12, K16) upon knock-down of the proteins indicated on the x-axis. Error bars represent SEM. (C) Heatmap shows scaled methylation levels for various histone H3 residues (measured by mass-spectrometry) in cells treated with dsRNA against GST or GFP (CTRL), H2A.V, DOM-A (A), DOM-B (B) and TIP60. Individual biological replicates are shown. Rows and columns are clustered based on Euclidean distance. (D) Barplot showing the average fraction of methylated peptide (over non-methylated) (n = 3 for B, n = 4 for all the others) for H3K27 upon knock-down of the proteins indicated on the x-axis. Error bars represent SEM. (E) Same as (C) but showing scaled methylation levels for histone H4K20 residue (F) Heatmap showing spearman’s correlation coefficients between replicates and dsRNA treatments calculated for H4K12ac ChIPseq normalized coverage signal around the Transcription Start Site (TSS) (±2000 bp) (N = 10139). Clustering is based on Euclidean distance. Individual biological replicates are shown. (G) Composite plot showing spike-in and input normalized H4K12ac coverage around Transcription Start Sites (TSS) for genes not-regulated (not), up-regulated (up), downregulated (down) in the knock-down of DOM-A (left panel) or TIP60 (right panel) (N provided in Figure 2—figure supplement 1; Figure 2—figure supplement 1B). Each line represents the average coverage (n = 3 biological replicates) of H4K12ac in Kc167 cells treated with dsRNA against GST/GFP. (H) Violin-boxplot showing log2 fold-change in H4K12ac signal (averaged across a 4000 bp window around the TSS) between DOM-A or TIP60 and control RNAi. log2 fold-changes were calculated for the following pairs (A1 or Tip60_1 vs GST; A1.2 or Tip60_1.2 vs GST.2; A2 or Tip60_2 vs GFP). In the left panel, all genes measured by RNAseq are considered (N = 10139). In the central and right panels, genes are divided in not-, up- and down-regulated classes as in (G). (I) Table listing calculated p-values (one-sample t-test, two sided) for the differences shown in the left panel of (H). n = 3 biological replicates are considered. Each replicate is a single value representing the median of log2 fold-change [calculated as in H] across all genes analyzed. (J) Table listing calculated p-values (linear regression) for the comparisons depicted in Figure 4E.
Tables
Key resources table
| Reagent type (species) or resource | Designation | Source or reference | Identifiers | Additional information |
|---|---|---|---|---|
| Cell line (D. melanogaster) | Kc167 | DGRC | FLYB;FBtc0000001 | |
| Cell line (D. melanogaster) | S2 (Clone L2-4) | Villa et al., 2016 | Gift from P Heun lab | |
| Cell line (D. virilis) | 79f7Dv3 | Albig et al., 2019 | Gift from BV Adrianov | |
| Antibody | DOM-A (17F4) (rat monoclonal) | Börner and Becker, 2016 and this publication | 1:5 (WB) | |
| Antibody | DOM-A (SA-8977) (rabbit polyclonal) | This publication | 1:1000 (WB) | |
| Antibody | DOM-B (SA-8979) (rabbit polyclonal) | This publication | 1:1000 (WB) | |
| Antibody | TIP60 (11B10) (rat monoclonal) | This publication | 1:20 (WB) | |
| Antibody | H2A.V (Rb-H2Av) (rabbit polyclonal) | Börner and Becker, 2016 | 1:1000 (WB) 1:2500 (IF) 25 μl/IP (ChIP) | |
| Antibody | H4 (rabbit polyclonal) | abcam | ab10158 | 1:5000 (WB) |
| Antibody | H4K12ac (rabbit polyclonal) | Merck-Millipore | 07–595 | 1:2500 (IF) 2 μl/IP (ChIP) |
| Antibody | FLAG-m2 (mouse monoclonal) | Sigma-Aldrich | F3165 | 1:1000 (WB) |
| Antibody | GFP (mouse monoclonal) | Roche | 11814460001 | 1:500 (IF) |
| Antibody | Lamin (mouse monoclonal) | Gift from H Saumweber | 1:1000 (WB) | |
| Recombinant DNA reagent | pENTR3C (plasmid) | Thermo Fischer Scientific | A10464 | |
| Recombinant DNA reagent | pHWG (plasmid) | DGRC | Kind gift from P Korber |
Additional files
-
Source code 1
R script for analysis of AP-MS data.
- https://cdn.elifesciences.org/articles/56325/elife-56325-code1-v1.r
-
Source code 2
Java script for quantification of immunofluorescence pictures.
- https://cdn.elifesciences.org/articles/56325/elife-56325-code2-v1.ijm
-
Source code 3
R script for quantification of acetylated peptides.
- https://cdn.elifesciences.org/articles/56325/elife-56325-code3-v1.r
-
Source code 4
R script for analysis of acetylated peptides.
- https://cdn.elifesciences.org/articles/56325/elife-56325-code4-v1.r
-
Supplementary file 1
Excel spreadsheet containing imputed LFQ values obtained from the MaxLFQ algorithm, limma output and DOM-A or DOM-B specific interactors.
- https://cdn.elifesciences.org/articles/56325/elife-56325-supp1-v1.xlsx
-
Supplementary file 2
Excel spreadsheet containing result tables from DEseq2 analysis.
- https://cdn.elifesciences.org/articles/56325/elife-56325-supp2-v1.xlsx
-
Supplementary file 3
Comparison of the known subunits of SWR1- and NuA4-type complexes between D. melanogaster, S. cerevisiae and H. sapiens.
Subunit composition of the yeast SWR1 and NuA4 were obtained from the manually-curated SGD database (https://www.yeastgenome.org) (CPX-2122 and CPX3155). For the human complexes, we refer to the EP400 complex subunits described in Dalvai et al., 2015 and to the SRCAP subunits described in Feng et al., 2018.
- https://cdn.elifesciences.org/articles/56325/elife-56325-supp3-v1.docx
-
Supplementary file 4
gRNAs, repair templates and primers used in this study.
- https://cdn.elifesciences.org/articles/56325/elife-56325-supp4-v1.xlsx
-
Supplementary file 5
Excel spreadsheet containing raw output from Skyline analysis and results from quantification of acetylated peptides.
- https://cdn.elifesciences.org/articles/56325/elife-56325-supp5-v1.xlsx
-
Transparent reporting form
- https://cdn.elifesciences.org/articles/56325/elife-56325-transrepform-v1.docx
Download links
A two-part list of links to download the article, or parts of the article, in various formats.
Downloads (link to download the article as PDF)
Open citations (links to open the citations from this article in various online reference manager services)
Cite this article (links to download the citations from this article in formats compatible with various reference manager tools)
Drosophila SWR1 and NuA4 complexes are defined by DOMINO isoforms
eLife 9:e56325.
https://doi.org/10.7554/eLife.56325


