FRET kinase sensor development reveals SnRK2/OST1 activation by ABA but not by MeJA and high CO2 during stomatal closure
- Cell and Developmental Biology Section, Division of Biological Sciences, University of California, San Diego, United States
- Institute of Technology, University of Tartu, Estonia
- Horticulture Department, University of Wisconsin-Madison, United States
Figures
Figure 1 with 1 supplement
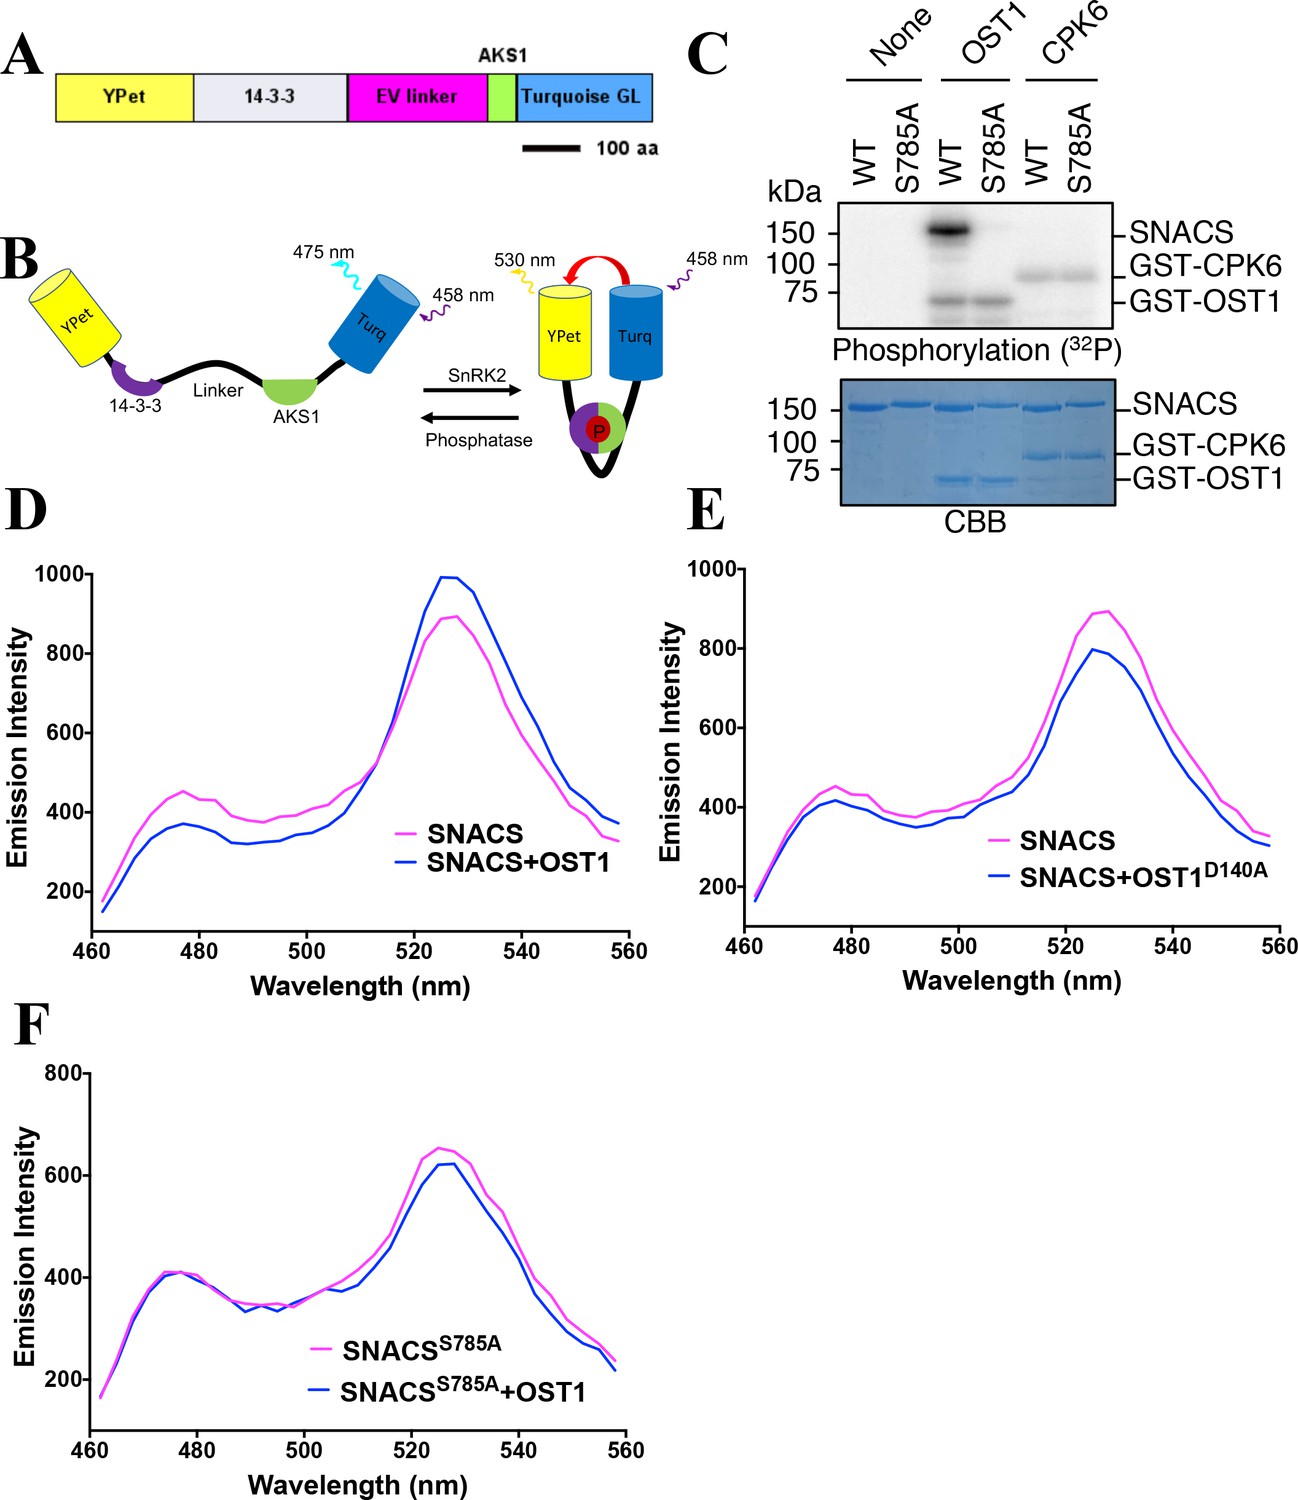
Structure and in vitro testing of SnRK2 protein kinase reporter, SNACS, and SnRK2 protein kinase activity.
(A) Domain structure of the SNACS protein: YPet and Turquoise GL are yellow and cyan fluorescent proteins. The full coding region of the phosphoserine/threonine binding 14-3-3 GF14phi protein (At1g35160) was inserted, EV linker is a 244 amino acid length flexible linker domain, and AKS1 is a 48-amino-acid segment of the Arabidopsis AKS1 transcription factor protein. aa, amino acid. (B) Simplified model of SNACS reporter function. Phosphorylation of the sensor within the AKS1 domain is predicted to produce a conformational shift that increases Förster resonance energy transfer (FRET) efficiency due to the enhanced affinity of the 14-3-3 domain for the phosphorylated form of the substrate domain. (C) In vitro phosphorylation assay. SNACS (WT) and SNACSS785A (S785A) were incubated in the presence or absence of GST-OST1/SnRK2.6 protein kinase or GST-CPK6. Proteins were separated on a gel and the incorporation of 32P into the substrates was evaluated via autoradiography (upper panel). The lower panel shows a loading control stained with Coomassie brilliant blue. (D) and (E) in vitro FRET assays using SNACS performed in the presence of GST-OST1 or GST-OST1D140A (inactive OST1 kinase version). SNACS alone controls in D and E were from the same experiments shown in the two panels, as experiments were performed in parallel. The emission spectra of SNACS produced by excitation of the Turquoise GL domain with 434 nm light are shown. (F) In vitro FRET assays using SNACSS785A mutant reporter performed in the presence or absence of GST-OST1. Emission spectra of the SNACS reporter produced by excitation of the Turquoise GL domain with 434 nm light are shown.
-
Figure 1—source data 1
Uncropped gel images for Figure 1C.
- https://cdn.elifesciences.org/articles/56351/elife-56351-fig1-data1-v2.docx
-
Figure 1—source data 2
In vitro SNACS FRET ratio values in Figure 1.
- https://cdn.elifesciences.org/articles/56351/elife-56351-fig1-data2-v2.xlsx
Figure 1—figure supplement 1
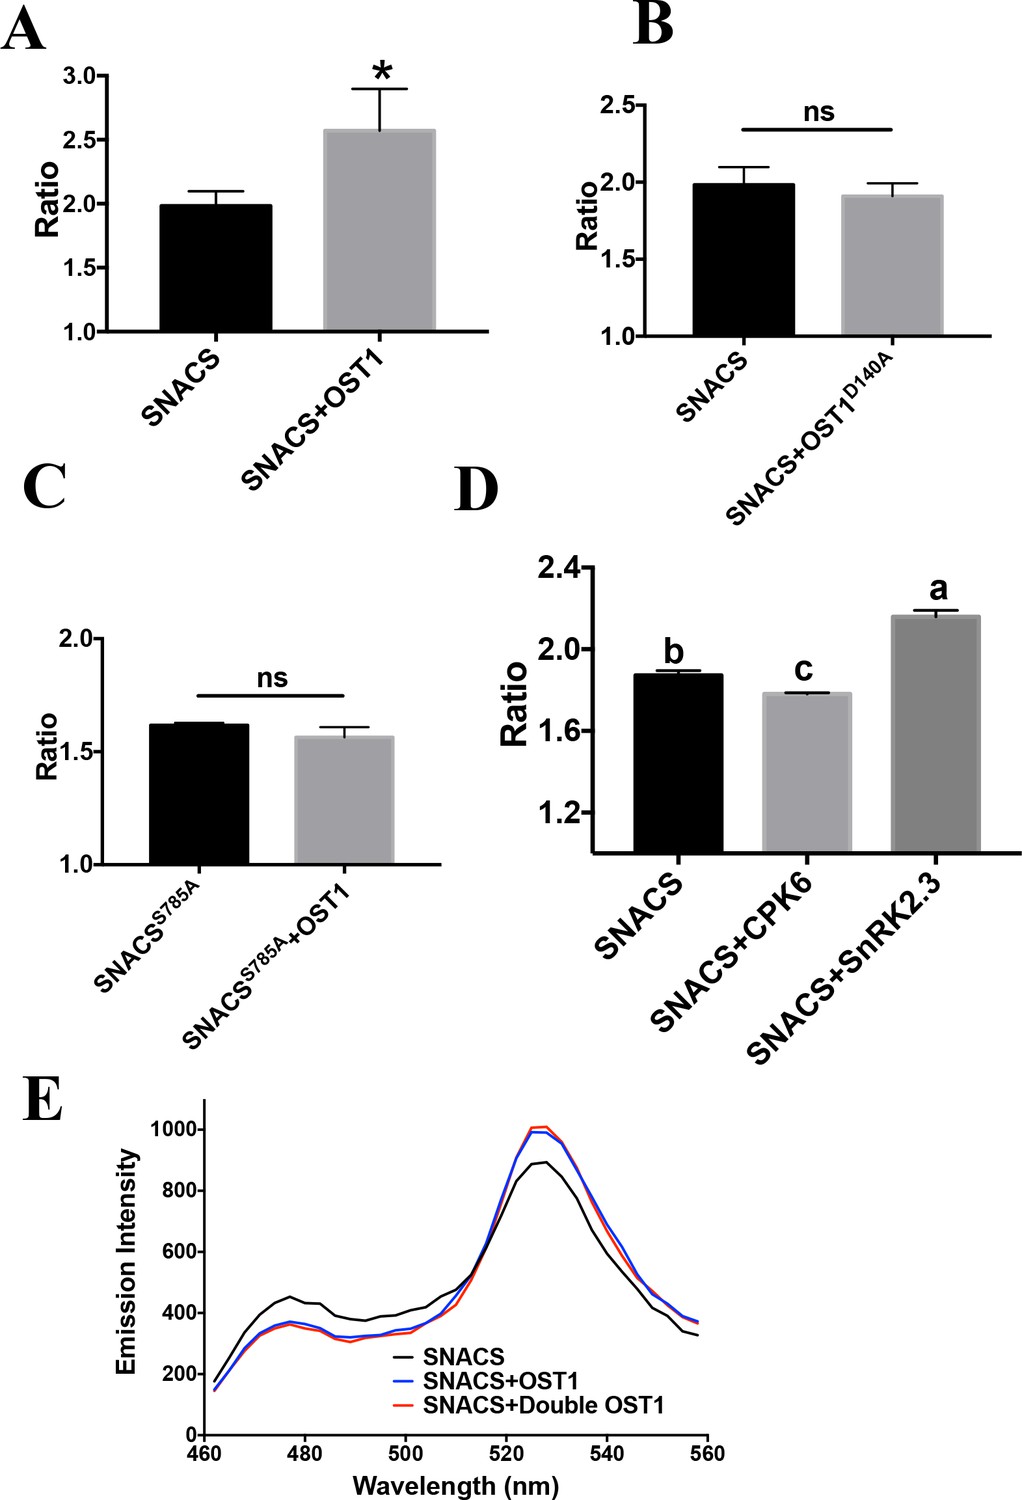
In vitro FRET assay of SNACS reporter.
The SNACS protein or the control SNACSS785A isoform was incubated in vitro with GST-OST1, GST-OST1D140A (inactive OST1), GST-CPK6 or GST-SnRK2.3 for 2 hr, respectively. The ratio was calculated from fluorescence intensities of YPet (data points, 525–531 nm) over Turquoise GL (data points, 471–477 nm). (A) and (B) FRET ratios of in vitro FRET assays from three repeats using SNACS. SNACS alone controls in A and B were from the same three experiments shown in the two panels, as experiments were performed in parallel. Error bars denote mean ± SD. n = 3 experiments (*p=0.0418; ns = not significant p=0.4214; Student’s t-test). (C) In vitro FRET assays from three repeats using SNACSS785A. Error bars denote mean ± SD. n = 3 experiments (ns = not significant p=0.115; Student’s t-test). (D) In vitro FRET assays using SNACS with CPK6 or SnRK2.3. Means with different letters are grouped based on one-way ANOVA and Tukey’s test, p<0.05 (n = 3 independent experiments). (E) In vitro FRET assays using SNACS reporter performed in the presence of two concentrations of GST-OST1 (4 µg and 8 µg). Double OST1 denotes 8 µg GST-OST1. Note that the SNACS and ‘SNACS+OST1’ control trace in panel E is the same as the SNACS and ‘SNACS+OST1’ trace in Figure 1D, as these data were obtained within the same data set.
-
Figure 1—figure supplement 1—source data 1
In vitro SNACS FRET ratio values in Figure 1—figure supplement 1.
- https://cdn.elifesciences.org/articles/56351/elife-56351-fig1-figsupp1-data1-v2.xlsx
Figure 2 with 1 supplement
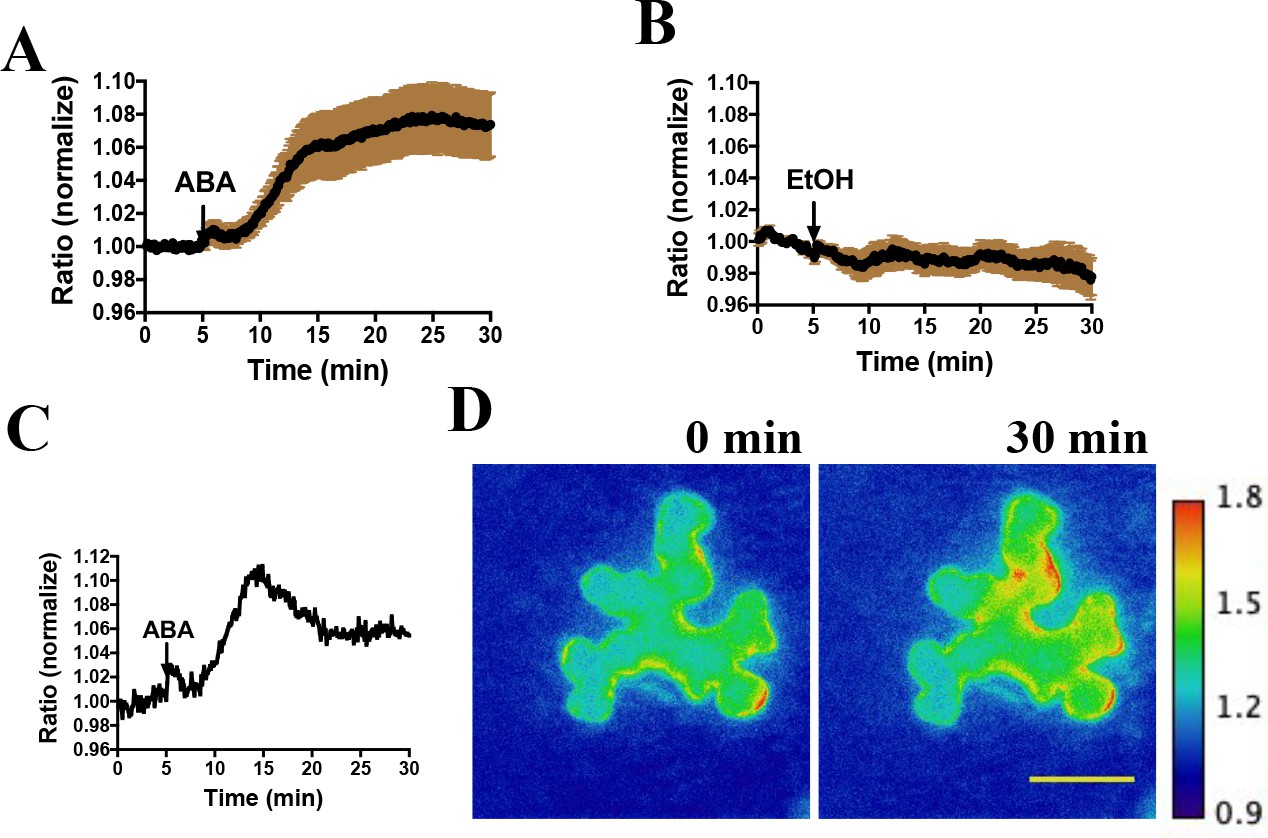
Abscisic acid induces increases in the ratio of YPet to Turquoise GL fluorescence emission of the SNACS reporter in N. benthamiana.
(A) Time-resolved FRET ratio changes in response to ABA. SNACS was co-infiltrated with pUBQ10:OST1-HF in N. benthamiana. Leaf epidermises were perfused with assay buffer (5 mM KCl, 50 µM CaCl2, 10 mM MES-Tris, pH 5.6) and then 20 µM ABA was added as indicated by the arrow. Experiments were repeated at least three times with similar results. FRET efficiency changes were recorded by measuring the ratio of fluorescence emissions at 535 nm/480 nm with an excitation wavelength of 434 nm (see Materials and methods). Data are averages of normalized emission ratios of YPet to Turquoise GL emission produced by exciting Turquoise GL from 11 cells. Error bars denote mean ± SEM. (B) Time-resolved FRET ratio in response to 0.02% EtOH (solvent control for ABA). Data are averages of normalized emission ratios from 7 cells. Error bars denote mean ± SEM. (C) and (D) Example of a single cell experiment from A. (C) The corresponding emission ratio normalized to the average value over 5 min before treatment. (D) Pseudo-colored fluorescence ratio images of SNACS-expressing N. benthamiana leaf epidermal cells at times 0 min and 30 min. The calibration bar to the right of (D) indicates the numerical ratio (non-normalized) scale corresponding to the heat map. Bar = 50 µm.
-
Figure 2—source data 1
SNACS FRET ratio values from each stomate in Figure 2.
- https://cdn.elifesciences.org/articles/56351/elife-56351-fig2-data1-v2.xlsx
Figure 2—figure supplement 1
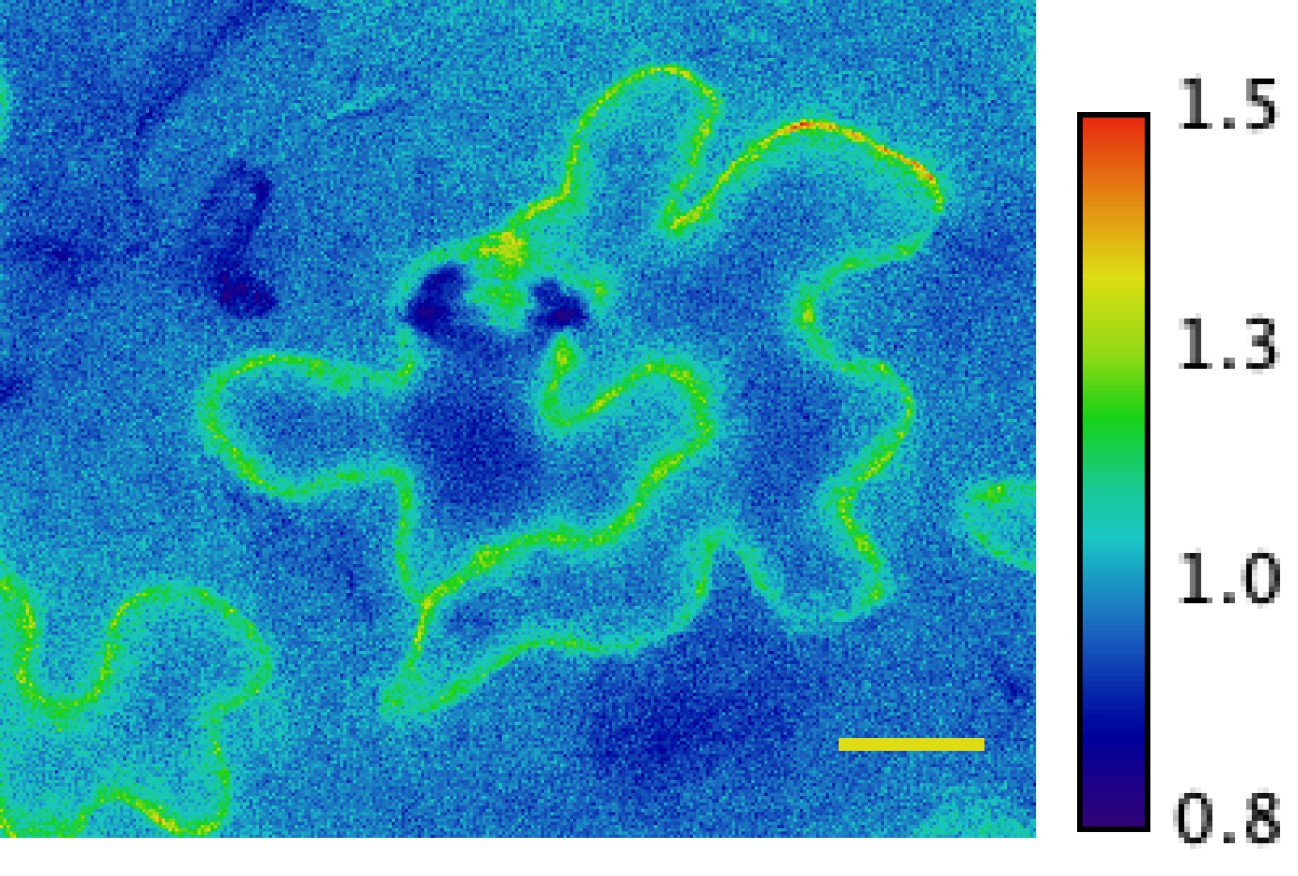
Ratiometric image of 535/480 nm wavelength emissions show fluorescence in SNACS-expressing Arabidopsis epidermal cells (pseudo-colored fluorescence ratio scale is shown on the right, non-normalized).
Bar = 20 µm.
Figure 3 with 1 supplement
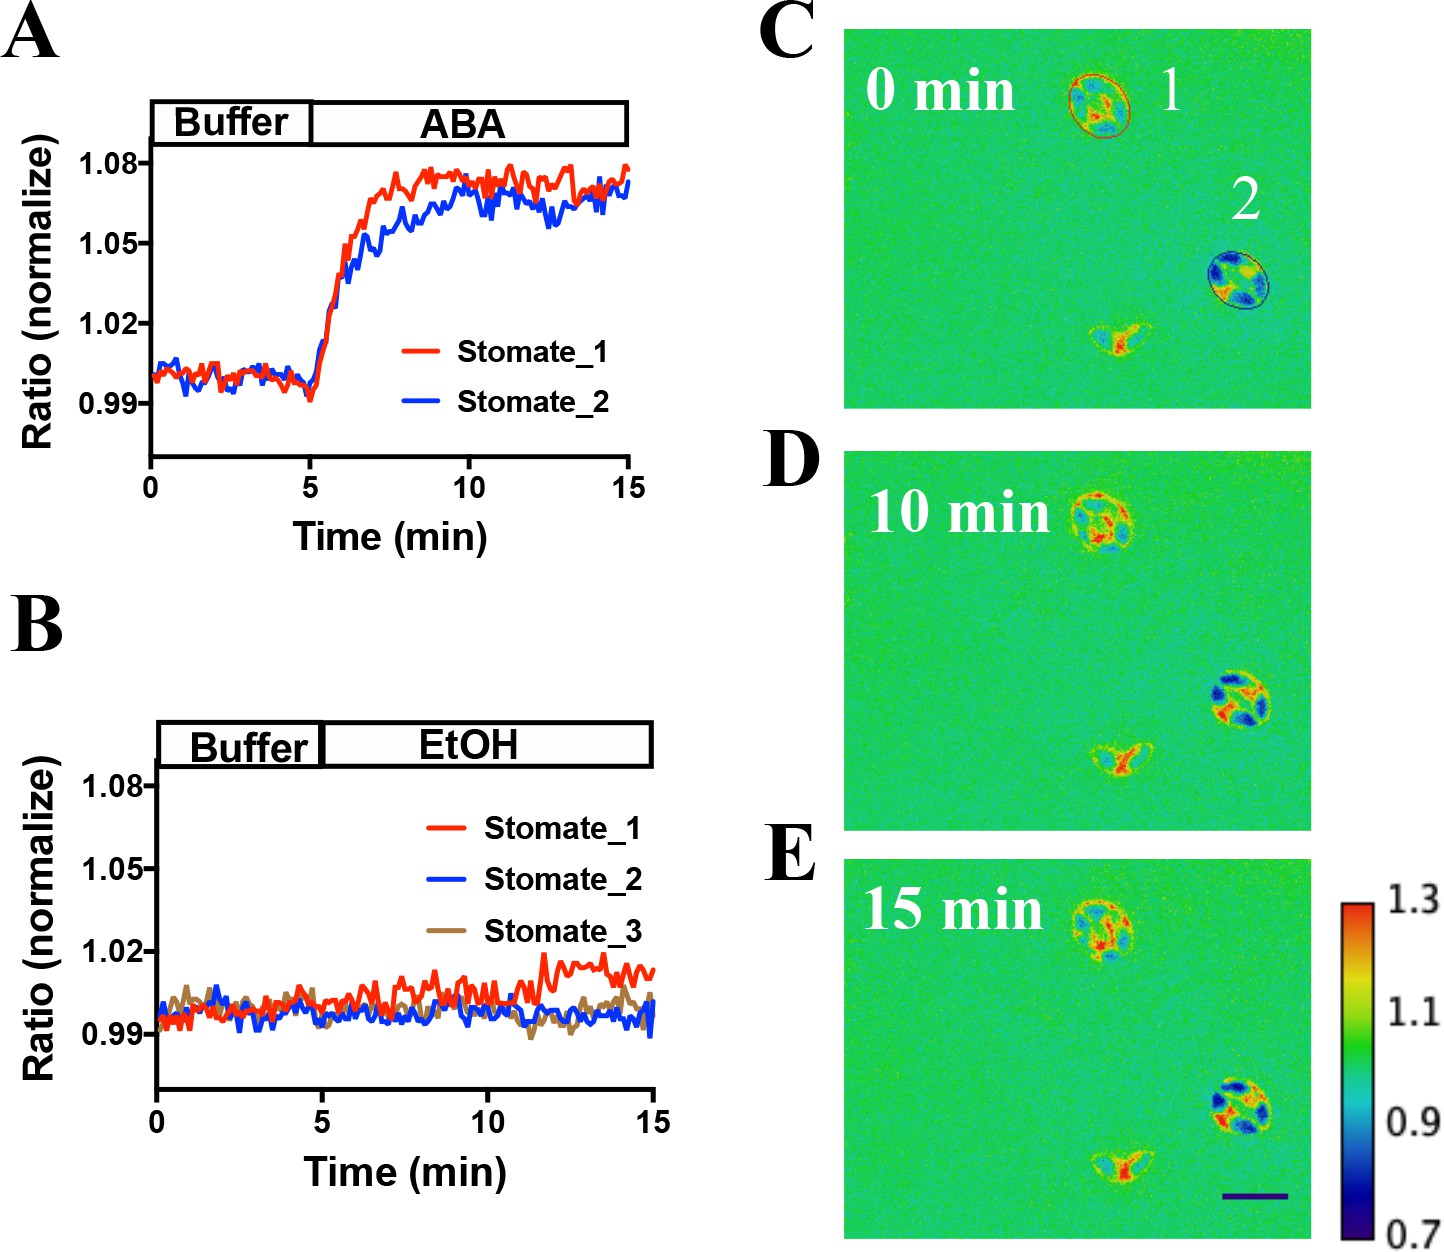
In vivo response of SNACS reporter of SnRK2 activity in response to ABA in Arabidopsis guard cells.
(A) Time-resolved FRET ratio changes in response to ABA (20 µM). FRET efficiency changes were recorded by measuring the ratio of fluorescence emissions at 535 nm/480 nm with an excitation wavelength of 434 nm (see Materials and methods). (B) Time-resolved FRET ratio change in response to EtOH (0.02%, solvent control for ABA). (C to E) Images of SNACS fluorescence ratios in guard cells from A at 0 min, 10 min and 15 min. The colored circles indicate the regions of interest (ROIs) used to measure fluorescence emissions with the colors corresponding to the blue and red traces in panel A. ‘1’ and ‘2’ in (C) denote ‘stomate_1’ and ‘stomate_2’, respectively. The calibration bar in the lower right of (E) indicates the numerical scale corresponding to the non-normalized heat map. Bar = 20 µm. Note that the lowest cell (red spot) in the images shows fluorescence of a single guard cell from an apparent half stomate. Treatments were performed blinded (ABA or EtOH). SNACS FRET activities in guard cells in leaf epidermises were analyzed in a pUBQ10:OST1-HF-expressing ost1-3 genetic background (Waadt et al., 2015). The ratio of YPet to Turquoise GL emission was normalized to the average value over 5 min before treatment.
-
Figure 3—source data 1
SNACS FRET ratio values from each stomate in Figure 3.
- https://cdn.elifesciences.org/articles/56351/elife-56351-fig3-data1-v2.xlsx
Figure 3—figure supplement 1
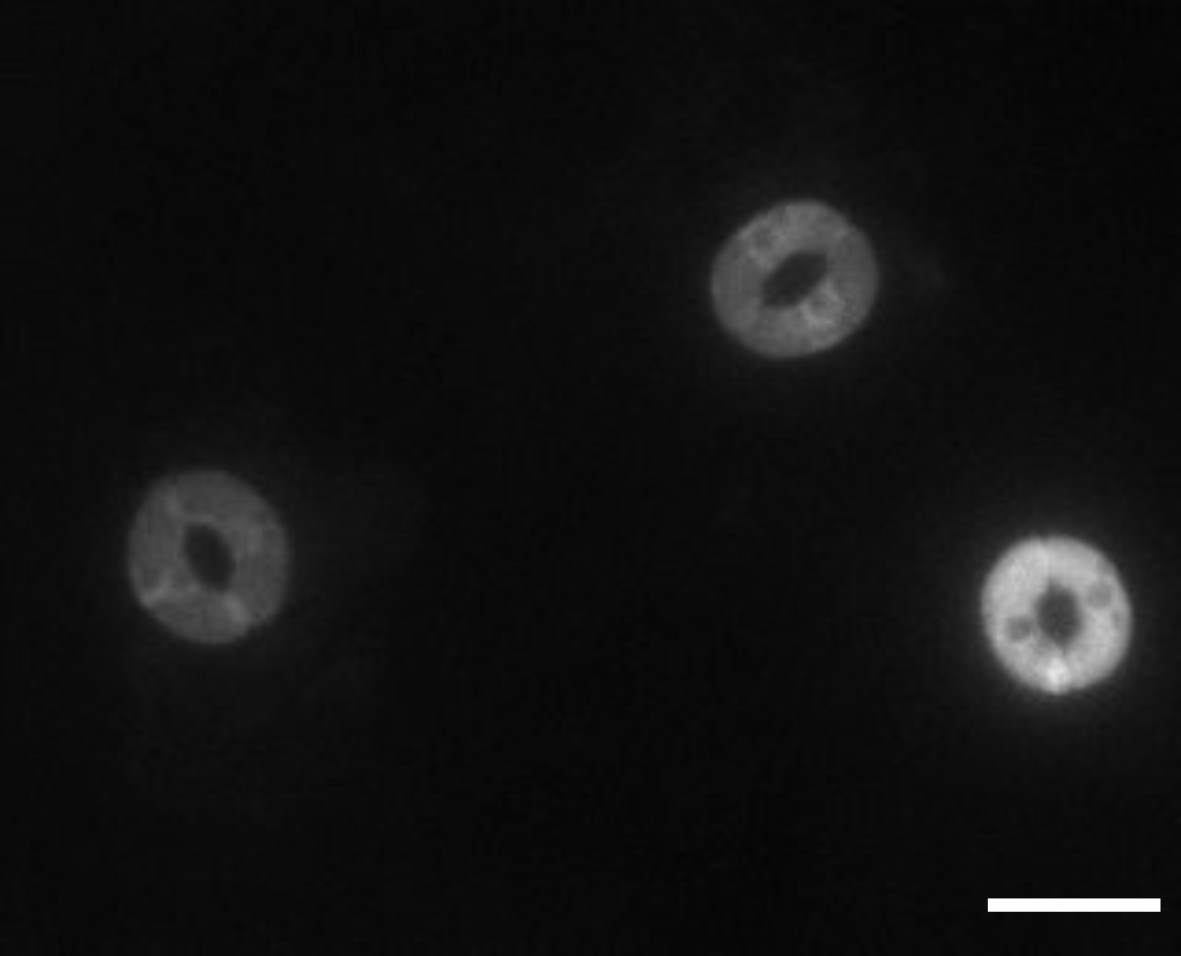
SNACS fluorescence appears to be observed mainly in the cytoplasm, with possible low expression in the nucleus or fluorescence may ‘bleed’ from the cytoplasm towards the nuclear region.
Stomata imaged at the SNACS YPet emission wavelength (535 nm; scale bar = 20 µm).
Figure 4 with 2 supplements

The amino acid AKS1 Ser-30 in the SNACS reporter is necessary for ABA-induced ratio increases in Arabidopsis guard cells.
Leaf epidermises from transgenic lines expressing SNACS were used for depicting the ratio of YPet to Turquoise GL emission produced by exciting Turquoise GL with 434 nm light. (A) ABA (20 µM) induced the SNACS response in the Col-0 genetic background. (B) SNACS response to EtOH (0.02%, solvent control for ABA) treatment in the Col-0 wild-type genetic background. (C) The S785A mutation in the SNACS reporter impairs ABA-induced FRET ratio changes in the Col-0 wild-type genetic background. (D) A representative SNACS fluorescence ratio image from A at 0 min and 15 min time points. Bar = 10 µm. (E) ABA (20 µM) induced SNACS response in the pUBQ10:OST1-HF-expressing in ost1-3 genetic background. (F) SNACS response to EtOH (0.02%, solvent control for ABA) in pUBQ10:OST1-HF- expressing in ost1-3 genetic background. (G) The S785A mutation in the SNACS impairs ABA-induced FRET ratio changes in the pUBQ10:OST1-HF-expressing in ost1-3 genetic background. The ratios were normalized to the average value over the 5 min before treatment. (H) A representative SNACS fluorescence ratio image from E at 0 min and 15 min time points. Bar = 10 µm. Calibration bars to the right of D and H show the numerical ratio (non-normalized) scale corresponding to the pseudo-coloring.
-
Figure 4—source data 1
SNACS FRET ratio values from each stomate in Figure 4.
- https://cdn.elifesciences.org/articles/56351/elife-56351-fig4-data1-v2.xlsx
Figure 4—figure supplement 1
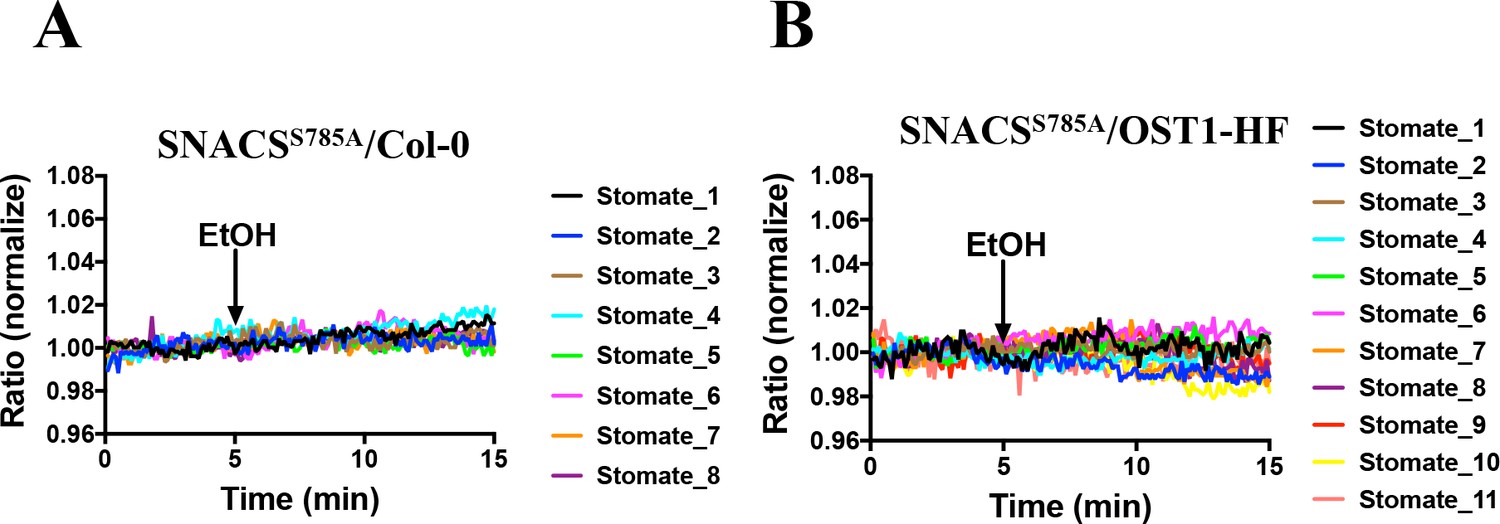
EtOH controls for SNACSS785A in Col-0 and in pUBQ10:OST1-HF expressed in the ost1-3 genetic background.
The response of the SNACSS785A to EtOH (0.02%) treatment in Col-0 (A) and in pUBQ10:OST1-HF expressed in the ost1-3 genetic background (B). The ratio of YPet to Turquoise GL emission was normalized to the average value over the 5 min before treatment.
-
Figure 4—figure supplement 1—source data 1
SNACS FRET ratio values from each stomate in Figure 4—figure supplement 1.
- https://cdn.elifesciences.org/articles/56351/elife-56351-fig4-figsupp1-data1-v2.xlsx
Figure 4—figure supplement 2

Combined and averages of single stomate imaging data from experimental sets including experiments in Figure 4.
Red lines show the average ratio changes of all stomata traces. Grey lines denote each single stomate ratio change. For visualization of individual stomate time courses see colored traces in Figure 4 and Figure 4—figure supplement 1. Additional data from independent experimental data sets are included in several panels of Figure 4—figure supplement 2, Figure 6—figure supplement 2, Figure 7—figure supplement 1 and Figure 8—figure supplement 1 as indicated by the total number of stomata analyzed in Supplementary Figure legends. (A, B, C) Data for Figure 4A–C,A: n = 24 stomata. (B) n = 17 stomata, including the data shown in Figure 4B.(C) n = 15 stomata, including the data shown in Figure 4C. (D) Data for Figure 4—figure supplement 1A, n = 13 stomata, including the data shown in Figure 4—figure supplement 1A. (E, F, G) Data for Figure 4E–G, n = 22 stomata, including the data shown in Figure 4E; n = 19 stomata, including the data shown in Figure 4F; n = 22 stomata, including the data shown in Figure 4G. (H) Data for Figure 4—figure supplement 1B, n = 19 stomata, including the data shown in Figure 4—figure supplement 1B.
-
Figure 4—figure supplement 2—source data 1
SNACS FRET ratio values from each stomate in Figure 4—figure supplement 2.
- https://cdn.elifesciences.org/articles/56351/elife-56351-fig4-figsupp2-data1-v2.xlsx
Figure 5 with 1 supplement

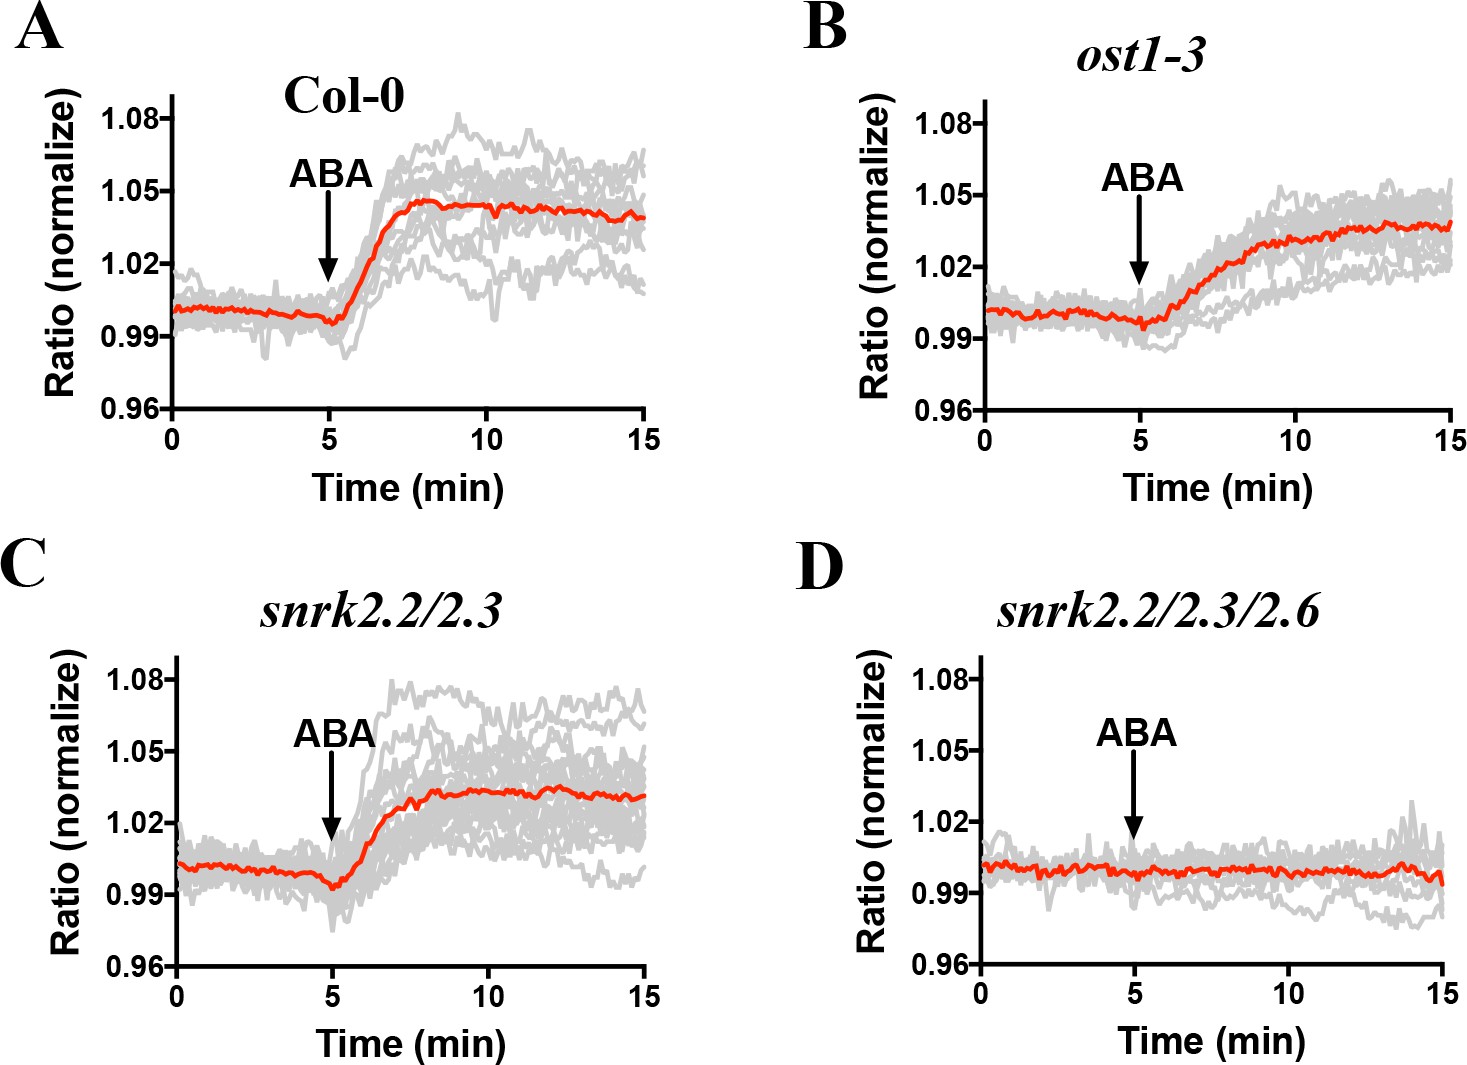
SnRK2 activity is needed in guard cells for ABA-induced increases in the FRET ratio of SNACS.
Leaf epidermises from transgenic lines expressing SNACS were used for analyzing the ratio of YPet to Turquoise GL emission in guard cells produced by exciting Turquoise GL with 434 nm light. The ratio was normalized to the average value over the 5 min before ABA exposure. (A) ABA (20 µM) induced SNACS responses in guard cells of the Col-0 (WT) genetic background. (B) ABA (20 µM) induced SNACS responses in guard cells of the ost1-3 genetic background. (C) ABA (20 µM) induced SNACS responses in guard cells of the snrk2.2/2.3 double mutant genetic background. (D) ABA (20 µM) induced SNACS response was impaired in snrk2.2/2.3/2.6 triple mutant guard cells.
-
Figure 5—source data 1
SNACS FRET ratio values from each stomate in Figure 5.
- https://cdn.elifesciences.org/articles/56351/elife-56351-fig5-data1-v2.xlsx
Figure 5—figure supplement 1
Combined and averages of single stomate imaging data from experimental sets shown in Figure 5.
Red lines show the average ratio changes of all stomata traces. Grey lines denote each single stomate ratio change. For visualization of individual stomate time courses see colored traces in Figure 5. (A) n = 12 stomata; (B) n = 14 stomata; (C) n = 20 stomata; (D) n = 9 stomata.
-
Figure 5—figure supplement 1—source data 1
SNACS FRET ratio values from each stomate in Figure 5—figure supplement 1.
- https://cdn.elifesciences.org/articles/56351/elife-56351-fig5-figsupp1-data1-v2.xlsx
Figure 6 with 2 supplements
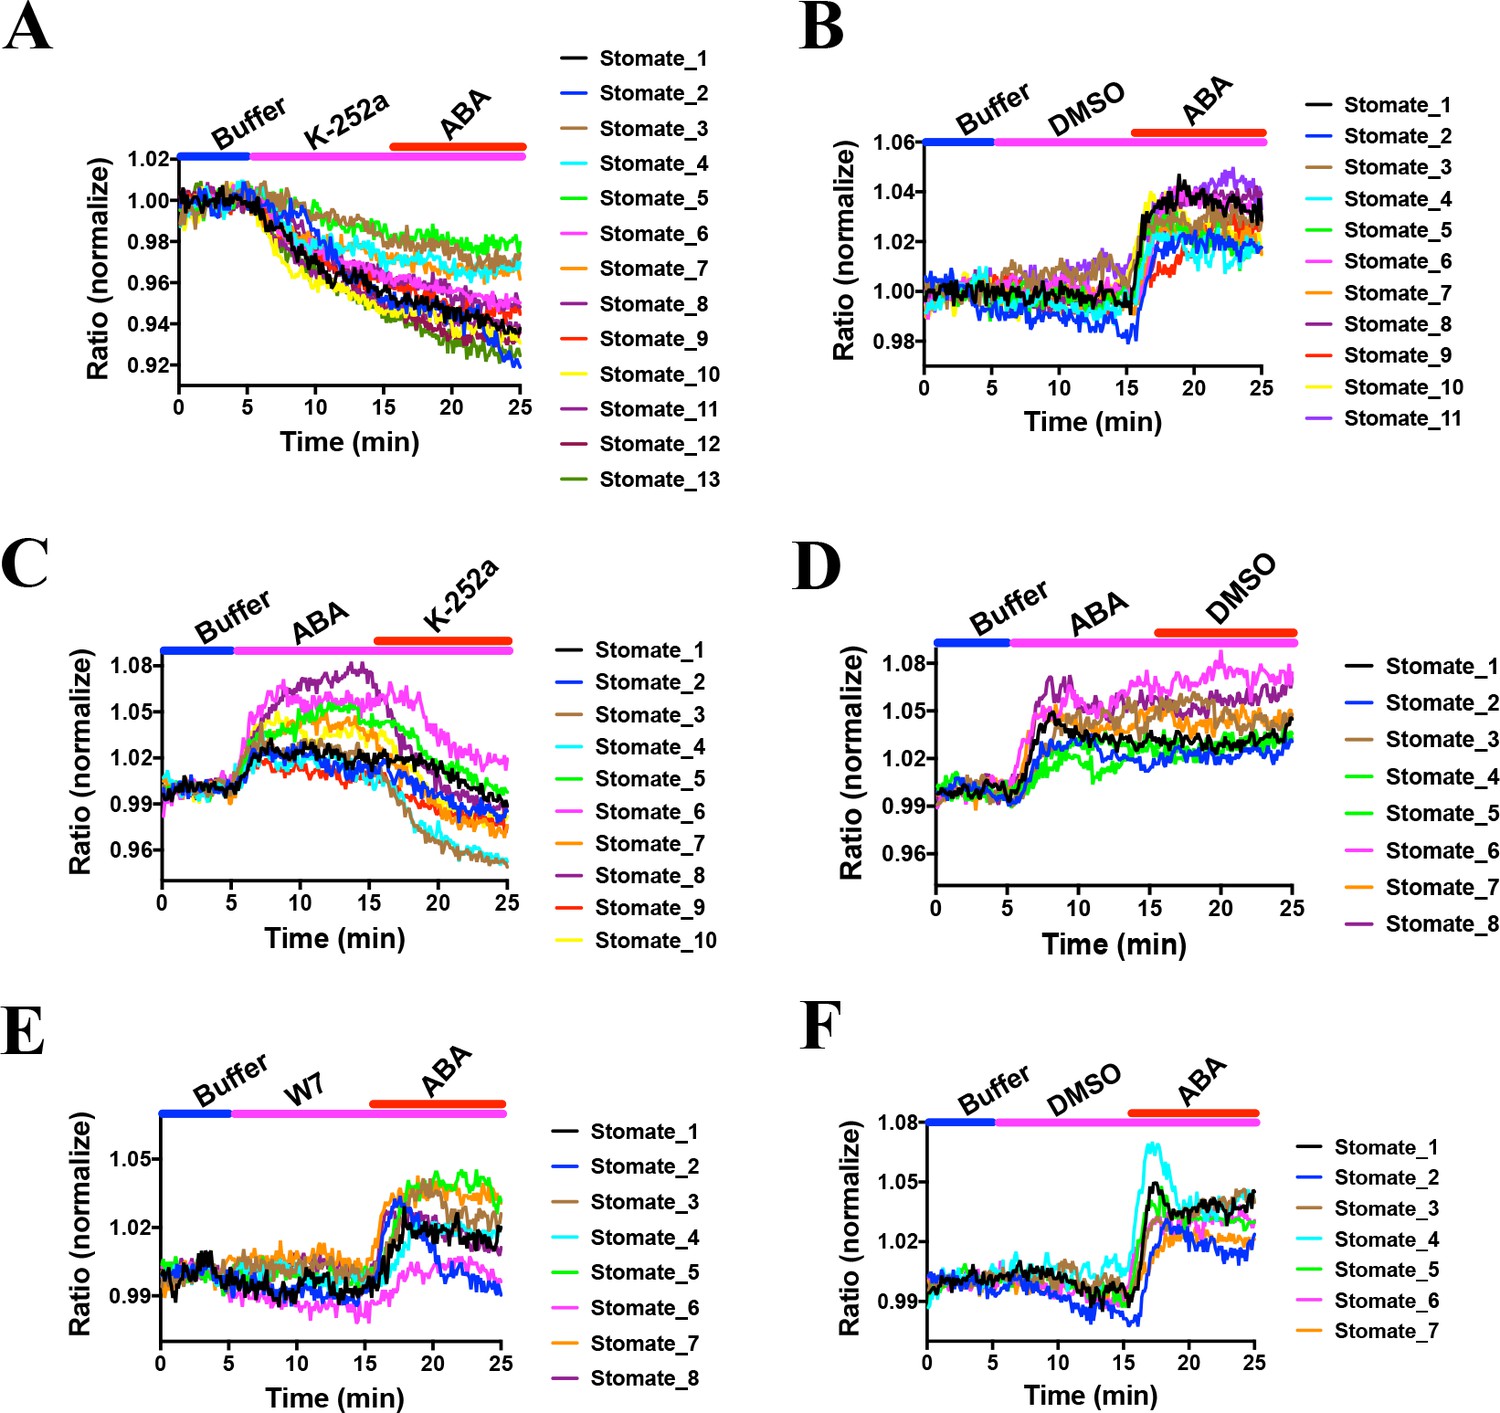
Effects of kinase inhibitors on SNACS fluorescence emission ratios in guard cells.
SNACS responses in guard cells were analyzed in the pUBQ10:OST1-HF-expressed in the ost1-3 genetic background. The ratio of YPet to Turquoise GL emission was normalized to the average value over the 5 min before K252a application. (A) The protein kinase inhibitor K-252a reduced SNACS FRET ratio in vivo, and ABA did not induce a ratio increase in the presence of K-252a. After 10 min incubation with 10 µM K-252a, 20 µM ABA was added. (B) ABA induced a ratio increase in the presence of DMSO (0.2%, solvent control for K-252a). (C) The kinase inhibitor K-252a inhibited SnRK2 kinase activity after ABA treatment. (D) Control experiment for C. 0.2% DMSO was added. (E) Kinase inhibitor W7 did not affect SNACS FRET ratio in vivo. After 10 min incubation with 20 µM W7, 20 µM ABA was added. (F) Control experiment for E. 0.1% DMSO was added as solvent for W7.
-
Figure 6—source data 1
SNACS FRET ratio values from each stomate in Figure 6.
- https://cdn.elifesciences.org/articles/56351/elife-56351-fig6-data1-v2.xlsx
Figure 6—figure supplement 1
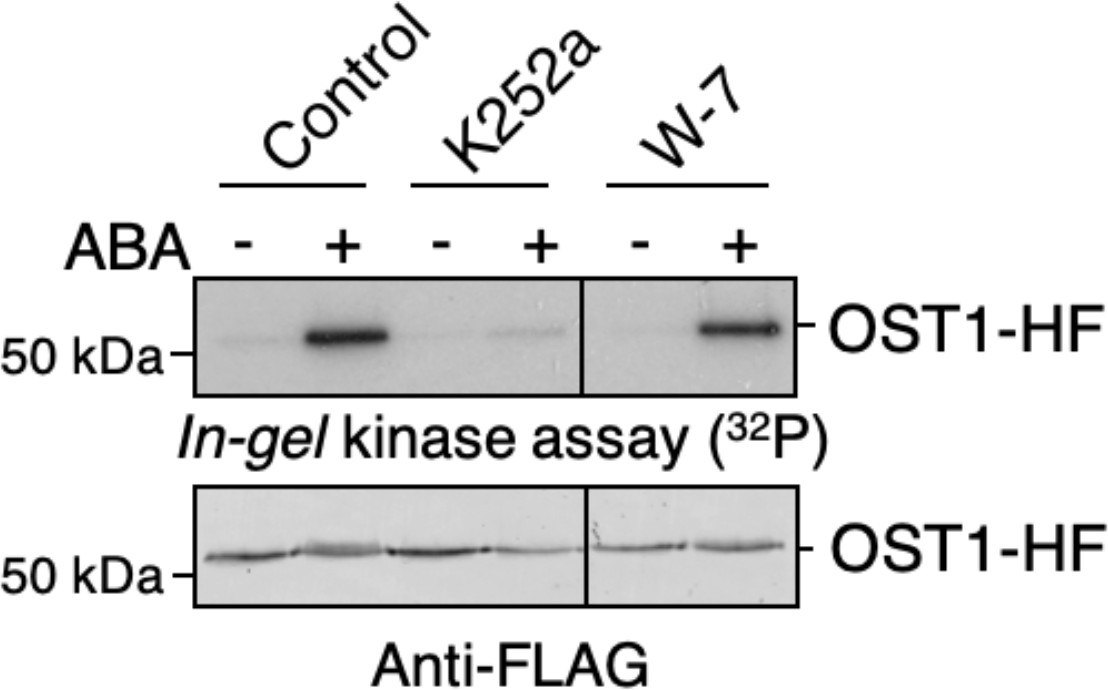
W-7 does not have a clear effect on ABA-induced OST1/SnRK2.6 activation in plant cells.
Mesophyll cell protoplasts prepared from stable transgenic UBQ10:OST1-HF/ost1-3 Arabidopsis plants were incubated with 10 µM K252a, 50 µM W-7, or DMSO (control) for 20 min. Then, protoplasts were further incubated with or without 20 µM ABA for 15 min. In-gel kinase assays show OST1/SnRK2.6 kinase activities (top panel). OST1-HF protein amounts are shown by immuno-blots using anti FLAG antibody (bottom panel).
-
Figure 6—figure supplement 1—source data 1
Uncropped gel images for Figure 6—figure supplement 1.
- https://cdn.elifesciences.org/articles/56351/elife-56351-fig6-figsupp1-data1-v2.docx
Figure 6—figure supplement 2
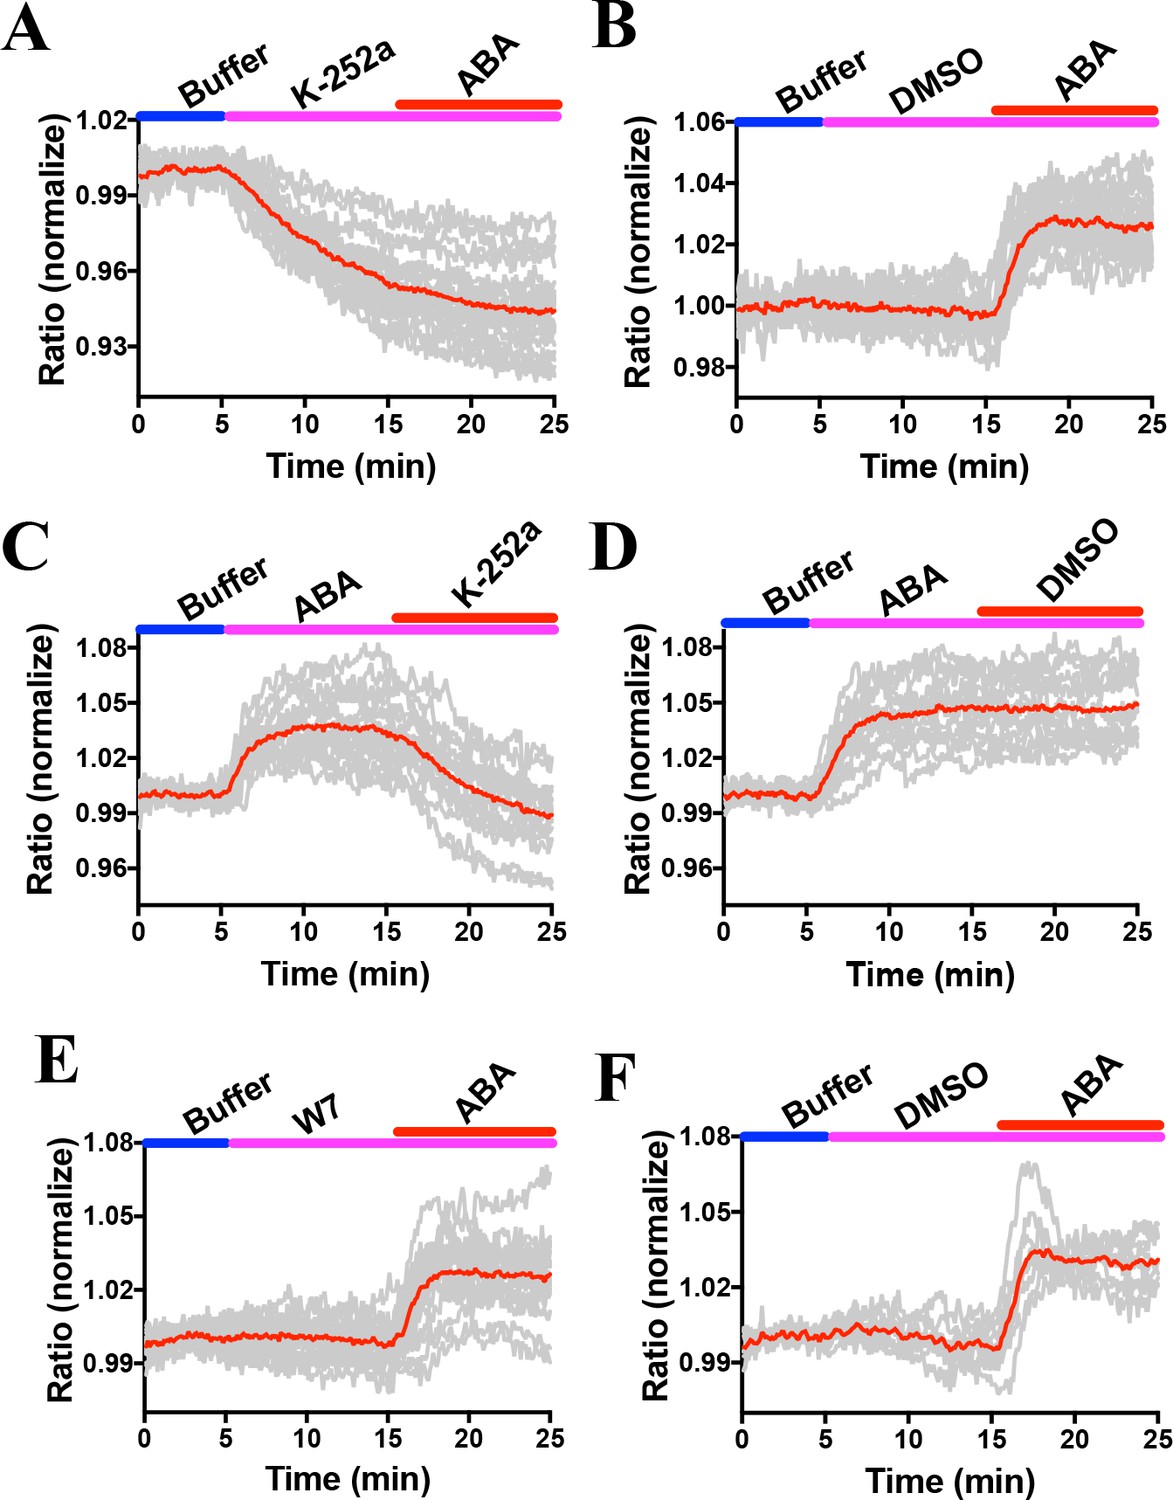
Combined and averages of single stomate imaging data from experimental sets including experiments in Figure 6.
Red lines show the average ratio changes of all stomata traces. Grey lines denote each single stomate ratio change. For visualization of individual stomate time courses see colored traces in Figure 6. Additional data from independent experimental data sets are included in several panels of Figure 4—figure supplement 2, Figure 6—figure supplement 2, Figure 7—figure supplement 1 and Figure 8—figure supplement 1 as indicated by the total number of stomata analyzed in Supplementary Figure legends. (A) n = 22 stomata, including the data shown in Figure 6A. (B) n = 19 stomata, including the data shown in Figure 6B. (C) n = 17 stomata, including the data shown in Figure 6C. (D) n = 15 stomata, including the data shown in Figure 6D. (E) n = 19 stomata, including the data shown in Figure 6E. (F) n = 9 stomata, including the data shown in Figure 6F.
-
Figure 6—figure supplement 2—source data 1
SNACS FRET ratio values from each stomate in Figure 6—figure supplement 2.
- https://cdn.elifesciences.org/articles/56351/elife-56351-fig6-figsupp2-data1-v2.xlsx
Figure 7 with 1 supplement
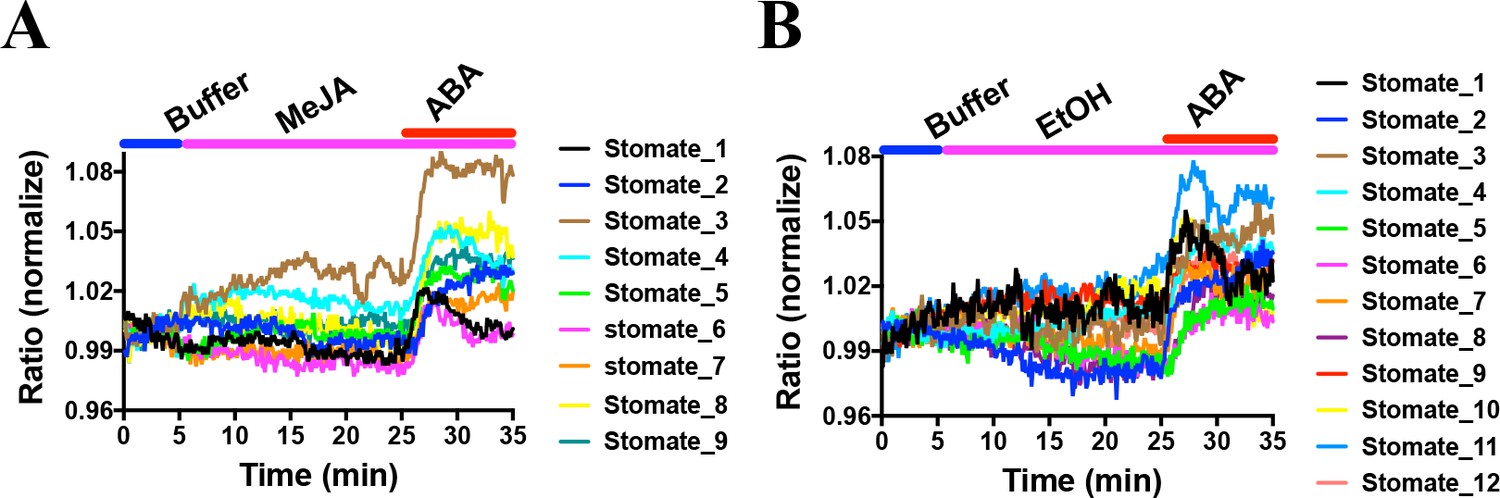
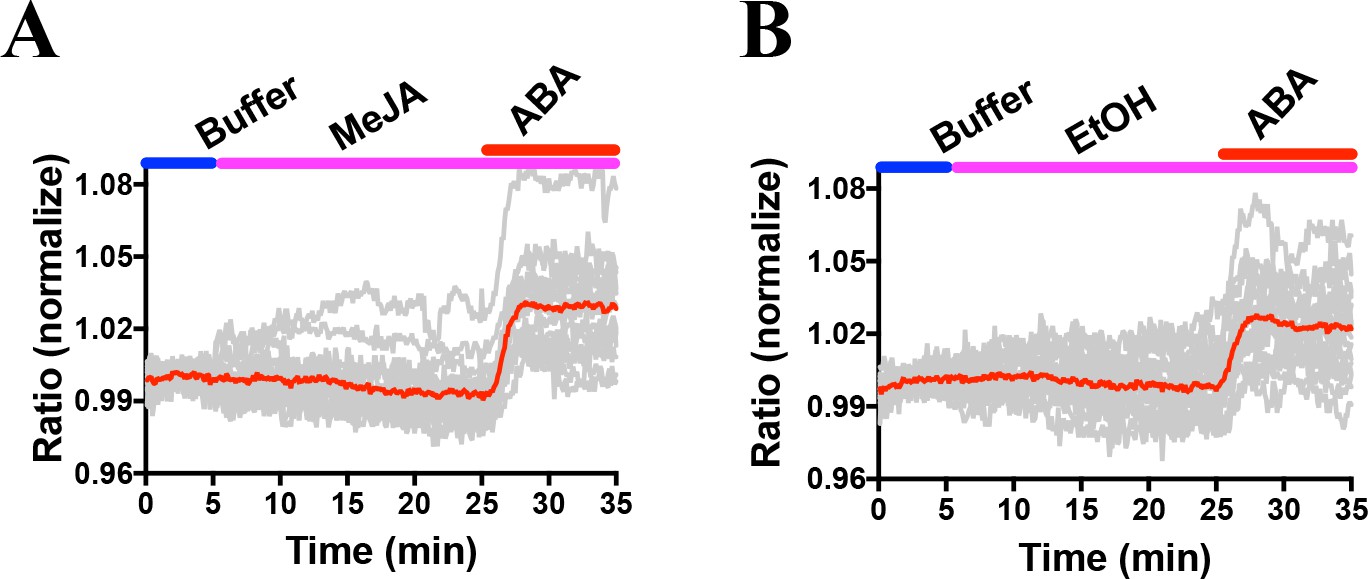
MeJA did not induce consistent FRET ratio changes of the SNACS SnRK2 activity reporter in guard cells under the imposed conditions.
The SNACS reporter was analyzed in guard cells in leaf epidermises of plants expressing pUBQ10:OST1-HF in the ost1-3 genetic background. The ratio of YPet to Turquoise GL emission was normalized to the average value over the 5 min before treatment. (A) MeJA (20 µM) did not affect the FRET ratio in guard cells. ABA induced ratio increases in the presence of MeJA. After 20 min treatment with 20 µM MeJA, 20 µM ABA was added. (B) Control experiment for A. 0.1% EtOH (solvent control for MeJA) was added.
-
Figure 7—source data 1
SNACS FRET ratio values from each stomate in Figure 7.
- https://cdn.elifesciences.org/articles/56351/elife-56351-fig7-data1-v2.xlsx
Figure 7—figure supplement 1
Combined and averages of single stomate imaging data from experimental sets including experiments in Figure 7.
Red lines show the average ratio changes of all stomata traces. Grey lines denote each single stomate ratio change. For visualization of individual stomate time courses see colored traces in Figure 7. Additional data from independent experimental data sets are included in several panels of Figure 4—figure supplement 2, Figure 6—figure supplement 2, Figure 7—figure supplement 1 and Figure 8—figure supplement 1 as indicated by the total number of stomata analyzed in Supplementary Figure legends. (A) n = 18 stomata, including the data shown in Figure 7A. (B) n = 18 stomata, including the data shown in Figure 7B.
-
Figure 7—figure supplement 1—source data 1
SNACS FRET ratio values from each stomate in Figure 7—figure supplement 1.
- https://cdn.elifesciences.org/articles/56351/elife-56351-fig7-figsupp1-data1-v2.xlsx
Figure 8 with 1 supplement
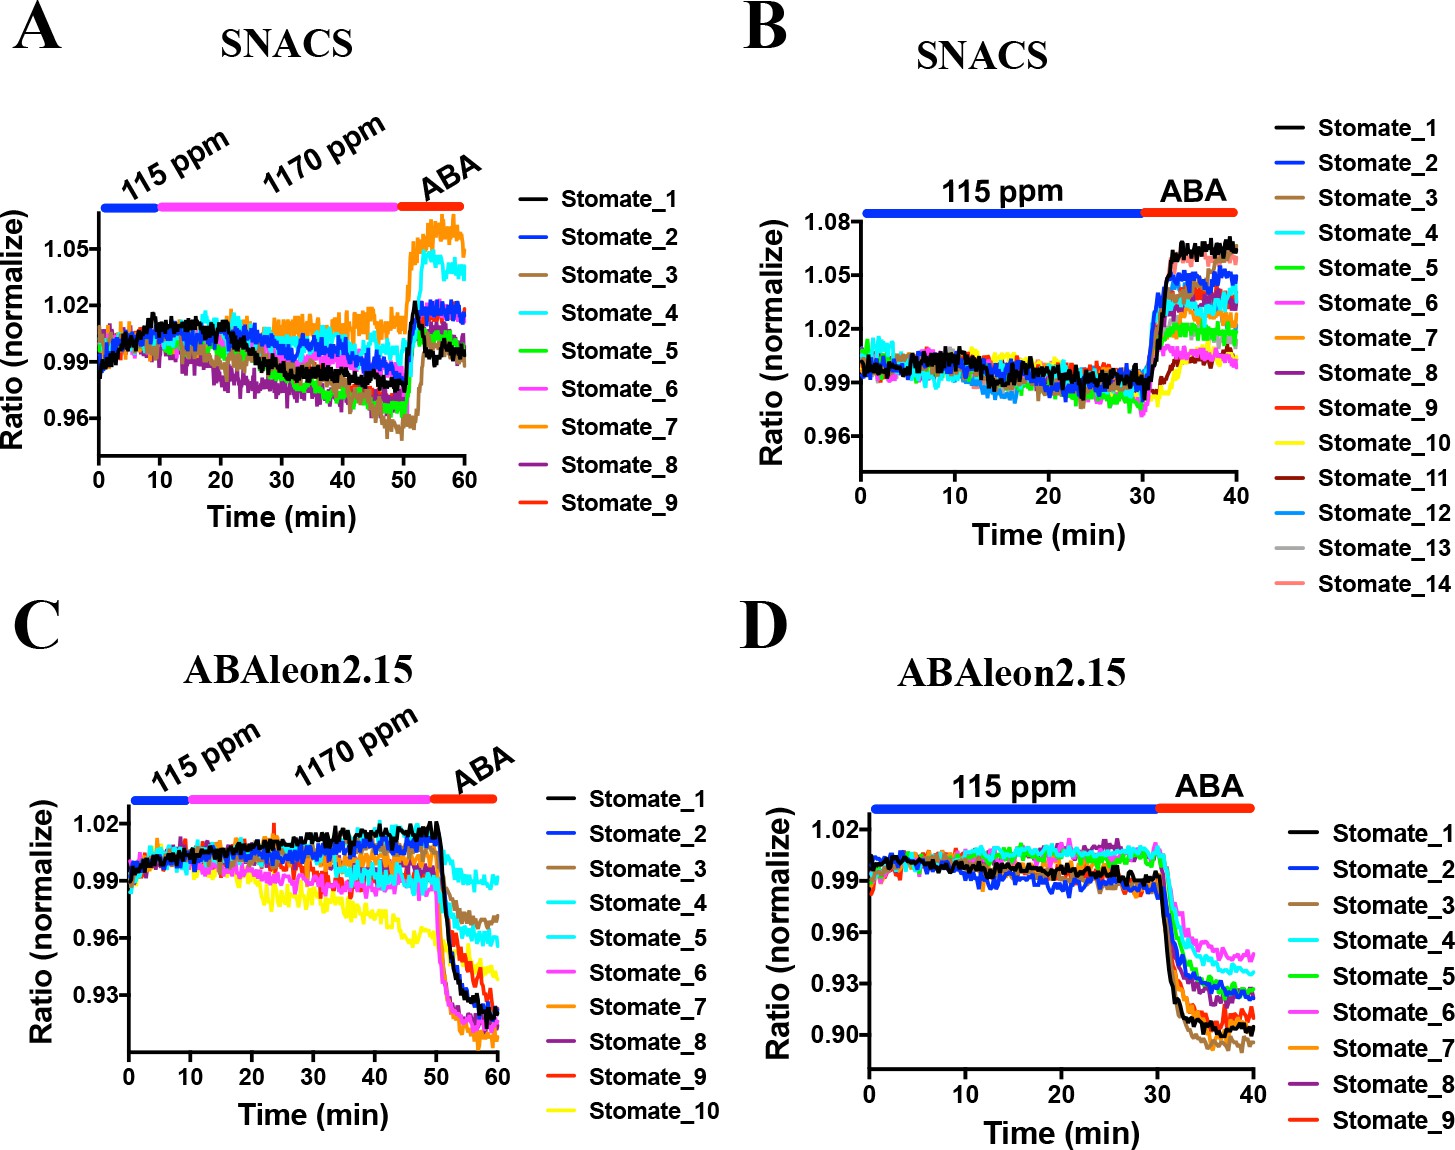
CO2 elevation neither induces SNACS FRET ratio increases nor affects ABA concentration in guard cells.
Fluorescence ratios of guard cells in intact leaf epidermises were analyzed in the pUBQ10:OST1-HF expressed in the ost1-3 genetic background (A and B). The ratio of YPet to Turquoise GL emission was normalized to the average value over the 10 min before treatments. (A) High CO2 (1170 ppm) did not increase the FRET ratio in guard cells. Intact leaf epidermises were exposed to low CO2 (115 ppm), then switched to high CO2 (1170 ppm) buffer, and then exposed to 20 µM ABA containing buffer. (B) Leaf epidermises were exposed to low CO2 (115 ppm), then exposed to 20 µM ABA containing buffer. (C) Time-resolved ABAleon2.15 emission ratios in guard cells in response to CO2 changes and ABA application. Intact leaf epidermises were exposed to low CO2 (115 ppm), then switched to high CO2 (1170 ppm) buffer, and then exposed to 20 µM ABA containing buffer. (D) Leaf epidermises were exposed to low CO2 (115 ppm), then exposed to 20 µM ABA containing buffer. Note that reduction in fluorescence ratios observed in ABAleon2.15-expressing guard cells correspond to ABA concentration increases (Waadt et al., 2014).
-
Figure 8—source data 1
SNACS FRET ratio values from each stomate in Figure 8.
- https://cdn.elifesciences.org/articles/56351/elife-56351-fig8-data1-v2.xlsx
Figure 8—figure supplement 1
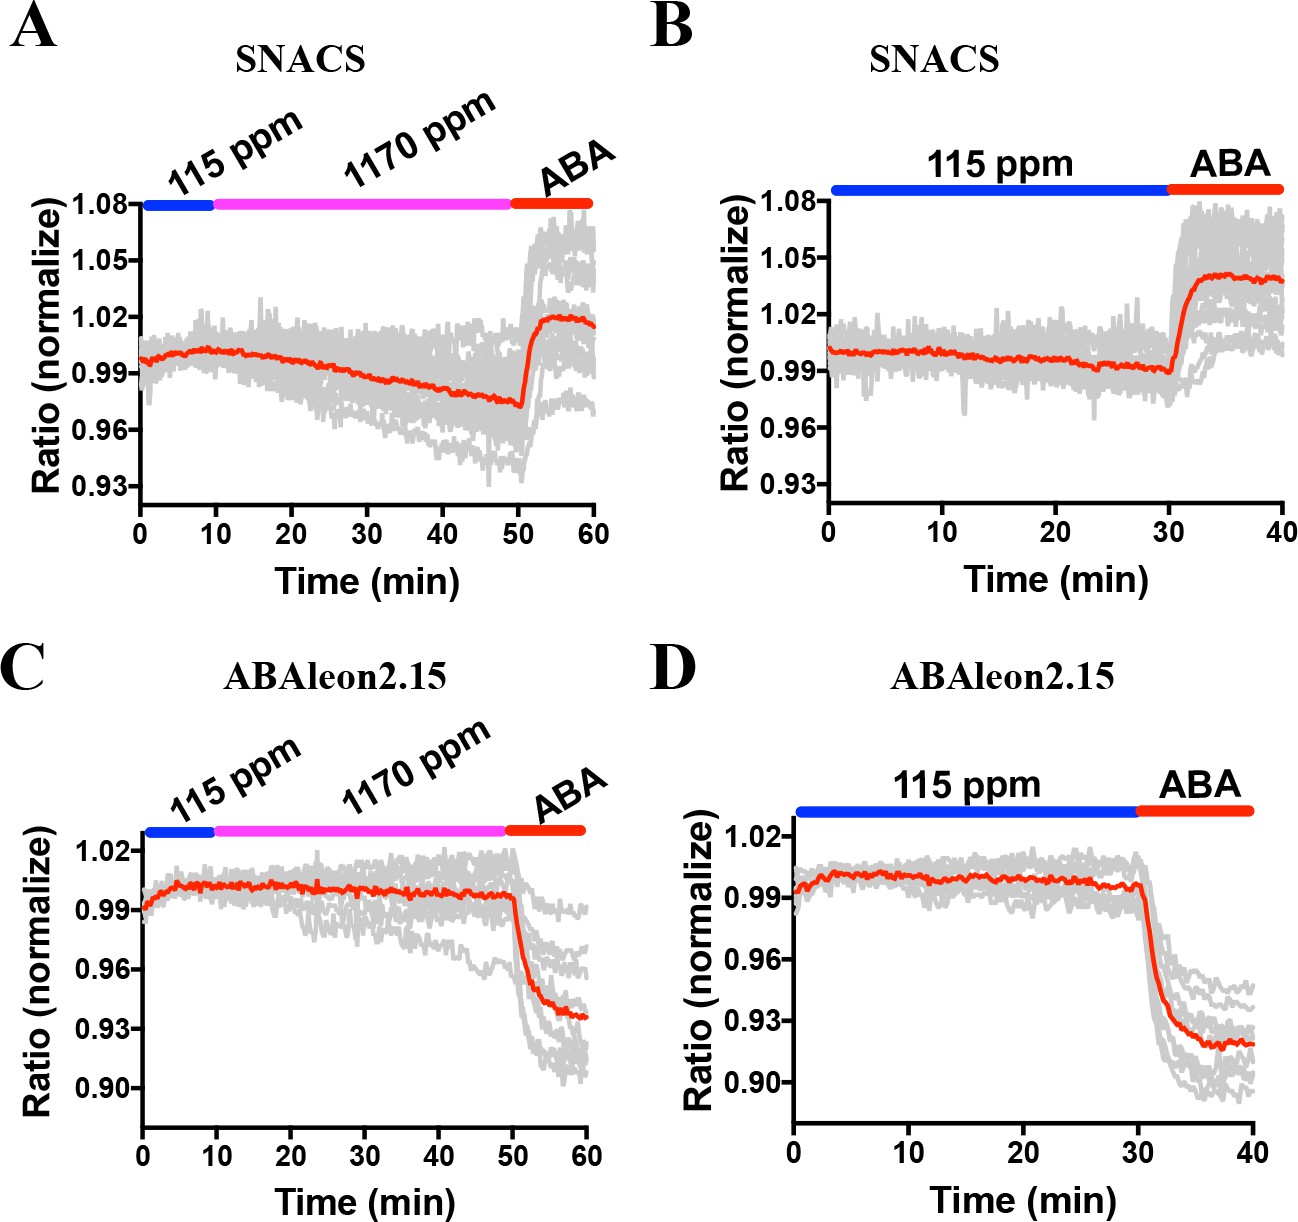
Combined and averages of single stomate imaging data from experimental sets including experiments in Figure 8.
Red lines show the average ratio changes of all stomata traces. Grey lines denote each single stomate ratio change. For visualization of individual stomate time courses see colored traces in Figure 8. Additional data from independent experimental data sets are included in several panels of Figure 4—figure supplement 2, Figure 6—figure supplement 2, Figure 7—figure supplement 1 and Figure 8—figure supplement 1 as indicated by the total number of stomata analyzed in Supplementary Figure legends. (A) n = 15 stomata,including data shown in Figure 8A. (B) n = 22 stomata, including data shown in Figure 8B. (C) n = 10 stomata. (D) n = 9 stomata.
-
Figure 8—figure supplement 1—source data 1
SNACS FRET ratio values from each stomate shown in Figure 8—figure supplement 1.
- https://cdn.elifesciences.org/articles/56351/elife-56351-fig8-figsupp1-data1-v2.xlsx
Figure 9 with 3 supplements

CO2 elevation causes robust stomatal closing responses in two ABA receptor quintuple mutant and in ABA receptor sextuple mutant plants.
(A, B) Time-resolved stomatal conductances of PYR/RCAR receptor quintuple (pyl-11458 and pyl-12458) and sextuple (pyl-112458) mutants. Air CO2 concentration was increased from 400 ppm to 800 ppm at the zero timepoints. Gas exchange analyses are from n = 5 to 7 whole plants per genotype and condition, using methods described in Merilo et al., 2018 (see Materials and methods). Data are presented in absolute (A) and relative (B) units. (C) Stomatal conductances before (gs0) and 50 min (gs50) after changing CO2 from 400 ppm to 800 ppm, average and SE (n = 5 to 7 whole plants). Capital letters denote differences in gs0 (pre-treatment stomatal conductance) between the lines (n = 5 to 7 whole plants, ANOVA, p=0.000000), whereas stars denote whether gs50 is significantly different from gs0 of that line (n = 5 to 7 whole plants, ANOVA, p=0.00001). (D) Half-response times of stomatal closures in response to 50 min CO2 enrichment. Capital letters denote significant differences between the lines (n = 5 to 7 whole plants, ANOVA, p=0.000023).
-
Figure 9—source data 1
Stomatal conductance values of individual plants and half response times.
- https://cdn.elifesciences.org/articles/56351/elife-56351-fig9-data1-v2.xlsx
Figure 9—figure supplement 1
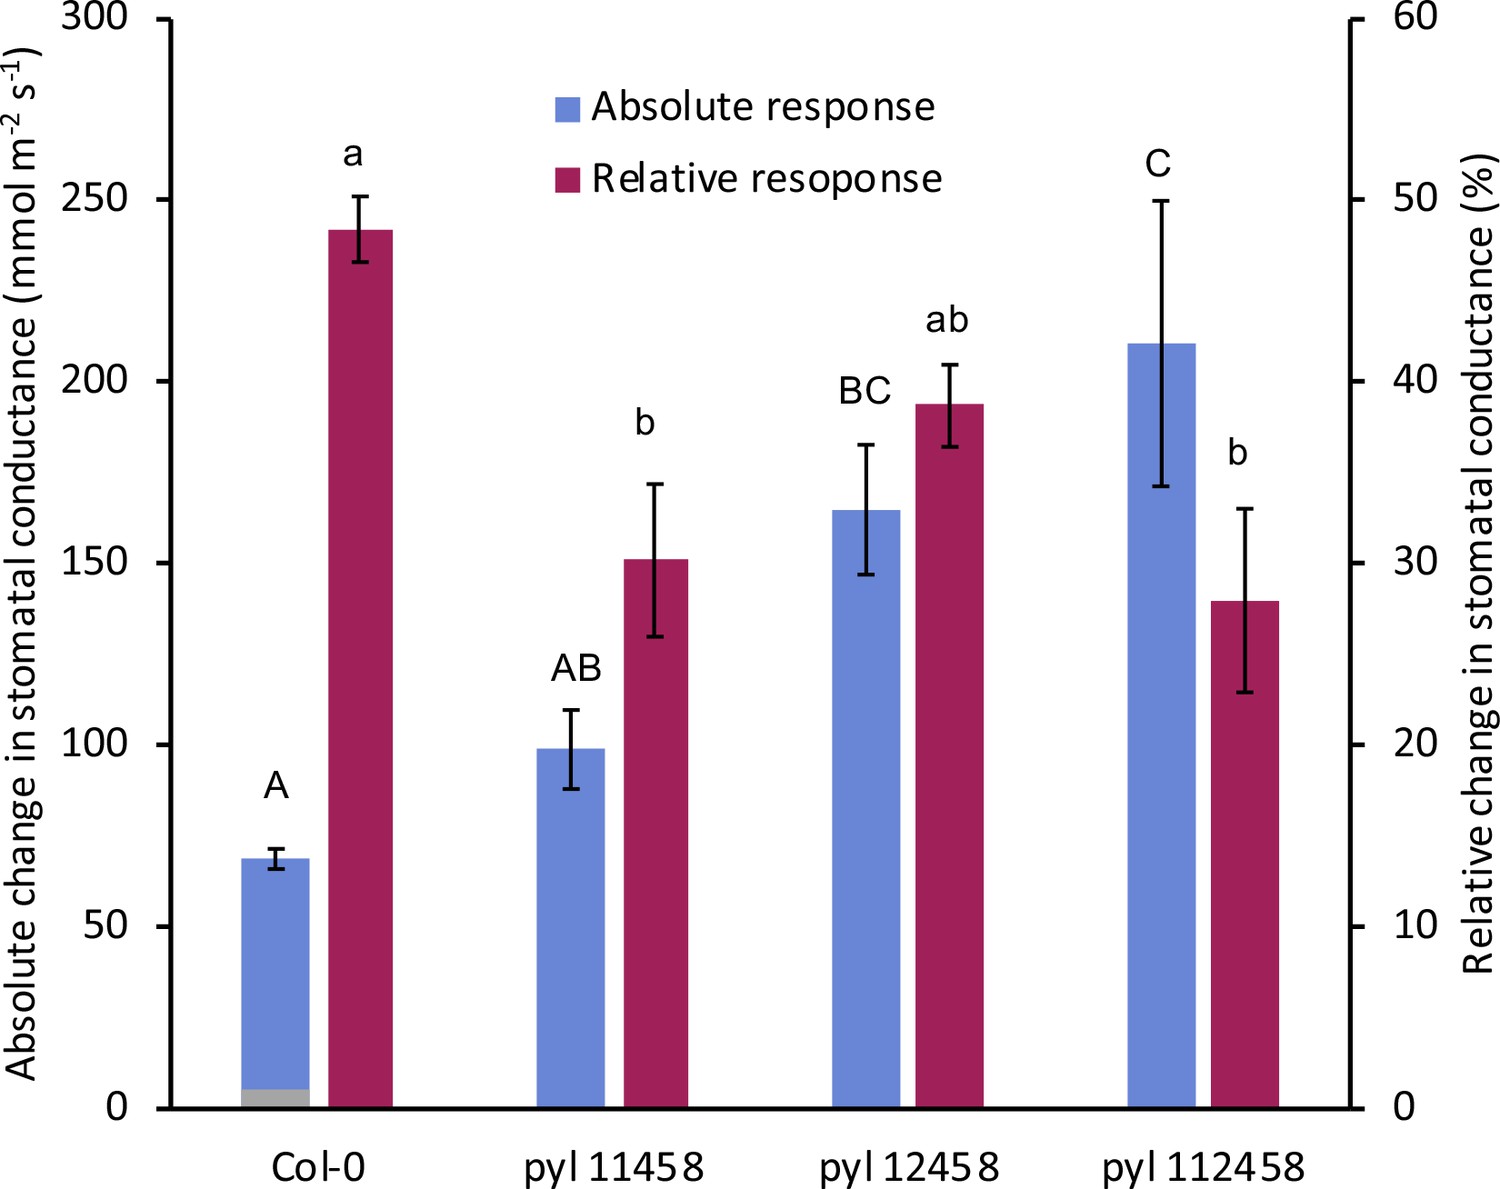
PYR/RCAR ABA receptor pyr1 pyl2/4/5/8 quintuple mutant (pyl-12458) and pyr1 pyl1/2/4/5/8 (pyl-112458) sextuple mutant show larger absolute stomatal closing responses during the first 20 min under elevated CO2 compared to wild-type (Col-0) (light blue bars).
Changes in stomatal conductance (gs) after the first 20 min CO2 elevation (gs20) in absolute units (left Y axis scale mmol m−2 s−1) and relative units (right Y axis scale in %: (gs0-gs20)/gs0). gs0 = steady state stomatal conductances prior to CO2 elevation. In absolute units, pyrpyl sextuple mutant stomata close the most (light blue bars: pyl-112458). In contrast, in normalized units, the pyrpyl sextuple appears to close stomata the least compared to wild-type (dark purple bars), high-lighting pitfalls of gs normalization. Capital letters show differences in absolute responses (p=0.000158), whereas lower case letters in relative responses (p=0.00158; ANOVA, generalized linear model and Tukey post-hoc).
-
Figure 9—figure supplement 1—source data 1
Absolute and relative changes in stomatal conductance values used in Figure 9—figure supplement 1.
- https://cdn.elifesciences.org/articles/56351/elife-56351-fig9-figsupp1-data1-v2.xlsx
Figure 9—figure supplement 2
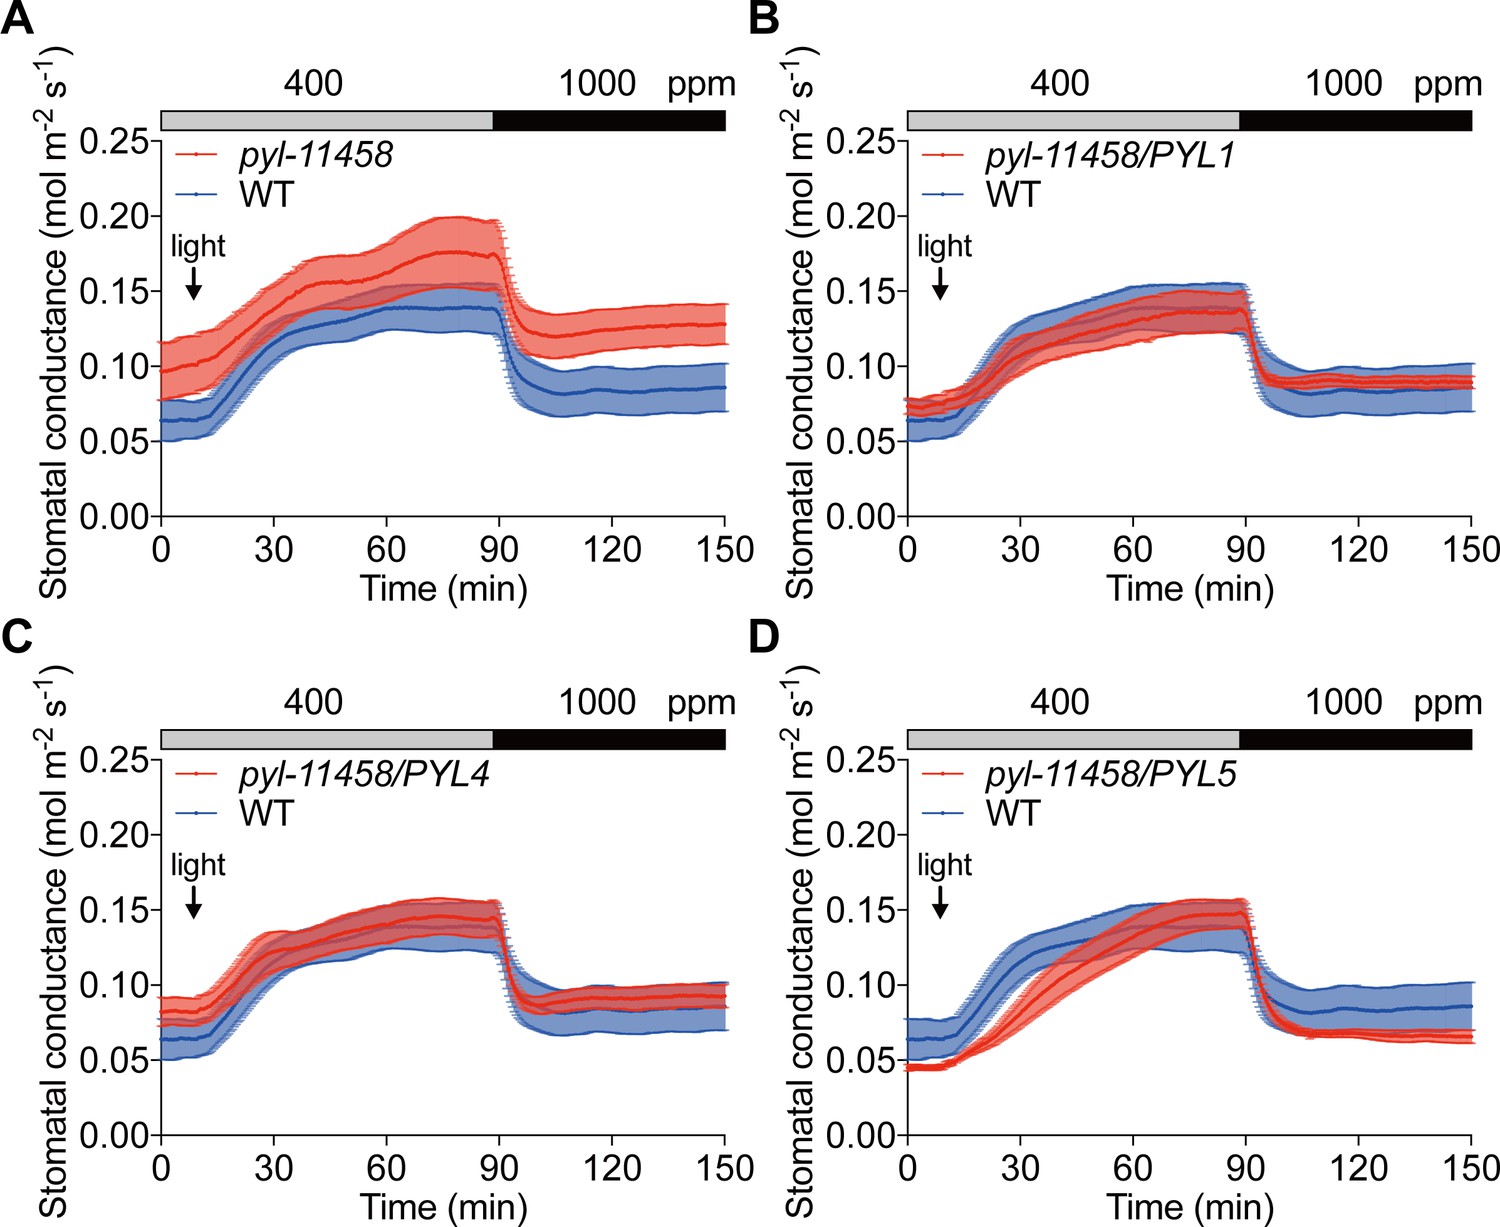
Stomata of ABA receptor quintuple mutant (pyr1/pyl1/pyl4/pyl5/pyl8) and guard cell-targeted (B) PYL1 and (C) PYL4 ABA receptor complemented plants show stomatal CO2 responses similar to wild-type (Col-0) controls.
Time-resolved stomatal conductance responses to changes in light and CO2 concentration in Col-0 (WT; A–D). (A) pyr1/pyl1/pyl4/pyl5/pyl8 quintuple mutant (pyl-11458). (B) pyr1/pyl1/pyl4/pyl5/pyl8/pGC1::PYL1 (pyl-11458/PYL1). (C) pyr1/pyl1/pyl4/pyl5/pyl8/pGC1::PYL4 (pyl-11458/PYL4). (D) pyr1/pyl1/pyl4/pyl5/pyl8/pGC1::PYL5 (pyl-11458/PYL5). Gas exchange experiments of intact leaves commenced under dark treatment and then leaves were exposed to 125 µmol m−2s−1 continuous light as indicated by arrow in each panel. CO2 concentrations are shown on top of the data traces in each panel. Note that WT traces in A to D are the same for comparisons, as the indicated genotypes were measured within the same experiments. Note that steady state stomatal conductance levels in pyl-11458 mutants are conditional. Data represent mean of stomatal conductances ± sem. WT (n = 4), pyl-11458 quintuple (n = 4), pyl-11458/PYL1 (n = 4), pyl-11458/PYL4 (n = 5), and pyl-11458/PYL5 (n = 4).
-
Figure 9—figure supplement 2—source data 1
Stomatal conductance values of individual plants used in Figure 9—figure supplement 2.
- https://cdn.elifesciences.org/articles/56351/elife-56351-fig9-figsupp2-data1-v2.xlsx
Figure 9—figure supplement 3

Genotyping of ABA receptor multiple mutants and guard cell-targeted ABA receptor complemented plants.
(A) Col-0 (WT) and ABA receptor higher-order mutants were confirmed by primers targeting WT or mutant alleles. Primer pairs: PYR1 (PYR1-F + PYR1-R), PYL1 (PYL1-F + PYL1-R), PYL1 mutant (PYL1-F + LBb1.3), PYL2 (PYL2-F+ PYL2-R), PYL2 mutant (PYL2-F + DS5O), PYL4 (PYL3-F+ PYL4-R), PYL4 mutant (PYL4-F + LB3), PYL5 (PYL5-LP+ PYL5-RP), PYL5 mutant (PYL5-RP + dSpm1), PYL8 (PYL8-F+ PYL8-R), PYL8 mutant (PYL8-F + LB3). (B) Sequence results of PYR1 in WT and pyr1-1 (Q169*) mutant allele in ABA receptor higher-order mutants. (C) Confirmation of pGC1::PYL1, pGC1::PYL4, and pGC1::PYL5 transgenes in corresponding transgenic lines, pyl-11458/PYL1, pyl-11458/PYL4, and pyl-11458/PYL5. PCR reactions were performed using pGC1-F paired with PYL1-R, PYL4-R, or PYL5-R to amplify transgenes. Primer sequences are listed in Supplementary file 2.
Tables
Key resources table
| Reagent type (species) or resource | Designation | Source or reference | Identifiers | Additional information |
|---|---|---|---|---|
| Gene (Arabidopsis) | AKS1 | Tair (https://www.arabidopsis.org/) | Tair ID: At1g51140 | |
| Gene (Arabidopsis) | 14-3-3, GF14phi | Tair (https://www.arabidopsis.org/) | Tair ID: At1g35160 | |
| Strain, strain background (Escherichia coli) | BL21-CodonPlus (DE3) | Agilent Technologies | Model: 230245 | Electro-competent cells |
| Strain, strain background (Agrobacterium tumefaciens) | GV3101 | Other | Widely distributed | |
| Antibody | Anti-FLAG M2 Mouse monoclonal | Sigma-Aldrich | RRID:AB_262044 | x5,000 |
| Chemical compound, drug | K-252a | Sigma-Aldrich | Cas No. 99533-80-9 | |
| Chemical compound, drug | W-7 | Sigma-Aldrich | Cas No. 61714-27-0 | |
| Chemical compound, drug | MeJA | Bedoukian Research, Inc | Ct. 06810–4192 | |
| Software, algorithm | MetaFluor software | MetaFluor(https://www.moleculardevices.com/products/cellular-imaging-systems/acquisition-and-analysis-software/metamorph-microscopy) | RRID:SCR_014294 | version 7.0r3 |
| Software, algorithm | Fiji software | Fiji (https://imagej.net/Fiji) | RRID:SCR_002285 | |
| Software, algorithm | GraphPad Prism software | GraphPad Prism (https://graphpad.com) | RRID:SCR_015807 | version 7.0 |
Additional files
-
Supplementary file 1
Transgenic lines used in this study.
Detailed information on the transgenic lines is provided including the plasmid, promoter, and genetic background.
- https://cdn.elifesciences.org/articles/56351/elife-56351-supp1-v2.docx
-
Supplementary file 2
Primer sequences for genotyping.
Primers used to genotype higher order ABA receptor mutants (Figure 9—figure supplement 3).
- https://cdn.elifesciences.org/articles/56351/elife-56351-supp2-v2.docx
-
Transparent reporting form
- https://cdn.elifesciences.org/articles/56351/elife-56351-transrepform-v2.pdf
Download links
A two-part list of links to download the article, or parts of the article, in various formats.
Downloads (link to download the article as PDF)
Open citations (links to open the citations from this article in various online reference manager services)
Cite this article (links to download the citations from this article in formats compatible with various reference manager tools)
FRET kinase sensor development reveals SnRK2/OST1 activation by ABA but not by MeJA and high CO2 during stomatal closure
eLife 9:e56351.
https://doi.org/10.7554/eLife.56351


