Stem cell niche exit in C. elegans via orientation and segregation of daughter cells by a cryptic cell outside the niche
- Department of Biology, The University of North Carolina at Chapel Hill, United States
- Department of Biology, Duke University, United States
- Regeneration Next, Duke University, United States
Figures
Figure 1 with 1 supplement

Sh1 is present in the distal gonad and intercalates with the processes of the DTC.
(A) Schematic depiction of the previous model of gonad morphology of C. elegans hermaphrodite adults with a germ cell ‘bare region’ (after [Lints and Hall, 2018]). Germ cell nuclei shown in pink, DTC in yellow, sheath in cyan (with Sh1 proximal boundary represented by line near bend). Regions of germ line shown in blow-up below, after (Crittenden et al., 2006). (B) Micrographs showing the gonad in DIC with fluorescent overlay (top) of the DTC (yellow, lag-2p::mNeonGreen::PLCδPH) and Sh1 (cyan, mKate2::inx-8), fluorescence only (middle, projection from rachis up through surface of gonad), and DIC only (bottom, single slice through rachis). Images taken at 400x magnification, composite of two tiled fields of view. Scale bar 20 μm. (C) New model based on our observation that Sh1 and the DTC intercalate in the distal gonad. With the DTC closely bordered by an adjacent somatic Sh1 cell, the delineation of the stem cell population is unclear. DTC in yellow, Sh1 in cyan, and germ cell nuclei in pink. (D) Model of cross section of gonad, showing deep Sh1 cell in dark turquoise in addition to superficial Sh1 cell in cyan, DTC processes both superficial and deep in yellow, and germ cell membranes and nuclei in pink. Central void is the rachis. See also Figure 1—figure supplement 1.
Figure 1—figure supplement 1
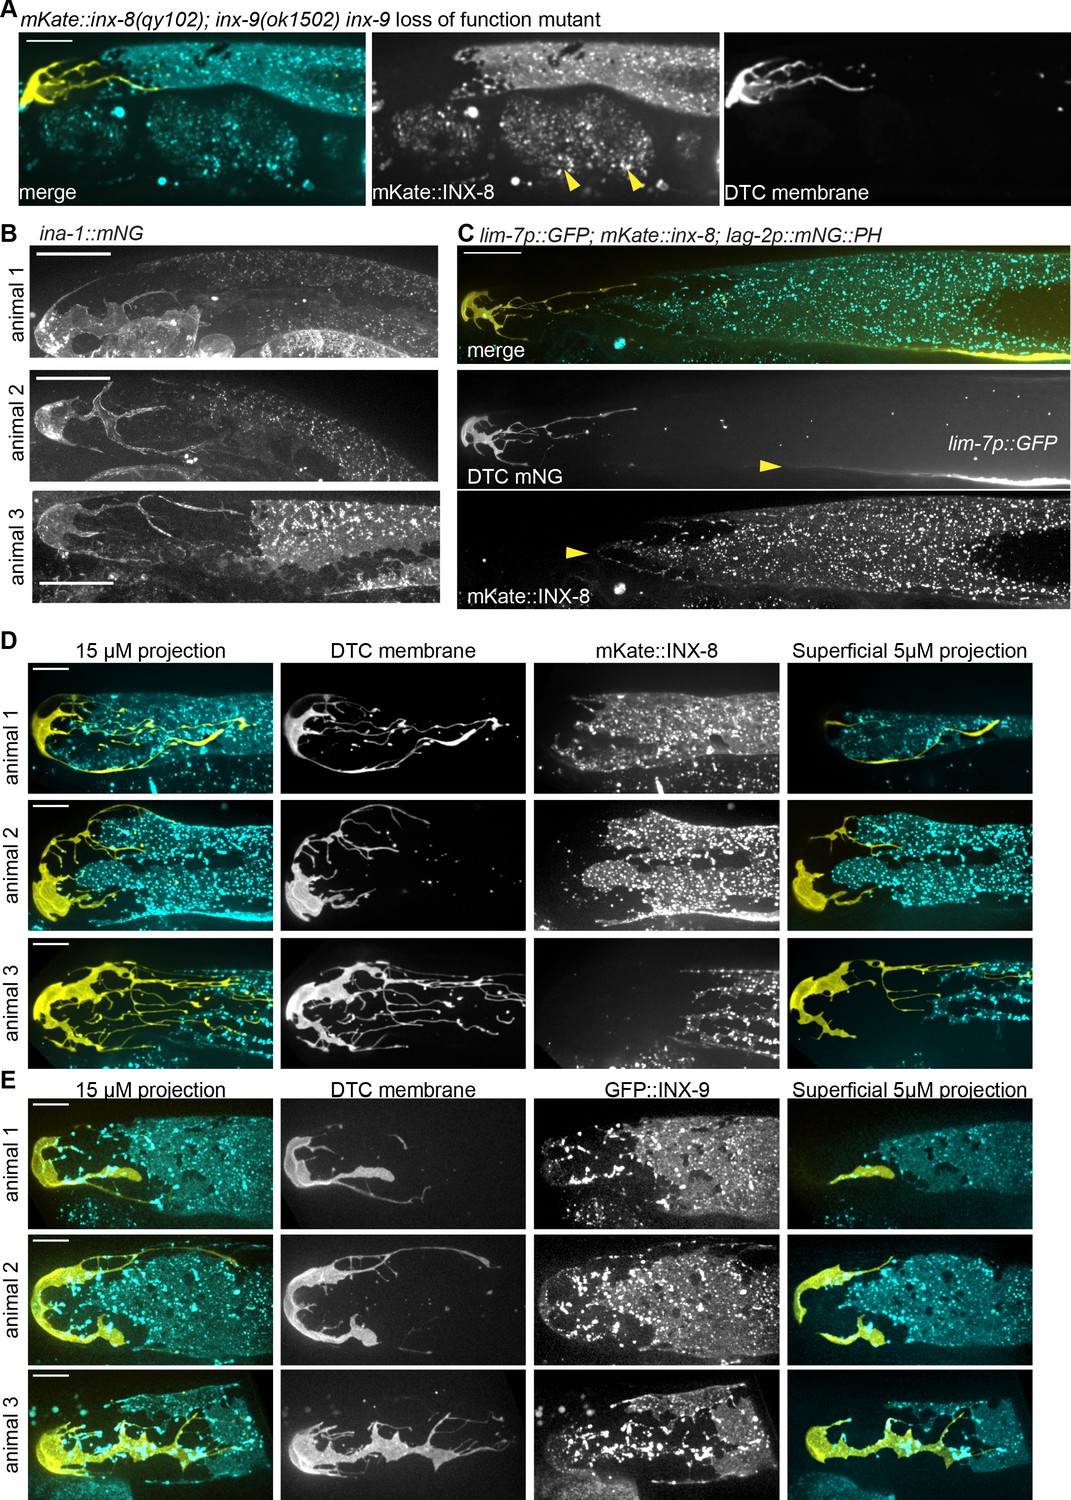
Endogenously tagged proteins label the somatic gonad, which has significant inter-individual variation and no ‘bare region’.
Related to Figure 1. (A) mKate::inx-8(qy102) (cyan) is compatible with fertility in the inx-9(ok1502) loss of function mutant background. Allele inx-8(qy102) is an independently generated allele with the same mKate insertion as inx-8(qy78). The gonad, especially DTC (yellow, lag-2p::mNeonGreen::PLCδPH) is grossly normal, consistent with proliferating germ cells, and embryos (yellow arrows) are present in the uterus. Scale bar 20 μm, image acquired under lower magnification compared to subsequent panels. (B) One-day adult hermaphrodite gonads expressing endogenously tagged α-integrin subunit ina-1(qy23(ina-1::mNG)) (Jayadev et al., 2019). This strain provides independent confirmation that there is a DTC-Sh1 interface in adults. The Sh1 cell extended substantially distal to the proximal extent of the DTC in 40/48 samples, with the remaining 8/48 terminating within ~1 gcd of each other. Scale bar 20 μm. (C) One-day adult hermaphrodite gonad expressing inx-8(qy78(mKate::inx-8)) and tnIs6(lim-7p::GFP) with lag-2p::mNeonGreen:: PLCδPH DTC membrane marker. Top panel shows merged projection through superficial half of gonad. Second panel shows DTC expression at the left and cytoplasmic GFP in the sheath at right bottom. Bottom panel shows mKate::INX-8 expression in more distal sheath projections. Scale bar 20 μm. Cytoplasmic GFP is not expressed equally in both Sh1 cells of the pair, and/or there is so little cytoplasm in the membranous sheath projections that it can be difficult to detect them with this marker. Three distal gonads from each strain (D) mKate::inx-8(qy78) (cyan), labelling distal Sh1 and some DTC (yellow, lag-2p::mNeonGreen:: PLCδPH) processes, and (E) GFP::inx-9(qy79) (cyan) labelling distal Sh1 and bright puncta in the DTC (yellow, lag-2p::2xmKate::PLCδPH), which exemplify the extent of natural variation in otherwise wild-type young adult DTC and Sh1 shapes and positions. Maximum intensity projections through 15 μm Z depth (left three columns) or 5 μm (right column). All scale bars in D and E 10 μm.
Figure 2 with 2 supplements
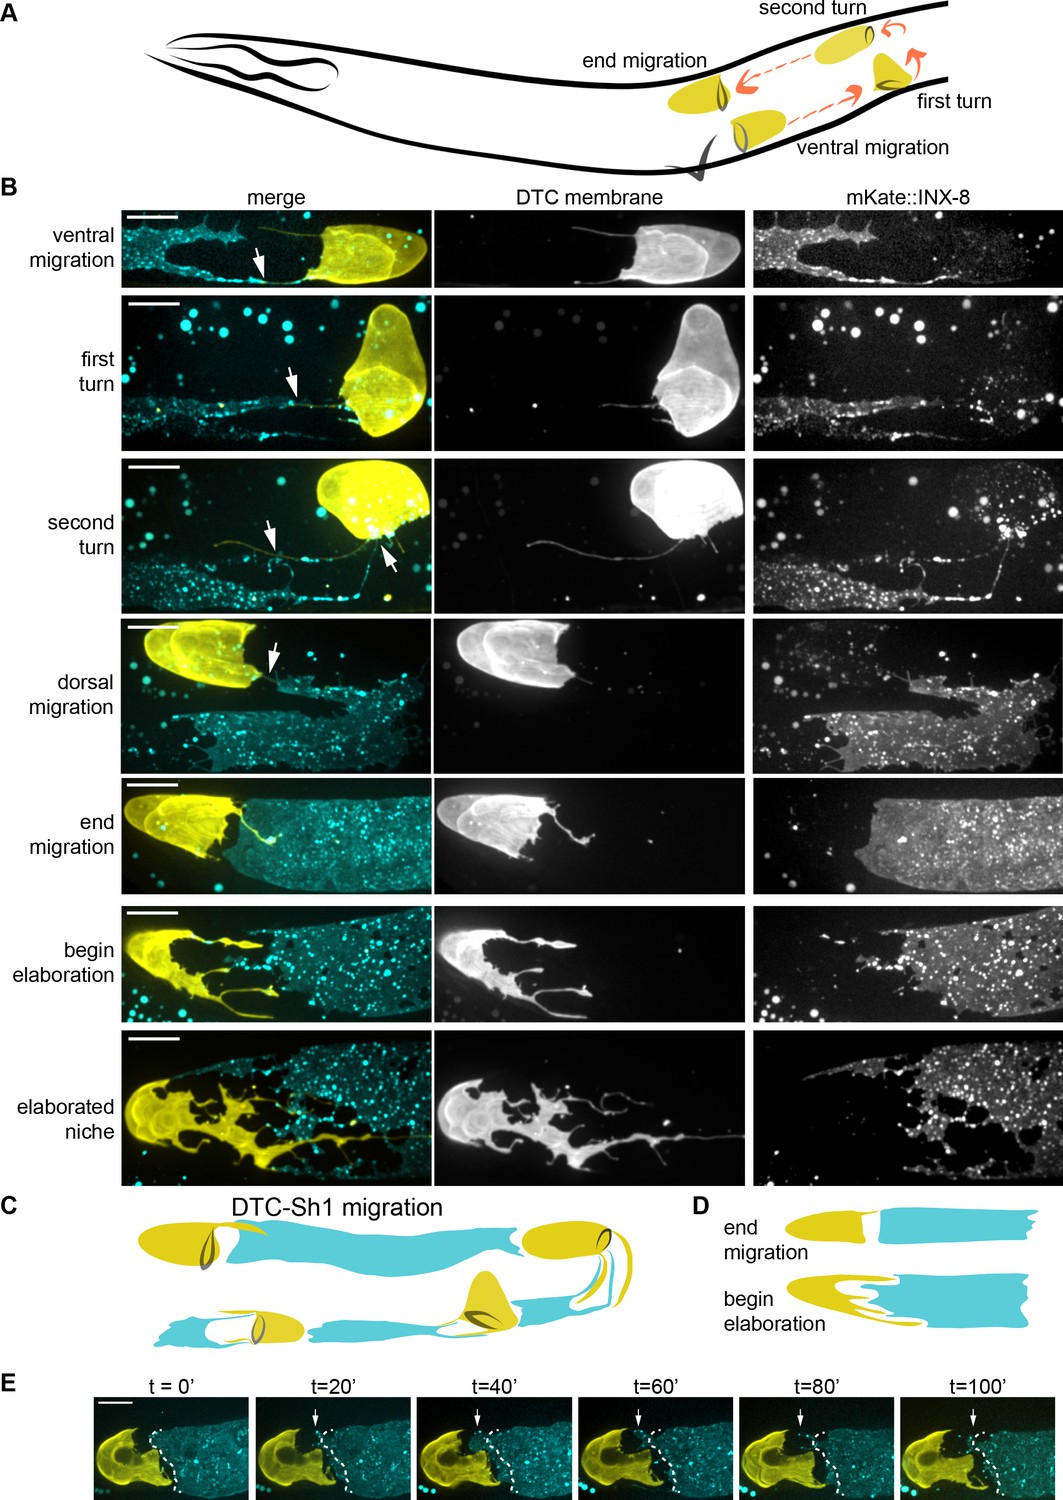
The DTC and Sh1 cells are closely apposed throughout development.
(A) Schematic depiction of C. elegans DTC (yellow) migration path (orange arrows) during development, timing after (Lints and Hall, 2018): ventral migration begins at 21 hr post hatching; first turn at 30 hr post hatching, second turn at 33 hr post hatching, and end migration at 45 hr post hatching. (B) Time course analysis of somatic gonad elongation. DTC (yellow, lag-2p::mNeonGreen::PLCδPH) and Sh1 (cyan, mKate2::inx-8, also detected in larval DTC). The two cells are in contact or within one germ cell diameter throughout development (white arrows). (C) New model of gonad development including Sh1 cell (only one of pair shown). (D) Schematic showing of the DTC-Sh1 boundary transformation between the end of migration and beginning of elaboration. (E) Stills from a time-lapse movie (Figure 2—video 1) of same strain shown above. Dashed white line shows position of distal Sh1 at time 0 in all subsequent panels; note remodeling of Sh1 back and forth to extend and close this distance (arrows). All scale bars 10 μm. See also Figure 2—video 1 and Figure 2—figure supplement 1.
Figure 2—figure supplement 1
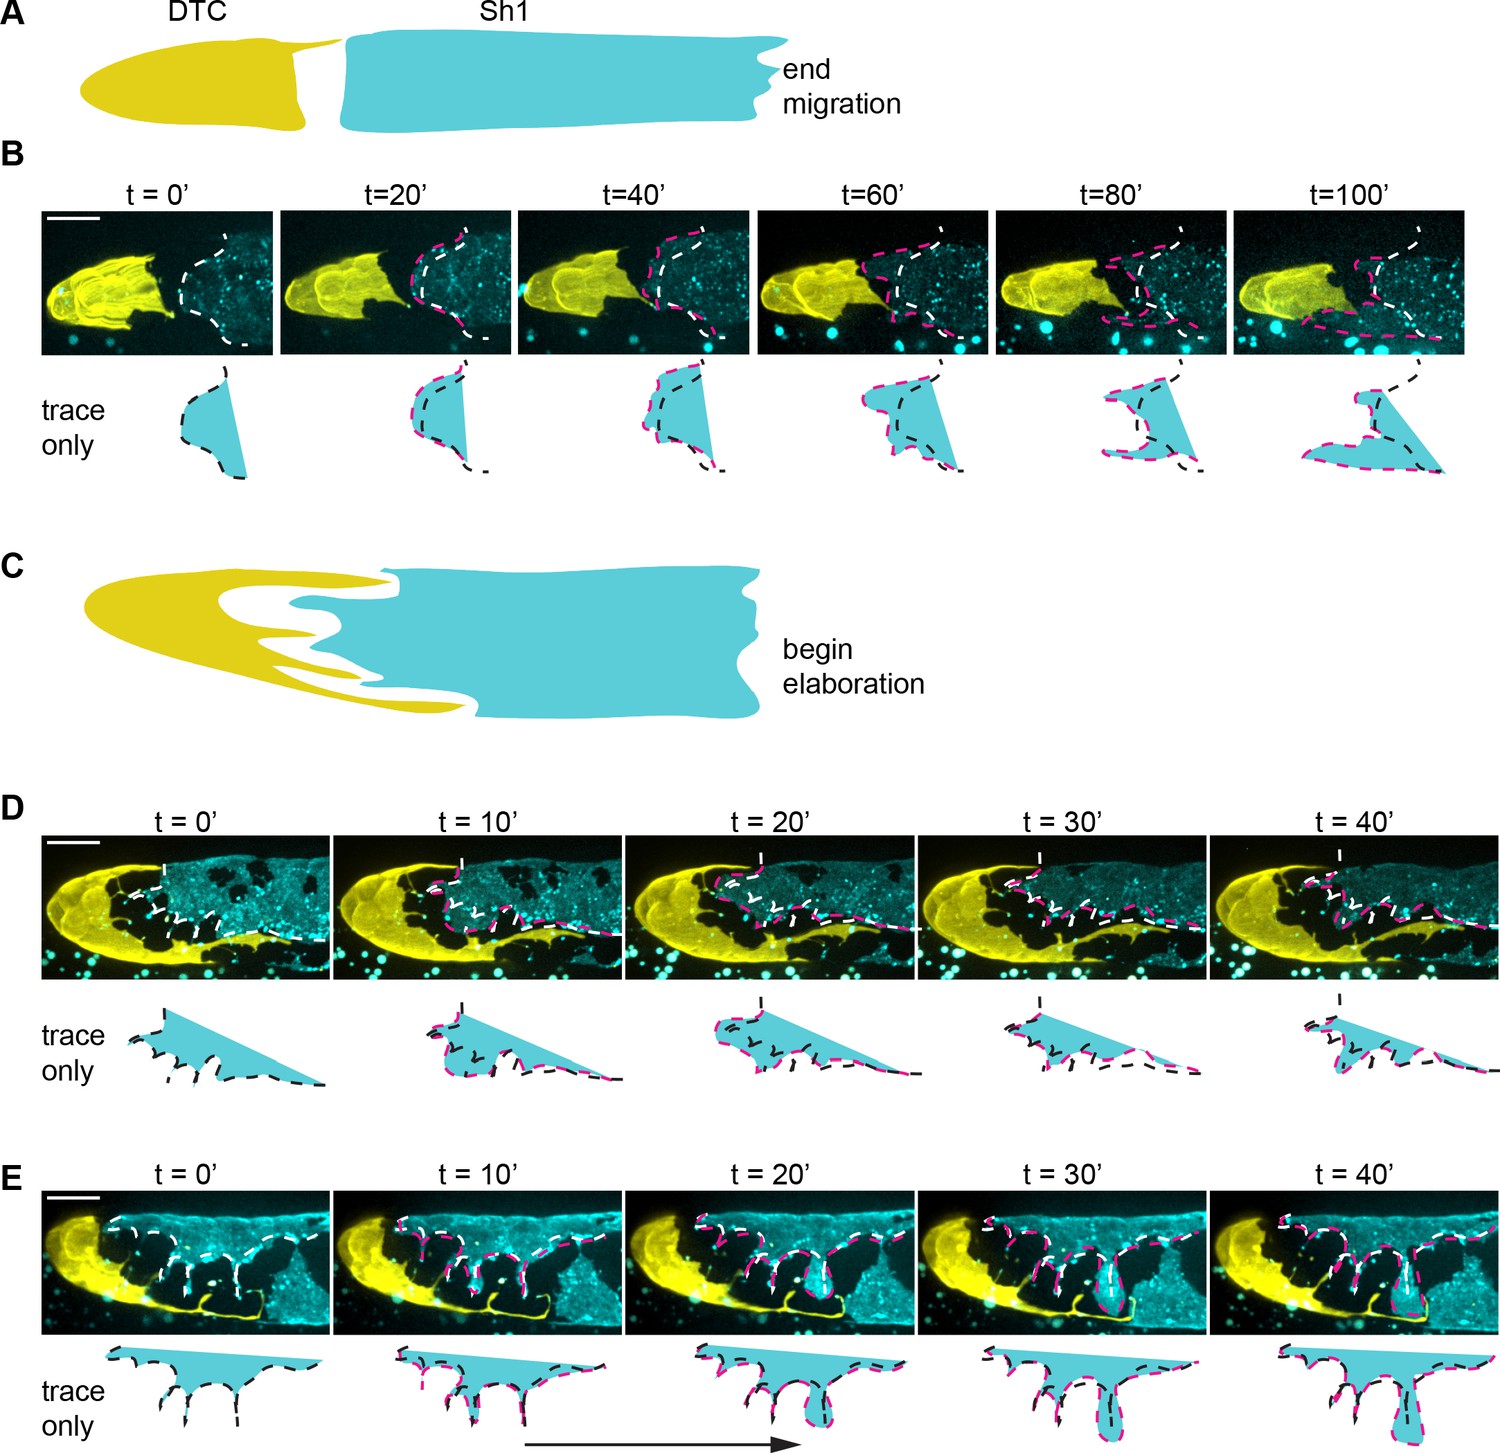
Time-lapse imaging of the DTC-Sh1 interface after gonad migration shows a dynamically remodeled Sh1 cell and relatively static DTC.
Related to Figure 2 and Figure 2—video 1. Maximum intensity projections from time-lapse movies taken in a strain expressing DTC membrane marker (lag-2p::mNeonGreen::PLCδPH) and Sh1-marking mKate::inx-8(qy78). (A, B) Gonads at the end of migration and (C–E) at the early stages of DTC elaboration. Sh1 grows continuously at all time points into the gap separating it from the DTC, but not uniformly across its edge or unidirectionally proximal to distal. Traces of the Sh1 distal edge are shown overlaying images and separately below; they demonstrate substantial Sh1 growth from its starting position (white in overlay/black in traces) to its final location (pink outline/cyan shading). Note that Sh1 both surpasses its initial boundary and retreats behind it in different regions of its edge, suggesting localized cues that trigger or permit growth. This growth can be rapid and substantial (for example see arrow in E). All scale bars 10 μm.
Figure 2—video 1
The DTC stretches while Sh1 grows dynamically to elaborate.
Related to Figure 2. Time-lapse movie of the DTC (yellow, lag-2p::mNeonGreen::PLCδPH) and Sh1 (cyan, mKate2::inx-8). Arrow indicates dynamically growing distal edge of Sh1. Maximum intensity projection of 1 μm confocal z-slices through superficial half of distal gonad. Images taken every ten minutes. Movie plays at two fps. 1000x magnification. Scale bar is 10 μm.
Figure 3 with 2 supplements
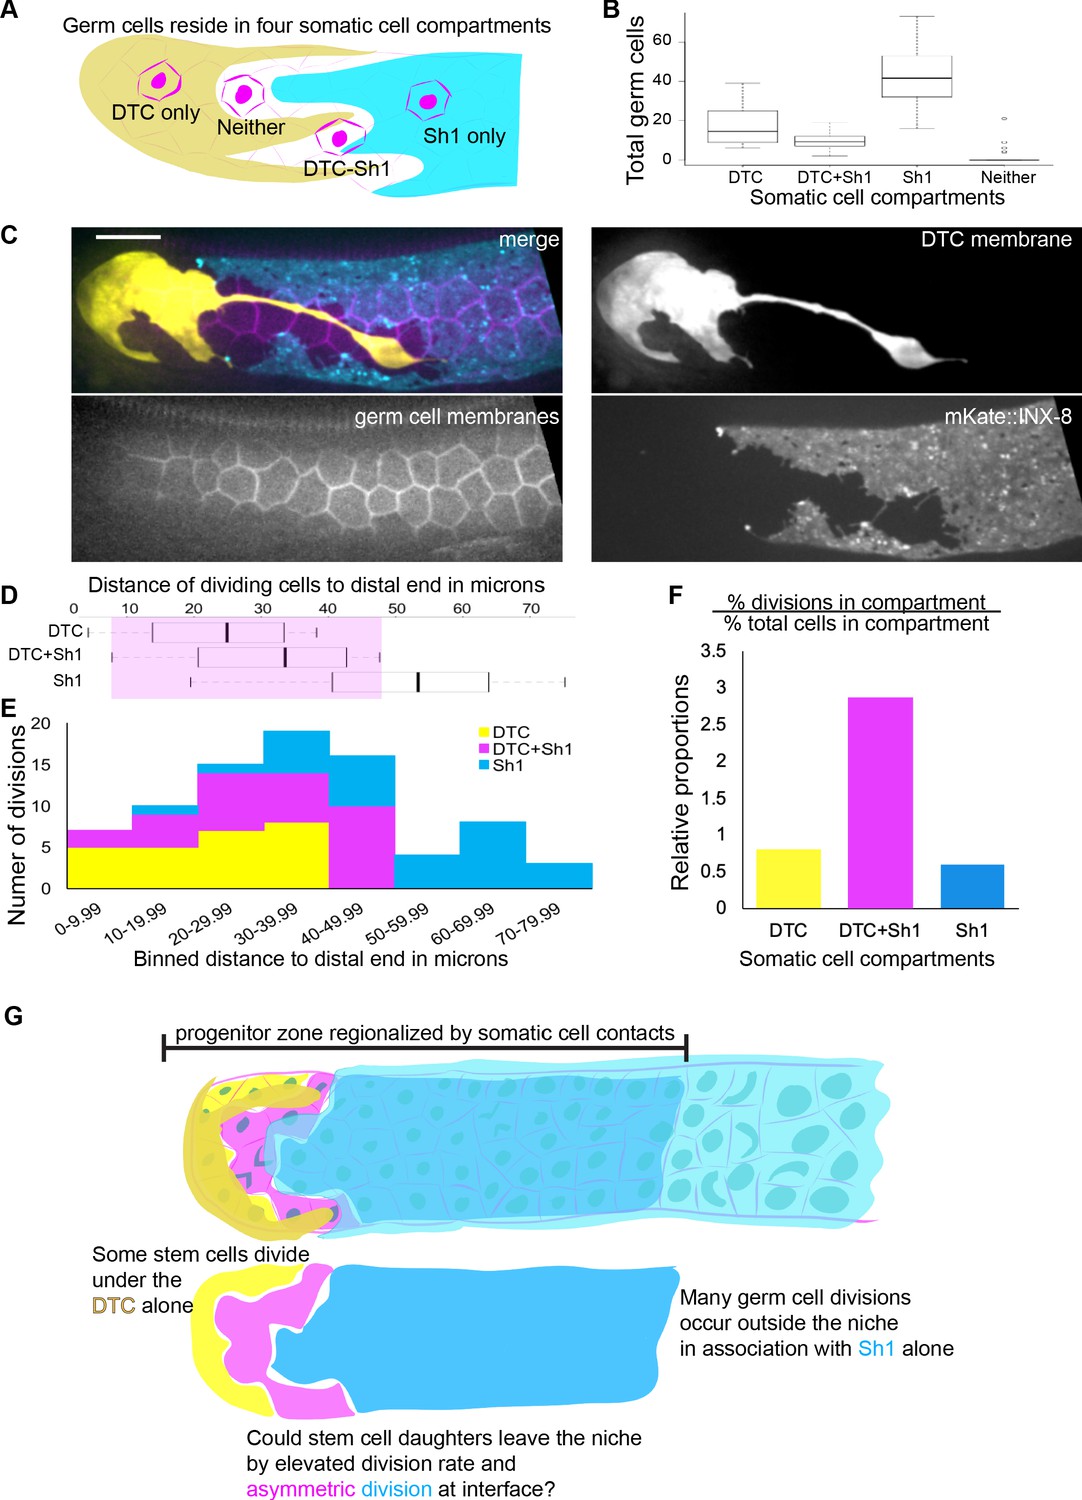
Most germ cells contact one or both somatic cells, and divisions are enriched at the DTC-Sh1 interface.
(A) Schematic depicting germ cells in four somatic cell compartments defined by contact with the DTC, Sh1, DTC-Sh1, or neither. (B) Box and whisker plot showing the number of germ cells in each somatic compartment in 26 one-day adult animals (n = 1843 germ cells counted Figure 3—source data 1.). Very few germ cells contact neither somatic cell, while a minority contact both the DTC and Sh1. (C) Example micrograph showing that all germ cell membranes (magenta, mex-5p::GFP:: PLCδPH) in the distal gonad contact the soma (DTC: yellow, lag-2p::mTag:BFP::PLCδPH and/or Sh1: cyan, mKate2::inx8) with no germ cell bare region. Scale bar 10 μm, and images are to scale with distance axes in panels D and E. (D) Distance from the distal tip of n = 25 DTC-associated divisions, n = 29 DTC-Sh1 divisions, and n = 28 Sh1-associated divisions in 38 adult animals with germ cell nuclei (mex-5p::H2B::mCherry) and membranes (mex-5p::GFP:: PLCδPH), DTC membrane (lag-2p::mTag:BFP::PLCδPH) and Sh1 membrane (mKate2::inx8) labeled Figure 3—source data 2. No divisions of a ‘bare’ germ cell were observed. Shaded box shows range of distances in which the DTC and Sh1 were both sometimes observed. (E) The same 82 germ cell divisions as in D, plotted by binned distance from the distal tip, and colored by somatic cell contact with DTC (yellow), DTC-Sh1 (magenta), and Sh1 (cyan). (F) Relative proportions of germ cell division to total germ cells among 25 time-lapsed cell divisions in nine animals Figure 3—source data 3. These data are concordant with proportions for all measured divisions in each compartment over all counted cells in each compartment Figure 3—source data 2. The percentage of germ cell divisions in contact with the DTC alone is proportional to the percentage of all germ cells in contact with the DTC alone (yellow, p=1.0). Divisions in contact with Sh1 alone are slightly underrepresented (cyan p=0.13), likely because some of the germ cells in contact with Sh1 are already in meiotic S phase and therefore are not able to undergo mitosis (Fox and Schedl, 2015). Divisions at the interface (pink) are overrepresented threefold relative to the percentage of DTC-Sh1 associated germ cells (prop.test, Bonferroni corrected p=0.0012327, see Materials and methods). (G) Schematic depicting progenitor zone regionalization by somatic cell contacts. The territory in which dividing germ cells are found (the progenitor zone) contains three groups of dividing cells (uncovered germ cells in 3A and 3B were not found in substantial numbers and were not observed dividing). Previous research suggests the cells directly in contact with the DTC are stem cells, but we now can resolve two groups—those contacting the DTC alone (yellow) and DTC-Sh1 interface cells (magenta). The remaining dividing cells are outside the niche and in contact with Sh1 alone (cyan). Based on frequent divisions that segregated one daughter cell under the Sh1 in DTC germ cells that divided at the DTC-Sh1 boundary, we hypothesized that DTC-Sh1 interface cells might divide asymmetrically and thereby allow stem cell daughters to leave the niche. See also Figure 3—video 1 and Figure 3—figure supplement 1.
-
Figure 3—source data 1
Somatic cell contacts of germ cells in superficial portions of 26 young adult hermaphrodite gonads.
- https://cdn.elifesciences.org/articles/56383/elife-56383-fig3-data1-v2.xlsx
-
Figure 3—source data 2
Somatic cell contacts of 82 dividing cells.
- https://cdn.elifesciences.org/articles/56383/elife-56383-fig3-data2-v2.xlsx
-
Figure 3—source data 3
Somatic cell contacts of 25 dividing cells in 9 young adult hermaphrodite gonads with germ cell nuclei and membranes labeled.
- https://cdn.elifesciences.org/articles/56383/elife-56383-fig3-data3-v2.xlsx
Figure 3—figure supplement 1
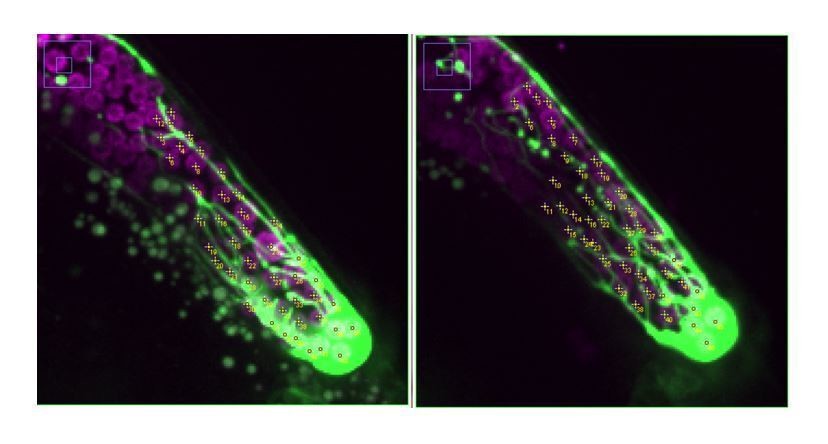
Example of germ cell divisions scored for Figure 3D–F.
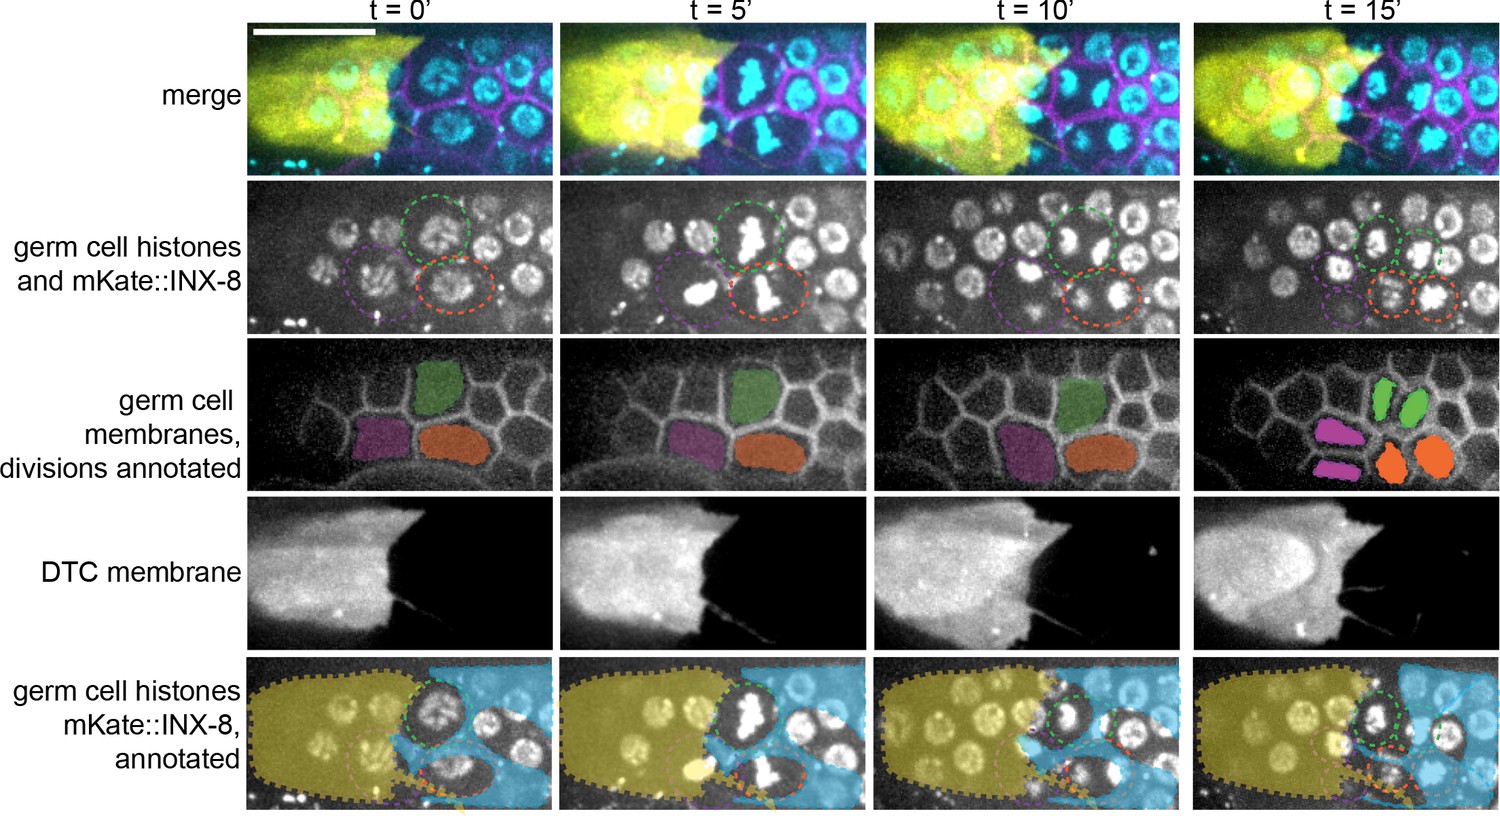
Related to Figure 3. Example time-lapse stills (from Figure 3—video 1) of three cell divisions. The strain carries the following markers: DTC membrane (lag-2p::mTagBFP::PLCδPH), Sh1 (mKate2::inx-8), germ cell membranes (mex-5p::GFP:: PLCδPH), and germ cell nucleus (mex-5p::H2B::mCherry), as described in Figure 3. Maximum intensity projection of 0.25 μm confocal z-slices through superficial 5 μm of distal gonad. Germ cell nuclei are circled in second and bottom row, membranes shaded in third row, and DTC and Sh1 cell positions shaded in bottom row. Scale bar 10 μm.
Figure 3—video 1
Germ cells divide at the DTC-Sh1 interface and segregate between the two.
Related to Figure 3. Three germ cells divide (one obscured by DTC at bottom). DTC (yellow, lag-2p::mTag:BFP::PLCδPH), Sh1 (cyan, mKate2::inx8), and germ cell membranes (magenta, mex-5p::GFP:: PLCδPH) and nuclei (cyan, mex-5p::H2B::mCherry). Each division leaves one daughter in close contact with the DTC and one with Sh1. Arrows indicate three dividing cells. Maximum intensity projection of 0.25 μm confocal z-slices through superficial 5 μm of distal gonad. Images taken every five minutes. Movie plays at two fps. 1000x magnification. Scale bar is 10 μm.
Figure 4 with 1 supplement
Sh1 separates daughter cells that divide at interface.
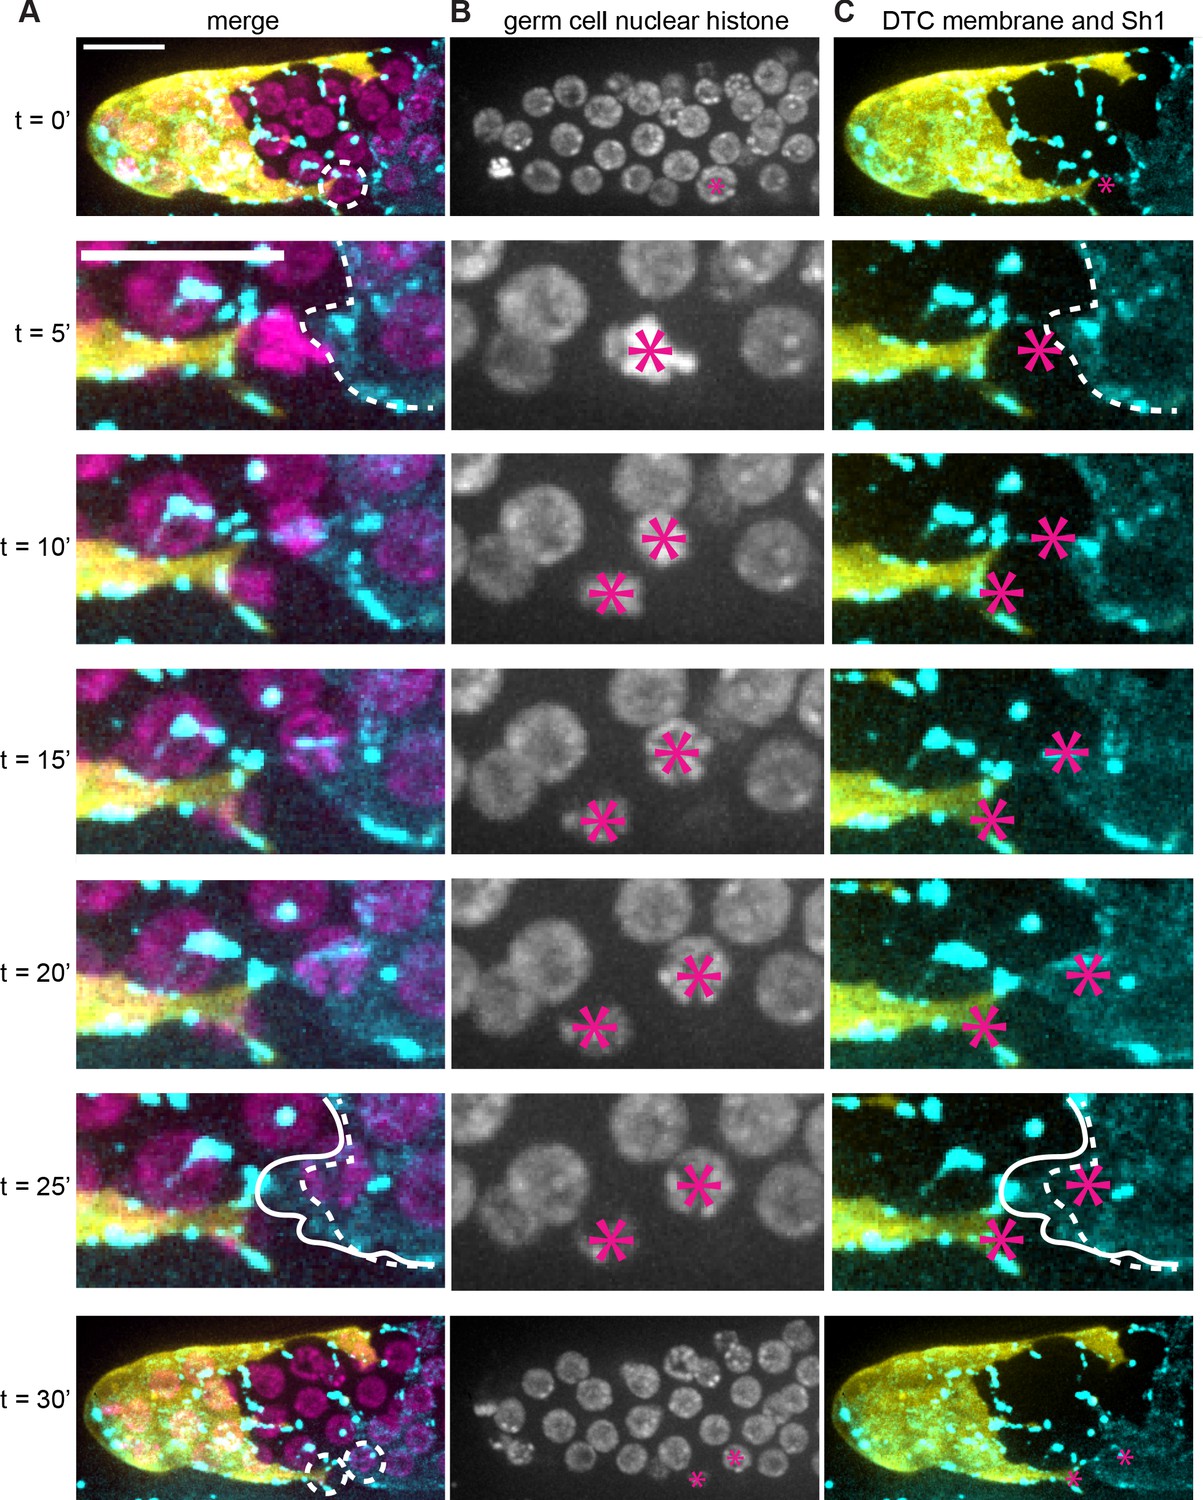
(A) DTC membrane (yellow, lag-2p::mTag:BFP::PLCδPH), germ cell nuclei (magenta, mex-5p::H2B::mCherry), and Sh1 membrane (cyan, GFP::inx9, also expressed in puncta on DTC processes). Dashed circles in top and bottom rows marks focal germ cells enlarged in intervening timepoints; dashed outline in second and sixth rows denote starting position of Sh1 membrane. Solid outline in sixth row indicates Sh1 membrane that has extended beyond its starting position to cover dividing cell. (B) Germ cell nuclei (magenta, mex-5p::H2B::mCherry) channel only. Asterisks mark nuclei of focal cell(s). (C) DTC membrane (yellow, lag-2p::mTag:BFP::PLCδPH) and Sh1 membrane (cyan, GFP::inx9) channels with germ cell asterisks from (B) and annotations from (A). 1000x magnification. Scale bar 10 μm. See also Figure 4—video 1.
Figure 4—video 1
Sh1 separates daughter cells at DTC-Sh1 interface.
Related to Figure 4. DTC membrane (yellow, lag-2p::mTag:BFP::PLCδPH), germ cell nuclei (magenta, mex-5p::H2B::mCherry), and Sh1 membrane (cyan, GFP::inx9, also expressed in puncta on DTC processes). Arrow indicates dividing cell. Sh1 begins to the right of this cell and at the end is covering one daughter cell. Movie plays at two fps. 1000x magnification. Scale bar is 10 μm.
Figure 5
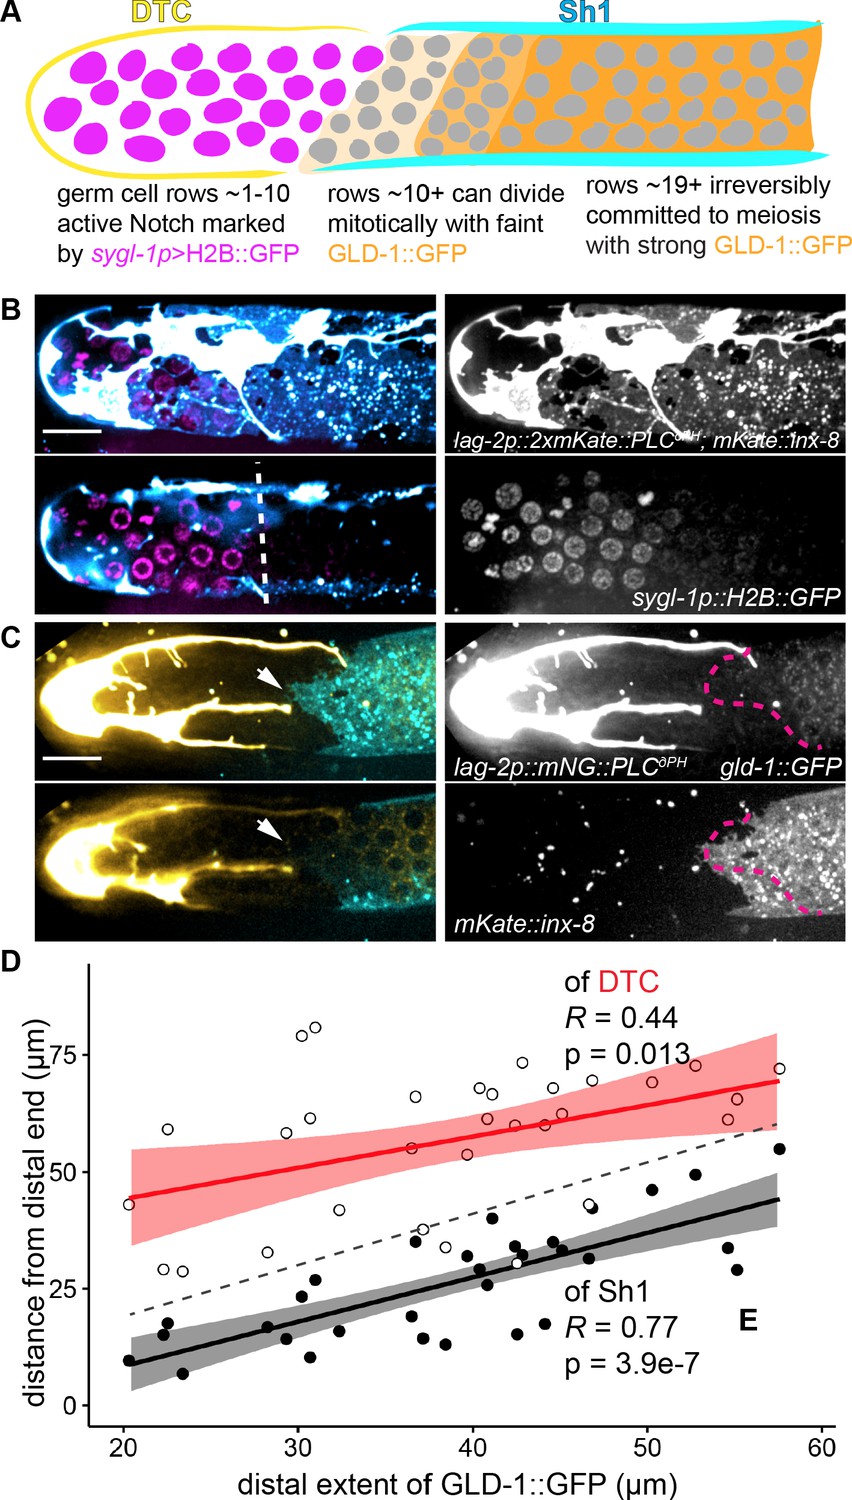
Genetic markers of germ cell fate segregate across DTC-Sh1 interface.
(A) Schematic depicting cross section of C. elegans gonad with regionalization of germ cell fate markers. A sgyl-1p::H2B::gfp transgene (Kershner et al., 2014) is a direct target of active Notch signaling in germ stem cells (magenta). gld-1::gfp transgene (ozIs5) is post-transcriptionally repressed in the stem cell zone (Brenner and Schedl, 2016) and its protein is found at low baseline levels there;it becomes de-repressed and protein accumulates in mitotic germ cells farther from the DTC (light and medium orange shading), and is highly expressed in germ cells committed to meiosis (dark orange shading). Previously reported regions of expression roughly correlate with our observed locations of the DTC (yellow) and Sh1 (cyan) cells. (B) Expression of sgyl-1p::H2B::gfp (magenta) with lag-2p::2xmKate::PLCδPH (cyan/white) marking DTC and mKate::inx-8(qy78) (cyan) marking Sh1. Surface z-projection (top left) and cross section (bottom left), with white dashed line marking the boundary of brightest sgyl-1p::H2B::gfp expression. Grayscale images at right. (C) Expression of gld-1::GFP(ozIs5) (yellow) with lag-2p::mNeonGreen::PLCδPH (yellow/white) marking the DTC and Sh1 (cyan, mKate2::inx-8) marking Sh1. Surface z-projection (top left) and cross section (bottom left), with white arrows indicating the distalmost edge of Sh1. Grayscale images at right, with magenta dashed line showing distalmost boundary of detectable GLD-1::GFP. Note correlation between Sh1 and GLD-1::GFP. (D) Plot of positions in 31 animals of proximal extent of DTC (empty circles, regression in red) or distal extent of Sh1 (filled black dots, regression in black) vs. distal extent of GLD-1::GFP Figure 5—source data 2. R and p values given on graph; confidence intervals shaded around regression lines. Dashed line indicates x = y; data points above this line have a distal boundary of GLD-1::GFP expression that is closer to the distal end than the somatic cell, while data points below the line have a distal boundary of GLD-1::GFP that is farther from the distal end than the somatic cell.
-
Figure 5—source data 1
sygl-1p:: H2B::GFP::sygl-1 3'UTR expression relative to somatic cells.
- https://cdn.elifesciences.org/articles/56383/elife-56383-fig5-data1-v2.xlsx
-
Figure 5—source data 2
gld-1::GFP expression and somatic cell boundaries.
- https://cdn.elifesciences.org/articles/56383/elife-56383-fig5-data2-v2.xlsx
Figure 6 with 2 supplements
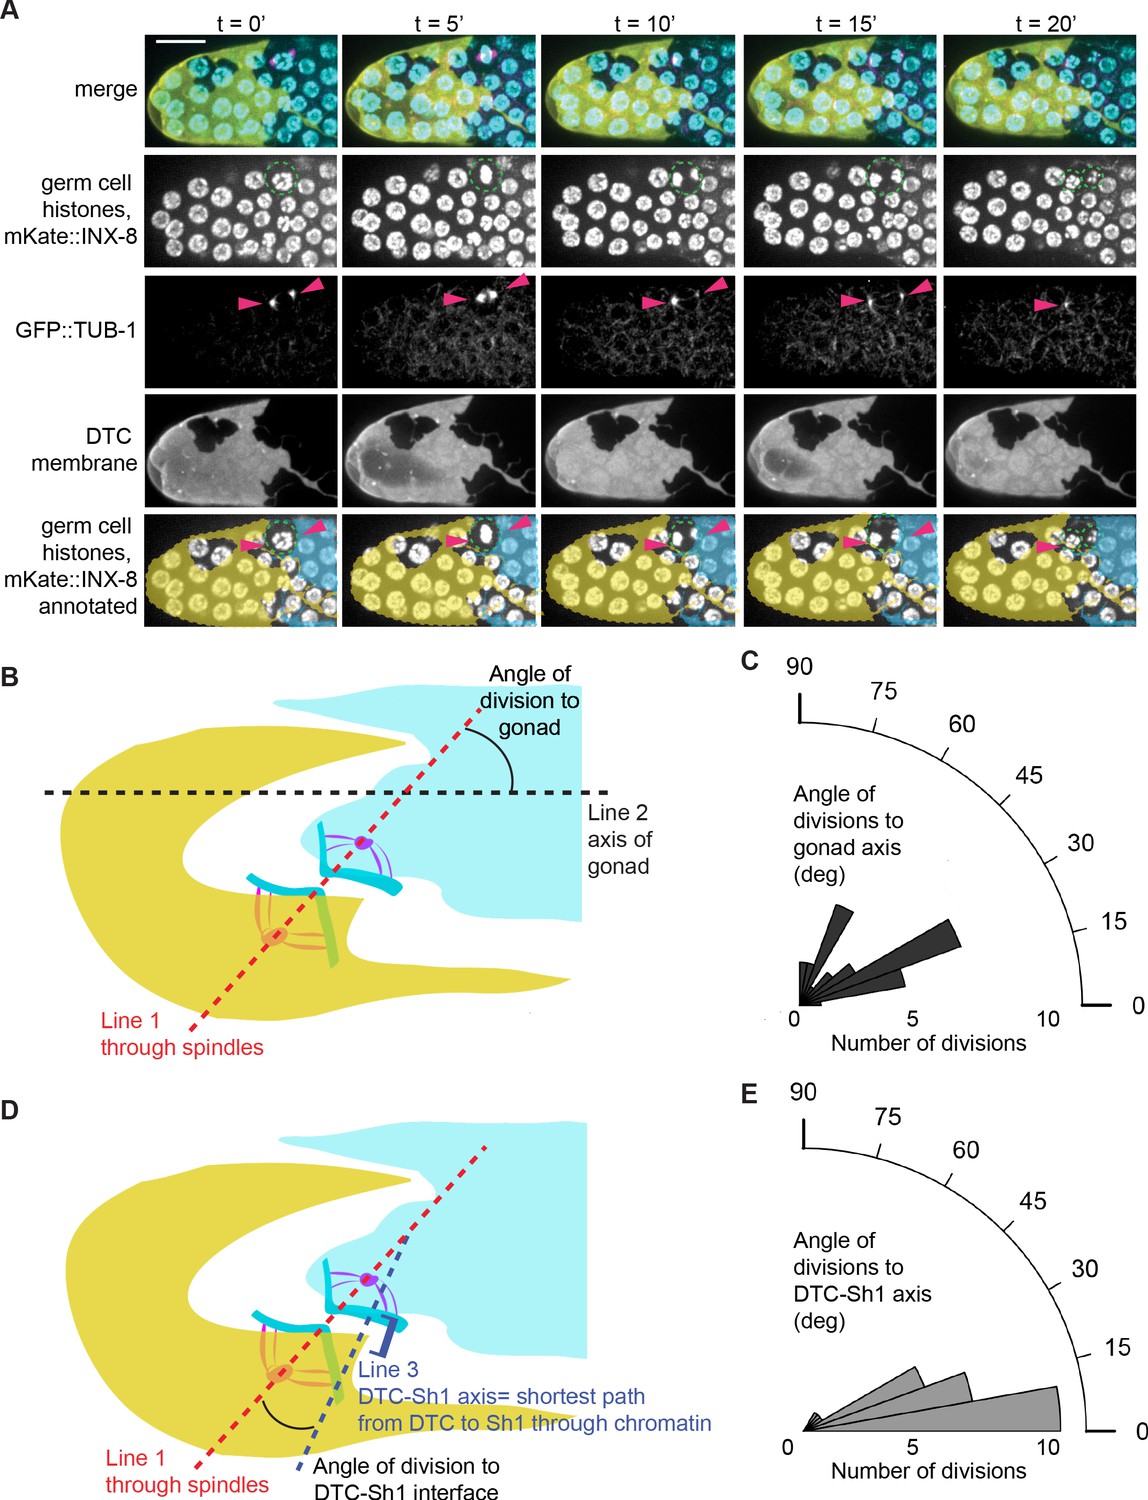
Tubulin spindles polarize to the DTC and Sh1 as germ cells divide at the interface.
(A) Stills from a time-lapse movie (Figure 6—video 1) of a germ cell dividing (dashed outline in second row) at the DTC-Sh1 interface in a young adult animal. DTC (yellow, lag-2p::mTag:BFP::PLCδPH), Sh1 (cyan, mKate2::inx8), germ nuclei (cyan, mex-5p::H2B::GFP), and tubulin (pink, β-tub::GFP). Tubulin spindles are transiently visible (arrowheads in third row). Yellow and cyan overlays in the bottom row mark cell outlines of DTC and Sh1, respectively. Scale bar is 10 μm. (B) Schematic depicting how angle of division to gonad was calculated. For each cell dividing at the interface between the DTC and Sh1 (n = 29) Figure 6—source data 1. Line one was drawn through the spindles into the neighboring soma. Line two was drawn along the distal-proximal axis of the gonad. The angles between Line one and Line two reflect how aligned the spindles are to the axis of the gonad, and are plotted in (C). (D) Schematic depicting how angle of division to DTC-Sh1 interface was calculated. Line one again was drawn through the spindles and into the soma (same as in B). Line three was drawn through the shortest path between DTC and Sh1 that passes through at least one of the chromatin condensations at anaphase; this is the DTC-Sh1 axis. The angles between Line one and Line three reflects how aligned the spindles are to the DTC-Sh1 axis, and are plotted in (E). Note that every angle was expressed as an acute angle for the sake of consistency and to increase power. A Wilcoxon rank sum test was performed on the angles shown in C and E, and the result shows that they are significantly different from each other with W = 91 and p=1.967e-05, with the division angles being more aligned to the DTC-Sh1 axis. See also Figure 6—video 1 and Figure 6—figure supplement 1.
-
Figure 6—source data 1
Division angles of 97 germ cell mitoses.
- https://cdn.elifesciences.org/articles/56383/elife-56383-fig6-data1-v2.xlsx
Figure 6—figure supplement 1
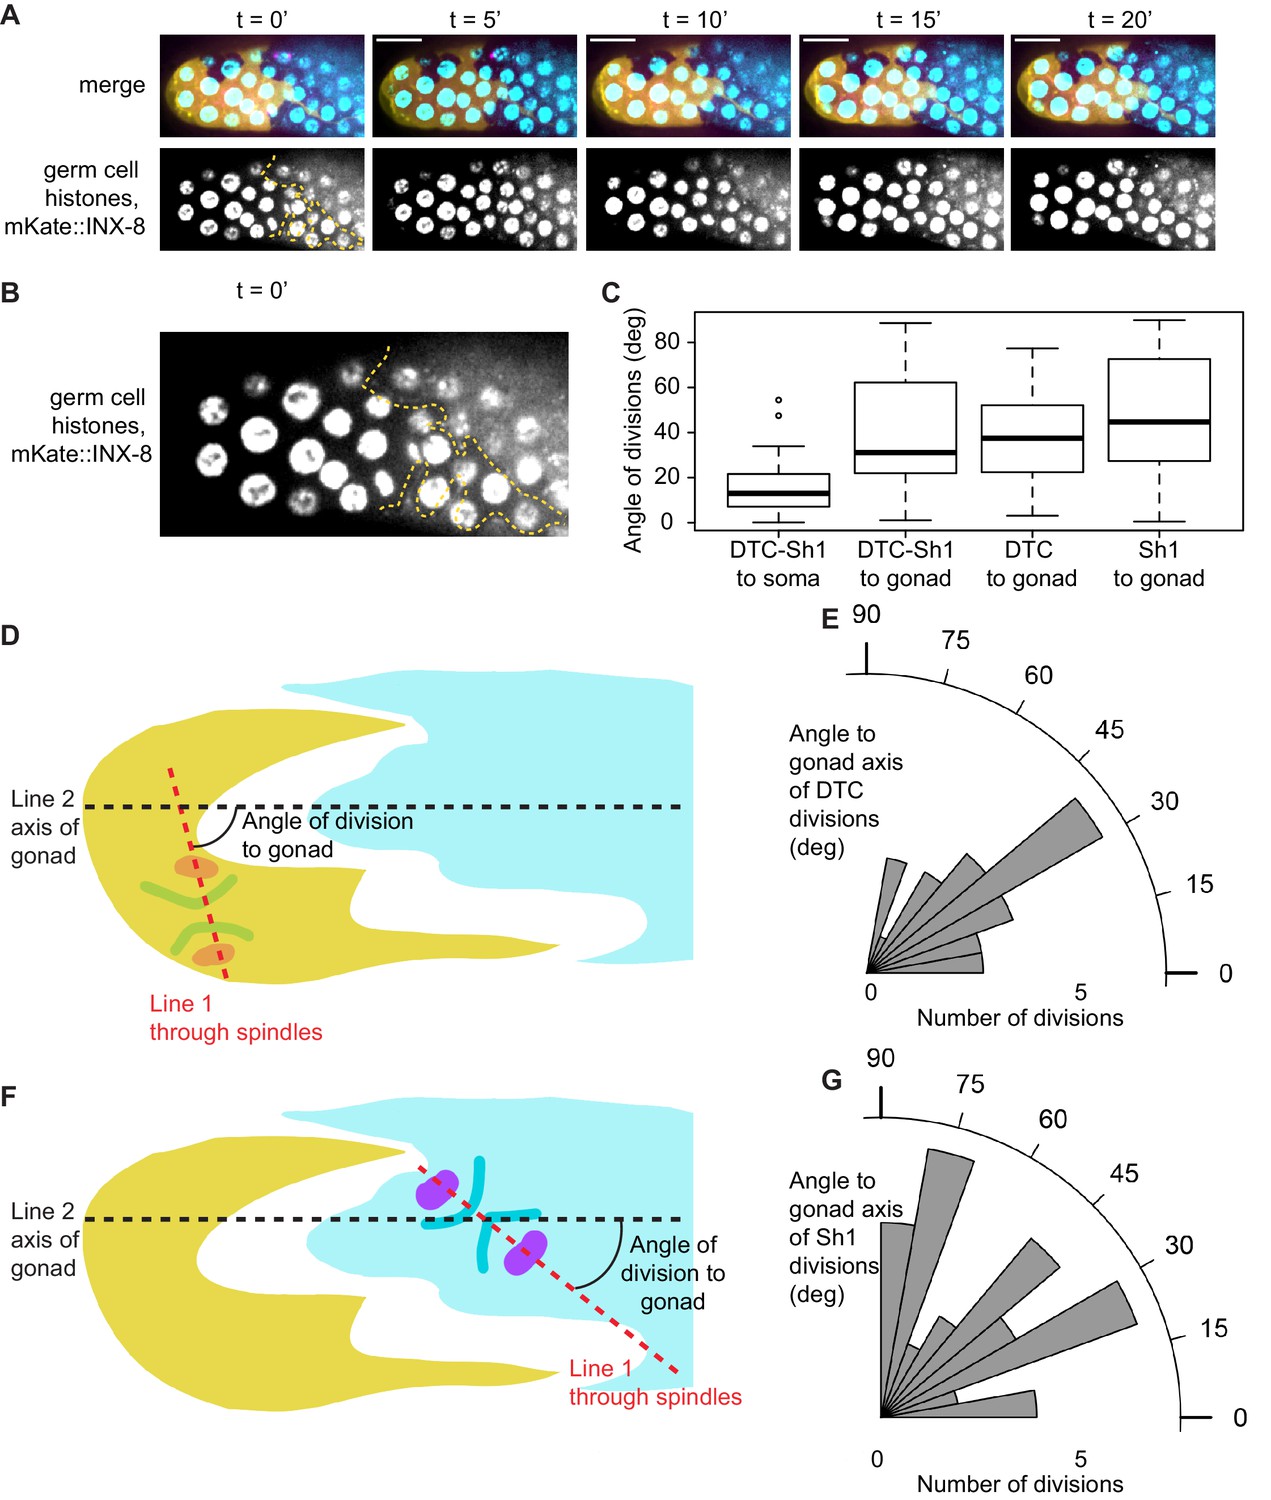
Germ cell divisions under the DTC and Sh1, like germ cells dividing between DTC and Sh1, are not oriented towards the gonad axis.
Related to Figure 6. (A) Sum projection through superficial most 3.75 μm of gonad surface of stills from time-lapse shown in Figure 6A, showing visibility of Sh1 (outlined in yellow dashed line) as distinct from the germ cell nuclear signal, which is less clearly resolved in maximum intensity projection shown in Figure 6A. (B) Enlargement of timepoint 0 from (A). (C) Boxplot showing angles in degrees of germ cell divisions at the DTC-Sh1 interface (data shown in rosette plots in Figure 6C), under the DTC alone, and under Sh1 alone to the soma (leftmost only) or gonad axis (three rightmost boxes) Figure 6—source data 1. DTC-Sh1 to soma angles are smaller compared to DTC-Sh1 to gonad (one-sided Wilcoxon rank sum test W = 141, p-value=2.537e-06), while DTC-Sh1 to gonad and DTC alone to gonad are not different from one another (two-sided Wilcoxon rank sum test W = 403, p=0.9684), nor are DTC-Sh1 to gonad and Sh1 alone to gonad (W = 476, p=0.2098) or DTC alone to gonad and Sh1 along to gonad (W = 447, p=0.162). (D) Schematic depicting how angle of division to gonad was calculated. For each cell dividing under the DTC (n = 28), Line one was drawn through the spindles into the neighboring soma. Line two was drawn along the distal-proximal axis of the gonad. The angles between Line one and Line two reflects how aligned the spindles are to the axis of the gonad, and are plotted in (E). (F) Same as in D, but for germ cells dividing under Sh1 (n = 40). (G) Same as in E, but for germ cells dividing under Sh1.
Figure 6—video 1
Tubulin spindles polarize between the DTC and Sh1 as a germ cell divides at the interface.
Related to Figure 6A DTC (yellow, lag-2p::mTag:BFP::PLCδPH), Sh1 (cyan, mKate2::inx8), and germ cell nuclei (cyan, mex-5p::H2B::mCherry), with tubulin (magenta, Beta-tubulin::GFP). Focal division (top) shows spindle polarization to somatic cells and segregation of daughters between the DTC and Sh1. Arrow indicates asymmetrically dividing cell. Maximum intensity projection of 0.25 μm confocal z-slices through superficial 5 μm of distal gonad. Images taken every five minutes. Movie plays at two fps. 1000x magnification.
Figure 7 with 2 supplements
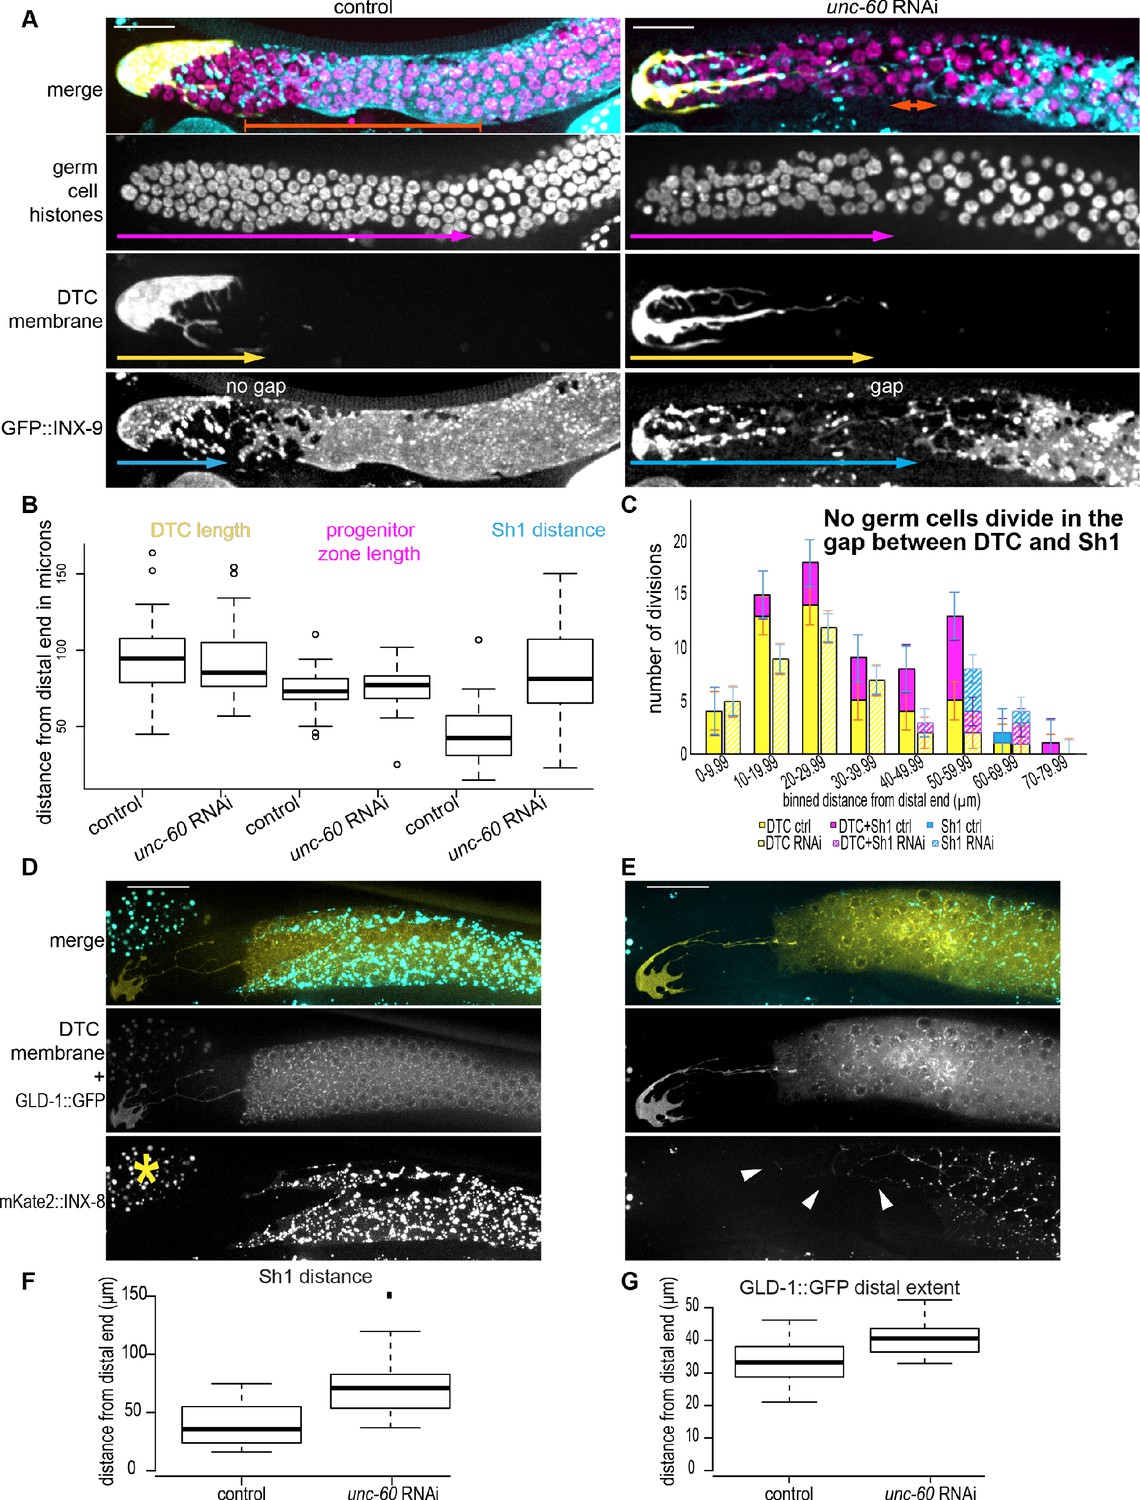
The distal sheath maintains proximity to the DTC via cofilin-dependent growth, and loss of proximity correlates with diminished germ cell proliferation and regulated niche exit.
(A) The DTC-Sh1 interface (DTC in yellow, lag-2p::mTag:BFP::PLCδPH; Sh1 in cyan, GFP::inx-9 bottom) seen in in the control (left) is disrupted by RNAi (right) against gene encoding worm ortholog of actin binding protein cofilin (unc-60). Germ cell nuclei (in magenta, mex-5p::H2B::mCherry) can be observed in the undifferentiated (distal, smaller) and meiotic (crescent and larger nuclei) states. Crescent shaped nuclei mark the meiotic transition zone. (B). Neither the DTC length (yellow arrows in A) nor the length of the progenitor zone (magenta arrows in A) are affected by RNAi treatment, while the distal boundary of Sh1 (cyan arrows in A) is perturbed 0: F1,62 = 40.00675 Tukey post-hoc test p<0.0001. In all graphs, boxes show median and second and third quartiles, while whiskers show minimum and maximum values. (C) Binned distances from the distal tip of germ cell divisions in three somatic cell compartments: DTC-alone (yellow), DTC-Sh1 (magenta), Sh1-alone (cyan) for control (solid fill) and unc-60 RNAi-treated (hashed) worms 48 hr after exposure beginning in the L3/L4 stage Figure 7—source data 1. Note that this is ~1 day later than the animals analyzed in Figure 3E, and the DTCs are substantially more elongated by this stage. Control n = 31 worms, unc-60 RNAi n = 35 worms. Representative images of (D) control and (E) unc-60 RNAi-treated worms expressing DTC membrane GFP, GLD-1::GFP transgene, and mKate2::INX-8 to mark Sh1. Yellow asterisk marks autofluorescent gut granules in neighboring tissue. Arrowheads mark distal strings of retracted Sh1. (F) Boxplots showing distance from distal end of Sh1 in control and unc-60 RNAi-treated worms Figure 7—source data 2. Welch two-sample t-test p<0.001. Note concordant results to those shown in (B). (G) Boxplots showing distance from distal end of GLD-1::GFP expression Figure 7—source data 2. Welch two-sample t-test p<0.001.
-
Figure 7—source data 1
Gonad feature measurements, positions and somatic cell contacts of dividing cells in control and RNAi-treated animals.
- https://cdn.elifesciences.org/articles/56383/elife-56383-fig7-data1-v2.xlsx
-
Figure 7—source data 2
Position of Sh1 and GLD-1::GFP boundaries in control and RNAi-treated animals.
- https://cdn.elifesciences.org/articles/56383/elife-56383-fig7-data2-v2.xlsx
Figure 7—figure supplement 1

RNAi against arx-2 causes the Sh1 distal boundary to be pushed back.
Related to Figure 6. (A) Strain expressing GFP::inx-9(79) (cyan) and a germ cell histone marker (magenta) were put on RNAi against arx-2 (which encodes an Arp2/3 subunit) and unc-60 (cofilin). Control worms (n = 10) fed empty RNAi vector had an average distal position of Sh1 that fell 31 μm from the distal end of the gonad; arx-2 RNAi-treated worms (n = 10) had an average distal position of 61 μm, and unc-60 RNAi-treated worms (n = 6) had an average distal position of 51 μm (B) Figure 7—figure supplement 1—source data 1. A linear mixed model revealed that both RNAi treatments are different from the control (Tukey post-hoc test p<0.01 for both treatments), and slightly different from one another (Tukey post-hoc test z = −2.355 p=0.04824). The distal position of Sh1 relative to the boundary of the transition zone between the mitotic and meiotic regions of the germ line was profoundly shifted (C), linear mixed model (F2, 42 = 11.53, p=1e-04.). The transition zone is found under Sh1 at an average distance of 27 μm from its edge in control animals, an average of 6 μm from its edge in unc-60 RNAi-treated animals, and is shifted out from under Sh1 into a bare region an average of 8 μm distal to Sh1 in arx-2 RNAi-treated worms. While the absolute length of the mitotic zone is not significantly smaller by 70 hr post RNAi exposure, many RNAi-treated animals lack active divisions: n = 9/16 unc-60 RNAi-treated animals and 8/10 arx-2 RNAi-treated animals lacked active divisions, compared to n = 3/20 controls (arx-2 RNAi vs. control, chi-squared = 12.1292, p=0.000496). Note that this experiment was performed on a different strain and on different days than the experiment reported in Figure 7, which shows the same trends but different precise measurements for the unc-60 RNAi treatments. We noted the unc-60 defect seemed more severe in the trial reported in Figure 7. (D) ARX-2::GFP, an endogenously tagged allele of arx-2, which encodes a subunit of Arp2/3, localizes dynamically to the distal edge of Sh1. Arrows indicate ARX-2::GFP enrichment at the end of the sheath, traced in dashed line from center panel. (E) Stills from a time-lapse Figure 7—video 1. ARX-2::GFP is dynamically enriched at the growing edge of Sh1 as it extends over germ cells dividing at the interface (arrows), rather than uniformly across the front of Sh1. Scale bars 10 μm.
-
Figure 7—figure supplement 1—source data 1
Positions of Sh1 boundary and transition zone in control and RNAi-treated animals.
- https://cdn.elifesciences.org/articles/56383/elife-56383-fig7-figsupp1-data1-v2.xlsx
Figure 7—video 1
As germ cells divide at the DTC-Sh1 interface, Sh1 uses ARX-2::GFP to grow distally and segregate germ cells.
Related to Figure 7. Sh1 (cyan, mKate2::inx-8, irregular) and germ cell nuclei (cyan, mex-5p::H2B::mCherry, round and condensed) interact as one focal germ cell divides (bottom). Arrow indicates dividing cell and location of Sh1 growth into cleavage furrow. ARX-2::GFP (yellow) transiently localizes to the distal edge of Sh1 as Sh1 grows towards and between the dividing germ cells. Maximum intensity projection of 0.25 μm confocal z-slices through superficial 5 μm of distal gonad. Images taken every five minutes. Movie plays at two fps. 1000x magnification.
Figure 8
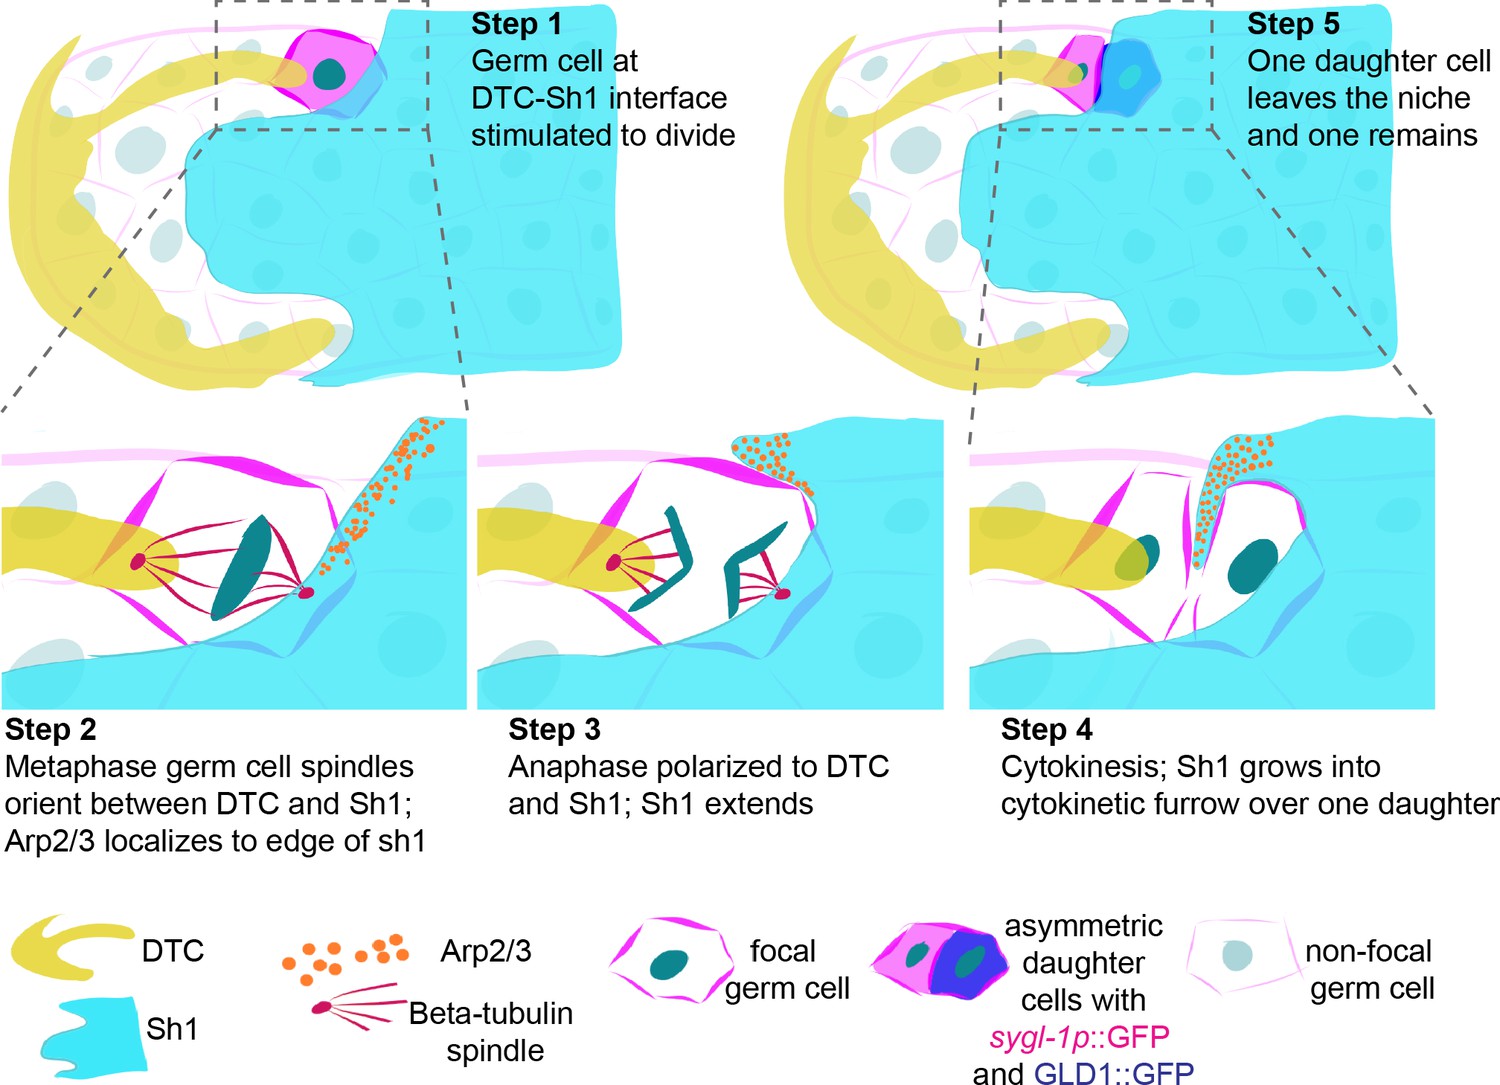
Schematic depicting DTC-Sh1 interface germ cell division.
(A) DTC (yellow) and Sh1 (cyan) contact germ cell membranes (magenta lines) in the distal gonad. Germ cell nuclei (dark turquoise) are visible during mitosis as round nucleus (Step 1), metaphase plate (Step 2), anaphase (Step 3), cytokinesis (Step 4), and in two segregated daughter cells (Step 5). Tubulin spindles (red, Step two and Step 3) and Arp2/3 (orange, Step 2–4) transiently localize in germ cells and Sh1, respectively. As the germ cell divides in a polarized fashion between the DTC and Sh1, Sh1 grows at its distal edge into the cytokinetic furrow to separate the two daughter cells. From birth, these two daughter cells have asymmetric contacts with the soma, and one has exited the niche.
Scheme 1
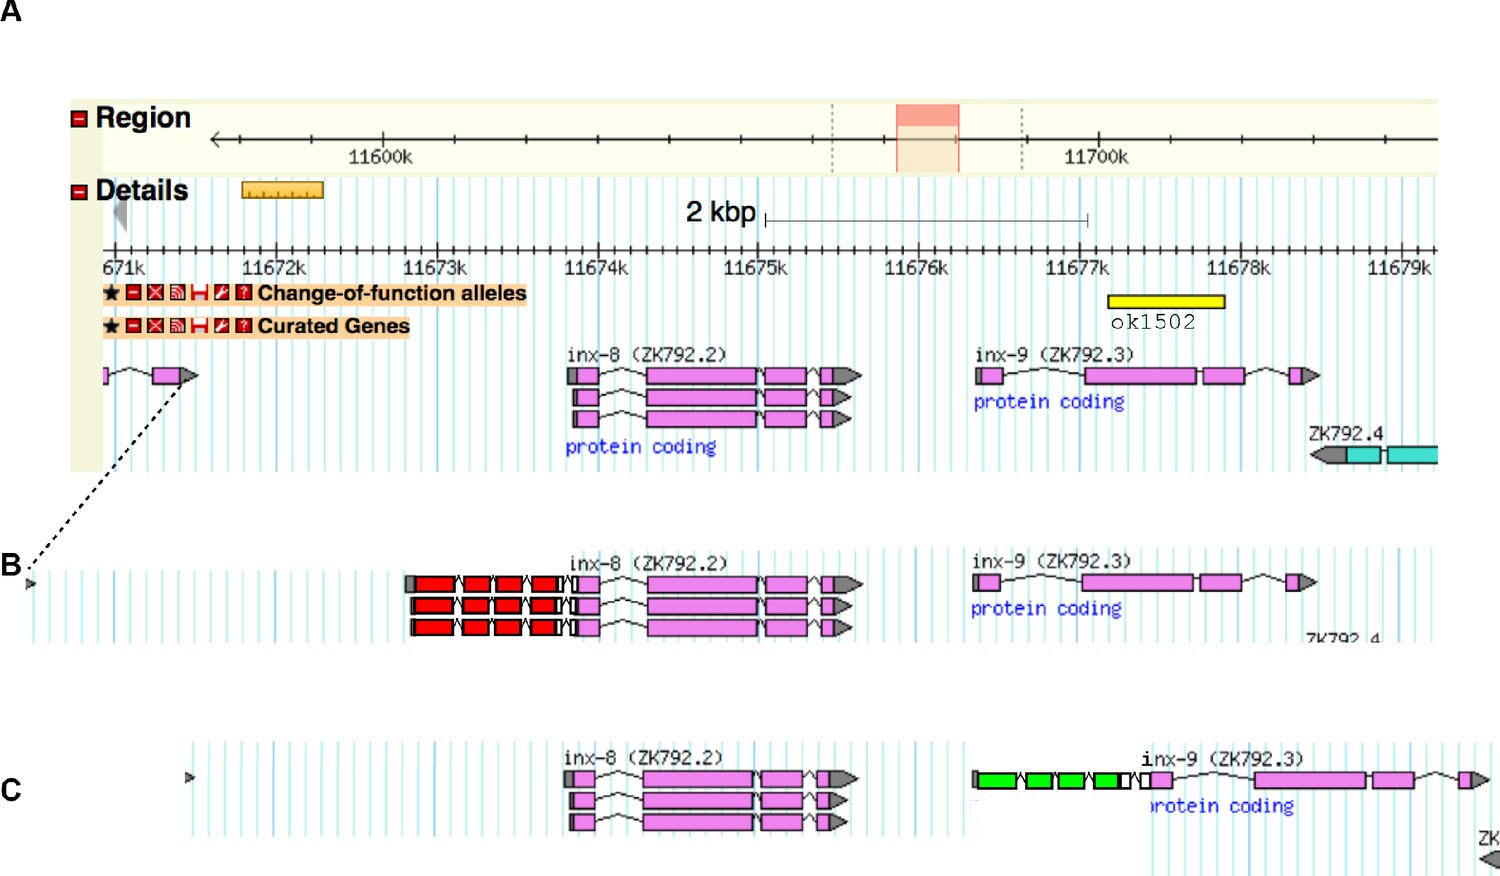
Gene models of the inx-8/inx-9 locus with alleles annotated.
Related to Materials and methods. (A) Genomic locus from Wormbase legacy genome browser. Change of function allele inx-9(ok1502) (see Figure 1—figure supplement 1) annotated with yellow bar. (B) Annotation of genome-edited allele inx-8(qy78) mKate::inx-8 with mKate exons shown with red boxes, introns shown with peaked lines, and linker amino acid sequences shown with white boxes. (C) Annotation of genome-edited allele inx-9(qy79) GFP::inx-9 with GFP exons shown with green boxes, introns shown with peaked lines, and linker amino acid sequences shown with white boxes. Endogenous UTRs and regulatory sequences, and their relative positions to their ends of the genes, are preserved.
Author response image 1
Tables
Appendix 1—key resources table
| Reagent type (species) or resource | Designation | Source or reference | Identifiers | Additional information |
|---|---|---|---|---|
| Gene (C. elegans) | inx-8 | wormbase.org | Sequence CELE_ZK792.2 | Encodes gap junction hemichannel subunit |
| Gene (C. elegans) | inx-9 | wormbase.org | Sequence CELE_ZK792.3 | Encodes gap junction hemichannel subunit |
| Gene (C. elegans) | tbb-2 | wormbase.org | Sequence CELE_C36E8.5 | Encodes worm beta tubulin ortholog |
| Gene (C. elegans) | unc-60 | wormbase.org | Sequence CELE_C38C3.5 | Encodes worm cofilin ortholog |
| Gene (C. elegans) | arx-2 | wormbase.org | Sequence CELE_K07C5.1 | Encodes Arp2/3 subunit |
| Strain, strain background (Escherichia coli) | HT115(DE3) | Caenorhabditis Genetics Center (CGC) | HT115(DE3) | RNAi feeding strain |
| Genetic reagent (Escherichia coli) | Ahringer RNAi Library | Source Bioscience | C. elegans RNAi Collection (Ahringer) | |
| Chemical compound, drug | hygromycin B from Streptomyces hygroscopicus | Millipore Sigma | CAS 31282-04-9 | |
| Genetic reagent (C. elegans) | unc-119(ed4) | Paul Sternberg | PS3460 | for transgenic rescue |
| Genetic reagent (C. elegans) | xnSi1(mex-5p::GFP::PLCδPH::nos-2 3’UTR) II; inx-8(qy78(mKate::inx-8)) IV; qyIS546(lag-2p::mTagBFP::PLCδPH) | xnSi1 parent from Chihara and Nance, 2012 doi:10.1242/dev.079863 | NK2569 | Can be obtained from K. Gordon lab |
| Genetic reagent (C. elegans) | naSi2(mex-5p::H2B::mCherry::nos-2 3′UTR) II/xnSi1(mex-5p::GFP::PLCδPH::nos-2 3’UTR) II; inx-8(qy78(mKate::inx-8)) IV; qyIS546(lag-2p::mTagBFP::PLCδPH) | nasi2 transgene from Roy et al., 2018 doi:10.1534/g3.118.200511; xnSi1 parent from Chihara and Nance, 2012 doi:10.1242/dev.079863; others this study | NK2570 | Can be obtained from K. Gordon lab |
| Genetic reagent (C. elegans) | inx-8(qy78(mKate::inx-8)) IV; cpIs122(lag-2p::mNeonGreen:: PLCδPH) | This study | NK2571 | Can be obtained from K. Gordon lab |
| Genetic reagent (C. elegans) | inx-9(qy79(GFP::inx-9)) IV; cpIs91(lag-2p::2x mKate2::PLCδPH::3xHA::tbb-2 3'UTR LoxN) II | cpIs91 transgene from Gordon et al., 2019 doi: 10.1016/j.cub.2019.01.056 | NK2572 | Can be obtained from K. Gordon lab |
| Genetic reagent (C. elegans) | naSi2(mex-5p::H2B::mCherry::nos-2 3′UTR) II; inx-9(qy79(GFP::inx-9)) IV; qyIS546(lag-2p::mTagBFP::PLCδPH) | nasi2 transgene from Roy et al., 2018 doi: 10.1534/g3.118.200511; others this study | NK2573 | Can be obtained from K. Gordon lab |
| Genetic reagent (C. elegans) | naSi2(mex-5p::H2B::mCherry::nos-2 3′UTR) II; inx-8(qy78(mKate::inx-8)) IV; qyIS546(lag-2p::mTagBFP::PLCδPH); ojIs1 [pie-1p::GFP::tbb-2 + unc-119(+)] | nasi2 transgene from Roy et al., 2018 doi:10.1534/g3.118.200511; ojIs1 transgene from Gerhold et al., 2015 doi: 10.1016/j.cub.2015.02.054 | NK2574 | Can be obtained from K. Gordon lab |
| Genetic reagent (C. elegans) | naSi2(mex-5p::H2B::mCherry::nos-2 3′UTR) II; inx-8(qy78(mKate::inx-8)) IV; arx-2(cas607[arx‐2::gfp knock‐in]) V | nasi2 transgene from Roy et al., 2018 doi:10.1534/g3.118.200511; arx-2(cas607) from Zhang et al., 2017 doi: 10.1242/bio.026807 | NK2575 | Can be obtained from K. Gordon lab |
| Genetic reagent (C. elegans) | inx-9(ok1502) IV; inx-8(qy102(mKate::inx-8)) IV; cpIs122(lag-2p::mNeonGreen::PLCδPH) | inx-9(ok1502) allele from Consortium TC elegans DM, 2012 doi: 10.1534/G3.112.003830 | NK2576 | Can be obtained from K. Gordon lab |
| Genetic reagent (C. elegans) | cpIs91(lag-2p::2x mKate2::PLCδPH::3xHA::tbb-2 3'UTR LoxN) II); qSi26(sygl-1p::H2B::GFP::sygl-1 3UTR) II; (inx-8(qy78(mKate::inx-8)) IV; teIs1(oma-1::GFP) IV, | qSi26 and teIs1 from Kershner et al., 2014 doi: 10.1073/pnas.1401861111 | KLG004 | Can be obtained from K. Gordon lab |
| Genetic reagent (C. elegans) | (cpIs122(lag-2p::mNeonGreen:: PLCδPH)); inx-8(qy78(mKate::inx-8)) IV; ozIs5(gld-1::GFP) | ozIs5 from Brenner and Schedl, 2016; Schumacher et al., 2005 doi: 10.1534/genetics.115.185678 | KLG005 | Can be obtained from K. Gordon lab |
| Sequence-based reagent | inx-8 5’ arm Forward primer | This study | 5_Nterminx8F | 5’-TGTACGACTGTAGGCAGGCAGGTAG-3’ |
| Sequence-based reagent | inx-8 5’ arm Reverse primer | This study | 5_Nterminx8R | 5’-tctgcaattcgaacccgagtgaagatg-3’ mutation in PAM site underlined |
| Sequence-based reagent | inx-8 3’ arm Forward primer | This study | 3_Nterminx8F | 5’-ATGTTTTCTGTTCCATTTCTTACCTC-3’ |
| Sequence-based reagent | inx-8 3’ arm Reverse primer | This study | 3_Nterminx8R | 5’-CTGTACATCTCCACGGCAACCTCCG-3’ |
| Sequence-based reagent | inx-8 sgRNA primer | This study | sg_Nterminx8 | 5’- GCATCTTCACTCGGGTTCGA-3’ |
| Sequence-based reagent | inx-9 5’ arm Forward primer | This study | 5_Nterminx9F | 5’-gaaataatcgagatgaaactgtcg-3 |
| Sequence-based reagent | inx-9 5’ arm Reverse primer | This study | 5_Nterminx9R | 5’-CATtctgtccctttgaacgaaagtg-3’ mutation in PAM site underlined |
| Sequence-based reagent | inx-9 3’ arm Forward primer | This study | 3_Nterminx9F | 5’-ATGTTTTCTGTTCCATTTCTTACC-3’ |
| Sequence-based reagent | inx-9 3’ arm Reverse primer | This study | 3_Nterminx9R | 5’-tgagttggactgacatcgag-3’ |
| Sequence-based reagent | inx-9 sg RNA primer | This study | sg_Nterminx9 | 5’- CTTTCAGAGCATTGTCACTT-3’ |
| Sequence-based reagent | inx-8 downstream exon Forward primer | This study | Inx8exonF | 5’-GTGACTTCCAAGTTCGTGAGATGGC-3 |
| Sequence-based reagent | downstream of inx-9 stop codon Reverse primer | This study | Inx9downstreamR | 5’-gcttgaaaacggtgcggatccagc-3’ |
| Recombinant DNA reagent | arx-2 feeding RNAi clone | Ahringer RNAi library Kamath and Ahringer, 2003 doi: 10.1016/S1046-2023(03)00050–1 | HGMP_Location V-7M13 | |
| Recombinant DNA reagent | unc-60 feeding RNAi clone | Vidal RNAi library Rual et al., 2004 doi:10.1101/gr.2505604 | RNAi well, GHR-11003@H04 | RNAi well, GHR-11003@H04 |
| Recombinant DNA reagent | modified plasmid for SEC CRISPR strategy | Dickinson et al., 2015 doi: 10.1534/genetics.115.178335 | RRID:Addgene_132523 | pDD268 |
| Recombinant DNA reagent | eft-3p::Cas9+sgRNA expression vector | Dickinson et al., 2015 doi: 10.1534/genetics.115.178335 | RRID:Addgene_47549 | pDD162, Addgene plasmid #47549 |
| Recombinant DNA reagent | RNAi empty vector control | Andrew Fire | RRID:Addgene_1654 | L4440, Addgene plasmid #1654 |
| Recombinant DNA reagent | unc-119 rescue plasmid | Morris Maduro | pPD#MM016B | |
| Software, algorithm | μManager software v1.4.18 | Edelstein et al., 2010 doi: 10.1002/0471142727.mb1420s92 | RRID:SCR_016865 | https://micro-manager.org/ |
| Software, algorithm | FIJI 2.0 | Schindelin et al., 2012 doi:10.1038/nmeth.2019 | RRID:SCR_002285 | https://fiji.sc/ |
| Software, algorithm | Adobe Photoshop CC | Adobe Systems Inc | RRID:SCR_014199 | |
| Software, algorithm | Adobe Illustrator CC | Adobe Systems Inc | RRID:SCR_010279 |
Additional files
-
Supplementary file 1
Time-lapse movies analyzed for interface division asymmetry.
Related to Figure 4.
- https://cdn.elifesciences.org/articles/56383/elife-56383-supp1-v2.docx
-
Transparent reporting form
- https://cdn.elifesciences.org/articles/56383/elife-56383-transrepform-v2.pdf
Download links
A two-part list of links to download the article, or parts of the article, in various formats.
Downloads (link to download the article as PDF)
Open citations (links to open the citations from this article in various online reference manager services)
Cite this article (links to download the citations from this article in formats compatible with various reference manager tools)
Stem cell niche exit in C. elegans via orientation and segregation of daughter cells by a cryptic cell outside the niche
eLife 9:e56383.
https://doi.org/10.7554/eLife.56383


