Spatial correlations constrain cellular lifespan and pattern formation in corneal epithelium homeostasis
- Department of Physiology, Biophysics and System Biology, Faculty of Medicine, Technion, Israel
- Department of Genetics & Developmental Biology, Faculty of Medicine, Technion, Israel
- The Rappaport Family Institute for Research in the Medical Sciences, Technion, Israel
Figures
Figure 1
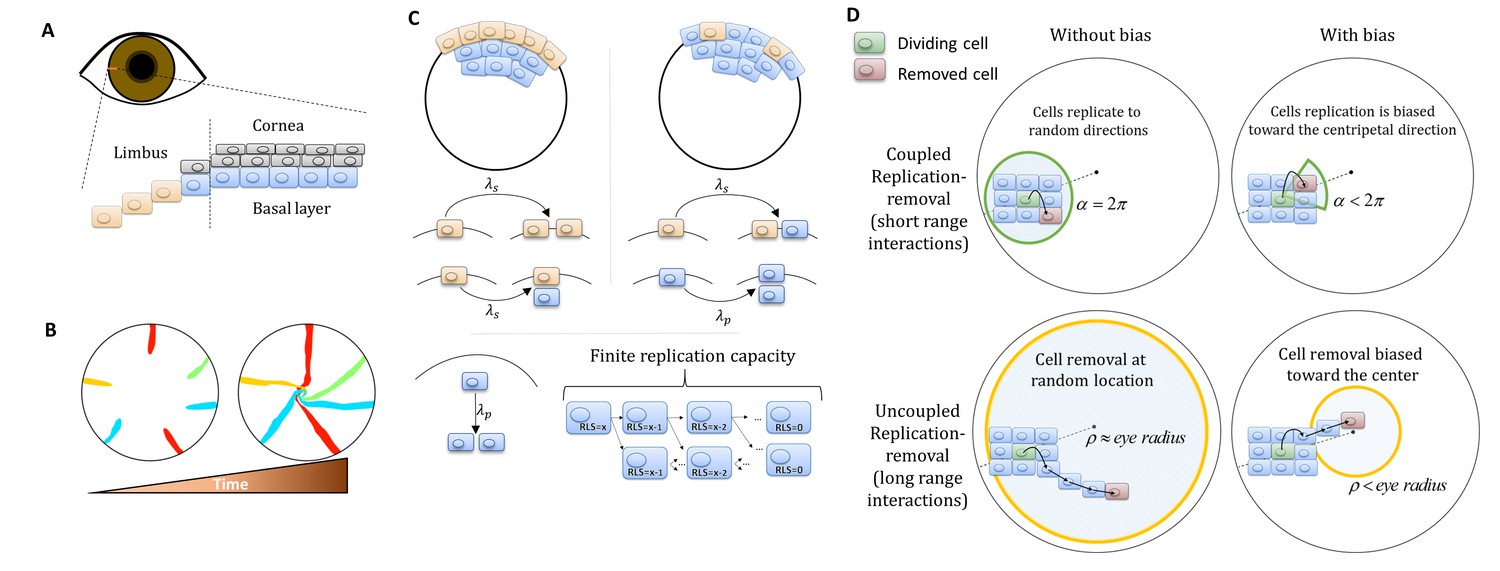
Model setup.
(A) Maintenance of cells in the cornea, the outer transparent part of the eye, is mainly due to stem cells that reside in the limbus – a niche at the circumference of the cornea. (B) Illustration of in vivo multi-color lineage tracing experiment. Clonal stripes emerge from the limbus toward the center of the cornea. (C) We consider two limiting scenarios for stem cell distribution and dynamics. In the first (left), stem cells are evenly distributed all over the limbus. They can divide symmetrically to maintain the limbus or asymmetrically to provide progenitor cells to the cornea. In the second model (right), stem cells are scarce and divide asymmetrically to give rise to progenitor cells in the limbus that further divide and populate the cornea. In both models, progenitor cells have limited replicative lifespan capacity. When cells exhaust their replicative lifespan, the cells can no longer divide in the basal layer and are replaced by other dividing cells. (D) Whether the location of replication and cell removal are correlated (replication and cell removal occur in the same neighborhood) or not plays a crucial role in the cornea rejuvenation dynamics. Accounting also for whether there is a centripetal bias results in four possible classes of models.
Figure 2
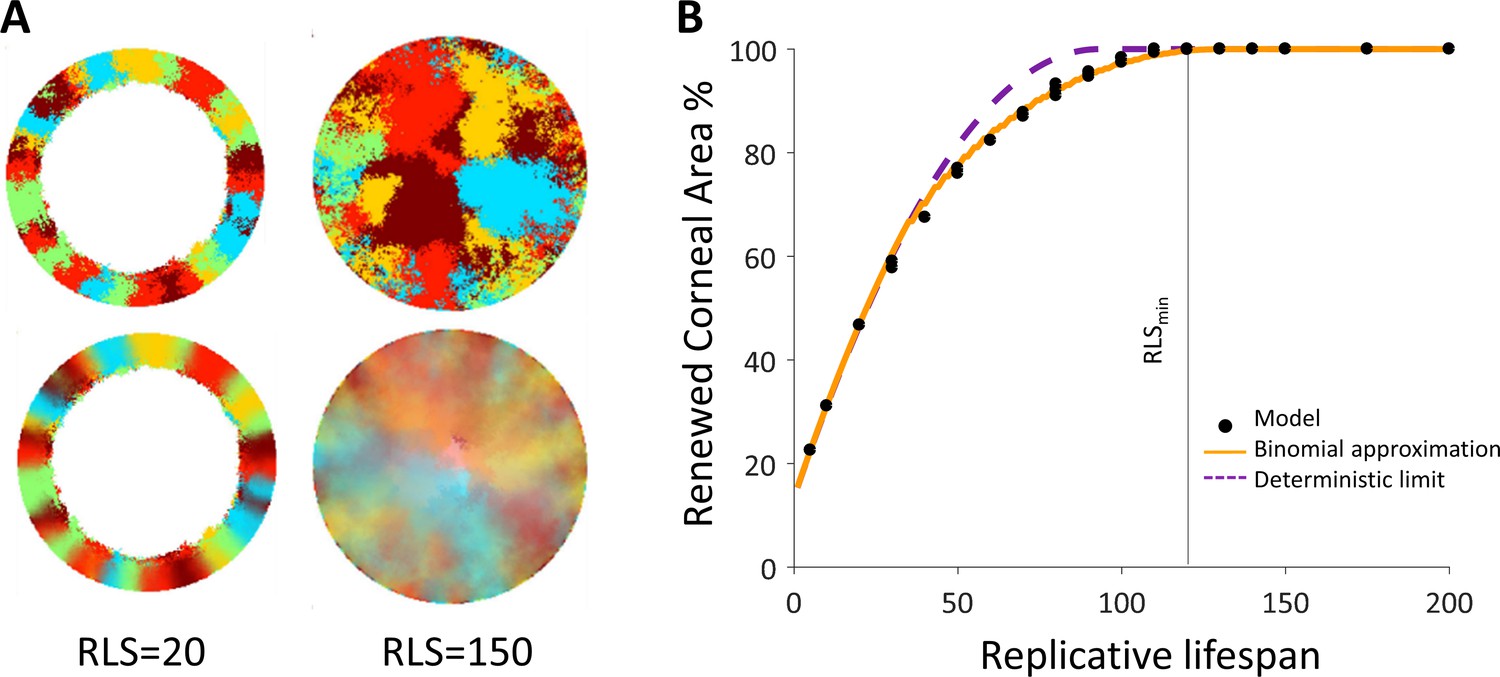
Spatial coupling between cell replication and cell removal in the absence of centripetal bias.
(A) Steady-state snapshots (upper row) and time-averages over 200 corneal replications (lower row). If the replicative lifespan is below a critical value, the cornea cannot be rejuvenated. For replicative lifespan values that are above the critical value (RLSmin≳130), the emerging pattern is that of contiguous patches reminiscent of in vivo mutant phenotypes. (B) The fraction of the cornea that is renewed increases with replicative lifespan. Three realizations of the dynamics are shown (black dots). The purple line is the theoretical upper limit on the renewed area, and the orange line is the result of a theoretical model that approximates renewal as a one-step process (see text and Appendix 1 section V for details).
Figure 3

The effect of centripetal bias in the case of spatial coupling between cell replication and cell removal.
(A) Steady-state snapshots (upper row) and time-averages over 200 replications (lower row) for RLS = 60 and different centripetal bias. (B) The minimal RLS required for renewal as a function of centripetal bias. Data points are the mean of three realizations, and error bars (some smaller than the marker size) are the standard deviation. In the case of ideal bias, the minimal theoretical value for RLSmin (dotted horizontal line) is ≈ R/m (where R is the radius of the cornea, and m is the local replication-removal neighborhood). (B-inset) The lower limit on RLSmin as a function of the corneal radius when m = 5. The green dot marks the corneal radius used for the simulations, R = 100. (C) The effect of centripetal bias (Different colors, match the colors on panel 3B) on the normalized renewal time and clonal unmixing. As the bias increases, the corneal renewal time is shorter, and the pattern is more ordered. In the case of ideal bias, the theoretical lower limit on renewal time (vertical dotted line) is 2R/(m+1).
Figure 4
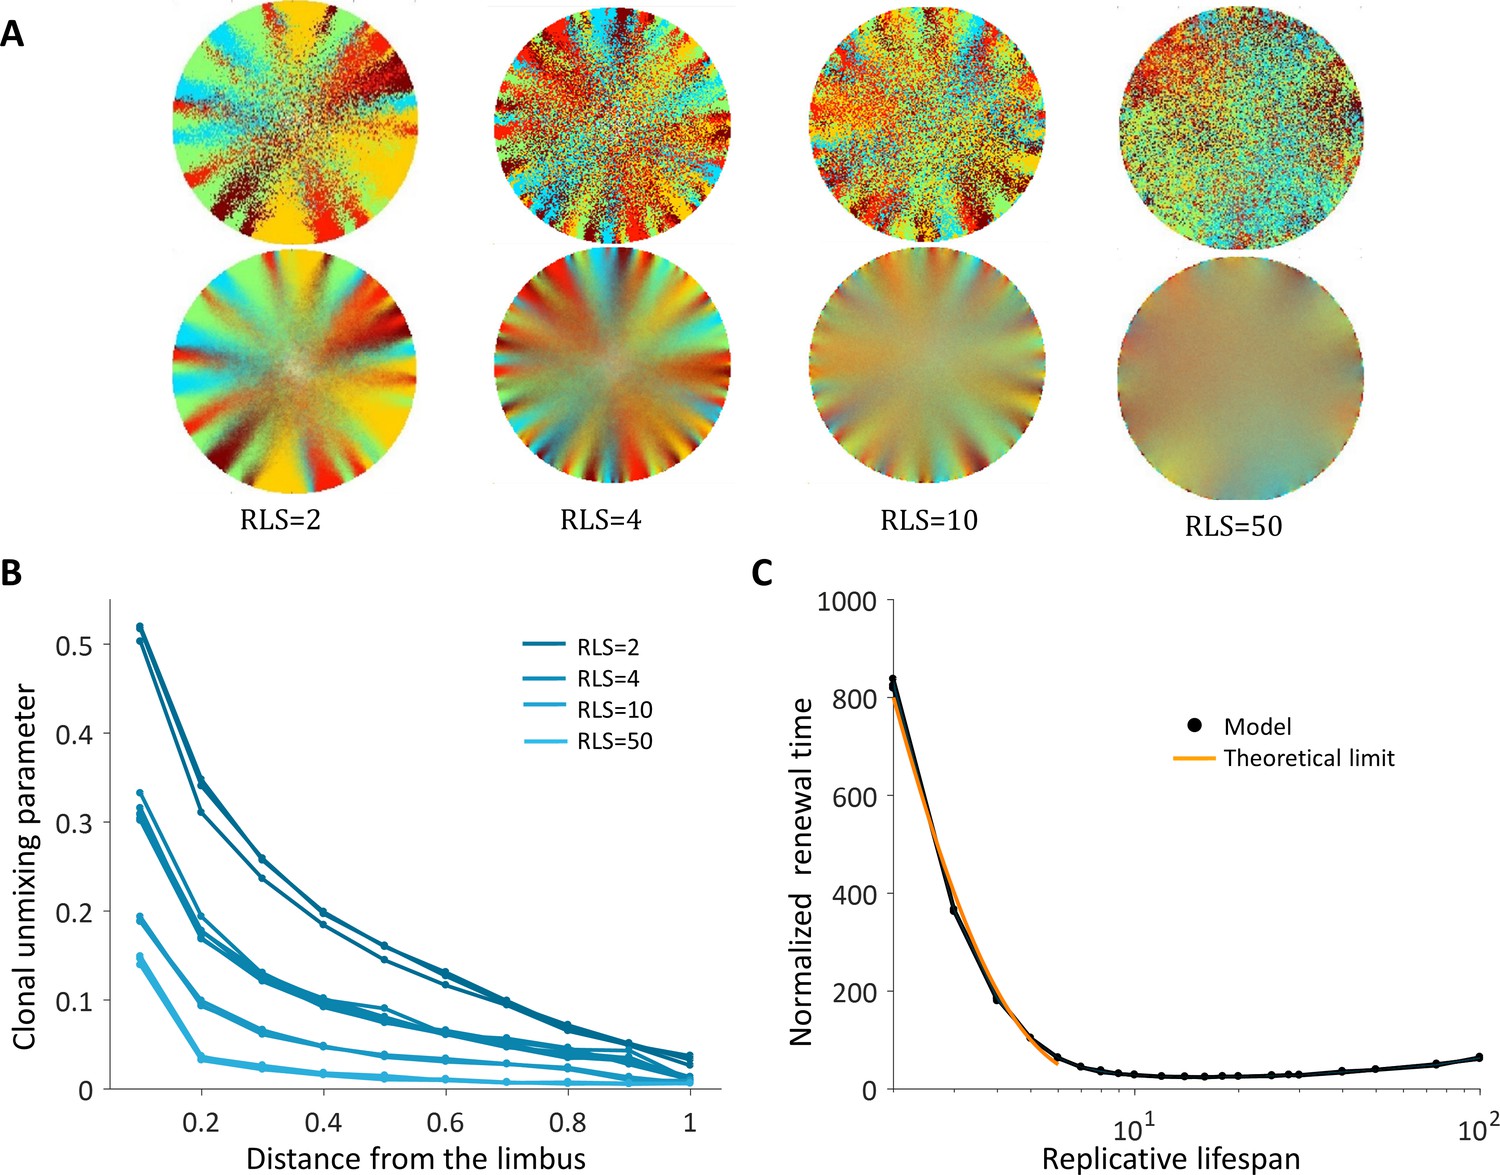
Spatial uncoupling between cell replication and cell removal.
(A) Steady-state snapshots (upper row) and time-averages over 200 corneal replications (lower row) for different RLS values. (B) The clonal unmixing at different distances from the limbus. Ordered centripetal pattern emerges mainly at the periphery of the tissue and only for low values of replicative lifespan (blue-lines, three realizations for each RLS value). (C) The renewal time decreases exponentially with RLS for values that are lower than log2(R) ≈ 7 (black line, three realizations are shown). The orange line is the theoretical limit when considering renewal as a one-step stochastic process with radial boundary (see text and Appendix 1 section VI).
Figure 5
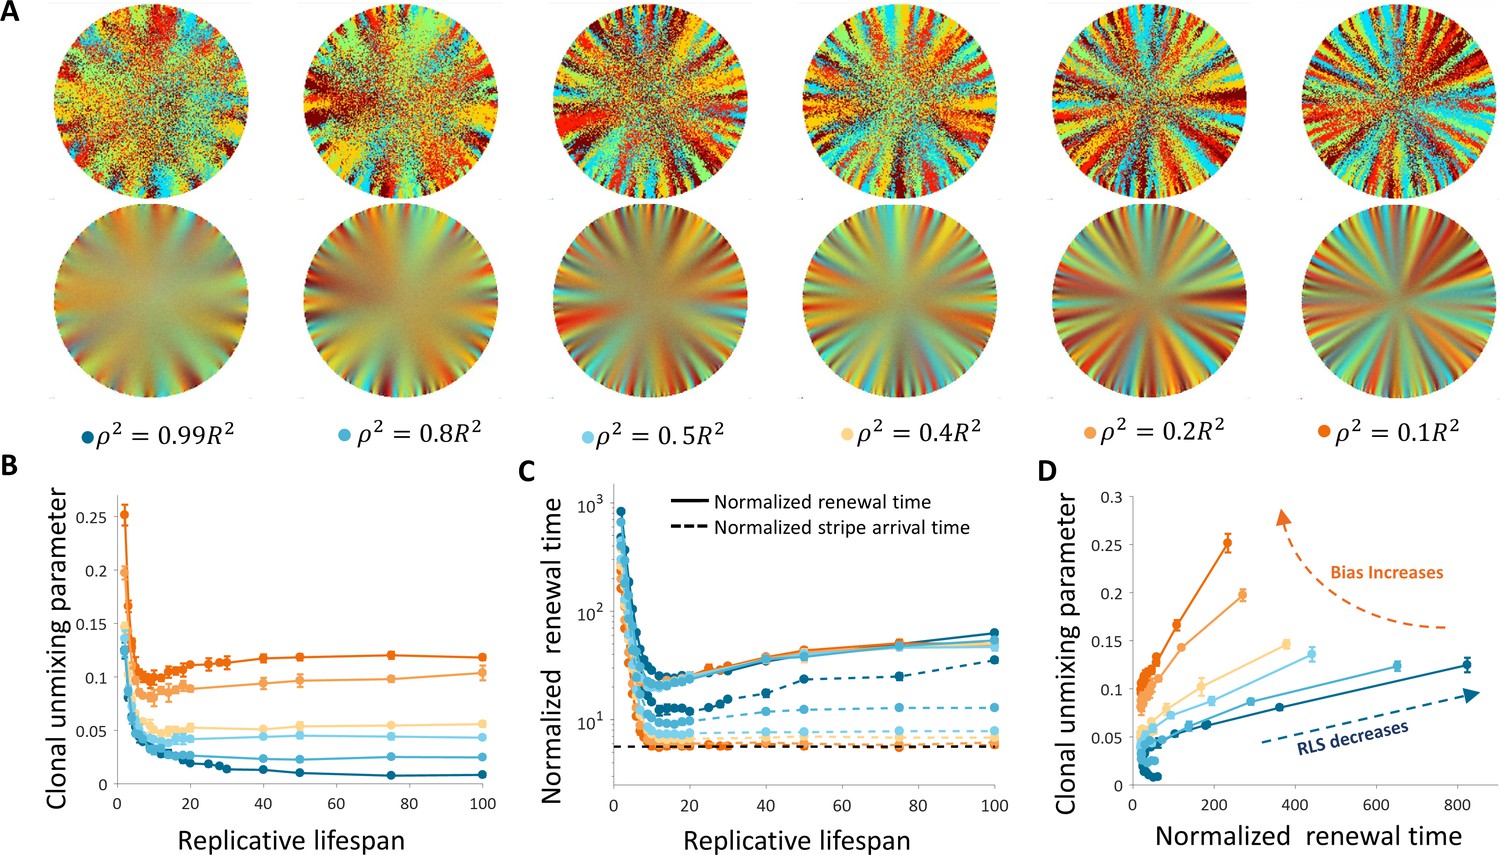
Dynamics and patterns in the case where replication and removal are uncoupled.
(A) Steady-state snapshots (upper row) and time-averages (lower row) over 200 corneal replications for different values of ρ, the radius of the area from which cells can be removed, for RLS = 10. (B) The dependence of centripetal unmixing, halfway to the center, on replicative lifespan. Colors denote the centripetal bias and are the same as in 5A. Data points are means of three realizations, and error bars are the standard deviation. For all values of RLS, the order decreases as RLS increases. (C) Normalized renewal time decreases as RLS increases (solid lines). The black dotted line is the theoretical limit in the case of ideal bias and high RLS. Data points are means of three realizations, and error bars are standard deviation. (D) The interplay between unmixing and renewal time for different bias (different colors) and different RLS values ranging from 2 to 100. Data points are means of three realizations, and error bars are standard deviation.
Figure 6
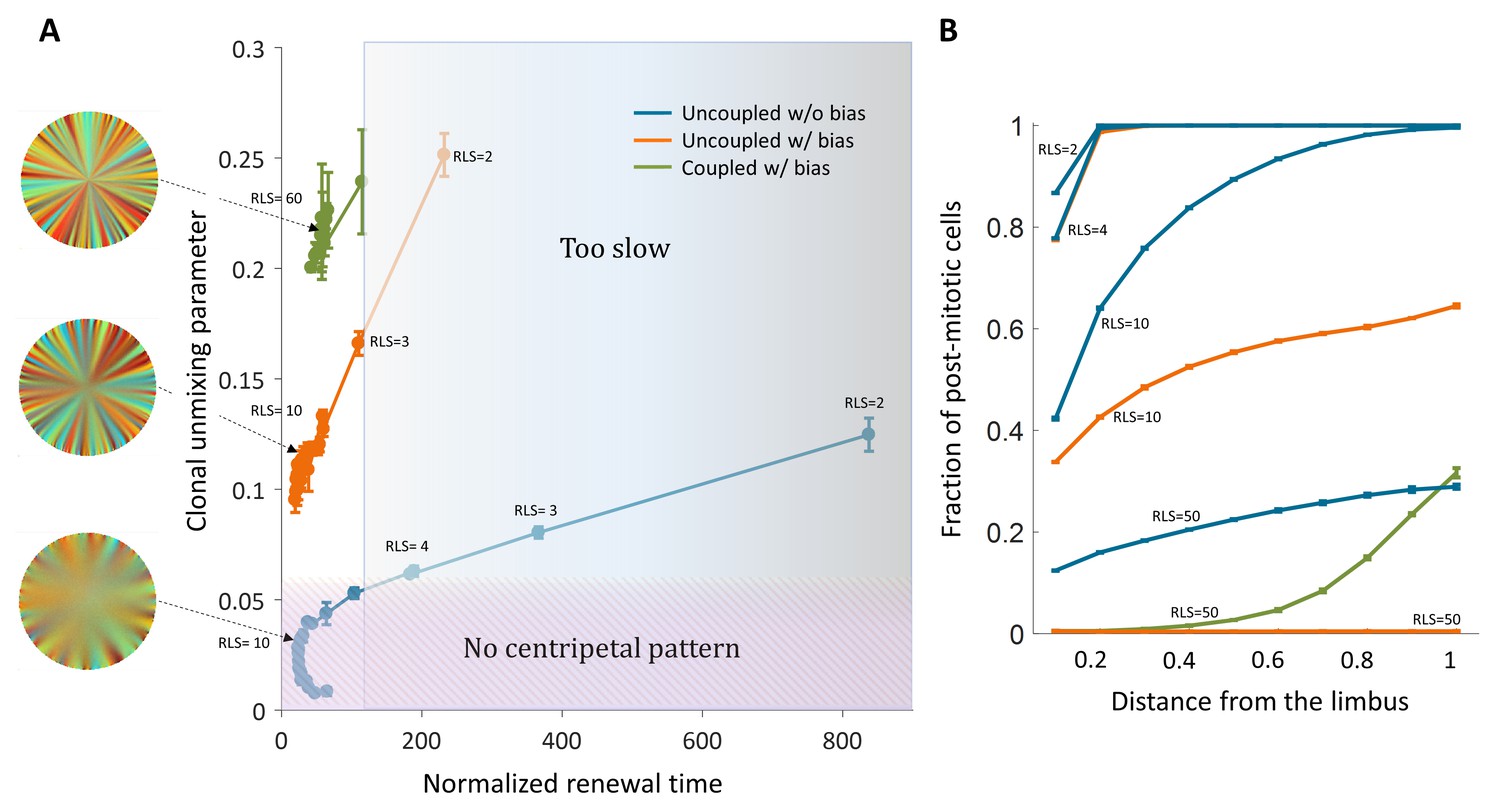
Limits and constraints on the different model classes.
(A) The unmixing parameter as a function of the normalized renewal time for different values of replication lifespan, ranging from 2 to 100. The shaded areas are regions that are not consistent with experimental observations of centripetal unmixing and renewal time. (B) The hallmark of low RLS models is a high post-mitotic fraction regardless of bias.
Figure 7
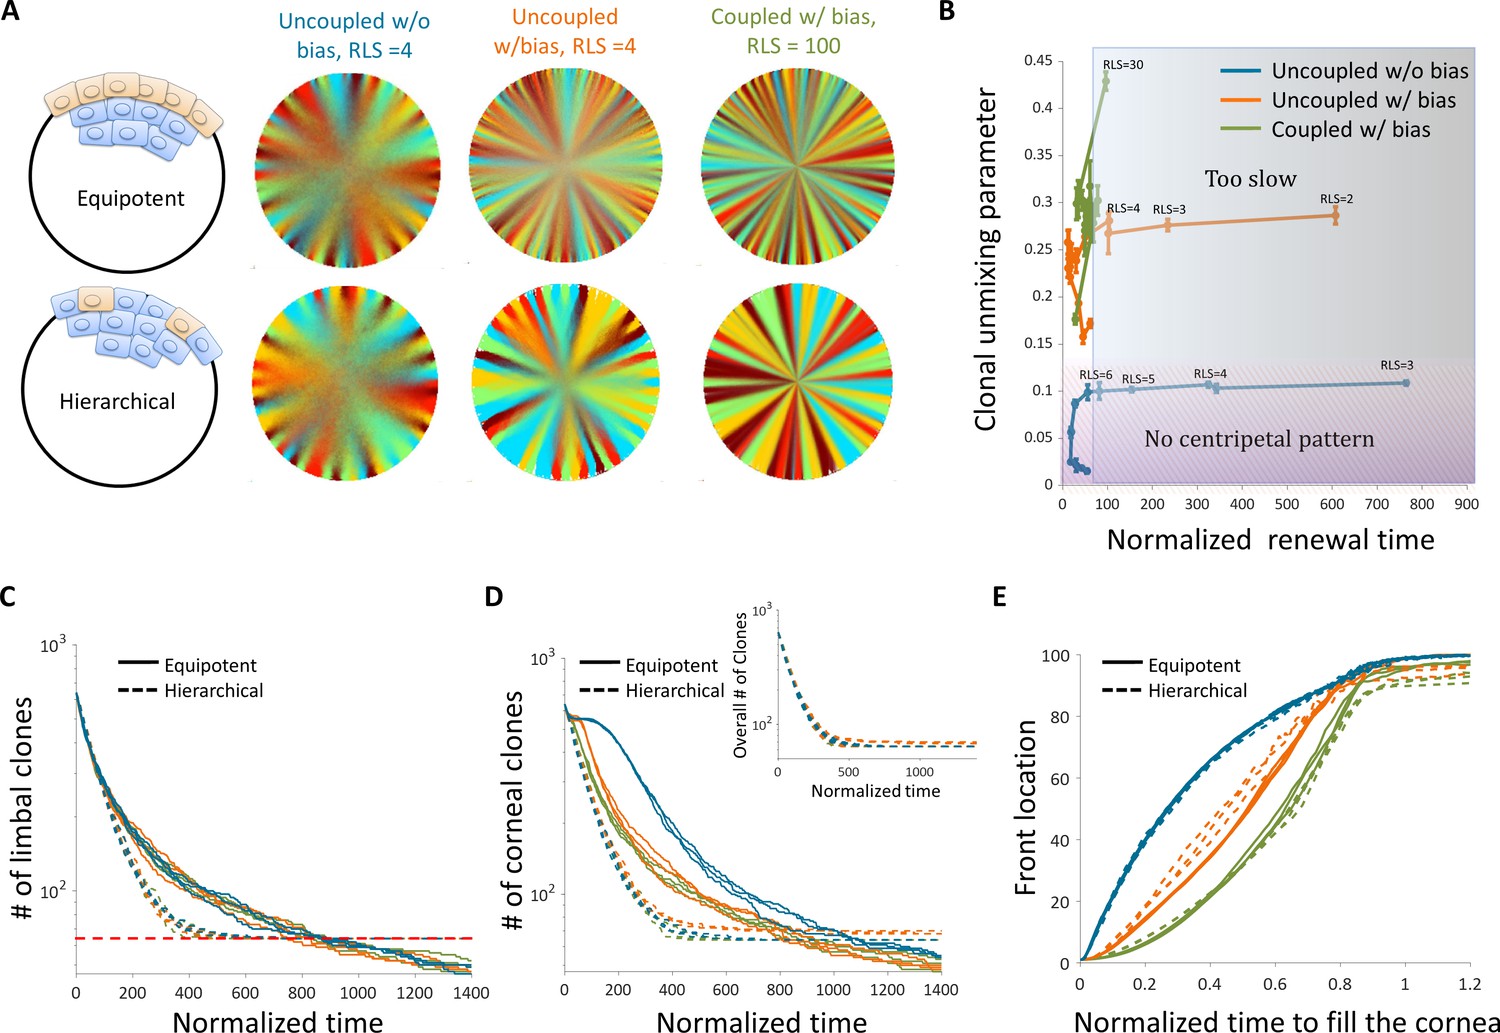
The effect of stem cell dynamics and distribution.
(A) Steady-state snapshots (upper row) and time-averages (lower row) over 200 corneal replications for the Equipotent and Hierarchical models. The colors denote the different cases (blue, orange, and green) and are the same for all the panels. (B) The interplay between clonal unmixing and renewal time for different bias and different RLS values in the case of the Hierarchical model. The tradeoffs are similar to those of the Equipotent model (Figure 6A). (C) The number of limbal clones as a function of time in the case of the Equipotent model (solid lines) and the Hierarchical model (dotted lines). While the number of limbal clones in the equipotent case diminishes with time, the number of limbal clones in the hierarchical case approaches the number of limbal stem cells (red horizontal dotted line). In both models, the spatial coupling does not affect the dynamics of clone number. (D) The number of corneal clones as a function of time in the case of the Equipotent model (solid lines) and the Hierarchical model (dotted lines). In the hierarchical case, the dynamics of corneal clone number and limbal clone number are similar (inset). In the equipotent case, the spatial coupling affects the decay rate of the number of clones. (E) The renewed cells' front location as a function scaled time. Time was scaled such that 1 is the time to replenish the cornea. The stripe propagation velocity depends on the spatial coupling but is less sensitive to the stem cells distribution.
Figure 8
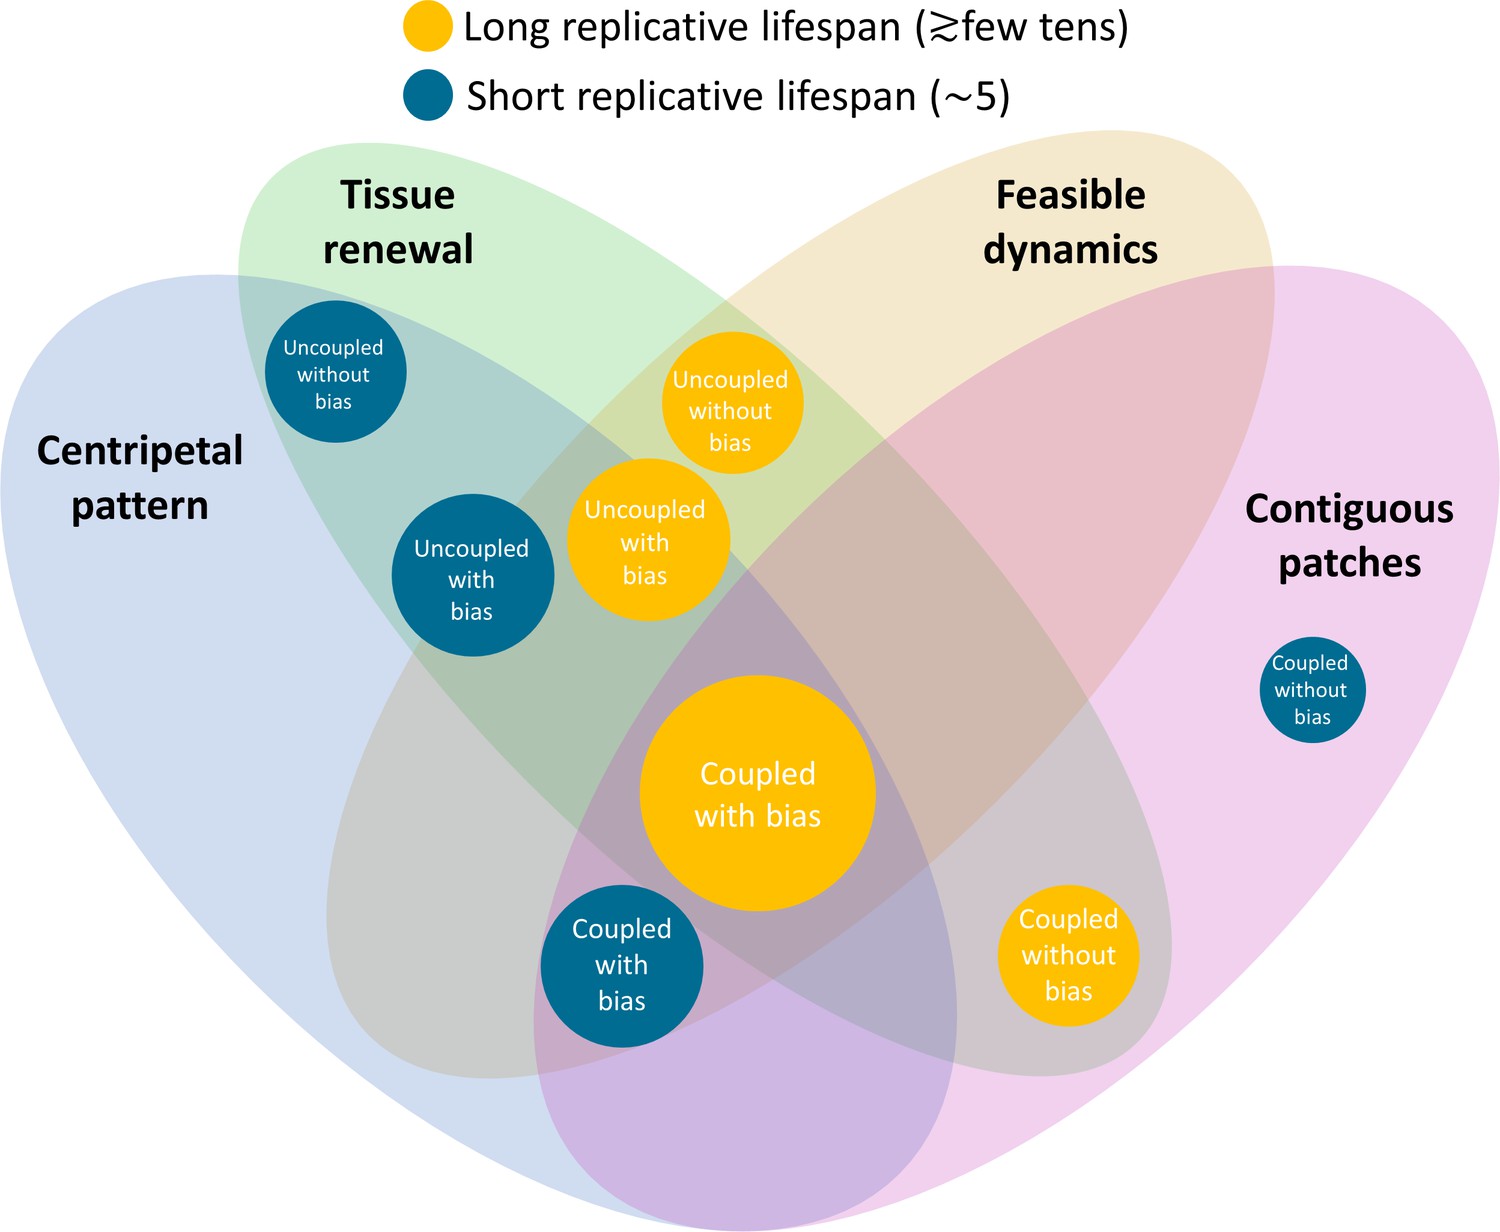
Constraints on the different models and their biological feasibility.
Each circle represents a model with different spatial correlations between cell replication and cell removal, high or low replicative lifespan, and whether there is a centripetal bias or not. The colors represent whether the replicative lifespan is short or long (blue and orange, respectively). The radius of each circle is proportional to the number of properties each model is consistent with. In the case of the cornea, the only model that can provide all four requirements (centripetal pattern, full tissue renewal, feasible time scales, and contiguous patches observed in mutants) is coupled replication-removal with bias and long replicative lifespan.
Appendix 1—figure 1
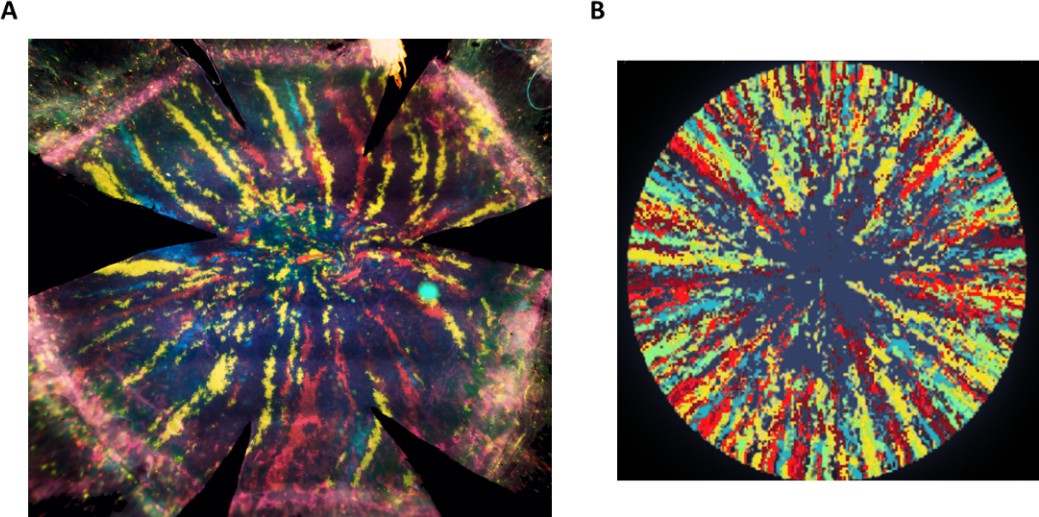
Radial stripes as measured in an in vivo lineage tracing experiment.
(A) A fluorescence microscopy photomicrograph of a cornea from a double transgenic UBC-CreERT2; Brainbow mice were injected with tamoxifen when six weeks old and sacrificed 16 weeks later. Tamoxifen treatment induced a stochastic and irreversible expression of one out of four “confetti” fluorescent proteins (namely, nuclear green (GFP), cytoplasmic red (RFP), cytoplasmic yellow (YFP), or membrane cyan (CFP) fluorescent protein). (B) Image representation of our model with the following parameters: spatial coupling of replication-removal, full centripetal bias, and replicative lifespan (RLS) of 100.
Appendix 1—figure 2
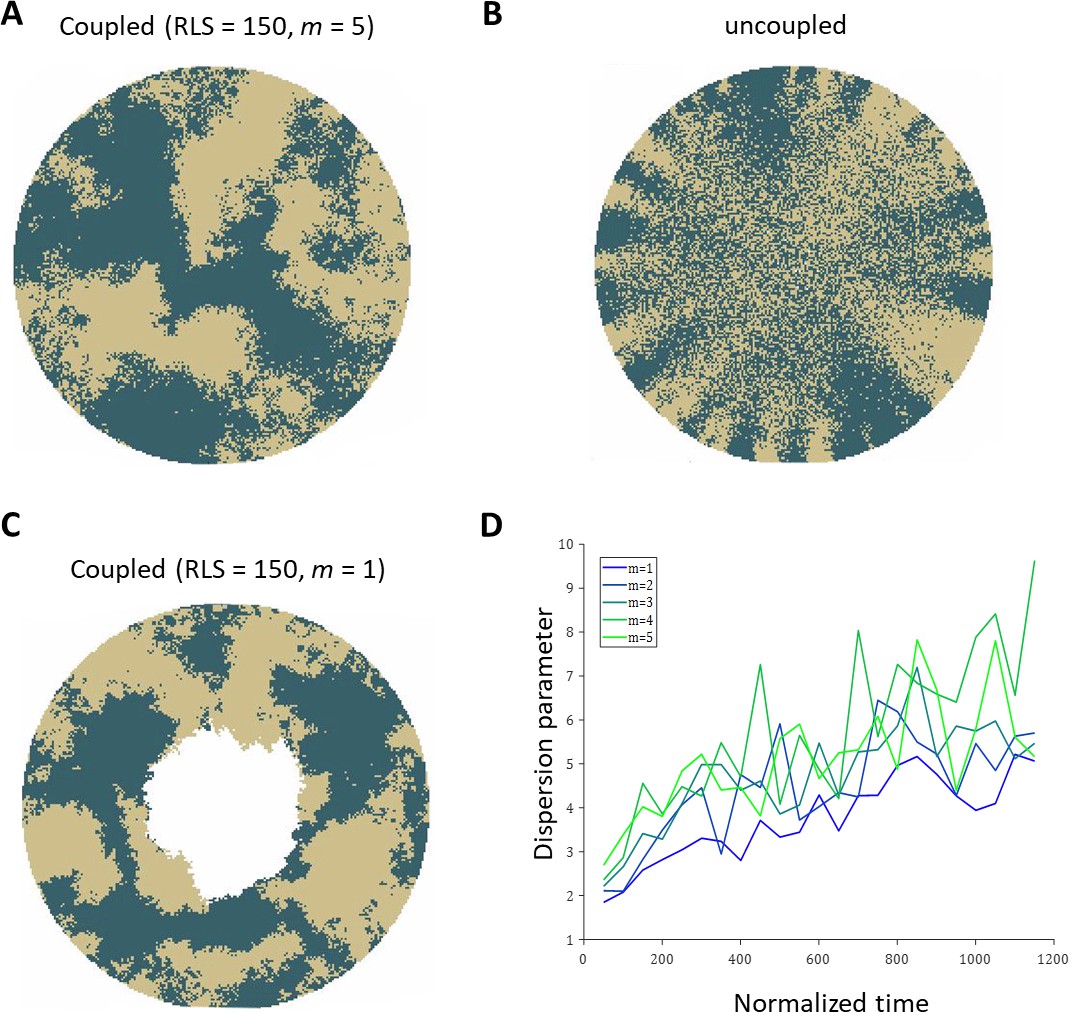
Realizations of the emerged patterns in the absence of centripetal bias.
(A) The case of coupled replication-removal with m = 5 and RLS = 150. The emerged pattern is that of contiguous patches. (B) Uncoupled replication-removal with RLS = 4. (C) coupled replication-removal with m = 1 and RLS = 150. The overall contiguous patches are similar to the m = 5 case. Note that in this case, RLS = 150 is lower than the critical RLS needed to renew the cornea. (D) Dispersion parameter as a function of normalized time for different values of m. Labeling of the limbal stem cell occurs at time zero. As m is smaller, the dispersion is slightly lower, yet the overall pattern is similar.
Appendix 1—figure 3

The unmixing parameter.
(A) Example of different patterns. The color above each pattern is used in panels B and C. (B) The unmixing parameter as a function of the distance from the limbus for the different patterns in A. Patterns that have centripetal stripes (blue) get a high value compared to a mixed pattern (orange) or a patchy pattern (green). (C) The dispersion parameter for the different patterns in A. This metric is sensitive to the boundaries mixing and does not differentiate between patches and stripes (Note that the lines for the centripetal stripes (Blue) and patchy pattern overlay). (D) The unmixing parameter for ideal (left) and noisy(right) stripe pattern.
Appendix 1—figure 4
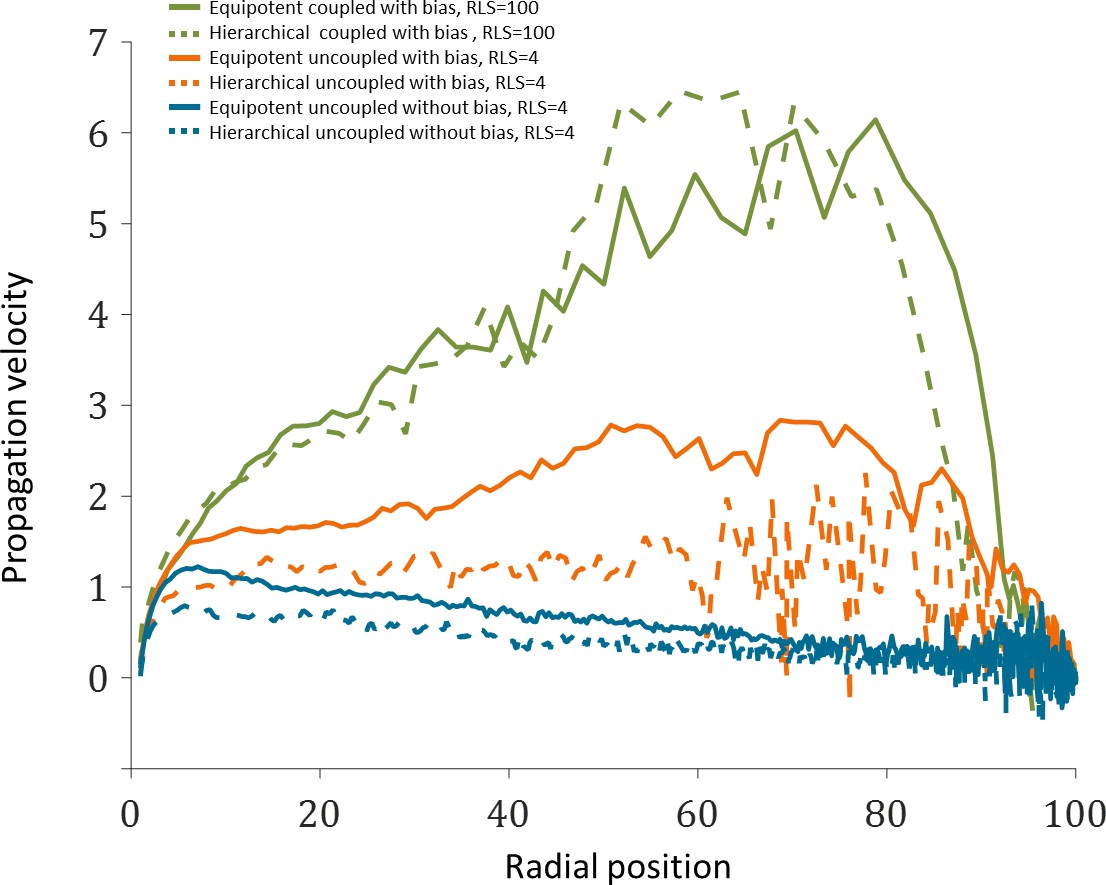
Propagation velocity as a function of radial position from the limbus.
The data plotted is the mean of the three realizations shown in Figure 7E of the main text.
Appendix 1—figure 5
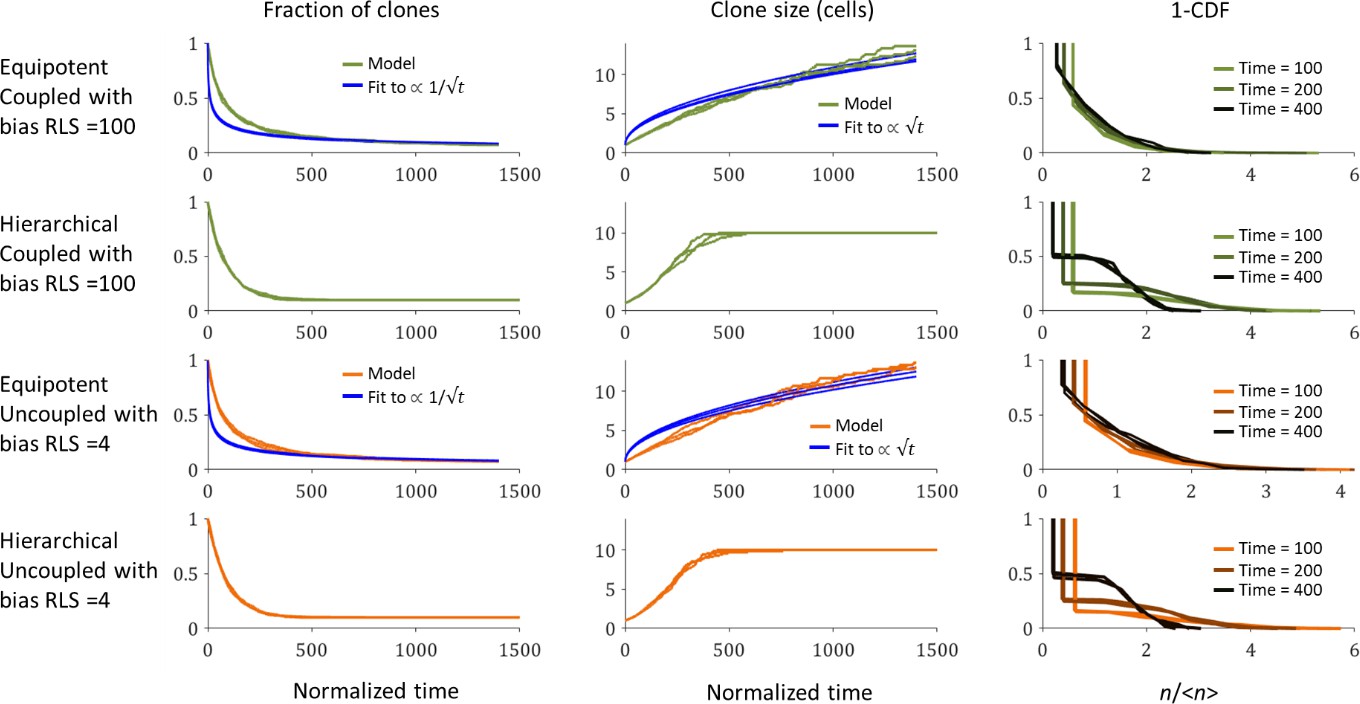
The dependence of limbal clone size distributions on time and stem cells properties.
The fraction of clones as a function of time (left), the average clone size as a function of time (middle), and one minus the cumulative distribution function (CDF) of the clone size scaled by the average at three time points. Three realizations are shown. Blue lines are the best fit for the model.
Appendix 1—figure 6
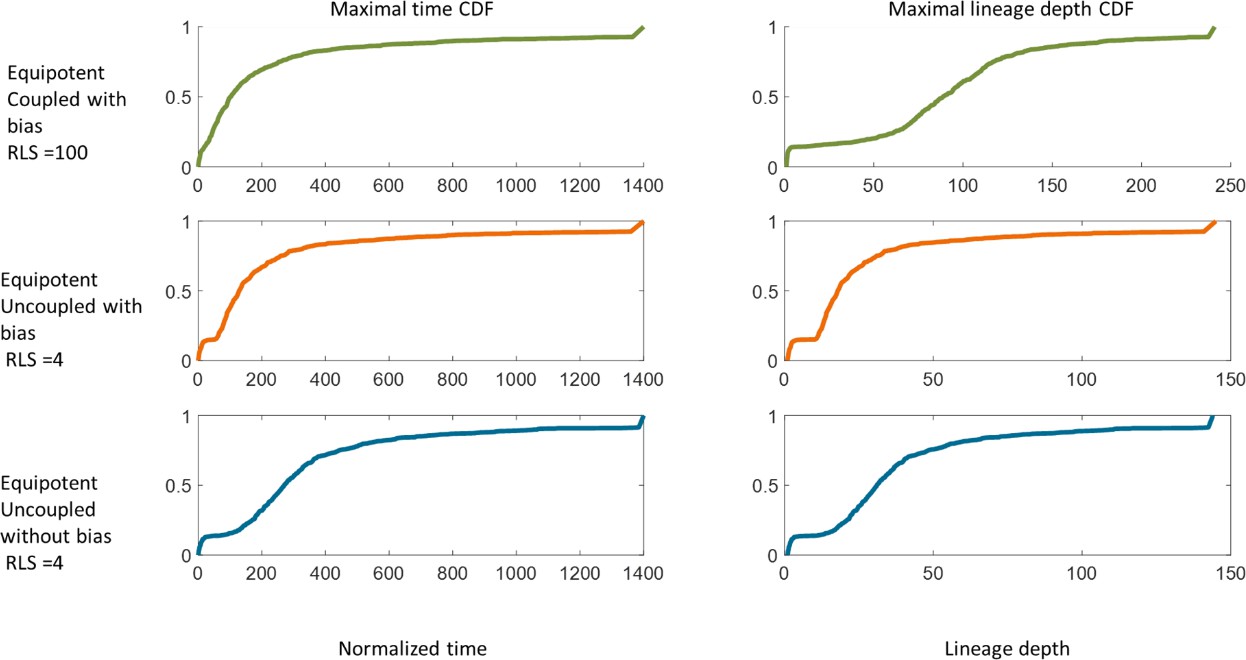
The cumulative probability distribution of linage removal time (left) and linage depth (right) for different models.
Videos
Video 1
Coupled spatial correlations in the absence of bias, RLS = 130.
In this case, RLS ≳ RLSmin and thus the cornea is fully rejuvenated. The emerging pattern is that of contiguous patches.
Video 2
Coupled spatial correlations with bias, RLS = 60.
Adding local centripetal bias results in a pattern of centripetal stripes.
Video 3
Uncoupled spatial correlations with the absence of bias, RLS = 10.
A centripetal pattern is formed near the limbus edge, and the order is diminished in the central cornea.
Video 4
Uncoupled spatial correlations with bias, RLS = 10.
Adding centripetal bias increases the overall clonal unmixing. Yet, the central region is less ordered.
Tables
Appendix 1—table 1
Model parameters and references.
| Parameter | Value and references |
|---|---|
| The radius of the cornea and basal corneal epithelial cell, R. | 100 Cells. (Di Girolamo et al., 2015; Dorà et al., 2015) |
| Probability of asymmetric replication of S cells, pa. | 0.85, Cornea (Richardson et al., 2016), Epidermis (Mascré et al., 2012), Esophagus (Doupé et al., 2012) |
| Neighborhood radius of interacting cell in the ‘coupled’ model, m. | 5 cells (Mesa et al., 2018; Miroshnikova et al., 2018) |
| Normalized renewal time. | Estimated cell cycle times based on double DNA labeling: Limbal label retaining cells ~ 14–21 days Limbal area cells (stem and early progenitors), Peripheral cornea, Central cornea ~ 3.0–5.5 days (Sagga et al., 2018). All of our time estimations are normalized to the doubling time of the cells. We used a relative proliferative rate that equals to 0.1. |
| Relative proliferative rates of the stem cells and progenitor cells . | 0.1, (Lavker et al., 1991; Sartaj et al., 2017) |
| The fraction of stem cells inside the limbus in the Hierarchical model, fs. | In the Hierarchical model estimates using label retaining vary from 3% to 20% (Lavker et al., 1991; Sagga et al., 2018; Sartaj et al., 2017; ) we used 10%. |
Additional files
Download links
A two-part list of links to download the article, or parts of the article, in various formats.
Downloads (link to download the article as PDF)
Open citations (links to open the citations from this article in various online reference manager services)
Cite this article (links to download the citations from this article in formats compatible with various reference manager tools)
Spatial correlations constrain cellular lifespan and pattern formation in corneal epithelium homeostasis
eLife 10:e56404.
https://doi.org/10.7554/eLife.56404


