Controlling opioid receptor functional selectivity by targeting distinct subpockets of the orthosteric site
- Department of Neurology and Molecular Pharmacology, Memorial Sloan Kettering Cancer Center, United States
- Department of Pharmacology, University of North Carolina, United States
- Center for Clinical Pharmacology, St. Louis College of Pharmacy and Washington University School of Medicine, United States
- Department of Anesthesiology, Washington University in St. Louis School of Medicine, United States
- Department of Quantitative and Computational Biology, Department of Chemistry, Bridge Institute, Michelson Center for Convergent Bioscience, University of Southern California, United States
- Division of Molecular Therapeutics, New York State Psychiatric Institute and Departments of Psychiatry, Pharmacology, Columbia University Vagelos College of Physicians & Surgeons, United States
- Department of Pharmacodynamics, University of Florida, United States
- Department of Anesthesiology, Rutgers New Jersey Medical School, New Jersey, United States
Abstract
Controlling receptor functional selectivity profiles for opioid receptors is a promising approach for discovering safer analgesics; however, the structural determinants conferring functional selectivity are not well understood. Here, we used crystal structures of opioid receptors, including the recently solved active state kappa opioid complex with MP1104, to rationally design novel mixed mu (MOR) and kappa (KOR) opioid receptor agonists with reduced arrestin signaling. Analysis of structure-activity relationships for new MP1104 analogs points to a region between transmembrane 5 (TM5) and extracellular loop (ECL2) as key for modulation of arrestin recruitment to both MOR and KOR. The lead compounds, MP1207 and MP1208, displayed MOR/KOR Gi-partial agonism with diminished arrestin signaling, showed efficient analgesia with attenuated liabilities, including respiratory depression and conditioned place preference and aversion in mice. The findings validate a novel structure-inspired paradigm for achieving beneficial in vivo profiles for analgesia through different mechanisms that include bias, partial agonism, and dual MOR/KOR agonism.
Introduction
Pain affects almost every person at some point in their lives, and it has been estimated that more than 25 million people in the United States suffer daily from severe pain (Nahin, 2015). Drugs targeting MOR are effective analgesics, but they retain high addiction potential and cause potentially lethal side effects including respiratory depression. As the use of opioid analgesics increased and then came under greater restrictions, so too has their diversion, misuse, and switch to illicit opioids, as ~80% of opioid addicts reported initiating their habit through prescription opioids. The epidemic of opioid abuse caused more than 47,600 deaths in 2017 alone, (Overdose Death Rates, 2019) making drug overdose the leading cause of accidental death in the US. As effective analgesics are essential to minimize the pain and suffering of many diseases, identification of safer analgesic molecular entities with diminished side effects and abuse potential is critical to breaking the vicious cycle fueling the opioid epidemic.
Biased signaling is an important concept in G protein-coupled receptor (GPCR) functional mechanisms, by which distinct downstream signaling pathways can be preferentially activated by agonists working through the same receptor (Law et al., 2013; Pradhan et al., 2012). It has been proposed that opioid ligands showing a preference (bias) for activating only G protein-mediated signal transduction pathways, or against recruiting βarrestin-2, will demonstrate diminished side effects (Raehal and Bohn, 2011; Chiang et al., 2016; Majumdar and Devi, 2018; Faouzi et al., 2020a). However, studies on G protein biased opioid ligands have shown mixed results so far. The first biased ligand, a MOR biased agonist oliceridine (TRV130) (DeWire et al., 2013) has been recently approved by the FDA (FDA Approves New Opioid for Intravenous Use in Hospitals, 2020). It is important to note, however, that TRV130 displays weak G-protein bias in vitro (Schmid et al., 2017) and mixed safety results in rodent models (Austin Zamarripa et al., 2018; Altarifi et al., 2017). Other MOR ligands with greater bias, such as SR17018 (Schmid et al., 2017), show diminished respiratory depression in rodents compared to fentanyl (Gillis et al., 2020a), while PZM21 (Manglik et al., 2016; Kudla et al., 2019) and mitragynine(s) (Váradi et al., 2016; Kruegel et al., 2016; Kruegel et al., 2019; Chakraborty and Majumdar, 2020) display reduced abuse liability (Yue et al., 2018; Hemby et al., 2019). Similarly, some KOR-selective G protein biased ligands such as HS666 (Spetea et al., 2017), 6′GNTI (Rives et al., 2012), and triazole 1.1 (Brust et al., 2016) show a promising separation of place aversion from analgesia, unlike balanced KOR agonists. On the other hand, other KOR ligands such as RB64 (White et al., 2015), HS665 (Spetea et al., 2017), and collybolide (Gupta et al., 2016) retain the aversive properties of balanced KOR agonists despite being G protein biased.
Together, these data suggest that the ‘classical model’ of bias or activation of a single opioid receptor subtype may not be sufficient for achieving an optimal pharmacological profile in vivo. Here, we tested the new hypothesis that dually selective agonist ligands working through the G protein pathway at both MOR and KOR could be synergistically analgesic while mitigating the common liabilities of conventional opioids. Prior evidence shows that simultaneous activation of MOR and KOR may produce synergistic analgesia, while the contrasting side-effects offset respective liabilities (Sutters et al., 1990; Pan, 1998). For example, KOR agonists such as U50,488h, while showing no sign of respiratory depression on their own, Matthes et al., 1998 have been reported to reduce the respiratory depression mediated by icv administration of DAMGO (Dosaka-Akita et al., 1993; Haji and Takeda, 2001). Likewise, nalbuphine, a moderate efficacy MOR partial agonist and high efficacy KOR partial agonist (Schmidt et al., 1985; Peng et al., 2007), is similar in analgesic efficacy to morphine, but shows negligible respiratory effects (Schmidt et al., 1985), suggesting that partial agonism coupled to mixed agonism at MOR/KOR may attenuate MOR-induced respiratory depression.
In this study, we used structure-based computational modeling to facilitate the design of compounds with G protein biased activity at both MOR and KOR. Comparative structural analysis and docking to opioid receptors, including the recent nanobody-stabilized active state KOR complexed with MP1104 (Che et al., 2018; Váradi et al., 2015a), suggested that specific receptor-ligand interactions at the TM5-ECL2 region in the orthosteric ligand pocket may reduce arrestin recruitment at both MOR and KOR (Figure 1A). In vitro characterization and structure-activity relationship studies (SAR) of a variety of new morphinan and fentanyl analogs reported here (Figure 1B), strongly support this hypothesis. In vivo studies of the most potent ligands with dual selectivity to MOR and KOR, partial agonism, and reduced arrestin recruitment, MP1207/MP1208, also show receptor-mediated analgesic actions in mice while negating classical side-effects of opioids, suggesting a new approach toward generating effective analgesics with attenuated opioid-induced adverse effects.
Figure 1
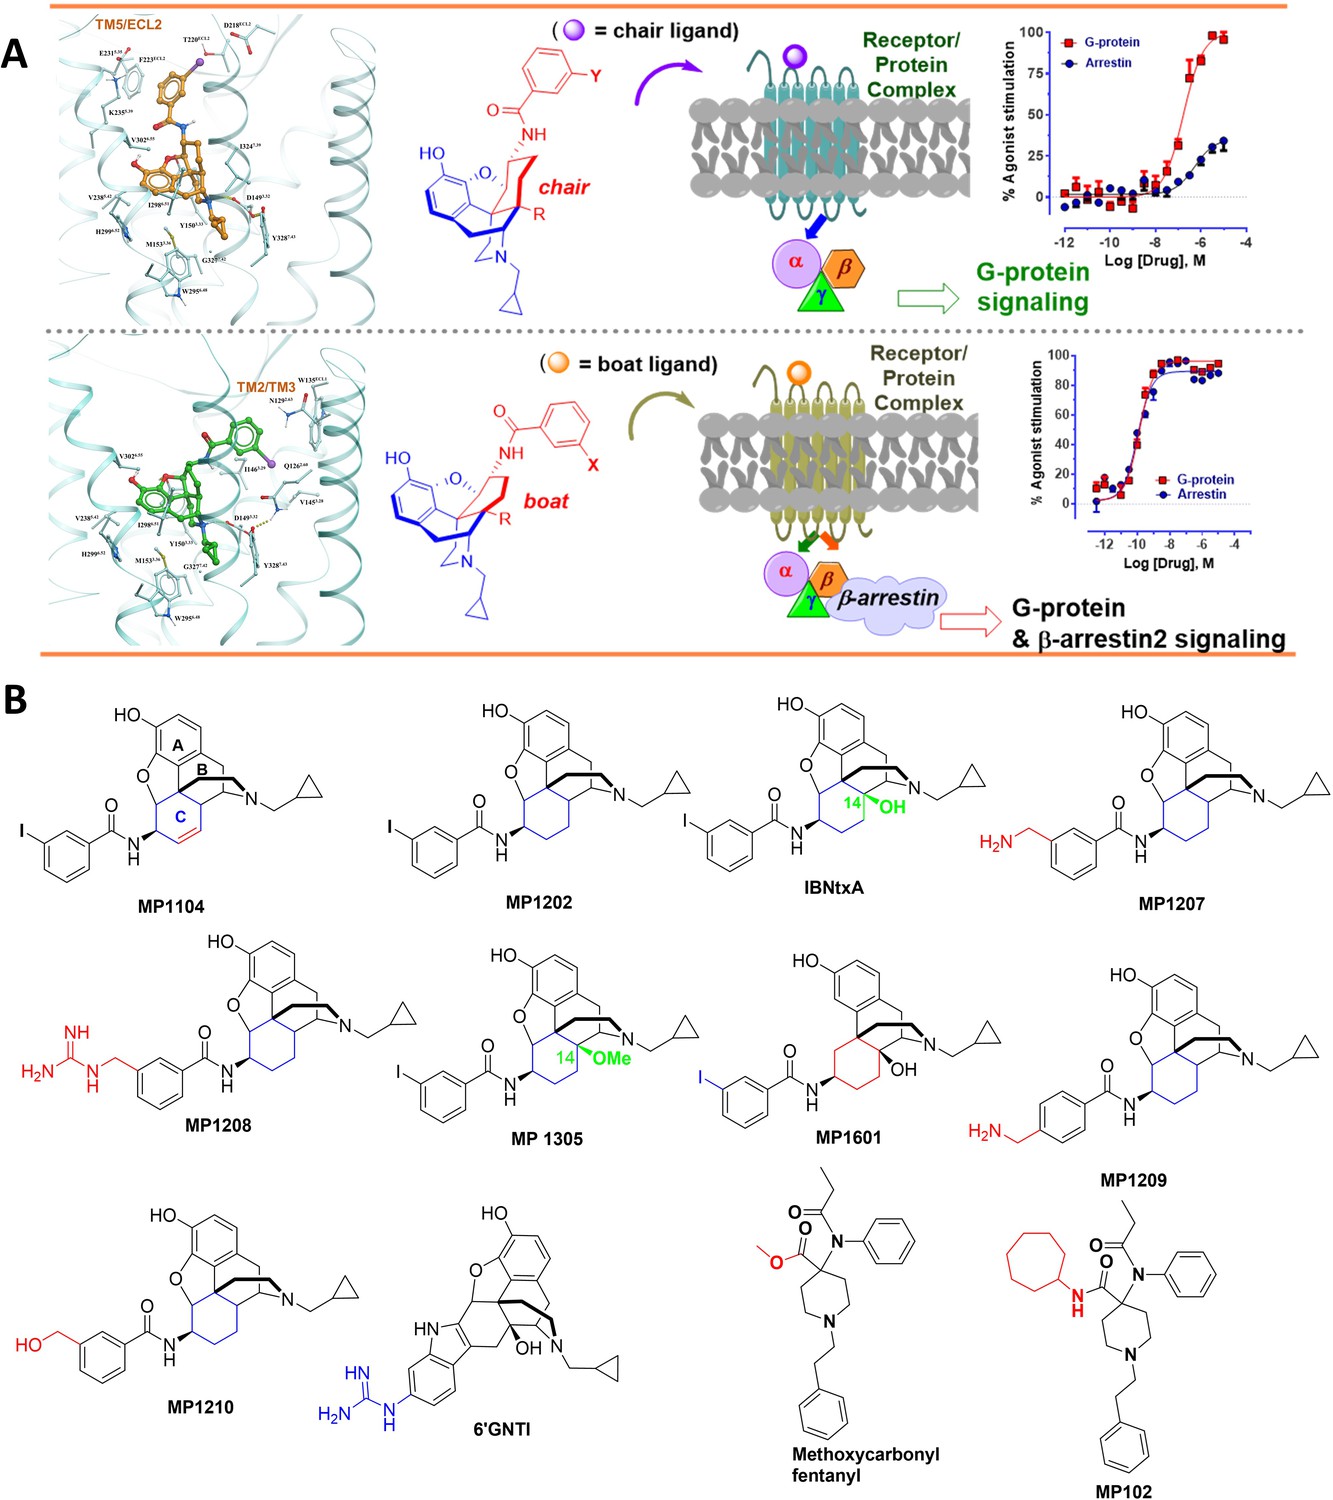
The design concept, structures of ligands synthesized and evaluated at opioids receptors.
(A) Overview of the key hypothesis, suggesting that TM5-ECL2 engagement by morphinan ligand with ring-C chair form leads to preferred G protein signaling, whereas TM2-TM3 engagement and ring-C boat form leads to balanced G protein and arrestin signaling. (B) Structures of the studied m and p-substituted arylamidoepoxymorphinans (MP1104, MP1202, IBNtxA, MP1305, MP1207, MP1208, MP1209, MP1210), m-iodoarylamidomorphinan, (MP1601), methoxycarbonylfentanyl, methoxycarbonyl fentanyl amide MP102 and 6′GNTI.
Results
MP1104 shows arrestin recruitment at both MOR and KOR subtypes
Previously, we used the amidoepoxymorphinan ligand MP1104 (Váradi et al., 2015a) to obtain the human KOR crystal structure in a nanobody-stabilized active state conformation (PDB code 6B73). Functional studies (cAMP and β-arrestin2 recruitment assays) showed that MP1104 robustly recruits β-arrestin2 at mu and kappa opioid receptors (Che et al., 2018). Its bias factors at hMOR and hKOR were determined to be 0.58 (Figure 2A–B and Appendix 1—figure 4B, Appendix 1—table 10) and 0.15 (Figure 2C–D and Appendix 1—figure 4A, Appendix 1—table 10), respectively. Bias factors reported throughout this work quantify preferred activation of a signaling pathway (G protein or βarrestin-2) by the ligand as compared to the prototypic balanced agonists, DAMGO and U50,488h, for MOR and KOR, respectively, A bias factor of >1 signifies compounds with G protein bias, a bias factor of <1 signifies arrestin bias, while compounds with bias factor lacking statistically significant deviation from one are deemed unbiased. The bias factor for each ligand was determined using functional data obtained from cAMP inhibition vs Tango assays or BRET assays, when applicable, by following previously reported methods of calculation (Kenakin et al., 2012).
Figure 2
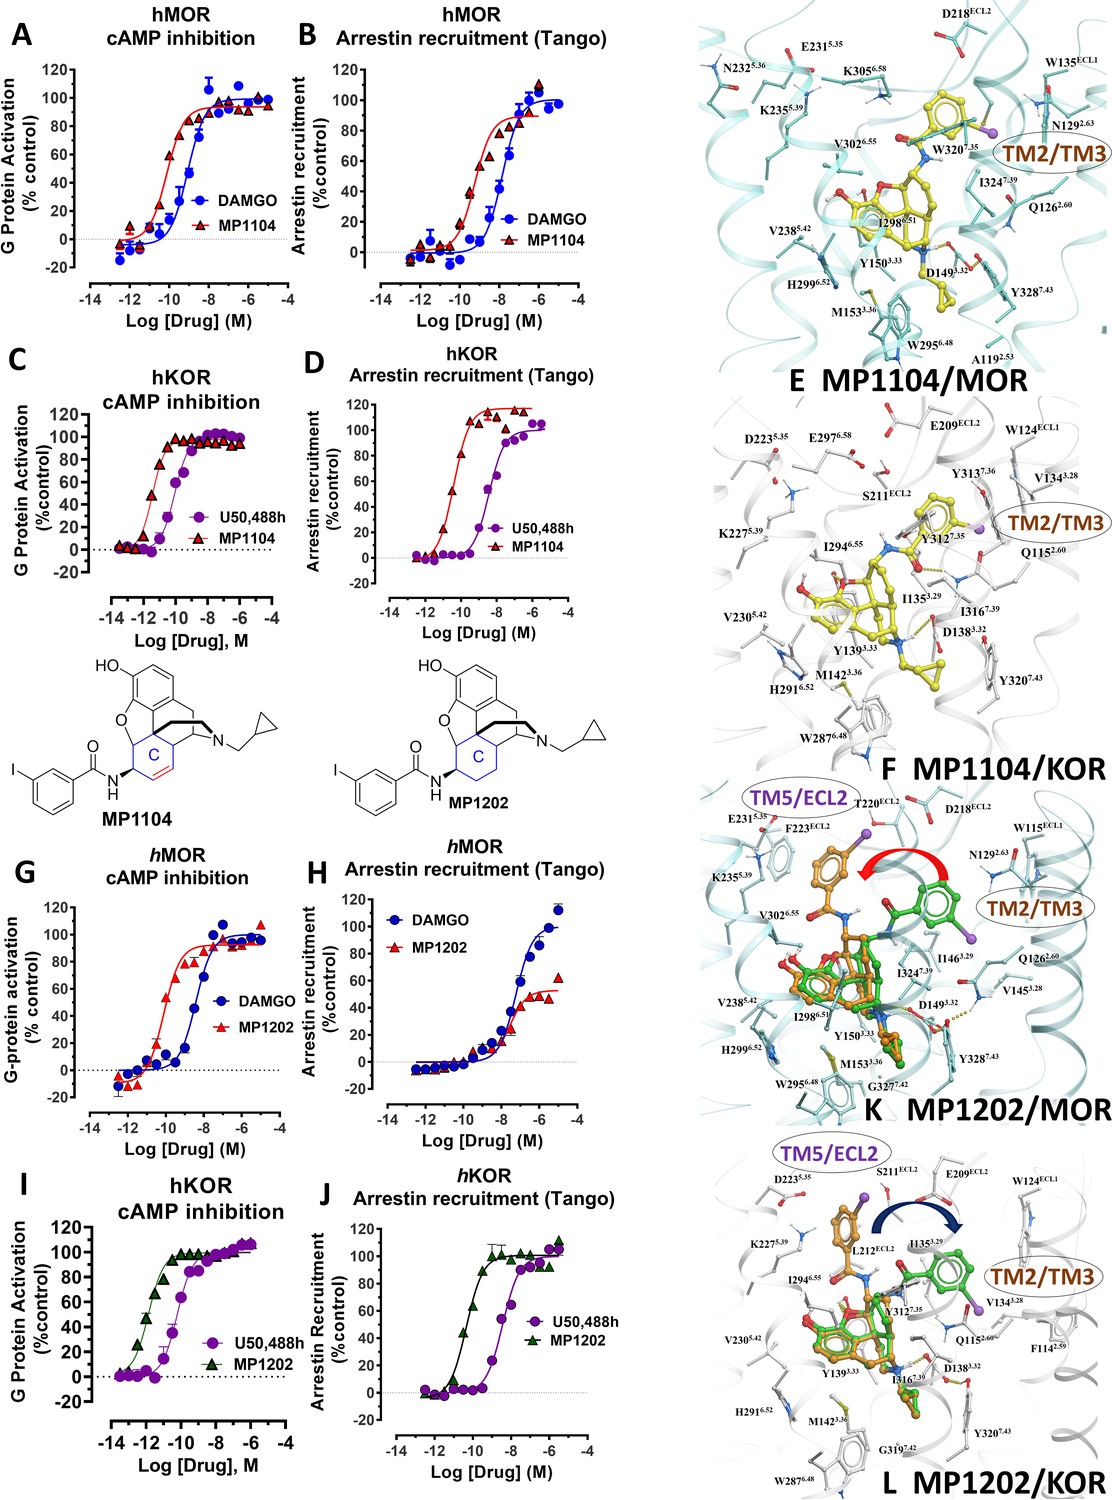
MP1104 at both MOR and KOR and MP1202 at KOR targets the TM2-TM3 region while MP1202 at MOR targets the TM5-ECL2 region and show distinct signaling properties.
(A-B) MP1104 (red) is a full agonist in hMOR in cAMP inhibition (N = 5) and Tango-arrestin recruitment assays (N = 5) compared to DAMGO (blue). (C–D) MP1104 (red) is a full agonist in hKOR in cAMP inhibition (N = 3) and Tango-arrestin recruitment assays (N = 3) compared to U50,488H (purple). (E–F) The preferred docking pose of MP1104 (boat form, yellow stick) at MOR and MP1104 (boat form, yellow stick) in the active state of KOR. Ring-C of MP1104 in boat form forces the iodophenyl moiety to reside in a region between TM2-TM3 at MOR/KOR. (G–H) MP1202 (red) is a full agonist in hMOR in cAMP inhibition (N = 3) and partial agonist in Tango-arrestin recruitment assays (N = 3) compared to DAMGO (blue). (I–J) MP1202 (green) is a full agonist in hKOR in cAMP inhibition (N = 3) and in Tango-arrestin recruitment assays (N = 3) compared to U50,488h (purple). (K–L) The docking poses of MP1202 (chair form, brown stick) and (boat form, green stick) at an active states of MOR and KOR are shown. At MOR, the saturated ring C in MP1202 leads to interaction of the ligand in the ECL2 and TM5 region leading to a preference of chair form shown by a red arrow. At KOR, MP1202 behaves similar to MP1104 and the flip of ring C conformation from chair to boat is shown by a blue arrow. See Appendix 1—table 7 for values, Appendix 1—figure 4 and Appendix 1—table 10 for bias calculations.
Here, we evaluated the potency and efficacy at G protein activation as well as arrestin recruitment of MP1104 using BRET assays which afford a more precise interrogation of transducer bias (Kruegel et al., 2016) in HEK-293T cells transfected with rodent opioids receptors (mMOR and rKOR). Confirming the cAMP inhibition assay and β-arrestin2 recruitment results obtained for human opioid receptors, MP1104 was found to be arrestin biased at both mMOR (Appendix 1—figure 1A and 4C, Appendix 1—table 11) as well as rKOR (Appendix 1—figure 2A and 4C, Appendix 1—table 11) with bias factors of 0.11 and 0.23, respectively.
Synthesis and evaluation of MP1202: a MOR G biased and KOR agonist recruiting arrestin
In contrast to MP1104, the closely related ligand IBNtxA (Majumdar et al., 2011a; Figure 1B) with a hydroxyl (C14-OH) group and a saturated ring C, showed reduced β-arrestin2 recruitment at hMOR while recruiting β-arrestin2 through hKOR activity (Appendix 1—figure 3A-D and 4A-B and Appendix 1—table 10, bias factor = 0.1 at hKOR and 24 at hMOR) (Che et al., 2018). At rodent receptors, we presently confirmed that IBNtxA trended toward reduced potency in the arrestin pathway versus the G protein pathway compared to DAMGO. Interestingly, while we were not able to determine its potency in the arrestin pathway its efficacy (Emax = 75%) was greater than seen in the G protein pathway (Emax = 59%) at mMOR (Appendix 1—figure 3F-G and 4C, Appendix 1—table 11) and IBNtxA showed no bias at rKOR (Appendix 1—figure 3H-I and 4C, Appendix 1—table 11). As a continuation of SAR studies on 6β-amidoepoxymorphinans to identify the structural features responsible for β-arrestin2 recruitment over G protein activation, we here synthesized MP1202 (C14-H instead of C14-OH in IBNtxA) with the saturated cyclohexyl ring C (see synthesis in Appendix 1—scheme 1A). Evaluation of MP1202 in radioligand binding assays in opioid receptor transfected cell lines showed that it retained pan opioid sub-nM binding (Appendix 1—table 1) and sub-nM potency in the G-protein pathway in GTPγS assays (Appendix 1—table 2). At human opioid receptors, MP1202 was similar to IBNtxA and was found to be G protein biased at hMOR (bias factor = 31, Figure 2G–H, Appendix 1—figure 4B and Appendix 1—table 10) while showing β-arrestin2 recruitment and arrestin bias at hKOR (Figure 2I–J, Appendix 1—figure 4A, and Appendix 1—table 10).
At rodent receptors in BRET assays, MP1202 retained β-arrestin2 recruitment at rKOR (Appendix 1—figure 2C and 4C and Appendix 1—table 11), although showing a diminished β-arrestin2 potency at mMOR relative to DAMGO. Similar to IBNtxA a greater efficacy was seen in the arrestin pathway (Emax = 57%) compared to the G protein pathway (Emax = 70%) (Appendix 1—figure 1C).
Predicted engagement of the TM5-ECL2 region promotes G protein bias
Differences in the bias profiles of MP1104, IBNtxA, and MP1202 suggested distinct interaction modes of these ligands at MOR and KOR. We relied on both the ligand-based and the receptor-based structure design approaches to understand the observed pharmacology. In terms of ligand structure, the three ligands have two structural variations among them: the presence/absence of C14-OH and the saturation/unsaturation of ring C (Figure 1B). The similarity of the bias profiles for IBNtxA and MP1202 suggested that C14-OH is not important for bias. However, the contrast between the strong preference of IBNtxA and MP1202 for the G protein pathway compared to MP1104 at MOR suggested a useful SAR between the conformation of the C ring and ligand function. Indeed, we found a strong preference for the unsaturated ring C of MP1104 to be in the boat conformation, based on analysis of similar ligands in the Crystallography Open Database and our quantum mechanics (QM) energy calculations. At the same time, the saturated C rings of both IBNtxA and MP1202 could assume both chair and boat conformations with only a modest preference for chair conformation (Appendix 1—tables 3–4). To analyze the differences between the boat and chair conformations of the C rings in the context of ligand-receptor interactions, we performed energy-based docking studies for these ligands in all-atom models of the receptors, based on recently solved active-state crystal structures for MOR (Huang et al., 2015) and KOR (Che et al., 2018). Due to the boat-form restriction for the unsaturated ring C, the amidophenyl moiety of the best-scored docking poses for MP1104 in both MOR and KOR occupied a sub-pocket between TM2 and TM3 (Figure 2E and F). In the absence of such conformational limitation for the saturated ring C in IBNtxA and MP1202, both chair and boat conformations of the ring were observed among the top 10 poses ranked by energy score. However, we found that in MOR the best-scored IBNtxA (Appendix 1—figure 3E) and MP1202 (Figure 2K) docking poses consistently adopted the chair conformation of ring C, while in KOR the best-scored poses adopted the boat conformation (Appendix 1—figure 3J and Figure 2L).
These reproducible differences between KOR and MOR can be explained by different physical properties of their TM2/TM3 sub-pockets, which accommodate the hydrophobic amidophenyl arm of these ligands. This sub-pocket is more hydrophobic in KOR because of the presence of the non-conserved V1182.63 residue and a conformational change in the conserved Q1152.60 residue. Although the MOR sub-pocket does share some hydrophobic residues, namely WECL2, V3.28 and I3.29, exposed polar groups of the N1292.63 and Q1262.60 side chains increase the polarity. Therefore, while in KOR the hydrophobic amidophenyl arm of the ligand retains its preference for binding the TM2-TM3 sub-pocket, in MOR it is preferentially redirected toward the TM5-ECL2 region. Apparently, this binding interaction preference of the amidophenyl arm of IBNtxA and MP1202 is reflected in the switching of the ring-C from the chair conformation when bound in MOR to the boat conformation when interacting with KOR. Notably, this concerted switch of ring-C conformation and the amidophenyl ‘arm’ position correlates with the observed signaling bias. Specifically, whereas the chair conformation of IBNtxA and MP1202 in MOR results in the ‘arm’ interactions with the TM5-ECL2 region and favors G protein activation, the boat conformation in KOR results in TM2-TM3 sub-pocket interactions and enhanced preference for balanced agonism or the arrestin pathway. This observation is further corroborated by the activation of the arrestin pathway in both MOR and KOR found for the boat-restricted conformation of the MP1104 ligand.
Structure-inspired design of MP1207 and MP1208 as dual MOR/KOR agonists showing reduced arrestin recruitment
Based on the above analysis, we hypothesized that a structure-inspired design of MP1202 analogs that are G protein biased not only at MOR, but also at KOR would require a switch in preference of amidophenyl arm substituents from the TM2-TM3 sub-pocket to the TM5-ECL2 region in both receptors. To test this hypothesis, we proposed to redesign the MP1202 ligand by introducing a polar or charged moiety at the amidophenyl ‘arm’ to make its interactions at the hydrophobic TM2-TM3 pocket of KOR unfavorable. Further, since the TM5-ECL2 region in KOR is lined by acidic residues D2235.35 and E209ECL2, the presence of basic moieties at the amidophenyl arm would be expected to provide additional favorable interactions to shift its preference toward the TM5-ECL2 region. Interestingly, in the docking pose for 6'GNTI in KOR, a known G protein biased ligand (Rives et al., 2012; Schmid et al., 2013), the guanidino group also occupies the TM5-ECL2 region (Appendix 1—figure 5).
As a part of the computer-assisted design, we proposed a library of analogs where the m-iodo group was swapped with polar groups such as OH, NH2 NMe2, (CH2)nNH2 and (CH2)n-guanidine (n = 1–5 for amine and guanidine modification). Docking of these derivatives into the active state KOR structural model allowed computational predictions of their binding scores and conformational preferences (Appendix 1—table 5). Two analogs, calculated to have the greatest preference for the ring C chair form and interactions with the TM5-ECL2 region at both MOR and KOR MP1207 and MP1208 (Figures 1B, 3C–D and G–H) were selected and synthesized (Appendix 1—scheme 1B).
Figure 3
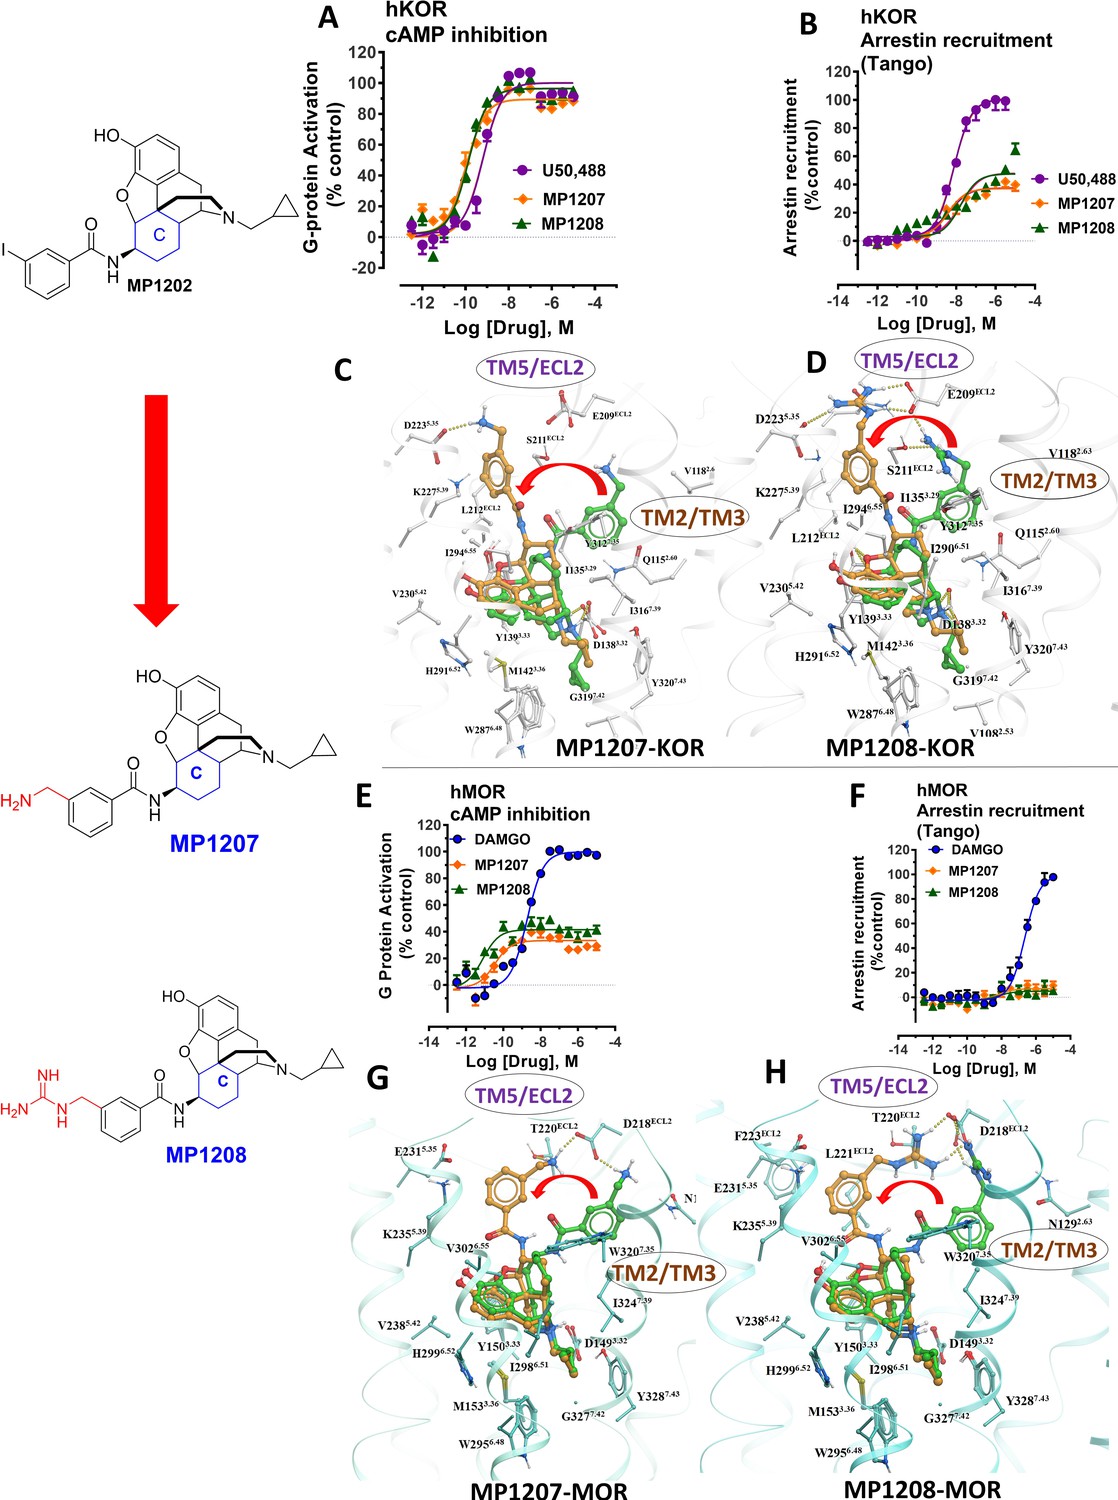
meta-Amino (MP1207) and meta-guanidino (MP1208) analogs prefer the chair conformation and target the TM5-ECL2 region and are G protein biased agonists at KOR and at MOR show no measurable arrestin recruitment.
(A-B) MP1207 (orange) and MP1208 (green) are full agonists at hKOR in cAMP inhibition (N = 3) and partial agonists in Tango-arrestin recruitment assays (N = 3) compared to U50, 488 (purple). (C–D) Docking results showed that amino methyl (MP1207) or guanidino (MP1208) moieties (replacing the iodo group in MP1202) forced these compounds in chair form preferred confirmation at hKOR (chair form in brown stick and boat form in green stick). Unlike boat MP1202, chair MP1207 at hKOR may form a new salt bridge interaction between amino group and D2235.35 and E209ECL2 pulling amidophenyl moiety away from the hydrophobic pocket between TM2 and TM3 (C). Likewise, chair MP1208 forms salt bridge interactions between guanidino group and D2235.35 as well as with E209ECL2 (D) The flip in conformation of ringC from boat to chair for both MP1207 and MP1208 is shown by a red arrow. (E–F) MP1207 (orange) and MP1208 (green) are partial agonists at hMOR in cAMP inhibition (N = 3). No arrestin recruitment was observed for both agonists in Tango-arrestin recruitment assays (N = 3) compared to DAMGO (blue). (G–H) At hMOR chair forms of MP1207 and MP1208 introduce additional interactions between amino or guanidino group and D218ECL2 and T220ECL2. Thus, biased signaling events of MP1207 and MP1208 are dictated from chair favored binding via the involvement of their m-amino or m-guanidino group with TM5 -ECL2 region. See Appendix 1—table 7 for values, Appendix 1—figure 4 and Appendix 1—table 10 for bias calculations.
Functional studies using cAMP inhibition and Tango assays at human opioid receptors showed that both MP1207 and MP1208 are G protein biased agonists at hKOR with bias factors of 8 and 22 (Figure 3A–B, Appendix 1—figure 4A and Appendix 1—table 10), respectively. At hMOR, recruitment of arrestin was completely abolished for both ligands; however, reduction of cAMP inhibition was also observed, with Emax values of = 33% for MP1207 and 42% for MP1208 compared to DAMGO (Figure 3E–F). In the cAMP assay, the prototypic MOR agonist morphine acted as a full agonist (Emax = 97%) whereas buprenorphine was a partial agonist (Emax = 75%) compared to DAMGO (Appendix 1—table 7). In binding assays, both MP1207 (m-amine group) and MP1208 (m-guanidine group) showed similar affinities at mMOR (Ki = 0.23 nM and 0.34 nM) and mKOR (Ki = 0.39 and 0.28 nM) with substantial selectivity over mDOR (Ki = 15.62 and 19.28 nM) (Appendix 1—table 1). In [35S]GTPγS binding assays both MP1207 and MP1208 were partial agonists at both mKOR and mMOR, still maintaining very high potency at mKOR (EC50 = 1.5 and 1.4 nM) and at mMOR (EC50 = 1.3 and 1.1 nM). At mDOR both MP1207 and MP1208 show only weak efficacy (Appendix 1—tables 2 and 6). Similar results of partial agonism at mMOR (Appendix 1—figure 1D) and rKOR were seen in BRET assays (Appendix 1—figure 2D). The controls morphine (Emax = 110%) and buprenorphine (59%) were found to produce full and partial agonism at mMOR in the same assay, respectively (Appendix 1—table 7). No recruitment of βarrestin-2 was seen with either MP1207 or MP1208 when rodent opioid receptors were used in BRET assays. The arrestin recruitment signal for both MP1207 and MP1208 at hMOR, mMOR and rKOR were too low for the bias factors at these receptors to be calculated.
To investigate specificity, MP1207 was counter-screened for agonism against 330 other GPCRs using a Presto-Tango assay. Activity at 3 μM was observed at some other targets; however, no potent activity was confirmed with a full concentration–response experiment at these targets (Appendix 1—figure 6). Since this assay relies on arrestin recruitment and our ligand was found to show limited β-arrestin2 recruitment at its primary targets, MOR and KOR, we further counter-screened MP1207 using radioligand binding assays. MP1207 had a Ki >10 µM affinity at all screened targets except SERT and α2C-adrenoreceptors, which displayed Ki (pKI± SEM) of 356 (6.45 ± 0.091)nM and 2979 (5.53 ± 0.16) nM respectively (Besnard et al., 2012). At MOR, KOR, and DOR the respective values were 0.39 (9.4 ± 0.042), 0.39 (9.4 ± 0.056), and 60.1 (7.22 ± 0.059) showing a 900-fold selectivity for MOR and KOR over the nearest non-opioid target.
Molecular dynamics and additional MP1207 analog design support TM5-ECL2 region role in signaling bias
MP1207 and MP1208 were designed to target the TM5-ECL2 region of KOR via their amidophenyl arm accessing additional interactions with polar residues D2235.35 and E209ECL2 (See Figure 3C–D), capitalizing on the structure-based modeling predictions. We carried out MD simulations on MP1207 in KOR (Figure 4A–B). Over 50% of the cumulative trajectory frames from the two 1000 ns long MD runs had distances between carboxylate oxygens of these acidic residues within 4.5 Å of methyl amine nitrogen atom of MP1207. The methyl amine of MP1207 can form salt bridge interactions with both E209ECL2 and D2235.35 residues, and during MD simulations a fluctuating switch between these two residues was observed. The MD simulations indicate that these salt bridges are possible and moderately stable. These results support our key design hypothesis which posits an interaction between the basic amino and guanidine moieties of MP1207 and MP1208 with the negatively charged D2235.35 and E209ECL2 side chains in TM5-ECL2 region, and an important role of these interactions in reducing preference for the arrestin pathway and/or recruitment.
Figure 4

MD simulations in hKOR with MP1207 show the guanidine group interacts with E209/D223 and analogs of MP1207 not oriented toward TM5-ECL2 region suggest G protein bias of MP1207/08 is dependent on salt-bridge formation in this region.
(A) Docking of MP1202 (green sticks) and MP1207 (yellow sticks) in wild type KOR showing MP1207 chair form engaging D223 and E209 residues in TM5-ECL2 region while MP1202 boat form not engaging this region. (B) Graph plotting distances between methyl nitrogen atom of MP1207 and side-chain carboxylate atoms of Glu209ECL2 and Asp2235.35 during two 1000 ns long MDs runs of MOR-MP1207 complex. Distances of each trajectory frame and running average are plotted for Glu209ECL2 (light orange and orange) and Asp2235.35 (light green and green). (C–D) MP1209 (blue) and MP1210 (light green) are full agonists at hKOR in cAMP inhibition (N = 3) and Tango-arrestin recruitment assays (N = 3) compared to U50,488h (purple). (E–F) Similarly, MP1209 (red) and MP1210 (orange) are partial agonists at hMOR in cAMP inhibition (N = 3). No arrestin recruitment was observed for both agonists in Tango-arrestin recruitment assays (N = 3) compared to DAMGO (blue). Regioselectivity of ring substituent is important for kappa bias. The p-methyl amino and m-methyl alcohol do not form salt-bridge within TM5-ECL2 unlike the m-methyl amino group of MP1207 as a result similar to MP1202 with respect to bias at KOR and lower arrestin signaling at MOR. See Appendix 1—table 7 for values, Appendix 1—figure 4 and Appendix 1—table 10 for bias calculations.
Conversely, the design hypothesis also suggests that the relocation of the amidophenyl arm can be achieved by hampering its interactions in the TM2/TM3 subpocket. Indeed, we had previously shown that a mutation of Y312W7.35 in the TM2-TM3 region of KOR reduces βarrestin-2 recruitment for IBNtxA, which has a similar amidophenyl arm (Che et al., 2018). While the residues in this position do not make direct contact with the receptor in our models, this mutation is likely to impact binding indirectly (See Appendix 1—figure 7I showing Bu72-MOR TM2-TM3 and Appendix 1—figure 7J showing MP1202-KOR TM2-TM3 region interactions).
In the present study, we tested the effects of the Y312W7.35 mutation on MP1202, MP1207 and MP1208. As expected, this mutation in KOR reduced arrestin recruitment by MP1202 to the level observed for MOR, resulting in strong G protein bias (bias factor = 34, Appendix 1—figure 7A&C and L) as opposed to robust β-arrestin2 recruitment in the wild-type KOR (Appendix 1—figure 7B and D). A similar trend was found with MP1207 and 1208, revealing a further reduction of arrestin recruitment at the mutant KOR receptor (Appendix 1—figure 7E-G), down to the level seen in wild type MOR (Appendix 1—figure 7H). These results suggest that similar to IBNtxA, the Y312W7.35 mutation in KOR changes the conformational character of the sub-pocket to a MOR-like shape, possibly by changing the conformation of Q1152.60, and also leads to loss of water-mediated hydrogen bonding with the amido group. Therefore, Y312W7.35 provides an environment that favors the chair conformation, leading to a shift in ligand bias toward G protein activity (Appendix 1—figure 7K).
To further evaluate the role of salt bridges in facilitating ligand conformations with the amidophenyl arm in the TM5-ECL2 region, we synthesized two MP1207 analogs by swapping the m-CH2NH2 with p-CH2NH2 (MP1209) and m-CH2OH (MP1210) (Figure 1B, Appendix 1—scheme 2). Consistent with our predictions (Appendix 1—table 4), the para-substituted and more planar analog, MP1209 and the meta substituted methyl hydroxyl analog (MP1210) which are incapable of forming a salt bridge with D2235.35 and E209ECL2, lost their G protein bias in hKOR and showed no bias (Figure 4C–D, Appendix 1—figure 4A and Appendix 1—table 10) while retaining hMOR null arrestin recruitment (Figure 4E–F). Thus, only when ideal orientation/distances are maintained (i.e. meta-amino/guano) and the amidophenyl arm is accommodated in the TM5-ECL2 region of KOR, is a bias for G protein activity observed. Taken together, the described MD analysis combined with assessment of epoxymorphinan analogs targeting in the TM5-ECL2 region further corroborated our hypothesis that interactions in this region can be critical for G protein bias at KOR.
Design of other morphinan and fentanyl based analogs engaging TM5 support its role in signaling bias
To further explore the hypothesis that TM5 interactions promote G protein bias for scaffolds beyond epoxymorphinans we next examined the fentanyl template. We have published a series of methoxylcarbonyl fentanyl amides previously (Váradi et al., 2015b). We docked a published compound MP102 at MOR and found that the cycloheptyl group is predicted to line up in the TM5 region, a region not accessed by methoxylcarbonyl fentanyl (Appendix 1—figure 8E). We evaluated G protein/arrestin activity of both compounds and found that as expected, methoxylcarbonyl fentanyl showed strong arrestin recruitment and arrestin bias (bias factor = 0.09 at hMOR, Appendix 1—figure 8A-B, C-D and 8 and Appendix 1—table 10) while MP102 targeting TM5 was unable to recruit arrestin at human (Appendix 1—figure 8F-G) and mouse receptors (Appendix 1—figure 8H-I).
Continuing with epoxymorphinan/morphinan SAR, m-iodo analogs MP1305 (methylated OH as C14-OCH3), and MP1601 from morphinan template (devoid of the etheral bridge linking rings A and C) were synthesized (Appendix 1—schemes 3 and 4). Our computational docking studies suggested that ring C of MP1305 prefers the chair form at both MOR and KOR (See Appendix 1—figures 9I, K for details), while MP1601 favors the chair form at MOR and boat form at KOR (Appendix 1—figure 9J,L). Consistent with our docking predictions, MP1305 was found to be G protein biased at MOR and KOR at human receptors with a bias factor of 11 and 4, respectively (Appendix 1—figure 9A-D and 4A-B and Appendix 1—table 10) while MP1601 behaved similar to IBNtxA and MP1202 and showed a preference for the arrestin pathway at hKOR (bias factor = 0.5, Appendix 1—figure 9E-F and 4A and Appendix 1—table 10) while being G protein biased at hMOR (Bias factor = 4, Appendix 1—figure 9G-H and 4B and Appendix 1—table 10).
At rodent receptors, both compounds showed sub-nM affinity and high potencies in [35S]GTPγS assays (Appendix 1—tables 1–2). Due to very low arrestin signal, it was impossible to calculate the bias factor at rodent receptors from the BRET assays at MOR for both MP1305 and 1601, and for MP1601 at KOR (Appendix 1—figures 1E, 2E). MP1601 was not biased at rKOR, but did demonstrate arrestin bias at hKOR (Appendix 1—figures 1–2E and 4C and Appendix 1—table 11). These results are again consistent with our hypothesis correlating G protein bias (and reduced recruitment of arrestin) of the morphinan derivatives with their C-ring chair conformation and the resulting positioning of the amidophenyl arm in the TM5-ECL2 region. At the same time, the abolished arrestin recruitment could also be a consequence of partial agonism (see discussion, below).
In vivo pharmacology of MP1207 and MP1208
Antinociception of MP1207 and MP1208 was evaluated in vivo in mice using a standard 55°C warm-water tail withdrawal assay, with the compounds administered supraspinally (icv) since both compounds were not expected to show systemic activity when administered IP because of being positively charged at physiological pH. The antinociceptive ED50 (and 95% CI) values of MP1207 and MP1208 were 6.1 (4.1–8.9) nmol (Figure 5A), and 7.2 (5.0–10.2), nmol respectively, comparable to that of the kappa agonist U50,488h, 8.8 (5.7–13.5) nmol, although slightly higher than the ED50 of morphine, 4.77 (1.49–28.8) nmol, icv. Both drugs showed antinociceptive responses that peaked at 10 min, returning to baseline values 90 min later for MP1207 (Figure 5B) and 60 min for MP1208 (Figure 5C).
Figure 5
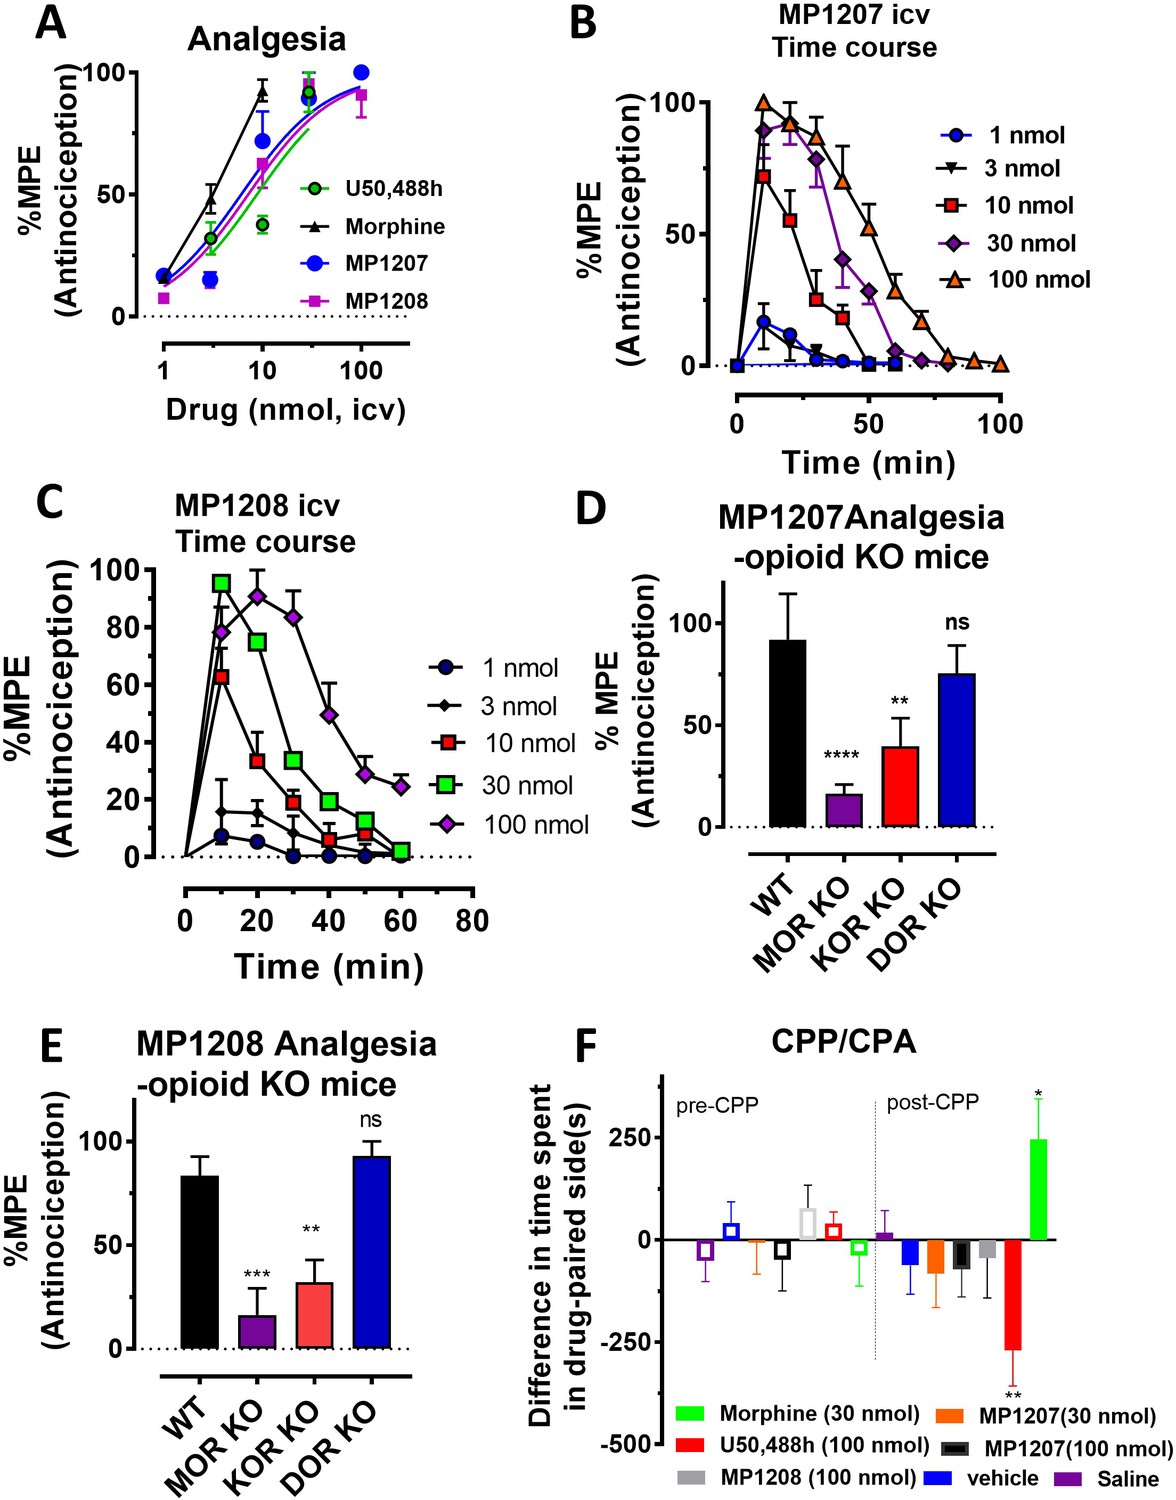
MP1207/1208 show MOR/KOR-mediated antinociception without showing place preference or aversion.
(A) Dose-response curve: Groups of C57BL/6J mice were supraspinally (icv) administered MP1207, MP1208, morphine and U50,488h and antinociception measured using the 55°C tail withdrawal assay at peak effect. Data are shown as mean % antinociception (MPE) ± SEM. ED50 (with 95% CI) values = 6.1 (4.1–8.9) nmol, 7.2 (5.0–10.2) nmol, 4.77 (1.49–28.8) nmol, and 8.8 (5.7–13.5) nmol were calculated for MP1207, MP1208, morphine and U50,488h respectively. (B–C) Antinociceptive time course: Effect of MP1207 (B) and MP1208 (C) at doses of 1, 3, 10, 30, and 100 (n = 8 each group, with n = 16 for MP1208 at 30 nmol) with repeated measures over time. (D–E) MP1207/08 analgesia in KO mice: Analgesic effect of MP1207 (30 nmol icv, D ) and MP1208 (35 nmol icv, E) was evaluated in groups (n = 8) of WT (C57BL/6J), MOR KO, KOR KO, and DOR KO mice. Antinociception of MP1207/08 remained intact in DOR KO mice while it was attenuated in MOR KO and KOR KO mice. Results for MP1207 were analyzed with one-way ANOVA followed by Dunnett’s post hoc test; F3,28=10.11, p=0.0001.**p=0.005 relative to WT, ****p<0.0001 relative to WT, ns = p>0.05 relative to WT. Similarly, MP1208 results were analyzed with one-way ANOVA followed by Dunnett’s post hoc test, F3,28=15.35, p<0.0001.**p=0.005 relative to WT, ****p<0.0001 relative to WT, ns = p>0.05 relative to WT. All values are expressed as the mean MPE ± SEM. (F) Conditioned place preference or aversion (CPP/CPA): Place conditioning evaluation of MP1207, 1208, morphine, U50,488h, saline and vehicle in C57BL/6J mice after icv administration. Following determination of initial preconditioning preferences (pre-CPP), mice were place‐conditioned daily for 2 days with MP1207 (30 nmol, n = 23 and 100 nmol, n = 24), MP1208 (100 nmol, n = 26), U50,488 (100 nmol, n = 19) or morphine (30 nmol, n = 12) and examined the fourth day for final conditioned place preference (post-CPP). Mean differences in time spent on the drug‐paired side ± SEM are presented. *p=0.03 (morphine) or **p=0.003 (U50,488h), significantly different from matching pre-conditioning preference; unpaired t-test with Welsch’s correction. Both MP1207/08 were neither reinforcing nor aversive in mice.
MP1207 and MP1208 were characterized in detail, studying opioid receptor selectivity and opioid mediated potential adverse effects. We used transgenic knock out (KO) mice lacking MOR, KOR, or DOR to examine the selectivity of MP1207/08’s analgesic actions (Figure 5D–E). MP1207/08 antinociception was found to be significantly attenuated in both MOR KO and KOR KO mice, but remained intact in DOR KO mice. The results were in line with the >40 fold selectivity of MOR and KOR over DOR in our binding assays. Both MP1207 and MP1208 failed to show either rewarding or aversive behavior in mice in a conditioned place preference paradigm at the highest dose that could be tested given their solubility (100 nmol, icv,~15 x analgesic ED50 dose) (Figure 5F). In contrast, morphine (tested at ~5 x the analgesic ED50 dose) and U50,488h (~15 x analgesic ED50 dose) as expected showed place preference and place aversion, respectively (Figure 5F).
MP1207 and MP1208 were further tested for respiratory effects (Figure 6A for MP1207 and 6B for MP1208). As expected, administration of morphine icv or IP decreased respiratory rate while the KOR agonist U50,488h (icv) was without effect (Figure 6C). In contrast, MP1207 at 30 nmol icv and MP1208 at 35 nmol icv (doses selected to be 5x the ED50 dose) each stimulated respiration. At a higher dose of 100 nmol icv, MP1207 still stimulated respiration, although the effect was less than at the lower dose of 30 nmol (Figure 6A). Finally, we examined locomotor activity in the same mice. In WT mice, MP1207 (Figure 6D) and MP1208 (Figure 6E) stimulated locomotor activity at the lower dose of 30 nmol (icv) compared to 100 nmol (icv). As expected, morphine induced hyperlocomotion (Figure 6F), and this hyperlocomotor effect was significantly greater than seen with either MP1207 or MP1208 at equianalgesic doses (Appendix 1—figure 11). ‘Together, these results support that dual MOR and KOR agonism may offset the liabilities characteristic of receptor-selective agonists’.
Figure 6
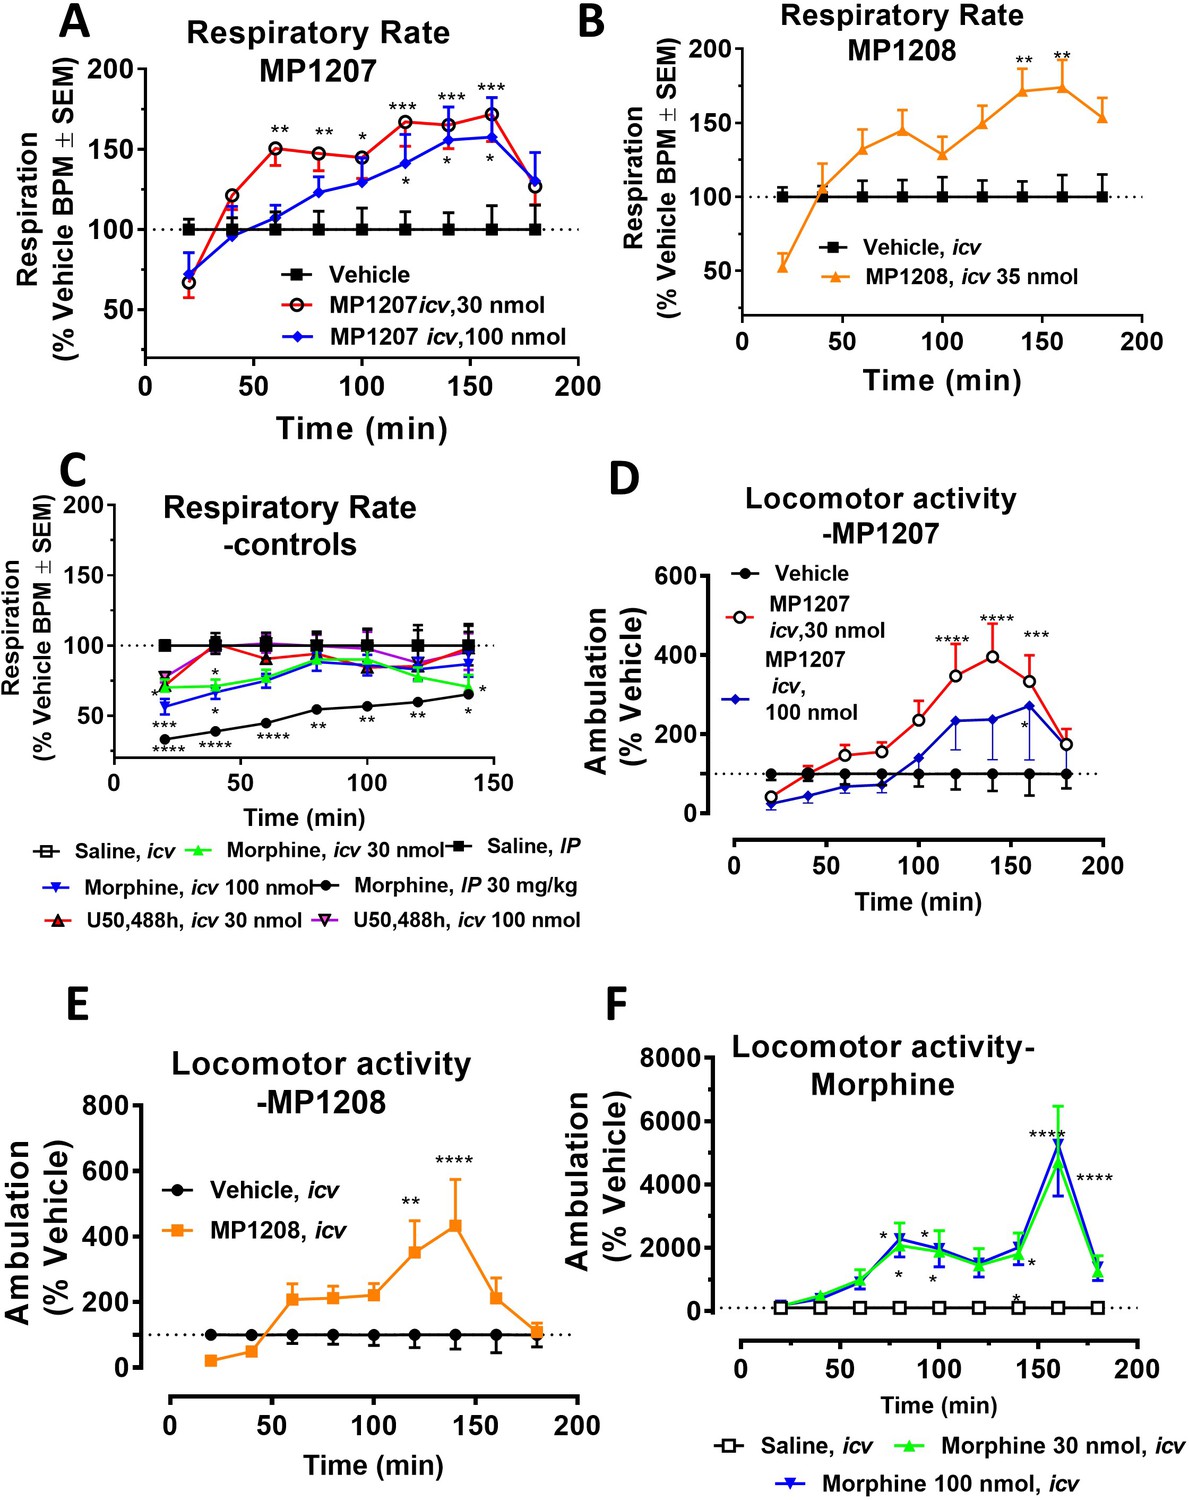
MP1207/08 show attenuated respiratory depression and locomotor effects compared to morphine in mice.
Mice were administered either saline (n = 15), vehicle (n = 24), morphine (30 mg/kg, IP; n = 12 or 30 nmol; n = 18 or 100 nmol, icv; n = 16), MP1207 (30 nmol; n = 26 or 100 nmol icv, n = 10), MP1208 (100 nmol icv, n = 10) and the breaths (A–C) or ambulations (D–F) measured every minute and averaged in 20 min segments. Data presented as % vehicle response ±.SEM; A–C, breaths per minute (BPM) or (D–F): ambulation (XAMB). (A) MP1207 (30 nmol icv) increased breathing rates at 60 min (**p=0.005), 80 min (**p=0.008), 100 min (*p=0.01), 120 min (***p=0.0001), 140 min (***p=0.0002), and 160 min (***p=0.0002) compared to vehicle. MP1207 (100 nmol icv) showed increased respiration at 120–160 min (*p=0.02) as determined by two-way ANOVA followed by Dunnett’s multiple-comparison test. (B) MP1208 (35 nmol icv) increased respiratory rate similar to MP1207 and significantly different from vehicle at 140 min (**p=0.0018) and 160 min (**p=0.0028) as determined by two-way ANOVA followed by Sidak’s multiple comparison test. (C) Morphine (30 mg/kg, IP) depressed respiration compared to saline, IP at 20–60 min (****p<0.0001), 80 min (**p=0.0011), 100 min (**p=0.0021), and 120 min (*p=0.02). Respiration after U50,488h (30 or 100 nmol icv) did not significantly differ from that of saline, icv. Morphine (30 nmol, icv) showed respiratory depression at 20 min (*p=0.03), 40 min (*p=0.04) while morphine (100 nmol, icv) showed respiratory depression at 20 min (***p=0.0009) and 40 min (*p=0.02) compared to saline, icv. (D–F) Locomotor effect: (D) MP1207 (30 nmol, icv) significantly increased forward ambulations at 120–140 min (****p<0.0001) and 160 min (***p=0.01) and at 160 min (*p=0.01), whereas the 100 nmol, icv dose did not as determined by two-way ANOVA followed by Dunnett’s multiple-comparison test in comparsion to vehicle. (E) MP1208 (35 nmol icv) increased ambulatory activity similar to MP1207 but less than morphine, and significantly different from vehicle at 120 min (**p=0.002) and 140 min (****p=0.0001) as determined by two-way ANOVA followed by Sidak’s multiple comparison test. (F) Morphine at 30 nmol icv showed significant hyperlocomotion (note axis scale) compared to saline at 80 min (*p=0.02), 100 min (*p=0.05), and 160 min (****p<0.0001). Similarly morphine at 100 nmol was significantly different at 80 min (*p=0.01), 100 min (*p=0.0395), 140 min (*p=0.034) and 160 min (****p<0.0001).
Overall, these results demonstrate that MP1207 and MP1208 produce potent antinociception predominantly mediated by KOR and MOR, yet shows a separation of analgesia from some classic opioid side effects such as respiratory depression, conditioned place preference, and aversion, in contrast with the canonical mu and kappa-opioid receptor selective agonists, morphine and U50,488h.
Discussion
This study employs a new structure-based concept for controlling the functional profile of opioid ligands which allows design of biased ligands at KOR and MOR. Agonists so generated show efficient analgesia in vivo, and lack the respiratory depression and aversion/reward liabilities of classical opioid analgesics. Over the last ~15 years, the discovery of G protein biased opioid ligands has been widely considered as a strategy for the development of potent but safer opioid analgesics. In spite of TRV130’s clinical approval, the results pointing to the ability of MOR-specific G protein biased ligands to alleviate opioid side effects has recently been challenged (Kliewer et al., 2019; Hill et al., 2018; Faouzi et al., 2020b). Among the most important recent findings is that the respiratory depressant effects of morphine appear to be β-arrestin 2-independent. Moreover, mice possessing mutations in the MOR C-tail that prevent phosphorylation by GRK and greatly impair recruitment of β-arrestin two retained opioid-induced respiratory depression, constipation, and withdrawal effects. These results contrast with previous data from β-arrestin 2 KO mice (Raehal et al., 2005). Consistent with past results, tolerance was attenuated, and the analgesic duration of action was prolonged in these mutant mice (Kliewer et al., 2020; Bachmutsky et al., 2020; Kliewer et al., 2019). Similarly, putative biased ligands such as PZM21, TRV130 and SR17018 (Gillis et al., 2020a) have recently been reported to have low intrinsic efficacy at G protein signaling when evaluated in assays without receptor reserve, raising the idea that partial agonism, and not arrestin bias, may be critical to the design of improved drugs.
It is clear that ligands with more precisely tuned selectivity and functional profiles are needed to more definitively interrogate the pharmacological mechanisms for insulating opioid analgesia from their notorious side effects. Using recently solved active-state structure of KOR in complex with MP1104 and computational modeling studies of close analogs MP1202 and IBNtxA, we identified two key sites in the binding pockets of both MOR and KOR: (1) a primarily hydrophobic sub-pocket between TM2-TM3 and (2) a region between TM5-ECL2 lined with acidic residues. We also showed that boat or chair conformations of ring C in the MP1104 scaffold can control the switch of the rigid amidophenyl arm between these two sites. Most importantly, the predicted interactions of the ligand amidophenyl arm in the TM2-TM3 sub-pocket correlated with either β-arrestin2 bias or unbiased signaling, while the switch to theTM5-ECL2 site correlated with G protein biased agonism in the opioid receptors. To test the applicability of this observation, we designed MP1207 and MP1208 with basic moieties that are predicted to facilitate interactions with acidic residues in TM5-ECL2. While the ligands retained high-affinity binding and G protein-mediated signaling, they showed dramatically either reduced potency and/or recruitment at arrestin pathway for both MOR and KOR, thus providing support for our rational design strategy for G protein biased agonists. MD simulations coupled with synthesis of other MP1207 analogs (MP1209/1210-polar and uncharged) that did not engage this region further corroborated the critical role of that region in the G-biased signaling of MP1207/08 at KOR. Notably, our design strategy also led to partial agonism for G protein signaling at both MOR and KOR.
Interestingly, the TM5-ECL2 key role in bias is also in line with the docking pose for a known biased kappa ligand 6’GNTI, which has its guanidine group align within the TM5-ECL2 region similar to the amidophenyl arm of our compounds. The TM5-ECL2 region has also been proposed as a region dictating bias at other GPCRs such as 5HT2B serotonin (McCorvy et al., 2018) and D2 dopamine (Chun et al., 2018) receptors, although the specific mechanisms may differ between these receptors.
Interpretation of bias analysis in vitro has its limitations, as discussed recently (Luttrell et al., 2015; Gundry et al., 2017). For most compounds, lack of measurable arrestin signal in one assay (e.g. BRET) usually was corroborated by strong G protein bias measured with another more amplified assay (e.g. Tango or in different species). For some others, the absence of measurable arrestin recruitment precluded calculation of bias factor in both the BRET and Tango assays. In human KOR Tango assays, dose-dependent curves showed a biphasic shape indicating a second wave of signaling at high concentrations of drugs (see Figure 3B, MP1208, Figure 4D, MP1209/10 and Appendix 1—figure 7C, MP1202). It is unlikely this effect was the result of non-specific interactions, as it was not observed in parallel MOR Tango assays, or with the KOR agonist U50,488H. The most plausible explanation for the observed biphasic response could be compounds at high concentrations hitting intracellular receptors, either with a basal pool of internal receptors or with receptors that have been internalized in response to agonist addition. Although further testing of this hypothesis is beyond the scope of this study, it is supported by previous studies showing that large amounts of intracellular GPCRs exist (Che et al., 2020; Stoeber et al., 2018).
It is additionally important to note that MP1207 and MP1208 are partial agonists for G protein signaling, but that the G protein assays that we have employed are more amplified than the arrestin assays, which can lead to apparent increases in G protein signaling efficacy. Morphine is a full agonist (Emax = 109%) and buprenorphine has higher efficacy (Emax = 59%) in our BRET-based amplified assays in mMOR (Appendix 1—table 7) compared to Emax = 70% and 25% for morphine and buprenorphine respectively in non-amplified assays (Gillis et al., 2020a). Thus, we cannot rule out a critical role for partial agonism in the improved in vivo profile observed for these compounds. Indeed such an interpretation would be more in line with recent publications arguing that it is partial agonism and not bias that accounts for the improved safety profiles of low efficacy MOR agonists (Gillis et al., 2020a; Kliewer et al., 2019; Kliewer et al., 2020; Gillis et al., 2020b).
When evaluated in animal models, MP1207 and MP1208 demonstrated supraspinal analgesia mediated by MOR and KOR while showing attenuated abuse potential and aversion, as well as lack of respiratory depression. Surprisingly, in contrast to the conventional respiratory depression characteristic of MOR-selective agonists, a modest stimulation was observed. The present data are consistent with evidence suggesting that mixed activation of MOR and KOR may produce potent analgesia with reduced liabilities (Brice‐Tutt et al., 2020). Notably, U50,488h sc and icv not only lack respiratory depression on their own (Matthes et al., 1998), but also reduce DAMGO-induced respiratory depression (Dosaka-Akita et al., 1993), supporting a potential role of KOR agonism in alleviating respiratory depression. Moreover, a report examining co-administration of the KOR agonist nalfurafine with the MOR agonist oxycodone noted the reduction of both self-administration as well as respiratory depression, further suggesting that mixed action MOR/KOR ligands (Townsend et al., 2017) may have a superior safety profile over either classical or biased ligands at a single subtype, similar to the action ascribed presently to MP1207 and MP1208.
Given the uncertainty over a mechanism by which KOR activity blunts MOR-mediated respiratory depression, future respiratory testing of mixed action ligands with MOR and KOR KO mice will be needed. Such testing may also better resolve whether weak MOR agonism alone or a combination MOR-KOR dual partial agonism, rather than the functional selectivity of MP1207 and MP1208 would be sufficient to account for the reduced liabilities presently observed. Similarly, while the present results show more than 40-fold selectivity of both MP1207 and MP1208 for MOR and KOR over DOR, it is plausible that pharmacology of these compounds at higher doses may also involve DOR, which is known to modulate MOR mediated behavioral measures. For instance, mixed action MOR-DOR agonists (Lei et al., 2020) are more effective analgesics in a chronic pain setting, while MOR agonists-DOR antagonists (Váradi et al., 2016) reportedly display less tolerance and physical dependence.
Extending this, buprenorphine, a MOR partial agonist with antagonism at KOR/DOR and weak agonism at NOP shows a ceiling effect in respiratory depression assays (Grinnell et al., 2016; Dahan et al., 2005) supporting the premise that favorable multifunctional pharmacology and MOR partial agonism may reduce undesired liabilities while synergistically optimizing analgesia. Admittedly, buprenorphine still displays hyperlocomotion (Marquez et al., 2007) and an inverted U-shaped dose-response in CPP assays (Marquez et al., 2007), and its pharmacology is complicated by its active metabolite norbuprenorphine, which is less active but more efficacious (Huang et al., 2001) and is known to show respiratory depression (Brown et al., 2012). These limitations point to the value of further refinement in the desired multifunctional pharmacological profile of developed compounds. Here, we find that MP1207/08 are partial agonists for G protein signaling, and the attenuated respiratory depression and place preference and place aversion could also result, at least in part, from the lower intrinsic efficacy of these ligands at both KOR and MOR (Gillis et al., 2020a).
This conjunction of KOR partial agonism with MOR partial agonism may have therapeutic benefits over the more broadly active buprenorphine, for example as shown presently with our probes by blunting MOR mediated respiratory depression.
The structure-based approach in this study allowed rational design of MOR and/or KOR G protein biased ligands with reduced β-arrestin2 recruitment. Leads MP1207 and MP1208 display effective analgesia in vivo with reduced abuse potential and aversion, as well as a lack of respiratory depression. While the relative roles of G protein bias, reduced efficacy at G protein pathways, and the mixed MOR-KOR agonism in the improved profile of these lead compounds are not yet clear and will require further investigation, the new rational design concept and insights gained from the structure-function analysis of these derivatives will help more precise tuning of the pluridimentional functional selectivity profiles of optimal analgesics devoid of opioid liabilities.
Materials and methods
Drugs and materials
Request a detailed protocolOpiates were provided by the Research Technology Branch of the National Institute on Drug Abuse (Rockville, MD). IBNtxA, MP1104, MP102 and new compounds (MP1202, MP1207-MP12108, MP1305, and MP1601) were synthesized. [125I]BNtxA was prepared as previously described (Pickett et al., 2015). Reagents Na125I and [35S]GTPγS were purchased from Perkin-Elmer (Waltham, MA). Selective opioid antagonists were purchased from Tocris Bioscience. Miscellaneous chemicals and buffers were purchased from Sigma-Aldrich.
Chemistry
Request a detailed protocolReagents purchased from Sigma-Aldrich Chemicals, Fisher Scientific, Alfa Aesar; were used without further purification. While performing synthesis, reaction mixtures were purified by silica gel flash chromatography on E. Merck 230–400 mesh silica gel 60 using a Teledyne ISCO CombiFlash Rf instrument with UV detection at 280 and 254 nm. RediSep Rf silica gel normal phase columns were used with a gradient range of 0–10% MeOH in DCM. Reported yields are isolated yields upon purification of each intermediate. Final clean (purity ≥95%, UPLC) compounds were used for the study. NMR spectra were collected using Bruker Avance III 500, or Avance III 600 with DCH CryoProbe instruments. Chemical shifts are reported in parts per million (ppm) relative to residual solvent peaks at the nearest 0.01 for proton and 0.1 for carbon (CDCl3 1H: 7.26, 13C: 77.1; and CD3OD 1H: 3.31, 13C: 49.0). Peak multiplicity is reported as the NMR spectra were processed with MestreNova software, namely s – singlet, d – doublet, t – triplet, q – quartet, m – multiplet for examples. Coupling constant (J) values are expressed in Hz. Mass spectra were obtained at the MSKCC Analytical Core Facility using The Waters Acuity SQD LC MS by electrospray (ESI) ionization. High-resolution mass spectra were obtained using a Waters Acuity Premiere XE TOF LC-MS by electrospray ionization and the accurate masses are reported for the molecular ion [M+H]+. Detail experiments and characterization of the new compounds are included in the supporting information section.
Mice
Male C57BL/6J mice (24–38 g) were purchased from Jackson Laboratories (Bar Harbor, ME). MOR KO, KOR KO, and DOR KO mice were bred in the McLaughlin laboratory at University of Florida. Progenitors of the colonies for MOR KO and KOR KO were obtained from Jackson Labs, whereas the DOR KO mice were a generous gift of Dr. Greg Scherrer. All mice used throughout the manuscript were opioid naïve. All mice were maintained on a 12 hr light/dark cycle with Purina rodent chow and water available ad libitum and housed in groups of five until testing.
Radioligand competition binding assays
Request a detailed protocol[125I]IBNtxA binding was carried out in membranes prepared from Chinese Hamster Ovary (CHO) cells stably expressing murine clones of mMOR, mDOR, and mKOR, as previously described (Váradi et al., 2015a; Pickett et al., 2015; Váradi et al., 2013). In brief, binding was performed at 25°C for 90 min. Binding in mMOR/CHO was carried out in 50 mM potassium phosphate buffer with 5 mM MgSO4 and 20 μg/mL protein while binding in mKOR/CHO and mDOR/CHO was carried out in 50 mM potassium phosphate pH = 7.0 buffer and 40 μg/mL protein. After the incubation, the reaction was filtered through glass-fiber filters (Whatman Schleicher and Schuell, Keene, NH) and washed (3 × 3 mL of ice-cold 50 mM Tris-HCl, pH 7.4) on a semiautomatic cell harvester. Nonspecific binding was determined by the addition of levallorphan (8 μM) to matching samples and was subtracted from total binding to yield specific binding. Protein concentrations were determined using the Lowry method with BSA as the standard (Lowry et al., 1951). K i values were calculated by nonlinear regression analysis in GraphPad Prism.
[35S]GTPγS functional assay
Request a detailed protocol[35S]GTPγS binding was performed on membranes prepared from transfected cells stably expressing opioid receptors in the presence and absence of the indicated compound for 60 min at 30°C in the assay buffer (50 mM Tris-HCl, pH 7.4, 3 mM MgCl2, 0.2 mM EGTA, and 10 mM NaCl) containing 0.05 nM [35S]GTPγS; 2 μg/mL each leupeptin, pepstatin, aprotinin, and bestatin; and 30 µM GDP, as previously described (Bolan et al., 2004). After the incubation, the reactions were filtered through glass fiber filters (Whatman Schleicher and Schuell, Keene, NH) and washed (3 × 3 mL of ice-cold buffer, 50 mM Tris-HCl, pH 7.4) on a semi-automatic cell harvester. Filters were transferred into vials with 3 mL of Liquiscint (National Diagnostics, Atlanta, GA), and the radioactivity in vials was determined by scintillation spectroscopy in a Tri-Carb 2900TR counter (PerkinElmer Life and Analytical Sciences). Basal binding was determined in the presence of GDP and the absence of drug. Data was normalized to 100 nM DAMGO, DPDPE, and U50,488h for mMOR, mDOR, and mKOR binding, respectively. EC50, IC50, and %Emax values were calculated by nonlinear regression analysis in GraphPad Prism.
cAMP inhibition assay
Request a detailed protocolTo measure Gαi-mediated cAMP inhibition, HEK 293T (ATCC CRL-11268) cells were co-transfected with human opioid receptor (hMOR/hKOR/hDOR) along with a luciferase-based cAMP biosensor (GloSensor; Promega) and assays were performed similar to previously described (Che et al., 2018; Fenalti et al., 2014). After 16 hr, transfected cells were plated into Poly-lysine coated 384-well white clear bottom cell culture plates in DMEM with 1% dialyzed FBS at a density of 15,000–20,000 cells per 40 μL per well and incubated at 37°C with 5% CO2 overnight. Next day, drug solutions were prepared in freshly prepared buffer [20 mM HEPES, 1 X HBSS, 0.3% bovine serum album (BSA), pH 7.4] at 3X drug concentration. Plates were decanted and received 20 μL per well of drug buffer (20 mM HEPES, 1X HBSS, pH 7.4) followed by addition of 10 μL of drug solution (three wells per condition) for 15 min in the dark at room temperature. To stimulate endogenous cAMP via β adrenergic-Gs activation, 10 μL luciferin (4 mM, final concentration) supplemented with isoproterenol (400 nM, final concentration) were added per well. Cells were incubated in the dark at room temperature for 15 min, and luminescence intensity was quantified using a Wallac TriLux Microbeta (Perkin Elmer) luminescence counter. Results (relative luminescence units) were plotted as a function of drug concentration, normalized to Emax of DAMGO and U50,488h for MOR and KOR respectively; and analyzed using ‘log(agonist) vs. response’ in GraphPad Prism.
Tango β-arrestin recruitment assay
Request a detailed protocolThe Tango assays were performed as previously described (Che et al., 2018). HTLA cells expressing TEV fused-β-Arrestin2 were transfected with human opioid receptors (hMOR/hKOR/hDOR) Tango construct. The next day, cells were plated in DMEM supplemented with dialyzed FBS (1%) in poly-L-lysine coated 384-well white clear bottom cell culture plates at a density of 10,000–15,000 cells/well in a total of 40 µL. The cells were incubated for at least 6 hr before receiving drug stimulation. Drug solutions were prepared in drug buffer (20 mM HEPES, 1×HBSS, 0.3% BSA, pH 7.4) at 3X and added to cells (20 µL per well) for overnight incubation. The same drug solutions were used for the Tango and cAMP assays. The next day, media and drug solutions were removed and 20 µL per well of BrightGlo reagent (Promega, with 1:20 dilution) was added. The plate was incubated for 20 min at room temperature in the dark before counting using a luminescence counter. Results (relative luminescence units) were plotted as a function of drug concentration, normalized to Emax of DAMGO and U50,488h for hMOR and hKOR respectively, and analyzed using ‘log(agonist) vs. response’ in GraphPad Prism.
Bioluminescence resonance energy transfer (BRET) assay
Request a detailed protocolThe BRET assays were performed by following the protocol published previously (Kruegel et al., 2016). In brief, the following cDNA amounts were transfected into HEK-293T cells (5 × 10⁶ cells/plate) in 10 cm dishes using polyethylenimine (PEI) in a 1:1 ratio (diluted in Opti-MEM, Life Technologies): for G-protein activation; 2.5 μg mMOR/mKOR/mDOR, 0.125 μg GαoBRLuc8, 6.25 μg β1, 6.25 μg mVenus-γ2; for arrestin recruitment; 2 μg mMOR/mKOR/mDOR, 0.25 μg Rluc8- arrestin3-Sp1, 5 μg mem-linker-citrine-SH3, 5 μg GRK2. Cells were maintained in HEKS44 293T media described above. The media was changed after 24 hr of the transfection and cells were dissociated and re-suspended in phosphate buffered saline (PBS) at 48 hr of transfection. Approximately 200,000 cells/well were added to a black-framed, white well 96-well plate (Perkin Elmer; Waltham, MA). The microplate was centrifuged, and the cells were resuspended in PBS. For agonist experiments, after 5 min, 5 μM of the luciferase substrate coelenterazine H was added to each well. After 5 min, ligands were added, and the BRET signal was measured 5 min later using PHERAstar FS plate reader. For antagonist competition experiments, cells were pre-incubated with the antagonist at varying concentration for 30 min. Coelenterazine H (5 μM) was then added to each well for 5 min. Following coelenterazine H incubation, a fixed concentration of the reference agonist (5x EC50) was added, and the BRET signal was measured at 30 min using PHERAstar FS plate reader. The signal was quantified by calculating the ratio of the light emitted by the energy acceptor, mVenus (510–540 nm), or citrine (510–540 nm), over the light emitted by the energy donor, RLuc8 (485 nm). This drug-induced BRET signal was normalized to Emax of DAMGO or U50,488h at MOR and KOR respectively. Dose response curves were fit using a three-parameter logistic equation in GraphPad Prism.
Bias determination
Request a detailed protocolBias analyses was carried out using the method proposed by Kenakin et al., 2012. that is based on the Black and Leff operational method (Black and Leff, 1983). For this we followed the step-wise protocol described by Gomes et al recently (Gomes et al., 2020). Dose response curves obtained in G protein signaling and arrestin recruitment assays were normalized to that of the standards (DAMGO for MOR and U50,488h for KOR). Data points were fit to the three parameter logistic equation in Prism 7.0 to obtain maximal response (Emax), EC50 values for all ligands for both assays. Transduction coefficients (log (T/KA)) were calculated using the Black and Leff operational model. Log(T/KA) [also referred as Log (RA)] ratios for each ligand in different pathways were determined. Subtract Log(T/KA) ratio of the standard from those of the other ligands to obtain normalized coefficients ΔLog(T/KA). ΔΔLog(T/KA) was determined by subtracting ΔLog(T/KA) ratios from different pathways. The actual value of bias was calculated using anti-Log ΔΔLog(T/KA) values.
Assessment of off-target activity of MP1207 using PRESTO-Tango GPCR-ome
Request a detailed protocolTo identify potential off-target activity of MP1207, we used the National Institutes of Mental Health Psychoactive Drug Screen Program. MP1207 was first tested for activity against 330 non-olfactory GPCRs using the PRESTO-Tango GPCRome screening β-arrestin recruitment assay at 3 μM MP1207. The activity at each receptor was measured in quadruplicate.
Screening of compounds was accomplished using previously described methods with several modifications (Kroeze et al., 2015). First, HTLA cells were plated in DMEM with 2% dialyzed FBS and 10 U/mL penicillin-streptomycin. Next, the cells were transfected using an in-plate PEI method (Longo et al., 2013). PRESTO-Tango receptor DNAs were resuspended in OptiMEM and hybridized with PEI prior to dilution and distribution into 384-well plates and subsequent addition to cells. After overnight incubation, drugs diluted in DMEM with 1% dialyzed FBS were added to cells without replacement of the medium. The remaining steps of the PRESTO-Tango protocol were followed as previously described.
Tail-withdrawal assay
Request a detailed protocolThe 55°C warm-water tail-withdrawal assay was conducted in mice as a measure of acute thermal antinociception as described previously (Reilley et al., 2010). Briefly, each mouse was tested for baseline tail-withdrawal latency prior to drug administration. Following drug administration, the latency for each mouse to withdraw the tail was measured every 10 min until latency returned to the baseline value. A maximum response time of 15 s was utilized to prevent tissue damage. If the mouse failed to display a tail-withdrawal response within 15 s, the tail was removed from the water and the animal was assigned a maximal antinociceptive score of 100%. Data are reported as percent antinociception, calculated by the equation: % antinociception = 100 x [(test latency - baseline latency)/ (15 - baseline latency)]. This was utilized to account for innate variability between mice. Compounds were administered either, interperitoneally (IP) or intracerebroventricularly (icv) and the analgesic action of compounds was assessed at as described previously (Haley and McCORMICK, 1957). To briefly describe icv administration: mice were anesthetized using isoflurane. A small (3 mm) incision was made in the scalp, and the drug (2 µl/mouse) was injected (using a 10 μL Hamilton syringe fitted to a 27-gauge needle) into the right lateral ventricle at the following coordinates: 2 mm caudal to bregma, 2 mm lateral to sagittal suture, and 2 mm in depth.
Respiratory and locomotor effects
Request a detailed protocolRespiration rates and spontaneous ambulation rates were monitored using the automated, computer-controlled Comprehensive Lab Animal Monitoring System (CLAMS, Columbus Instruments, Columbus, OH) as described previously (Reilley et al., 2010; Cirino et al., 2019). Awake, freely moving adult male mice (C57BL6/J wild-type, MOR KO, and KOR KO) were habituated in closed, sealed individual apparatus cages (23.5 cm x 11/5 cm x 13 cm) for 60 min before testing. A baseline for each animal was obtained over the 60-min period before drug injection, and testing began immediately post-injection. Vehicle, morphine (30 mg/kg, IP or 30 or 100 nmol, icv), or MP1207 (30 or 100 nmol, icv) or MP1208 (35 nmol, icv) were administered (icv or IP) and five min later mice were confined to the CLAMS testing cages for 200 min. Using a pressure transducer built into the sealed CLAMS cage, the respiration rate (breaths/min) of each occupant mouse was measured. Infrared beams located in the floor measured locomotion as ambulations, from the number of sequential breaks of adjacent beams. Data are expressed as percent of vehicle control response.
Conditioned place preference and aversion
Request a detailed protocolMice were conditioned with a counterbalanced place conditioning paradigm using similar timing as detailed previously (Váradi et al., 2016). Groups of C57BL/6J mice (n = 18–24) freely explored a three-compartment apparatus for 30 min. The amount of time subjects spent in each compartment was measured over the 30 min testing period. Prior to place conditioning, the animals did not demonstrate significant differences in their time spent exploring the left vs right compartments. During each of the next 2 days, mice were administered vehicle (0.9% saline) and consistently confined in a randomly assigned outer compartment for 40 min, half of each group in the right chamber, half in the left chamber. Four hours later, mice were administered drugs morphine (30 nmol, icv), U50,488h (100 nmol, icv), MP1207 (30 and 100 nmol, icv), MP1208 (100 nmol, icv) or vehicle and were placed to the opposite compartment for 40 min. Conditioned place preference or aversion data are presented as the difference in time spent in drug- and vehicle associated chambers.
Molecular modeling
Request a detailed protocolThe receptor proteins were extracted from the RCSB server for mouse MOR (PDBID: 5c1m), and human KOR (PDBID: 6b73), representing agonist-bound active state of the receptors. All the objects except the receptor protein subunit, the crystallized ligand, and three crystallographic waters important for ligand interactions were deleted from the MOR structure, and the protein was prepared by addition and optimization of hydrogens and optimization of the side chain residues. A similar procedure was also followed for the KOR structure, with an additional step of transplanting and optimizing the three crystallographic water molecules from the active state MOR into active state KOR. Ligands were sketched, assigned formal charges and energy-optimized prior to docking. The ligand docking box for potential grid docking was defined as the whole extracellular half of the protein, and all-atom docking was performed using the energy minimized structures for all ligands with a thoroughness value of 30. The best-scored docking poses, for both chair and boat forms, were further optimized by several rounds of minimization and Monte Carlo sampling of the ligand conformation, including the surrounding side-chain residues (within 5 A° of the ligand) and the three crystallographic water moleculess in the orthosteric sites. All the above molecular modeling operations were performed in ICM-Pro v3.8–5 molecular modeling package. The DFT (B3LYP) QM calculations for boat and chair conformations of ligands were performed using Gaussian03 with two basis sets (LanL2DZ and DGDZVP) using the servers at the High-Performance Computing at the University of Southern California.
The molecular dynamics simulation setup for the MP1207-bound KOR (residues 51-340) model was built using CHARMM-GUI web server (Lee et al., 2016). The CHARMM General Force Field (Kim et al., 2017) was used to generate CHARMM topology and parameter files for MP1207. The ligand-bound receptor system was embedded in a lipid bilayer with a POPC/cholesterol ≈ 9:1 ratio and with an area of 80 Å × 80 Å. The system was solvated with explicit TIP3P water molecules, ionized with 0.15 M Na+ cations, and neutralized with Cl- ions. The resulting simulation system had a total of 79,258 atoms and occupied an initial volume of 80 Å × 80 Å × 119 Å. The CHARMM36 force field (Best et al., 2012) was employed to perform all-atom MD simulations using the GROMACS software package version 2018.1 (Abraham et al., 2015). Following the initial energy minimization of the water boxed, lipid embedded and ionized MP1207-bound KOR system, six short equilibration runs were carried out while gradually decreasing harmonic constraints on lipid and protein heavy atoms for a cumulative run of 15 ns. The particle mesh Ewald algorithm was utilized to calculate long-range electrostatic interactions, and van der Waals interactions were switched off gradually between 10 Å to 12 Å. Periodic boundary conditions were applied to simulation boxes, and simulations were run with integration time step of 2 fs at 310 K. The resulting trajectories from two independent 1000ns long production runs were analyzed using in-built GROMACS analysis tools. All MD simulations and analyses were performed using the servers at the High-Performance Computing at University of Southern California.
Chemistry - synthesis
MP1202, MP1207, MP1208, MP1209, and MP1210
Request a detailed protocolSynthesis of m-iodoarylamidomorphinans (MP1202) was achieved, by starting with known codeine phthalimide (Váradi et al., 2015a) one in six sequential steps (Appendix 1—scheme 1A). The codeine phthalimides one was prepared from morphine in two steps according to the literature procedures. The reduction of codeine phthalimides in the presence of Pd/C and hydrogen followed by phthalimide group removal using excess of hydrazine hydrate gave the β-dihydrocodeine amine 2 (Crooks et al., 2006; Simon et al., 1994; Simon et al., 1992). The β-dihydrocodeine amine two was treated to m-iodobenzoic acid in the presence coupling reagent HATU with an organic base DIPEA to furnish corresponding m-iodoarylamidomorphinan 3. The m-iodoarylamidomorphinan three was treated with DIAD at 65°C in acetonitrile for 20 hr followed by two equivalents of pyridine hydrochloride (Py.HCl) treatment at room temperature to obtain the m-iodoarylamidonormorphinan 4 (Yuan et al., 2013). N-alkylation of 4 was achieved by heating it with (bromomethyl)cyclopropane in the presence of K2CO3 in DMF to furnish 5. Finally, O-demethylation in five was performed using standard BBr3 demethylation protocol to obtain MP1202 (Váradi et al., 2015a). On the other hand, MP1207–MP1208 were prepared (Appendix 1—scheme 1B) using 6 (β-dihydro N-CPM morphineamine) which was prepared form morphine in seven steps using known protocols (Simon et al., 1994; Simon et al., 1992). In addition, di-Boc-guanidinomethyl benzoic acid eight was prepared by reacting amino methyl benzoic acid with N,N′-di-Boc-1H-pyrazole-1-carboxamidine at 50°C (Robinson and Roskamp, 1997). Next, m-Boc-aminomethyl benzoic acid (Zhang et al., 2014) seven and di-Boc-guanidinomethyl benzoic acid eight were coupled with 6 (β-dihydro N-CPM morphineamine) in DMF in the presence of HATU and DIPEA to obtain corresponding analogs 9–10. Finally, deprotection of Boc group at 9–10 using TFA/DCM in the presence of triethyl silane as a cation scavenger furnished the desired compounds; m-aminomethyl and m-guanidinomethyl arylamidodihydromorphinans MP1207–MP1208. Appendix 1—scheme 2 shows the synthesis of MP1209 and MP1210. Briefly, six was coupled with commercially available 3-(hydroxymethyl)benzoic acid in presence of PyBOP as the coupling agent to give MP1210. Coupling of 6 (β-dihydro N-CPM morphineamine) with p-Boc-aminomethyl benzoic acid and deprotection of Boc group gave final product, MP1209.
MP1305
Request a detailed protocolSynthesis of 14-O-methyl m-iodoarylamidomorphinan MP1305 was achieved by starting with the known ketal 12 in seven sequential steps (Appendix 1—scheme 3). At first, phenolic and ketone groups in naloxone were protected to obtain the ketal 12 prior the methylation of sterically hindered 14-O position (Nagase et al., 2006). The ketal 12 was treated with an excess of NaH at 0°C in DMF and the mixture was heated with iodomethane at 55°C. Then, the ketal protecting group was removed by treating with aqueous HCl in methanol under mild heating conditions resulting in the known 14-O-methyl ketone 13 (Kobylecki et al., 1982). Stereoselective reduction of the ketone 13 using lithium selectride in THF at low temperature furnished corresponding α alcohol 14. The stereocenter inversion at C-6 position, with the introduction of a phthalimide moiety, was achieved using DIAD and PPh3 by employing standard Mitsunobu protocol. Next, phthalimide moiety was removed by treating with excess of hydrazine hydrate in methanol to obtain β amine 15. Then, amine 15 was treated to m-iodobenzoic acid in the presence HATU and DIPEA in DMF followed by 3-O- demethylation of the intermediate using BBr3 in DCM furnished 14-O-methyl m-iodoarylamidomorphinan MP1305.
MP1601
Request a detailed protocolSynthesis of m-iodoarylamido-4,5-deoxymorphinan MP1601 was achieved from the known ketone 16 (Appendix 1—scheme 4). The ketone 16 was synthesized in five steps using naltrexone by following literature reports (Tius and Kerr, 1992; Hupp and Neumeyer, 2010; Zhang et al., 2007). Reductive amination of the ketone 16 using NH4OAc/NaCNBH3 in methanol gave a racemic mixture of C-6 α/β amines (Majumdar et al., 2011b). Separation of β amine from the α/β mixture while work up, was more problematic then anticipated to isolate in optimum yield. However, upon using a mixture of 10% TEA and 1% MeOH in DCM as a column solvent with a silica gel column chromatography, β amine 17 was isolated in modest yield. The pattern spectral information in proton NMRs of the α and β amines are in agreement with that of close 4,5-epoxymorphinan α/β amines (Jiang et al., 1977). For instance, upon an introduction of amino moiety at C-6 position, the aromatic proton at C-4 position displays a significant downfield shift in comparison to that of ketone 15 (δ = 6.80 ppm C4-HAr). The C-4 proton chemical shift (δ) values in β and α amines are 7.01 and 6.86 ppm, which is about 0.21 and 0.06 ppm downfield shift respectively, indicating that β amino group poses lower effect (Jiang et al., 1977). Next, the β amine 17 was coupled with m-iodobenzoic acid using HATU as a coupling reagent in the presence of TEA to obtain 3-methoxy m-iodoarylamido-4,5-deoxymorphinan 18. Finally, deprotection of 3-methyl group in 18 using BBr3 in DCM furnished the desired m-iodoarylamido-4,5-deoxymorphinan MP1601.
Preparation and characterization of new compounds
(7R,12bS)−9-methoxy-3-methyl-2,3,4,4a,5,6,7,7a-octahydro-1H-4,12-methanobenzo furo[3,2-e]isoquinolin-7-amine (2)
Request a detailed protocolThe known phthalimide 1 (3 g, 7.0 mmol) was dissolved in a stirred solution of DCM (15 mL) in methanol (100 mL). Palladium catalyst (10% Pd/C, 149 mg, 0.2 eq.) was added and the mixture was hydrogenated at 50 psi. After the completion of reaction monitored by mass spectrometry, the solution was filtered through celite, concentrated under reduced pressure, and the crude product was purified by silica gel column chromatography (ISCO, 40 g column) using methanol (5–15%) in DCM to get a white solid (2.7 g; Yield 90%) of the desired phthalimide dihydro intermediate whose spectral data matched with the literature reports. Then, hydrazine hydrate (21.5 mL, 34.5 mmol, 10 eq.) was added to the stirred solution of phthalimide dihydro intermediate (1.48 g, 3.4 mmol) in dry methanol (10 mL) at once at rt and the reaction was continued overnight. The reaction mixture was diluted with DCM (40 mL) and the organic layer washed with brine (2 × 20 mL), dried over anhydrous Na2SO4, filtered and concentrated under reduced pressure. The crude product was purified by silica gel column chromatography (ISCO, 12 g column) using a mixture of methanol in ethyl acetate with small amount of ammonium hydroxide as a base (87%EtOAC/10%MeOH/3%NH4OH) to get a white solid. Finally, the white solid was re-dissolved in EtOAc, filtered, and precipitated by petroleum ether to get (0.96 g; Yield 93%) of the desired product 2. The spectral data of the compound 2 was matched with the literature reports (Váradi et al., 2015a).
3’-Iodo-N-((7R,12bS)−9-methoxy-3-methyl-2,3,4,4a,5,6,7,7a-octahydro-1H-4,12-methanobenzofuro[3,2-e]isoquinolin-7-yl)benzamide (3)
Request a detailed protocolm-Lodobenzoic acid (1.0 g, 4.03 mmol, 1.3 eq.) was added to a stirred solution of β−7,8-dihydro-codeine-NH2 2 (932 mg, 3.10 mmol) in DMF (10 mL) at. HATU (1.5 g, 4.03 mmol, 1.3 eq.) was added to the mixture at rt at once and after 5 min, DIPEA (1.62 mL, 9.31 mmol, 3 eq.) was added. After 20 min, the reaction mixture was diluted with EtOAc (80 mL). The EtOAc layer was washed with brine (5 × 50 mL) to remove DMF, dried over anhydrous Na2SO4, filtered, and concentrated under reduced pressure. The crude product was purified by silica gel column chromatography using a mixture of methanol (0–5%) in DCM to get desired products 3; (977 mg; Yield 59%). 1H NMR (600 MHz, CDCl3) δ = 8.10 (t, J = 1.7 Hz, 1H), 7.85–7.77 (m, 1H), 7.72 (dt, J = 7.9, 1.3 Hz, 1H), 7.13 (t, J = 7.8 Hz, 1H), 6.73 (d, J = 8.2 Hz, 1H), 6.66 (d, J = 8.2 Hz, 1H), 4.56 (d, J = 8.0 Hz, 1H), 3.82 (s, 3H), 3.75 (dq, J = 12.6, 3.3 Hz, 1H), 3.15 (s, 1H), 3.02 (d, J = 18.3 Hz, 1H), 2.57–2.51 (m, 1H), 2.43 (s, 3H), 2.27–2.14 (m, 2H), 2.05–1.98 (m, 1H), 1.87 (s, 1H), 1.70 (ddd, J = 12.3, 3.8, 1.6 Hz, 1H), 1.62–1.49 (m, 1H), 1.38 (qd, J = 13.0, 2.5 Hz, 1H), 1.11 (m, 1H). 13C NMR (151 MHz, CDCl3) δ = 165.8, 143.9, 143.7, 140.2, 136.6, 136.0, 130.1, 126.2, 119.3, 114.1, 94.1, 92.8, 77.2, 77.0, 76.8, 59.5, 56.7, 53.1, 47.2, 43.4, 42.7, 28.7, 24.1, 20.1; HRMS calcd for C25H27IN2O3 [M+H]+, 531.1145; found, 531.1140.
3’-Iodo-N-((7R,12bS)−9-methoxy-2,3,4,4a,5,6,7,7a-octahydro-1H-4,12-methanobenzofuro[3,2-e]isoquinolin-7-yl)benzamide (4)
Request a detailed protocolThe dihydrocodeine iodoaryl amide (952 mg, 1.795 mmol) was added to a stirred solution of DIAD (636 µL. 3.21 mmol, 8 eq.) CH3CN (15 mL) at rt under an argon and the reaction mixture was heated to 65°C for 20 hr. The reaction mixture cooled to rt and pyridine HCl (415 mg, 3.59 mmol, 2 eq.) was added and the reaction was continued for 3 days. The solvent was removed under reduced pressure and the content was redissolved in DCM (30 mL). The DCM layer was washed with brine (2 × 20 mL), dried over anhydrous Na2SO4, filtered, and concentrated under reduced pressure. The crude product was purified by silica gel column chromatography using a mixture of methanol (2–15%) in DCM to get desired products 4; (607 mg; Yield, 66%). 1H NMR (600 MHz, CDCl3) δ = 9.80 (s, 2H), 8.14 (t, J = 1.7 Hz, 1H), 7.80 (dt, J = 7.9, 1.3 Hz, 1H), 7.75 (dt, J = 7.8, 1.3 Hz, 1H), 7.15 (t, J = 7.8 Hz, 1H), 6.81 (d, J = 8.3 Hz, 1H), 6.75 (d, J = 8.2 Hz, 2H), 4.73 (d, J = 8.1 Hz, 1H), 4.00 (t, J = 4.1 Hz, 1H), 3.84 (s, 3H), 3.79 (ddd, J = 12.5, 8.2, 4.6 Hz, 1H), 3.32 (d, J = 19.1 Hz, 1H), 3.21 (dd, J = 13.5, 4.2 Hz, 1H), 3.06 (dd, J = 19.2, 5.9 Hz, 1H), 2.83 (s, 1H), 2.62 (dt, J = 12.4, 3.7 Hz, 1H), 2.18 (td, J = 13.3, 4.6 Hz, 1H), 1.91–1.80 (m, 1H), 1.67 (dd, J = 13.5, 4.1 Hz, 1H), 1.53–1.44 (m, 1H), 1.13–1.03 (m, 1H). 13C NMR (151 MHz, CDCl3) δ = 165.7, 149.8, 144.4, 144.0, 140.4, 136.2, 136.0, 136.0, 130.2, 127.5, 126.4, 123.7, 123.0, 120.4, 115.5, 94.2, 91.8, 56.9, 53.4, 52.6, 52.4, 42.7, 38.7, 37.9, 32.2, 28.0, 25.7, 23.3; ESI-MS m/z: 517.12 [M+H]+.
N-((7R,12bS)−3-(Cyclopropylmethyl)−9-methoxy-2,3,4,4a,5,6,7,7a-octahydro-1H-4,12-methanobenzofuro[3,2-e]isoquinolin-7-yl)−3-iodobenzamide (5)
Request a detailed protocolNa2CO3 (92.4 mg, 0.87 mmol, 1.5 eq.) and (bromomethyl)cyclopropane (67.6 µL, 0.69 mmol, 1.2 eq.) were added to a stirred solution of dihydronorcodeine 4 (300 mg, 0.581 mmol) in DMF (1 mL) at rt under argon. The, the reaction mixture was heated to 90°C overnight. Then the reaction mixture was cooled to rt and was diluted with EtOAc (20 mL). The EtOAc layer was washed with brine (5 × 20 mL) to remove DMF, dried over anhydrous Na2SO4, filtered, and concentrated under reduced pressure. The crude product was purified by silica gel column chromatography using a mixture of methanol (3–10%) in DCM to get desired products 5; (205 mg; Yield, 62%). 1H NMR (600 MHz, CDCl3) δ = 8.09 (t, J = 1.8 Hz, 1H), 7.79 (dt, J = 7.9, 1.3 Hz, 1H), 7.72 (dt, J = 7.8, 1.3 Hz, 1H), 7.13 (t, J = 7.8 Hz, 1H), 6.72 (d, J = 8.2 Hz, 1H), 6.64 (d, J = 8.2 Hz, 1H), 6.40 (s, 1H), 4.55 (d, J = 8.0 Hz, 1H), 3.82 (s, 3H), 3.75 (ddd, J = 12.4, 8.2, 4.8 Hz, 1H), 3.41 (s, 1H), 2.91 (d, J = 18.3 Hz, 1H), 2.82–2.76 (m, 1H), 2.39 (dd, J = 87.8, 49.2 Hz, 4H), 1.92 (d, J = 16.2 Hz, 1H), 1.70 (ddd, J = 12.3, 3.7, 1.7 Hz, 1H), 1.39 (td, J = 12.9, 2.5 Hz, 1H), 1.12 (qd, J = 12.9, 2.5 Hz, 1H), 0.87 (s, 1H), 0.53 (d, J = 8.0 Hz, 2H), 0.15 (s, 2H). 13C NMR (151 MHz, CDCl3) δ = 171.2, 165.8, 143.8, 140.2, 136.6, 136.0, 130.1, 126.2, 119.2, 94.1, 92.9, 60.4, 59.8, 57.1, 56.6, 53.2, 45.7, 44.0, 28.7, 24.2, 21.1, 20.6, 14.2, 4.0, 3.8; HRMS calcd for C28H31IN2O3 [M+H]+, 571.1458; found, 571.1474.
N-((7R,12bS)−3-(Cyclopropylmethyl)−9-hydroxy-2,3,4,4a,5,6,7,7a-octahydro-1H-4,12-methanobenzofuro[3,2-e]isoquinolin-7-yl)−3-iodobenzamide (MP1202)
Request a detailed protocolA solution of BBr3 (7 mL, 7 eq.; 1M in DCM,) was slowly added to a stirred solution of methoxy morphinan 4 (181 mg, 0.31 mmol) in DCM (7 mL) at 0°C under argon. The reaction mixture was stirred for 10 min at 0°C and 20 more minutes at rt. The reaction mixture was quenched with excess of ammonia solution (5%) and the mixture was stirred for one hour. Then, the mixture was diluted with DCM (20 mL). The DCM layer was washed with brine (2 × 20 mL), dried over anhydrous Na2SO4, filtered, and concentrated under reduced pressure. The crude product was purified by silica gel column chromatography using a mixture of methanol (7–15%) in DCM to get desired products MP1202; (111 mg; Yield, 63%). 1H NMR (600 MHz, CDCl3+CD3OD) δ = 8.10 (t, J = 1.7 Hz, 1H), 7.74 (m, 2H), 7.11 (t, J = 7.8 Hz, 1H), 6.62 (d, J = 8.1 Hz, 1H), 6.49 (d, J = 8.1 Hz, 1H), 4.38 (d, J = 7.5 Hz, 1H), 3.80 (ddd, J = 12.7, 7.5, 4.8 Hz, 1H), 3.55 (s, 3H), 3.43–3.23 (m, 2H), 2.82 (d, J = 18.3 Hz, 1H), 2.68 (d, J = 12.1 Hz, 1H), 2.41 (s, 1H), 2.32 (d, J = 18.6 Hz, 2H), 2.08 (d, J = 18.1 Hz, 2H), 1.81–1.76 (m, 2H), 1.61 (m, 1H), 1.56–1.50 (m, 1H), 1.35 (qd, J = 13.0, 2.6 Hz, 1H), 1.09–0.97 (m, 1H), 0.79 (s, 1H), 0.49 (d, J = 8.0 Hz, 2H), 0.10 (dd, J = 14.1, 9.2 Hz, 2H). 13C NMR (151 MHz, CDCl3+CD3OD) δ = 166.7, 142.8, 140.4, 136.2, 136.1, 130.1, 126.4, 119.4, 118.0, 93.9, 93.6, 59.5, 56.8, 52.2, 45.8, 43.7, 2.78, 24.1, 20.3, 3.93, 3.8; HRMS calcd for C27H29IN2O3 [M+H]+, 557.1301; found, 557.1304.
(Z)−3-((2,3-bis(tert-Butoxycarbonyl)guanidino)methyl)benzoic acid (8)
Request a detailed protocolN,N′-di-Boc-1H-pyrazole-1-carboxamidine (54 mg, 0.17 mmol, 1.1 eq.) and triethyl amine (67 µL, 0.44 mmol, three eq.) were added to a stirred solution of 3-(aminomethyl) benzoic acid hydrochloride (30 mg, 0.16 mmol, 1 eq.) in MeOH (1 mL) at rt under argon. The reaction was heated to 50°C and continued for 7 hr. The solvent was removed under reduced pressure, and the content was diluted with EtOAc (15 mL). Water (15 mL) was added and the mixture was acidified with citric acid (to pH ~3). The organic layer was separated and was washed with brine (15 mL), dried over anhydrous Na2SO4, filtered, and concentrated under reduced pressure. The crude product was purified by silica gel column chromatography using a mixture of EtOAc (20–50%) in hexanes to get the desired products two as a white solid (46 mg; Yield, 78%); 1H NMR (600 MHz, Chloroform-d) δ = 11.56 (s, 1H), 8.67 (t, J = 5.4 Hz, 1H), 8.11–7.90 (m, 2H), 7.57 (dt, J = 7.8, 1.4 Hz, 1H), 7.46 (t, J = 7.7 Hz, 1H), 4.71 (d, J = 5.3 Hz, 2H), 1.50 (d, J = 17.8 Hz, 18H). 13C NMR (151 MHz, CDCl3) δ = 170.9, 163.5, 156.3, 153.2, 138.0, 133.1, 129.7, 129.6, 129.5, 129.0, 83.4, 79.6, 44.5, 28.3, 28.1.
tert-Butyl (3-(((7R,12bS)−3-(Cyclopropylmethyl)−9-hydroxy-2,3,4,4a,5,6,7,7a-octahydro-1H-4,12-methanobenzofuro[3,2-e]isoquinolin-7-yl)carbamoyl)benzyl)carbamate (9)
Request a detailed protocolThe Boc aminomethylbenzoic acid 7 (28 mg, 0.11 mmol, 1.3 eq.) was added to a stirred solution of β-dihydro N-CPM morphineamine 6 (28 mg, 0.08 mmol, 1 eq.) in DMF (0.4 mL) at rt under argon. HATU (39 mg, 0.10 mmol, 1.2 eq.) was added to the mixture at rt at once and after 5 min, DIPEA (45 µL, 0.25 mmol, 3 eq.) was added. After 2 hr, the reaction mixture was diluted with EtOAc (15 mL). The EtOAc layer was washed with brine (5 × 15 mL) to remove DMF, dried over anhydrous Na2SO4, filtered, and concentrated under reduced pressure. The residue was redissolved in MeOH (0.5 mL) and sodium methoxide in MeOH (0.2 mL, 0.5 M) was added to the mixture. After 15 min, the solvent was removed, redissolved in EtOAc (15 mL), washed with brine, dried over anhydrous Na2SO4, filtered, and the crude product was purified by silica gel column chromatography using a mixture of methanol (3–10%) in DCM to get nine as a white solid, (31 mg, Yield; 66%); 1H NMR (600 MHz, Chloroform-d) δ = 7.80 (s, 1H), 7.45 (d, J = 44.7 Hz, 2H), 7.34 (d, J = 7.6 Hz, 1H), 7.19 (t, J = 7.7 Hz, 1H), 6.72 (d, J = 8.0 Hz, 1H), 6.59 (d, J = 8.1 Hz, 1H), 5.33 (s, 1H), 4.69 (s, 1H), 4.25 (dd, J = 15.2, 5.9 Hz, 1H), 4.16 (dd, J = 15.2, 6.1 Hz, 1H), 3.81 (s, 1H), 3.07 (s, 1H), 2.91 (d, J = 18.3 Hz, 1H), 2.69 (s, 4H), 2.47–2.11 (m, 1H), 1.84 (d, J = 12.6 Hz, 1H), 1.71 (s, 1H), 1.56 (d, J = 32.4 Hz, 1H), 1.43 (s, 9H), 1.25 (s, 1H), 1.06 (q, J = 12.7 Hz, 1H), 0.94–0.77 (m, 1H), 0.65 (s, 2H), 0.29 (br, 2H). 13C NMR (151 MHz, CDCl3) δ = 167.3, 156.2, 143.0, 139.3, 134.3, 130.1, 128.6, 126.7, 125.7, 119.5, 92.4, 79.9, 59.1, 57.5, 52.0, 44.4, 43.1, 31.9, 29.7, 29.6, 29.3, 28.4, 24.0, 22.7, 21.0, 14.1, 4.4. ESI-MS m/z: 560.54 [M+H]+.
2,3-Bis(tert-Butoxycarbonyl)(-N-(7R,12bS)−3-(cyclopropylmethyl)−9-hydroxy-2,3,4,4a,5,6,7,7a-octahydro-1H-4,12-methanobenzofuro[3,2-e]isoquinolin-7-yl)−3-(guanidinomethyl)benzamide (5)
Request a detailed protocolThe di-Boc-guanoomethylbenzoic acid 8 (32.9 mg, 0.08 mmol, 1.3 eq.) was added to a stirred solution of β-dihydro N-CPM morphineamine 6 (21 mg, 0.06 mmol, 1 eq.) in DMF (0.4 mL) at rt under argon. HATU (29 mg, 0.07 mmol, 1.2 eq.) was added to the mixture at rt at once and after 5 min, DIPEA (33 µL, 0.19 mmol, 3 eq.) was added. After 2 hr, the reaction mixture was diluted with EtOAc (15 mL). The EtOAc layer was washed with brine (5 × 15 mL) to remove DMF, dried over anhydrous Na2SO4, filtered, and concentrated under reduced pressure. The residue was redissolved in MeOH (0.5 mL) and sodium methoxide in MeOH (0.2 mL, 0.5 M) was added to the mixture. After 15 min, the solvent was removed, redissolved in EtOAc (15 mL), washed with brine, dried over anhydrous Na2SO4, filtered, and the crude product was purified by silica gel column chromatography using a mixture of methanol (3–10%) in DCM to get 10 as a white solid (32 mg, Yield; 71%); 1H NMR (600 MHz, Chloroform-d) δ = 11.52 (s, 1H), 8.82 (d, J = 6.9 Hz, 1H), 7.78 (s, 1H), 7.43 (d, J = 7.5 Hz, 1H), 7.29 (d, J = 7.6 Hz, 1H), 7.19 (t, J = 7.7 Hz, 1H), 7.07 (d, J = 14.4 Hz, 1H), 6.82 (d, J = 8.1 Hz, 1H), 6.63 (d, J = 8.2 Hz, 1H), 4.87 (s, 1H), 4.57 (dd, J = 15.4, 6.7 Hz, 1H), 4.44–4.34 (m, 1H), 3.85 (s, 2H), 3.24 (s, 1H), 2.97 (d, J = 18.1 Hz, 1H), 2.74 (s, 3H), 2.48 (s, 1H), 2.37–2.16 (m, 1H), 2.03–1.91 (m, 1H), 1.83 (s, 1H), 1.62 (dd, J = 30.8, 8.7 Hz, 1H), 1.49 (d, J = 6.2 Hz, 18H), 1.37 (dd, J = 13.6, 8.9 Hz, 1H), 1.32–1.21 (m, 1H), 1.13 (q, J = 12.7 Hz, 1H), 0.93–0.78 (m, 1H), 0.68 (s, 2H), 0.37 (d, J = 54.7 Hz, 2H). 13C NMR (151 MHz, CDCl3) δ = 167.0, 163.1, 156.3, 153.2, 143.1, 141.4, 137.9, 133.7, 129.8, 128.6, 126.5, 126.2, 120.0, 118.4, 92.4, 83.5, 80.0, 59.2, 57.9, 52.2, 46.7, 44.0, 43.0, 32.0, 29.7, 29.7, 29.6, 29.5, 29.4, 28.5, 28.3, 28.2, 28.1, 28.0, 23.8, 22.7, 21.1, 14.2, 14.2, 4.5. ESI-MS m/z: 702.55 [M+H]+.
3-(Aminomethyl)-N-((7R,12bS)−3-(cyclopropylmethyl)−9-hydroxy-2,3,4,4a,5,6,7,7a-octahydro-1H-4,12-methanobenzofuro[3,2-e]isoquinolin-7-yl)benzamide (MP1207)
Request a detailed protocolTriethylsilane (21 µL, 0.19 mmol, 2.5 eq.) was added to the solution of 9 (30 mg, 0.05 mmol one eq.) in TFA/DCM (1:1, 1 mL) at rt. The reaction was continued for 30 min. Mass spectrometry indicated the reaction was completed. The volatile components were removed under reduced pressure. The content was redissolved in DCM (0.4 mL) and treated with Et2O (3 mL) while shaking resulting in a white precipitation. The precipitate was washed with Et2O (3 mL) and dried under high vacuum to get the desired amino product MP1207 as a white solid (33 mg, Yield 94%); 1H NMR (600 MHz, Deuterium Oxide) δ = 7.79 (dd, J = 7.0, 1.4 Hz, 2H), 7.64 (dt, J = 7.9, 1.4 Hz, 1H), 7.61–7.53 (m, 1H), 6.95–6.85 (m, 1H), 6.85–6.75 (m, 1H), 4.74 (dd, J = 11.0, 8.1 Hz, 1H), 4.23 (s, 3H), 3.77 (ddt, J = 12.2, 8.3, 4.1 Hz, 1H), 3.42 (td, J = 11.6, 9.7, 5.4 Hz, 1H), 3.36–3.26 (m, 1H), 3.20 (d, J = 19.7 Hz, 1H), 3.10–2.95 (m, 2H), 2.76 (td, J = 13.2, 4.0 Hz, 1H), 2.48 (ddd, J = 12.5, 4.6, 2.8 Hz, 1H), 2.14 (td, J = 13.5, 4.7 Hz, 1H), 1.92 (ddd, J = 13.8, 4.2, 1.7 Hz, 1H), 1.87–1.72 (m, 2H), 1.54 (qd, J = 13.1, 2.5 Hz, 1H), 1.19–0.99 (m, 2H), 0.83–0.61 (m, 2H), 0.46–0.28 (m, 2H). 13C NMR (151 MHz, D2O, without TFA peaks) δ = 170.0, 142.1, 139.8, 134.5, 133.1, 132.2, 129.5, 128.0, 127.6, 122.9, 120.5, 92.1, 58.8, 58.6, 51.6, 46.5, 42.6, 42.4, 42.1, 39.7, 32.4, 27.4, 23.1, 20.4, 5.2, 3.6, 3.4, HRMS calcd for C28H34N3O3 [M+H]+, 460.2600; found, 460.2585.
N-((7R,12bS)−3-(Cyclopropylmethyl)−9-hydroxy-2,3,4,4a,5,6,7,7a-octahydro-1H-4,12-methanobenzofuro[3,2-e]isoquinolin-7-yl)−3-(guanidinomethyl)benzamide (MP1208)
Request a detailed protocolTriethylsilane (35.6 µL, 0.22 mmol, 5 eq.) was added to the solution of 10 (31 mg, 0.04 mmol, 1 eq.) in TFA/DCM (1:1, 1 mL) at rt. The reaction was continued for 30 min. Mass spectrometry indicated the reaction was completed. The volatile components were removed under reduced pressure. The content was redissolved in DCM (0.4 mL) and treated with Et2O (3 mL) while shaking resulting in a white precipitation. The precipitate was washed with Et2O (3 mL) and dried under high vacuum to get the desired amino product MP1208 as a white solid (28 mg, Yield 87%);1H NMR (600 MHz, Deuterium Oxide) δ = 7.64–7.51 (m, 2H), 7.48–7.28 (m, 2H), 6.86–6.49 (m, 2H), 4.68–4.57 (m, 1H), 4.37 (d, J = 5.7 Hz, 2H), 4.12 (dd, J = 5.7, 2.8 Hz, 1H), 3.66 (ddd, J = 12.7, 8.2, 4.3 Hz, 1H), 3.31 (td, J = 16.6, 15.0, 5.9 Hz, 1H), 3.22–3.15 (m, 1H), 3.10 (dd, J = 19.8, 3.2 Hz, 1H), 3.00–2.85 (m, 2H), 2.65 (td, J = 13.2, 4.2 Hz, 1H), 2.38 (ddd, J = 12.3, 4.4, 2.7 Hz, 1H), 2.04 (td, J = 13.5, 4.6 Hz, 1H), 2.00–1.92 (m, 0H), 1.87–1.76 (m, 1H), 1.76–1.62 (m, 1H), 1.43 (tdd, J = 13.9, 10.4, 5.3 Hz, 1H), 0.98 (tdd, J = 13.7, 8.9, 4.8 Hz, 2H), 0.71–0.58 (m, 2H), 0.34–0.19 (m, 2H). 13C NMR (151 MHz, D2O, without TFA peaks) δ = 170.3, 156.8, 142.2, 139.7, 136.7, 134.2, 130.3, 129.2, 128.0, 126.3, 125.5, 122.9, 120.5, 118.1, 92.1, 58.8, 58.6, 51.6, 46.5, 44.1, 42.1, 39.7, 32.4, 27.4, 23.1, 20.4, 5.2, 3.6, 3.4. HRMS calcd for C29H36N5O3 [M+H]+, 502.2818; found, 502.2816.
4-(Aminomethyl)-N-((4R,4aR,7R,7aR,12bS)−3-(cyclopropylmethyl)−9-hydroxy-2,3,4,4a,5,6,7,7a-octahydro-1H-4,12-methano[1]benzofuro[3,2-e]isoquinolin-7-yl)benzamide (MP1209)
Request a detailed protocolTo a suspension of PyBOP (70 mg, 0.135 mmol, 2.2 eq.) in THF (100 mL) were sequentially added a solution of 4-(((tert-butoxy carbonyl)amino)methyl)benzoic acid (34 mg, 0.135 mmol, 2.2 eq.) in THF (100 mL) and NEt(iPr)2 (24 mL, 0.135 mmol, 2.2 eq.) and the resulting mixture was stirred for 40 min at rt. This solution was subsequently added via cannula to a suspension of solution of β-dihydro N-CPM morphineamine 6 (20 mg, 0.061 mmol, 1.0 eq.) in THF (100 mL) and the mixture was stirred at rt overnight. To the crude mixture methanol and potassium carbonate were added and stirring was continued for 2 hr. After filtration the solvent was removed on a rotary evaporator, and the crude product was loaded on a 4 g Silica Gold column. Chromatography was performed with 5% to 10% MeOH (containing 10% concentrated NH4OH solution) gradient in 6 min. The desired Boc protected intermediate eluted around 5–6 min. Deprotection of the Boc protected amine (11) was achieved in 3 hr using 4N HCl in dioxane. The product was obtained as a white powder after removal of the solvent and trituration with diethyl ether (25 mg, 76%). 1H NMR (400 MHz, CDCl3) δ: 7.92 (dd, J = 8.3, 2.1 Hz, 2H), 7.60–7.53 (m, 2H), 6.79–6.67 (m, 2H), 4.78 (dd, J = 8.0, 1.9 Hz, 1H), 4.18 (s, 3H), 3.88–3.71 (m, 1H), 3.64 (d, J = 1.9 Hz, 2H), 3.51–3.39 (m, 1H), 3.38–3.28 (m, 1H), 3.20 (d, J = 19.0 Hz, 1H), 3.06–2.92 (m, 2H), 2.73 (td, J = 13.0, 4.0 Hz, 1H), 2.63 (d, J = 12.2 Hz, 1H), 2.26 (td, J = 13.5, 4.7 Hz, 1H), 1.95–1.71 (m, 3H), 1.69–1.49 (m, 1H), 1.24–1.06 (m, 3H), 0.78 (dd, J = 10.7, 7.5 Hz, 2H), 0.58–0.43 (m, 2H). 13C NMR (101 MHz, CDCl3) δ: 164.45, 139.51, 138.14, 133.32, 131.56, 125.44, 124.54, 124.52, 124.29, 117.92, 116.55, 114.77, 87.95, 63.45, 55.79, 55.34, 48.72, 39.16, 39.09, 36.66, 29.62, 24.71, 20.07, 17.26, 2.17. HRMS calcd for C28H33N3O3 [M+H]+, 460.2594; found, 460.2599.
N-((4R,4aR,7R,7aR,12bS)−3-(cyclopropylmethyl)−9-hydroxy-2,3,4,4a,5,6,7,7a-octahydro-1H-4,12-methano[1]benzofuro[3,2-e]isoquinolin-7-yl)−3-(hydroxymethyl)benzamide (MP1210)
Request a detailed protocolTo a suspension of PyBOP (70 mg, 0.135 mmol, 2.2 eq.) in THF (100 mL) were sequentially added a solution of 3-(hydroxymethyl)benzoic acid (21 mg, 0.135 mmol, 2.2 eq.) in THF (100 mL) and NEt(iPr)2 (24 mL, 0.135 mmol, 2.2 eq.) and the resulting mixture was stirred for 40 min at rt. This solution was subsequently added via cannula to a suspension of solution of β-dihydro N-CPM morphineamine 6 (20 mg, 0.061 mmol, 1.0 eq.) in THF (100 mL) and the mixture was stirred at rt overnight. To the crude mixture methanol and potassium carbonate were added and stirring was continued for 2 hr. After filtration, the solvent was removed on a rotary evaporator, and the crude product was loaded on a 4 g Silica Gold column. Chromatography was performed with 5% to 20% MeOH (containing 10% concentrated NH4OH solution) gradient in 12 min. The desired product eluted around 11–12 min (15 mg, Yield 51%). 1H NMR (400 MHz, CDCl3) δ: 8.27 (s, 1H), 8.20 (d, J = 7.7 Hz, 1H), 7.97 (d, J = 7.7 Hz, 1H), 7.89 (dt, J = 10.6, 5.1 Hz, 1H), 7.19 (d, J = 8.3 Hz, 1H), 7.09 (d, J = 8.1 Hz, 1H), 5.14 (s, 2H), 5.09–5.03 (m, 1H), 4.87 (s, 5H), 4.40–4.29 (m, 1H), 4.26 (s, 1H), 3.82 (d, J = 14.1 Hz, 1H), 3.55 (d, J = 11.7 Hz, 1H), 3.44 (s, 1H), 3.32 (s, 1H), 3.20 (s, 1H), 3.16 (s, 1H), 3.03 (s, 1H), 2.91 (s, 1H), 2.68–2.63 (m, 0H), 2.62 (s, 1H), 2.34 (d, J = 13.3 Hz, 1H), 2.25 (d, J = 13.1 Hz, 1H), 2.13 (d, J = 13.1 Hz, 1H), 1.97 (q, J = 13.1 Hz, 1H), 1.63–1.52 (m, 2H), 1.15 (d, J = 8.1 Hz, 2H), 0.83 (d, J = 13.5 Hz, 2H).13C NMR (101 MHz, CDCl3) δ: 169.20, 143.41, 142.19, 141.22, 134.71, 130.51, 128.80, 126.51, 125.92, 120.05, 118.79, 93.14, 64.24, 59.50, 58.21, 52.41, 46.80, 43.52, 40.79, 33.97, 28.81, 24.26, 21.39, 7.49, 4.65, 4.46. HRMS calcd for C28H32N2O4 [M+H]+, 461.2435; found, 460.2440.
(4aS,7S,12bS)−3-(Cyclopropylmethyl)−4a,9-dimethoxy-2,3,4,4a,5,6,7,7a-octahydro-1H-4,12-methanobenzofuro[3,2-e]isoquinolin-7-ol (13)
Request a detailed protocolA solution of Li-selectride (1.3 mL, 1.3 mmol, 2 eq. 1M in THF) was slowly added to the stirred solution of known ketone (Kobylecki et al., 1982) 12 (320 mg, 0.86 mmol) in THF (5 mL) at −78°C. The reaction mixture was continued at the temperature for 90 min. The reaction mixture was quenched with cold methanol (0.2 mL) at −78°C and the cold bath was removed and is continued stirring for 10 min to warm up to rt. Then, the product was extracted four times (4 × 20 mL) using DCM. The organic layer was dried over anhydrous sodium sulfate, filtered, and concentrated under reduced pressure. The crude product was purified by silica column (ISCO flash column) using methanol (1–2%) in DCM. The product fraction was concentrated and dried under high vacuum to get desired products 13; (240 mg, Yield 75%); 1H NMR (600 MHz, Chloroform-d) δ = 6.71 (d, J = 8.2 Hz, 1H), 6.58 (d, J = 8.2 Hz, 1H), 4.66 (dd, J = 4.8, 1.1 Hz, 1H), 4.22 (dt, J = 9.4, 4.6 Hz, 1H), 3.87 (s, 3H), 3.53 (d, J = 6.0 Hz, 1H), 3.29 (s, 3H), 3.12 (d, J = 18.3 Hz, 1H), 2.65 (dd, J = 12.0, 5.2 Hz, 1H), 2.53–2.40 (m, 2H), 2.38 (dd, J = 18.4, 6.1 Hz, 1H), 2.28–2.10 (m, 2H), 1.88–1.73 (m, 1H), 1.66 (ddt, J = 14.7, 8.4, 4.0 Hz, 1H), 1.42 (ddd, J = 12.3, 3.8, 1.6 Hz, 1H), 1.16–1.02 (m, 2H), 0.93–0.84 (m, 1H), 0.62–0.43 (m, 2H), 0.16 – −0.06 (m, 2H). ESI-MS m/z: 372.4 [M+H]+.
(4aS,7R,12bS)−3-(Cyclopropylmethyl)−4a,9-dimethoxy-2,3,4,4a,5,6,7,7a-octahydro-1H-4,12-methanobenzofuro[3,2-e]isoquinolin-7-amine (14)
Request a detailed protocolPhthalimide (36.4 mg, 0.24 mmol, 2 eq.) and triphenylphosphine (48.7 mg, 0.18 mmol, 1.5 eq.) were added to a stirred solution of alcohol 13 (46 mg, 0.12 mmol) in THF (1 mL.) under argon. Diisopropyl azodicarboxylate (36.8 µL, 0.18 mmol, 1.5 eq.) was added drop wise to the reaction mixture at 0°C and the reaction was continued for overnight. The reaction mixture was quenched with water (0.5 mL) and the mixture was stirred for 10 min at rt. The organic solvent was removed under reduced pressure. The residue was treated with 2% aqueous citric acid (1 mL), and dilute HCl (0.1 M, 1 mL) solutions. The mixture was washed with Et2O (3 × 2 mL). Then, the aqueous layer was basified (~ pH = 10) using an ammonia solution. The product was extracted in CHCl3 (3 × 5 mL), dried over anhydrous Na2SO4, filtered, and concentrated under reduced pressure. The crude product was purified by silica gel column chromatography using methanol (1–5%) in DCM to obtain white solid of phthalimides intermediates (19 mg, 32%) upon drying. Then, hydrazine hydrate (23.8 µL, 10 eq.) was added to the stirred solution of the phthalimide intermediate in methanol (2 mL) at once heated to 50°C for 90 min to complete the reaction. The reaction mixture was diluted with DCM (4 mL) and the product was extracted in dilute HCl (3 × 2 mL), the aqueous layer was basified with dilute NH4OH (5%) and the amine is extracted in DCM (3 × 2 mL). The DCM layer was dried over anhydrous Na2SO4, filtered and concentrated under reduced pressure to get the desired product 14 (14 mg, yield; quantitative, which was used without further purification); 1H NMR (600 MHz, Chloroform-d) δ 6.69 (d, J = 8.2 Hz, 1H), 6.59 (d, J = 8.1 Hz, 1H), 4.30 (d, J = 6.9 Hz, 1H), 3.86 (s, 3H), 3.55 (d, J = 5.1 Hz, 1H), 3.25 (s, 3H), 3.11 (d, J = 18.2 Hz, 1H), 2.69–2.52 (m, 2H), 2.52–2.26 (m, 4H), 2.05 (td, J = 12.1, 3.9 Hz, 1H), 1.82 (dt, J = 14.3, 3.3 Hz, 1H), 1.63 (qd, J = 12.8, 2.7 Hz, 1H), 1.52–1.39 (m, 1H), 1.36–1.20 (m, 2H), 1.20–1.05 (m, 1H), 0.87 (tt, J = 8.9, 7.1, 3.3 Hz, 1H), 0.64–0.43 (m, 2H), 0.24–0.09 (m, 2H). ESI-MS m/z: 371.37 [M+H]+.
N-((4aS,7R,12bS)−3-(Cyclopropylmethyl)−9-hydroxy-4a-methoxy-2,3,4,4a,5,6,7,7a-octahydro-1H-4,12-methanobenzofuro[3,2-e]isoquinolin-7-yl)−3-iodobenzamide (MP1305)
Request a detailed protocolm-Iodobenzoic acid (8.86 mg, 0.035 mmol, 1.3 eq.) was added to a stirred solution of β-amine 14 (12 mg, 0.032 mmol) in DMF (0.2 mL) at. HATU (14.7 mg, 0.038 mmol, 1.3 eq.) was added to the mixture at rt at once and after 5 min, DIPEA (16.9 µL, 3 eq.) was added and the reaction was continued for 1 hr. Then, the reaction mixture was diluted with EtOAc (5 mL) and the EtOAc layer was washed with brine (5 × 3 mL) to remove DMF. The organic layer was dried over anhydrous Na2SO4, filtered, and concentrated under reduced pressure. The crude product was purified by silica gel column chromatography using a mixture of methanol (1–2%) in DCM to obtain white solid of methoxy intermediates (10 mg, 52%) upon drying. Then, BBr3 solution (116 µL, 0.116 mmol, 7 eq., 1M in DCM) was added to a stirred solution of methoxy intermediate (10 mg, 0.016 mmol) in DCM (2 mL) at 0°C under argon. The reaction mixture was continued for 10 min at 0°C and 20 more minutes at rt. The, reaction mixture was diluted with DCM (8 mL) and quenched with excess of NH4OH (5%, 2 mL) and the mixture was stirred for 1 hr. The DCM layer was washed with brine (2 × 2 mL), dried over anhydrous Na2SO4, filtered, and concentrated under reduced pressure. The crude product was purified by silica gel column chromatography using a mixture of methanol (5–10%) in DCM to get desired products MP1305 (4.9 mg, Yield 26%); 1H NMR (600 MHz, Methanol-d 4) δ = 8.21 (t, J = 1.7 Hz, 1H), 8.02–7.75 (m, 1H), 7.25 (t, J = 7.8 Hz, 1H), 6.69 (q, J = 8.2 Hz, 2H), 4.71 (d, J = 7.7 Hz, 1H), 4.09 (s, 1H), 3.87 (ddd, J = 12.7, 7.7, 5.2 Hz, 1H), 2.82 (s, 3H), 2.73–2.35 (m, 4H), 2.06 (d, J = 14.6 Hz, 1H), 1.87–1.61 (m, 2H), 1.56–1.27 (m, 3H), 1.02 (s, 1H), 0.68 (d, J = 55.0 Hz, 3H), 0.37 (s, 3H). 13C NMR (151 MHz, MeOD) δ = 168.30, 143.52, 141.68, 137.67, 137.48, 131.39, 127.62, 120.51, 119.10, 94.71, 92.55, 76.95, 59.48, 56.11, 54.81, 53.48, 29.51, 24.91, 24.50, 23.97, 5.64, 3.31,–0.03. HRMS calcd for C38H31IN2O4 [M+H]+, 587.1407; found, 587.1388.
(4bR,6R,8aS)−6-Amino-11-(cyclopropylmethyl)−3-methoxy-5,6,7,8,9,10-hexahydro-8aH-9,4b-(epiminoethano)phenanthren-8a-ol (16)
Request a detailed protocolNH4OAc (802.4 mg, 10.41 mmol, 20 eq.) was added to a stirred solution of known ketone (Zhang et al., 2007) 15 (177.7 mg, 0.52 mmol) in dry MeOH (4 mL) under argon at rt. The mixture was stirred for 8 hr. Then, NaCNBH3 (163.6 mg, 2.60 mmol, 5 eq.) was added to the reaction mixture and the reaction was continued for overnight. The solvent was evaporated under reduced pressure and the content was stirred with aqueous HCl (1M, 10 mL) for 2 hr at rt. The aqueous layer was diluted with water (20 mL), basified with concentrated NH4OH solution (to pH ~10) and then the product was extracted in DCM (3 × 15 mL). The combined DCM layer was washed with brine (10 mL), dried over anhydrous Na2SO4, filtered and concentrated. The crude product was purified by silica gel column chromatography using a mixture of 10% TEA, and 1% MeOH in DCM. The β amine is more polar than α counterpart on using the condition, which was eluted later and upon drying furnished a white solid of the desired product 16 (β, 90 mg, Yield 51%); 1H NMR (600 MHz, CDCl3) δ = 6.99 (d, J = 8.4 Hz, 1H), 6.86 (d, J = 2.6 Hz, 1H), 6.69 (dd, J = 8.4, 2.6 Hz, 1H), 4.65 (s, 1H), 3.78 (s, 3H), 3.00–2.91 (m, 2H), 2.77–2.66 (m, 2H), 2.56–2.48 (m, 1H), 2.38–2.27 (m, 2H), 2.15 (dd, J = 13.2, 3.6 Hz, 1H), 2.07–2.00 (m, 2H), 1.80 (dd, J = 13.2, 11.8 Hz, 1H), 1.63 (p, J = 4.8 Hz, 2H), 1.54–1.41 (m, 2H), 1.09–1.00 (m, 1H), 0.86–0.78 (m, 1H), 0.50 (dd, J = 8.1, 1.7 Hz, 2H), 0.12–0.06 (m, 2H). 13C NMR (151 MHz, CDCl3) δ = 158.4, 142.8, 128.3, 128.1, 111.1, 111.0, 68.7, 60.3, 59.4, 55.4, 46.4, 44.2, 42.3, 40.9, 37.0, 32.6, 31.2, 24.6, 9.6, 4.0, 3.9. ESI-MS m/z: 343.2 [M+H]+.
N-((4bR,6R,8aS)−11-(Cyclopropylmethyl)−8a-hydroxy-3-methoxy-6,7,8,8a,9,10-hexahydro-5H-9,4b-(epiminoethano)phenanthren-6-yl)−3-iodobenzamide (17)
Request a detailed protocolDIPEA (203 µL, 1.16 mmol, 3 eq.) and β-amine 16 (80 mg, 0.23 mmol) were added to the stirred solution of m-iodobenzoic acid (86.9 mg, 0.35 mmol, 1.5 eq.) dissolved in DMF (1 mL) at rt under an argon atmosphere. The reaction mixture was cooled to 0°C and HATU (133.2 mg, 0.35 mmol, 1.3 eq.) was added to the reaction mixture. After stirring the reaction mixture for 4 hr at 0°C to rt, the reaction mixture was poured into EtOAc (15 mL) and was washed with brine (5 × 15 mL). The EtOAc layer was dried over Na2SO4, filtered; and concentrated under reduced pressure. Then, the residue was purified by silica gel column chromatography using 2–5% MeOH in DCM. The desired product fractions were concentrated under reduced pressure and dried under high vacuum to get amorphous solid of the product 17 (110 mg, Yield 83%); 1H NMR (600 MHz, MeOD) δ = 8.20 (t, J = 1.7 Hz, 1H), 7.91 (dt, J = 7.9, 1.3 Hz, 1H), 7.83 (dt, J = 7.8, 1.3 Hz, 1H), 7.26 (t, J = 7.8 Hz, 1H), 7.22–7.17 (m, 2H), 6.88 (dd, J = 8.5, 2.5 Hz, 1H), 4.04–3.98 (m, 1H), 3.89 (s, 3H), 3.85 (s, 1H), 3.31–3.21 (m, 3H), 3.02 (d, J = 12.5 Hz, 1H), 2.90 (s, 1H), 2.68 (s, 1H), 2.56–2.43 (m, 2H), 2.13 (t, J = 12.7 Hz, 1H), 2.07–1.98 (m, 1H), 1.82–1.70 (m, 3H), 1.36–1.32 (m, 1H), 1.12 (dd, J = 8.8, 4.2 Hz, 1H), 0.83 (d, J = 8.7 Hz, 1H), 0.76 (td, J = 8.8, 4.6 Hz, 1H), 0.51 (s, 2H). 13C NMR (151 MHz, MeOD) δ = 168.1, 161.0, 141.5, 138.0, 137.5, 131.3, 130.2, 127.6, 115.1, 111.1, 94.6, 69.6, 62.5, 58.7, 55.9, 46.5, 42.2, 35.8, 31.7, 27.4, 25.4, 6.0, 3.4. ESI-MS m/z: 569.2 [M+H]+.
N-((4bR,6R,8aS)−11-(Cyclopropylmethyl)−3,8a-dihydroxy-6,7,8,8a,9,10-hexahydro-5H-9,4b-(epiminoethano)phenanthren-6-yl)−3-iodobenzamide (MP1601)
Request a detailed protocolA solution of BBr3 (874 µL, 0.87 mmol, 5 eq.) was added to the stirred solution of methyl ether 17 (100 mg, 0.17 mmol) dissolved in DCM (4 mL) at 0°C under an argon atmosphere. The reaction was continued at 0°C for 10 min and then at rt for 20 min. The reaction mixture was diluted with DCM (5 mL) and treated with aqueous NH4OH (5%, 2 mL) for 1 hr. The, the DCM layer was separated and was washed with saturated solution of NaHCO3 (2 × 10 mL), brine (5 mL), dried over anhydrous Na2SO4, filtered; and concentrated under reduced pressure. Then, the residue was purified by silica gel column chromatography using 10–15% MeOH in DCM. The desired product fractions were concentrated under reduced pressure and dried under high vacuum to get amorphous solid of MP1601; (72 mg, Yield 74%); 1H NMR (600 MHz, CDCl3) δ = 8.06 (d, J = 1.8 Hz, 1H), 7.83–7.72 (m, 1H), 7.67 (dt, J = 7.6, 1.2 Hz, 1H), 7.14 (t, J = 7.8 Hz, 1H), 7.03 (d, J = 2.5 Hz, 1H), 6.95 (d, J = 8.3 Hz, 1H), 6.71 (dd, J = 8.3, 2.4 Hz, 1H), 6.09 (s, 1H), 4.02 (tdt, J = 11.9, 8.1, 4.2 Hz, 1H), 3.02 (d, J = 18.2 Hz, 1H), 2.75 (d, J = 18.0 Hz, 1H), 2.59 (s, 1H), 2.45–2.27 (m, 3H), 2.14 (t, J = 15.5 Hz, 1H), 2.04 (d, J = 5.9 Hz, 1H), 1.95–1.74 (m, 3H), 1.63 (td, J = 13.3, 4.4 Hz, 1H), 1.55 (d, J = 13.4 Hz, 1H), 1.31–1.16 (m, 1H), 1.14–1.03 (m, 1H), 0.86 (d, J = 16.2 Hz, 1H), 0.52 (d, J = 8.0 Hz, 2H), 0.13 (s, 2H). 13C NMR (151 MHz, CDCl3) δ = 165.3, 140.3, 136.6, 136.0, 130.3, 128.6, 126.1, 114.1, 112.0, 94.3, 68.8, 60.2, 59.3, 45.8, 44.1, 41.8, 36.3, 30.8, 27.9, 24.5, 4.0, 3.9. HRMS calcd for C27H32IN2O3 [M+H]+, 559.1458; found, 559.1457.
Appendix 1
Appendix 1—table 1 shows the receptor affinities of arylamidomorphinans in opioid transfected cell lines. a Competition studies were performed with the indicated compounds against 125IBNtxA (0.1 nM) in membranes from CHO cells stably expressing the indicated cloned mouse opioid receptors. K i values were calculated from the IC50 values and represent the means ± SEM of at least three independent replications. b Literature values (Váradi et al., 2015a).
Appendix 1—table 1
Receptor affinities of arylamidomorphinans in mouse opioid receptor transfected cell lines.
| Compd. | Ki [nM]a | ||||
|---|---|---|---|---|---|
| mMOR | mKOR | mDOR | |||
| IBNtxA | 0.11 ± 0.02 | 0.03 ± 0.001 | 0.24 ± 0.05 | ||
| MP1104 | 0.021 ± 0.00 | 0.0064 ± 0.0 | 0.08 ± 0.01 | ||
| MP1202 | 0.071 ± 0.031 | 0.11 ± 0.064 | 1.3 ± 0.8 | ||
| MP1207 | 0.23 ± 0.02 | 0.39 ± 0.05 | 15.62 ± 2.64 | ||
| MP1208 | 0.34 ± 0.01 | 0.28 ± 0.02 | 19.28 ± 6.48 | ||
| MP1305 | 0.25 ± 0.02 | 2.5 ±0.3 | 11.7 ± 1.4 | ||
| MP1601 | 0.2 ± 0.01 | 2.13 ± 0.3 | 5.37 ± 0.9 | ||
| Morphine | 4.60 ± 1.81b | _ | _ | ||
| DAMGO | 3.34 ± 0.43b | _ | _ | ||
| U50, 488h | _ | 0.73 ± 0.32b | _ | ||
| DPDPE | _ | _ | 1.39 ± 0.67b | ||
Appendix 1—table 2 shows the [35S]GTPγS Functional assaysa in transfected cell lines.aEfficacy data were determined using an agonist induced stimulation of [35S]GTPγS binding assay. Efficacy is represented as EC50 (nM) and percent maximal stimulation (Emax) relative to standard agonist DAMGO (mMOR), DPDPE (mDOR), or U50,488H (mKOR) at 1 µM. To determine the antagonistic properties of a compound, membranes were incubated with 100 nM of the appropriate agonist by varying its concentrations. Results are presented as nM ± SEM from three independent experiments performed as triplicate.bBuprenorphine data from Grinnell et al., 2016. c95% CL dFull agonist compared to 1 µM DAMGO.
Appendix 1—table 2
[35S]GTPγS Functional assays in mouse opioid receptor transfected cell lines.
| Compd. | mMOR | mKOR | mDOR | |||||||
|---|---|---|---|---|---|---|---|---|---|---|
| EC50 (nM) | Emax (%) | EC50 (nM) | Emax (%) | EC50 (nM) | Emax (%) | IC50 (nM) | ||||
| IBNtxA | 0.49 ± 0.12 | 101 ± 3 | 0.22 ± 0.02 | 102 ± 4 | 4.08 ± 0.67 | 95 ± 2 | - | |||
| MP1104 | 0.21 ± 0.03 | 103 ± 2 | 0.027 ± 0.002 | 104 ± 2 | 0.41 ± 0.11 | 88 ± 0 | - | |||
| MP1202 | 0.32 ± 0.03 | 68 ± 1 | 0.13 ± 0.02 | 94 ± 5 | 4 ± 1.6 | 71 ± 2 | - | |||
| MP1207 | 1.29 ±0.65 | 41 ± 1 | 1.52 ± 0.07 | 39.3 ± 1.3 | nd | 10-15% | 27.34±1.95 | |||
| MP1208 | 1.13 ± 0.05 | 54 ± 0.7 | 1.36 ± 0.23 | 43 ± 0.8 | nd | 10-15% | 11.39±0.3 | |||
| MP1305 | 0.7 ± 0.1 | 81.2 ± 16 | 7.4 ± 1.8 | 42.2 ± 5.3 | 31.7 ± 3.6 | 22± 0.9 | - | |||
| MP1601 | 0.5 ± 0.2 | 45 ± 4.6 | 3 ± 0.7 | 72 ± 4.5 | 10 ± 1.6 | 67 ± 3.9 | - | |||
| DAMGO | 3.4 ± 0.2 | - | - | - | - | - | - | |||
| U50,488h | - | - | 9.5 ± 1.8 | - | - | - | - | - | ||
| DPDPE | - | - | - | - | 16.2 ± 5.1 | - | - | |||
| Morphine | 14.77±3.9 | 102±5 | - | - | - | - | - | |||
| Buprenorphineb | 1.8(1.3,2.3)c | Full agonistd | - | - | - | - | - | |||
Appendix 1—table 3 shows the energies calculated by computational QM calculations.
Appendix 1—table 3
Energies for boat and chair conformations calculated by computational QM calculations for ligands.
| Ligand (Basis set) | Energy(Chair – Boat) HF |
Energy(Chair – Boat) kcal/mol | Energy(Chair – Boat) kJ/mol |
|---|---|---|---|
| MP1104 (LanL2DZ) | 0.03671637 | 23.0396323 | 96.3988294 |
| MP1104 (DGDZVP) | 0.03493887 | 21.9242457 | 91.7320032 |
| IBNtxA (LanL2DZ) | −0.0014450 | −0.90674184 | −3.7938475 |
| IBNtxA (DGDZVP) | −0.0016583 | −1.040599833 | −4.353869701 |
| MP1202 (LanL2DZ) | −0.01402513 | −8.8009031585 | −36.822978815 |
| MP1202 (DGDZVP) | −0.011652 | −7.31174652 | −30.59234743997 |
Appendix 1—table 4 showing the best docking scores of each ligand with a chair or a boat conformation at active state human mu and kappa opioid receptors.
Appendix 1—table 4
Best docking scores of each ligand with a chair or a boat conformation at active state human mu and kappa opioid receptors.
| Drugs | MP1104 | IBNtxA | MP1202 | MP1207 | MP1208 | MP1305 | MP1601 | 6'GNTI | MP1209 | MP1210 |
|---|---|---|---|---|---|---|---|---|---|---|
| Docking score of Chair/hMOR | -36.22 | -52.42 | -55.04 | -69.74 | -38.63 | -40.61 | -51.03 | -44.17 | ||
| Boat /hMOR | -48.28 | -31.36 | -49.44 | -50.81 | -67.72 | -28.83 | -38.23 | -43.67 | -36.18 | |
| Chair /hKOR | -46.93 | -47.82 | -55.99 | -86.24 | -46.77 | -46.08 | -64.86 | -57.63 | -53.91 | |
| Boat /hKOR | -55.06 | -49.51 | -52.42 | -45.9 | -65.88 | -44.87 | -47.54 | -60.77 | -55.43 |
Appendix 1—table 5 shows the docking scores for proposed analogs of MP1202, where m-iodo group is substituted with a polar moiety (R).
Appendix 1—table 5
Docking scores for proposed analogs of MP1202, where m-iodo group is substituted with a polar moiety (R).
| Serial | R | Chair score | Boat score | Scores for chair preference |
|---|---|---|---|---|
| 1 | -mNH2 | −55.35 | −58.47 | +3.12 |
| 2 | -mN(CH3)2 | −51.81 | −48.34 | −3.47 |
| 3 | -mOH | −54.81 | −57.34 | +2.53 |
| 4 (MP1207) | -mCH2NH2 | −55.99 | −45.9 | −10.09 |
| 5 | -mCH2CH2NH2 | −59.42 | −51.79 | −7.63 |
| 6 | -mCH2CH2CH2NH2 | −64.07 | −49.91 | −14.16 |
| 7 | -mCH2CH2CH2CH2NH2 | −52.42 | −49.67 | −2.75 |
| 8 | -mgaunidine | −76.29 | −66.34 | −9.95 |
| 9 (MP1208) | -mCH2guanidine | −86.24 | −65.88 | −20.36 |
| 10 | -mCOguanidine | −82.09 | −77.53 | −4.56 |
| 11 | -pCH2NH2 | −57.63 | −60.77 | +3.14 |
| 12 | -mCH2OH | −53.91 | −55.43 | +1.5 |
Appendix 1—table 6 shows the functional studies at DOR using cAMP inhibition and Tango-arrestin and BRET assays. The functional data of each assay using human delta opioid receptor (hDOR) and mouse delta opioid receptor (mDOR) were normalized to Emax of corresponding controls DPDPE or DADLE. Results were analyzed using a three-parameter logistic equation in GraphPad Prism and the data are presented as mean EC50(pEC50 ± SEM) with Emax% ± SEM for assays run in triplicate; CTRL.; control compound and nd; results could not be determined because of no measurable arrestin recruitment signal.
Appendix 1—table 6
Functional data at hDOR and mDOR.
| Functional data at hDOR and mDOR | |||||
|---|---|---|---|---|---|
| Compd. | cAMP inhibition | Arrestin recruitment | |||
| EC50,nM (pEC50± SEM) | Emax%± SEM | EC50,nM (pEC50± SEM) | Emax%± SEM | ||
| IBNtxA | 0.43 (9.3 ± 0.03) | 106 ± 1 | 14.1(7.8 ± 0.06) | 224±5 | |
| DPDPE (CTRL.) | 0.69 (9.1 ± 0.07) | 100 ± 2 | 2.99(8.5 ± 0.04) | 100±1.5 | |
| MP1104 | 0.40 (9.4 ± 0.04) | 99 ± 1.1 | 3.73 (8.4 ± 0.06) | 189 ± 5.5 | |
| DADLE (CTRL.) | 0.66(9.2 ± 0.05) | 100 ± 1.3 | 0.349 (9.45 ± 0.10) | 100 ± 3.2 | |
| MP1202 | 8.18(8.1 ± 0.06) | 99 ± 2.2 | 18.14(7.7 ± 0.25) | 26 ± 3.1 | |
| DADLE (CTRL.) | 1.45(8.8 ± 0.06) | 100 ± 2 | 8.41(8.1 ± 0.08) | 100 ± 2.7 | |
| MP1207 | 11.4 (7.9 ± 0.1) | 38 ± 2 | 64.06(7.2 ± 0.23) | 34 ± 3.7 | |
| MP1208 | 2.49 (8.6 ± 0.13) | 39 ±1.8 | 3624.0(5.5 ± 0.27) | 62±16.7 | |
| DADLE (CTRL.) | 0.48 (9.3 ± 0.05) | 100 ±1.5 | 1.41 (8.8 ± 0.07) | 100±2.3 | |
| MP1305 | 74.18 (7.1 ± 0.08) | 71 ± 2.4 | 227.5(6.6 ± 0.06) | 89 ± 2.8 | |
| MP1601 | 2.76(8.6 ± 0.06) | 106 ± 2.3 | 86.7(7.1 ± 0.06) | 203±5.4 | |
| DPDPE(CTRL.) | 0.69 (9.1 ± 0.07) | 100 ± 2 | 2.99(8.5 ± 0.04) | 100±1.5 | |
| B. Functional data at mDOR using BRET assays | |||||
| Compd. | G protein activation | Arrestin recruitment | |||
| EC50,nM (pEC50± SEM) | Emax%± SEM | EC50,nM (pEC50± SEM) | Emax%± SEM | ||
| IBNtxA | 0.48(9.3 ± 0.10) | 108 ± 3.7 | 26.6(7.5 ± 0.2) | 88 ± 6.8 | |
| DPDPE(CTRL.) | 2.72(8.5 ± 0.09) | 100 ± 3 | 184.3(6.73 ± 0.1) | 100 ± 6.4 | |
| MP1104 | 1.4(8.9 ± 0.06) | 91 ± 1.7 | 26.0(7.6 ± 0.11) | 40 ± 1.7 | |
| DPDPE(CTRL.) | 1.3(8.9 ± 0.04) | 100 ± 1.2 | 98.0(7.0 ± 0.04) | 100 ± 1.8 | |
| MP1202 | 7.03(8.1 ± 0.15) | 103 ± 4.6 | 524.8(6.3 ± 0.20) | 26 ± 2.3 | |
| DPDPE(CTRL.) | 2.19(8.6 ± 0.10) | 100 ± 3.5 | 109.3(6.7 ± 0.06) | 100 ± 3 | |
| MP1207 | 116.4(6.9 ± 0.12) | 52 ± 2.3 | nd | nd | |
| MP1208 | 26.6(7.6 ± 0.20) | 58 ± 3.3 | nd | nd | |
| MP1305 | 40.4(7.4 ± 0.20) | 105 ± 5.9 | nd | nd | |
| MP1601 | 6.27(8.2 ± 0.20) | 105 ± 6.7 | 9.0 (8.0 ± 0.33) | 16 ± 1.4 | |
| DPDPE(CTRL.) | 0.44(9.3 ± 0.13) | 100 ± 2.5 | 21.8 (7.6 ± 0.04) | 100 ± 1.3 | |
Appendix 1—table 7 shows the functional binding data of the compounds at opioid receptors (hMOR, hKOR and mMOR). The functional data of each assay using human mu opioid receptor (hMOR), human kappa opioid receptor (hKOR), and mouse mu opioid receptor (mMOR) were normalized to Emax of corresponding controls. Results were analyzed using a three-parameter logistic equation in GraphPad Prism and the data are presented as mean EC50(pEC50 ± SEM) with Emax% ± SEM for assays run in triplicate; CTRL.; control compound.
Appendix 1—table 7
Gprotein & arrestin pathway potency and efficacy of ligands at hMOR, hKOR and mMOR.
| Receptors | Compounds | cAMP inhibition (Gi) assay | Arrestin recruitment (Tango) assay | Figure | ||
|---|---|---|---|---|---|---|
| EC50 (pEC50± SEM) | Emax%± SEM | EC50 (pEC50± SEM) | Emax%± SEM | |||
| hMOR | MP1104 | 0.074 (10.13 ± 0.05) nM | 94±1 | 0.573(9.24±0.08) nM | 90±2.28 | Figure 2A–B |
| DAMGO | 0.84(9.07±0.08) nM | 100 | 13.9 (7.86±0.06) nM | 100 | ||
| hKOR | MP1104 | 0.00327 (11.49±0.035) nM | 10±1.64 | 0.03944(10.4±0.06) nM | 117 ± 2 | Figure 2C–D |
| U50488h | 0.089(10.05±0.04) nM | 100 | 3.6(8.44±0.04) nM | 100 | ||
| hMOR | MP1202 | 0.077 (10.11 ± 0.06) nM | 92±1.4 | 26.8(7.57±0.1) nM | 53±2 | Figure 2G–H |
| DAMGO | 3.78(8.4±0.06) nM | 100 | 58.8(7.23±0.06) nM | 100 | ||
| hKOR | MP1202 | 0.00139 (11.86±0.05) nM, | 97.9±2.5 | 0.0457(10.34±0.05) nM | 101±1 | Figure 2I–J |
| U50,488h | 0.006 (10.2±0.056) nM | 100 | 3.6(8.44±0.04) nM | 100 | ||
| hKOR | MP1207 | 0.11 (9.98 ± 0.07) nM | 90±1.7 | 3.97(8.4±0.18) nM | 37±2 | Figure 3A–B |
| MP1208 | 0.14 (9.9 ± 0.07) nM | 96±1.9 | 16.41(7.79±0.14) nM | 48±2.4 | ||
| U50,488h | 0.64(9.2±0.06) nM | 100 | 7.55(8.12±0.06) nM | 100 | ||
| hMOR | MP1207 | 0.034 (10.47 ± 0.15) nM | 33±1.4 | nd | nd | Figure 3E–F |
| MP1208 | 0.008 (8.73 ± 0.12) nM | 42±1.3 | nd | nd | ||
| U50,488h | 1.86(8.73±0.06) nM | 100 | ||||
| hKOR | MP1209 | 0.024 (10.6 ± 0.05) nM | 100±1.23 | 0.37(9.43 ± 0.19) nM | 67±3 | Figure 4E–F |
| MP1210 | 0.025 (10.6 ± 0.05) nM | 101.1±1.1 | 1.16 (8.94 ± 0.17) nM | 63±3.3 | ||
| U50,488h | 0.05 (10.29±0.06) nM | 100 | 7.85 (8.11±0.1) nM. | 100 | ||
| hMOR | MP1209 | 0.25(9.61 ± 0.04) nM | 98.5±0.96 | nd | nd | Figure 4G–H |
| MP1210 | 0.15(9.81 ± 0.05) nM | 94.6±0.98 | nd | nd | ||
| DAMGO | 0.2 (9.7±0.06) nM | 100 | ||||
| hMOR | Methoxycarbonyl fentanyl | 0.099 (10 ± 0.06) nM | 103±1.8 | 18.94 (7.7±0.1) nM | 194±8 | Appendix 1—figure 8A–B |
| DAMGO | 2.58 (8.59±0.07) nM | 100 | 404.1(6.39±0.05) nM | 100 | ||
| hMOR | MP102 | 19.7(7.7 ± 0.08) nM | 87±2.66 | nd | nd | Appendix 1—figure 8F–G |
| DAMGO | 2.58 (8.59±0.07) nM | 100 | ||||
| Morphine | 21.8 (7.66 ± 0.08) nM | 97±3.06 | 888 (6.05±0.25) nM | 25.32±4.4 | ||
| hMOR | DAMGO | 8.1 (8.09 ± 0.06) nM | 100 | 140.7 (6.85±0.08) nM | 100 | |
| Buprenorphine | 0.7 (10.14 ± 0.11) pM | 75±2.36 | 1.79 (8.75±0.13) nM | 43±2 | ||
| DAMGO | 4.36 (8.36 ± 0.08) nM | 100 | 22 (7.64±0.063) nM | 100 | ||
| Receptors | Compounds | G protein activation (BRET) assay | Arrestin recruitment (BRET) assay | Figure | ||
| EC50 (pEC50± SEM) | Emax%± SEM | EC50 (pEC50± SEM) | Emax%± SEM | |||
| mMOR | MP1207 | 3.61 (8.44 ± 0.26) nM | 42±2.6 | nd | nd | Figure 3I–J |
| MP1208 | 2.27 (8.64 ± 0.29) nM | 41±3 | nd | nd | ||
| DAMGO | 3.27(8.49±0.08) nM | 100 | ||||
| DAMGO | 9.09 (8.04 ± 0.13) nM | 100 | ||||
| mMOR | Morphine | 9.09 (8.04 ± 0.13) nM | 109±3.1 | |||
| Buprenorphine | 1.17 (8.93 ± 0.14) nM | 59±2.4 | ||||
Appendix 1—table 8 shows the functional binding data of the compounds at rodent opioid receptors (mMOR and rKOR).The functional data of each assay using mouse mu opioid receptor (mMOR) and rat kappa opioid receptor (rKOR) were normalized to Emax of corresponding controls. Results were analyzed using a three-parameter logistic equation in GraphPad Prism and the data are presented as mean EC50(pEC50 ± SEM) with Emax% ± SEM for assays run in triplicate; CTRL.; control compound.
Appendix 1—table 8
Gprotein & arrestin pathway potency and efficacy of ligands at mMOR and rKOR.
| Receptors | Compound | G protein activation (BRET) assay | Arrestin recruitment (BRET) assay | Figure | |||
|---|---|---|---|---|---|---|---|
| EC50 (pEC50± SEM) | Emax%± SEM | EC50 (pEC50± SEM) | Emax%± SEM | ||||
| mMOR | MP1104 | 0.66 (9.2±0.11) nM | 62±2 | 0.285 (9.55±0.12) nM | 53 ± 1.6 | Appendix 1—figure 1A | |
| DAMGO | 7.3 (8.1±0.07) nM | 100 | 31.5 (7.5±0.06) nM | 100 | |||
| IBNtxA | 0.054(10.3 ± 0.02) nM | 59±2.2 | 11.32(4.9±0.3) µM | 75±13.9 | Appendix 1—figure 1B | ||
| DAMGO | 12.9(7.8±0.06) nM | 100 | 0.77(6.11±0.16) µM | 100 | |||
| MP1202 | 0.63 (9.2±0.09) nM | 61±1.5 | 3140 (5.5±0.28) nM | 53 ± 1.6 | Appendix 1—figure 1C | ||
| DAMGO | 6.31 (8.2±0.07) nM | 100 | 114 (6.9±0.15) nM | 100 | |||
| MP1207 | 3.61 (8.44 ± 0.26) nM | 42±2.6 | nd | nd | Appendix 1—figure 1D | ||
| MP1208 | 2.27 (8.64 ± 0.29) nM | 41±3 | nd | nd | |||
| DAMGO | 3.27(8.49±0.08) nM | 100 | |||||
| MP1305 | 0.74(9.1 ± 0.12) nM | 72±2 | nd | nd | Appendix 1—figure 1E | ||
| DAMGO | 3.3(8.4±0.08) nM | 100 | |||||
| MP1601 | 2.2(8.6 ± 0.3) nM | 49±3 | nd | nd | |||
| DAMGO | 0.9(9.0±0.1) nM | 100 | |||||
| rKOR | MP1104 | 0.073 (10.14±0.04) nM | 93±1 | 1.14(8.94±0.07) nM | 89 ± 2.6 | Appendix 1—figure 2A | |
| U50, 488h | 1.05(8.98±0.03) nM | 100 | 110(6.95±0.05) nM | 100 | |||
| IBNtxA | 0.064(10.2 ± 0.1) nM | 101±2.3 | 1.23(8.9±0.02) nM | 133±7.3 | Appendix 1—figure 2B | ||
| U50, 488h | 27.7(7.6±0.01)nM | 100 | 345.6(6.4±0.03) nM | 100 | |||
| MP1202 | 0.134(9.87±0.09) nM | 104±2 | 1.44(8.84±0.25) nM | 77 ± 5 | Appendix 1—figure 2C | ||
| U50, 488h | 4.79 (8.32±0.07) nM | 100 | 235(6.63±0.18) nM | 100 | |||
| MP1207 | 1.13 (8.95 ± 0.31) nM | 32±2.3 | nd | nd | Appendix 1—figure 2D | ||
| MP1208 | 1.1(8.97 ± 0.29) nM | 40±2.4 | nd | nd | |||
| U50, 488h | 82.6(7.1±0.09) nM | 100 | |||||
| MP1305 | 5.04 (8.3 ± 0.32) nM | 35±3 | nd | nd | Appendix 1—figure 2E | ||
| U50, 488h | 40.3(7.4±0.07) nM | 100 | |||||
| MP1601 | 8.9(8.1 ± 0.12) nM | 75±3 | 56.5(7.2±0.23) nM | 37±3 | |||
| U50, 488h | 26.7(7.6±0.09) nM | 100 | 169.6(6.7±0.07) nM | 100 | |||
| mMOR | IBNtxA | 0.054(10.3 ± 0.02) nM | 59±2.2 | 11.32(4.9±0.3) µM | 75±13.9 | Figure 3F–G | |
| DAMGO | 12.9(7.8±0.06) nM | 100 | 0.77(6.11±0.16) µM | 100 | |||
| rKOR | IBNtxA | 0.064(10.2 ± 0.1) nM | 101±2.3 | 1.23(8.9±0.02) nM | 133±7.3 | Figure 3H–I | |
| U50, 488h | 27.7(7.6±0.01) nM | 100 | 345.6(6.4±0.03) nM | 100 | |||
| mMOR | Methoxycarbonyl fentanyl | 0.21(9.7 ± 0.04) nM | 109±0.94 | 1.96(8.71±0.11) nM | 63±1.8 | Appendix 1—figure 7C–D | |
| DAMGO | 1.73(8.76±0.05) nM | 100 | 110.1(6.96±0.06) nM | 100 | |||
| MP102 | 404.5 (6.39 ± 0.2) nM | 78±7 | nd | nd | Appendix 1—figure 7E | ||
| DAMGO | 3.27(8.5±2) nM | 100 | |||||
Appendix 1—table 9 shows the functional binding data of the compounds at human opioid receptors (hMOR, hKOR and Y312W-hKOR). The functional data of each assay using human mu opioid receptor (hMOR), human kappa opioid receptor (hKOR), and Y312W human kappa opioid receptor mutant (Y312W-hKOR) were normalized to Emax of corresponding controls. Results were analyzed using a three-parameter logistic equation in GraphPad Prism and the data are presented as mean EC50(pEC50 ± SEM) with Emax% ± SEM for assays run in triplicate; CTRL.; control compound.
Appendix 1—table 9
cAMP & arrestin potency and efficacy at hMOR, hKOR and Y312W-hKOR of select ligands.
| Receptors | Compounds | cAMP inhibition (Gi) assay | Arrestin recruitment (Tango) assay | Figure | |||
|---|---|---|---|---|---|---|---|
| EC50 (pEC50± SEM) | Emax%± SEM | EC50 (pEC50± SEM) | Emax%± SEM | ||||
| hMOR | IBNtxA | 0.07(10.2 ± 0.006) nM | 95±2 | 5.86(8.2±0.002) nM | 29±0.02 | Appendix 1—figure 3A-B | |
| DAMGO | 0.99(9.0±0.007) nM | 100 | 14.16(7.9±0.003) nM | 100 | |||
| hKOR | IBNtxA | 2.46 (11.6 ± 0.037) pM | 101±1.79 | 0.013(10.9±0.07) nM | 109±1.8 | Appendix 1—figure 3C-D | |
| U50488h | 0.089(10.05±0.042) nM | 100 | 3.63(8.4±0.03) nM | 100 | |||
| Y312W-hKOR | MP1202 | 0.21 (10.69 ± 0.07)pM | 101±1.5 | 3.4(8.5±0.14) nM | 55±2.6 | Appendix 1—figure 7A,C | |
| U50,488h | 2.7(8.56±0.06)nM | 100 | 0.63(7.2±0.06) nM | 100 | |||
| WT-hKOR | MP1202 | 0.0457(10.34±0.05) nM | 101±1 | Appendix 1—figure 7B,D | |||
| U50,488h | 3.6(8.44±0.04) nM | 100 | |||||
| WT-hMOR | MP1202 | 26.8(7.57±0.1) nM | 53±2 | ||||
| DAMGO | 58.8(7.23±0.06) nM | 100 | |||||
| Y312W-hKOR | MP1207 | 0.16 (9.8 ± 0.08) nM | 95±1.8 | nd | nd | Appendix 1—figure 7E,G | |
| MP1208 | 0.36 (10.44 ± 0.05) pM | 97±1 | nd | nd | |||
| U50,488h | 0.92(9.04±0.04)nM | 100 | 14(7.85±0.1) nM | 100 | |||
| WT-hKOR | MP1207 | 3.97(8.4±0.18) nM | 37±2 | nd | nd | Appendix 1—figure 7F | |
| MP1208 | 16.41(7.79±0.14) nM | 48±2.4 | nd | nd | |||
| U50,488h | 7.55(8.12±0.06) nM | 100 | |||||
| hKOR | MP1305 | 0.72 (9.14 ± 0.05) nM | 102±1.2 | 25.72(7.6±0.04) nM | 75±1 | Appendix 1—figure 9A-B | |
| U50, 488h | 0.076(10.11±0.04) nM | 100 | 3.6(8.44±0.04) nM | 100 | |||
| hMOR | MP1305 | 0.12(9.9 ± 0.12) nM | 69±1.8 | 16.4(7.8±0.3) nM | 21±3 | Appendix 1—figure 9C-D | |
| DAMGO | 3.88(8.4±0.05) nM | 100 | 168.1(6.77±0.09) nM | 100 | |||
| hKOR | MP1601 | 0.17(9.76 ± 0.05) nM | 109±1 | 3.23(8.49±0.07) nM | 107±3 | Appendix 1—figure 9E-F | |
| U50, 488h | 0.077(10.11±0.04) nM | 100 | 3.6(8.44±0.04) nM | 100 | |||
| hMOR | MP1601 | 0.1(9.99 ± 0.09) nM | 69±1 | 4.02(8.4±0.2) nM | 27±2 | Appendix 1—figure 9G-H | |
| DAMGO | 3.88(8.4±0.05) nM | 100 | 168.1(6.77±0.09) nM | 100 | |||
Appendix 1—table 10 shows the bias analysis of ligands at human opioid receptors (nd: not determined; ns compared to control).
Appendix 1—table 10
Bias analysis of ligands at human opioid receptors.
| Drug | Receptor | cAMP | Tango | ΔlogRA | ΔlogRA | ΔΔlog RA | Bias factor | Figure |
|---|---|---|---|---|---|---|---|---|
| Log RA | LogRA | cAMP | Tango | (cAMP-Tango) | (cAMP-Tango) | |||
| U50,488h | hKOR | 10.09±0.035 | 8.29±0.019 | 0±0.049 | 0±0.027 | 0±0.056 | 1 | Appendix 1—figure 4A |
| MP1104 | hKOR | 11.44±0.034 | 10.45±0.019 | 1.35±0.048 | 2.16±0.027 | -0.81±0.055 | 0.15 | |
| U50,488h | hKOR | 10.22±0.051 | 8.44±0.004 | 0±0.072 | 0±0.006 | 0±0.070 | 1 | Appendix 1—figure 4A |
| MP1202 | hKOR | 11.88±0.050 | 10.30±0.004 | 1.66±0.072 | 1.856±0.006 | -0.19±0.072 | nd | |
| U50,488h | hKOR | 10.06±0.036 | 8.36±0.011 | 0±0.051 | 0±0.015 | 0±0.050 | 1 | Appendix 1—figure 4A |
| IBNtxA | hKOR | 11.59±0.036 | 10.89±0.010 | 1.53±0.050 | 2.53±0.015 | -1.002±0.052 | 0.10 | |
| U50,488h | hKOR | 9.175±0.004 | 8.14±0.007 | 0±0.005 | 0±0.010 | 0±0.012 | 1 | Appendix 1—figure 4A |
| MP1207 | hKOR | 9.902±0.004 | 7.97±0.024 | 0.73±0.006 | -0.176±0.025 | 0.903±0.026 | 8.00 | |
| U50,488h | hKOR | 9.176±0.004 | 8.14±0.008 | 0±0.005 | 0±0.011 | 0±0.012 | 1 | Appendix 1—figure 4A |
| MP1208 | hKOR | 9.83±0.004 | 7.447±0.020 | 0.65±0.005 | -0.697±0.022 | 1.35±0.022 | 22 | |
| U50,488h | hKOR | 10.42±0.06 | 8.37±0.22 | 0±0.084 | 0±0.31 | 0±0.32 | 1 | Appendix 1—figure 4A |
| MP1209 | hKOR | 10.55±0.06 | 8.735±0.220 | 0.13±0.084 | 0.368±0.31 | -0.238±0.32 | nd | |
| U50,488h | hKOR | 10.39±0.06 | 8.096±0.084 | 0±0.081 | 0±0.12 | 0±0.144 | 1 | Appendix 1—figure 4A |
| MP1210 | hKOR | 10.59±0.06 | 8.576±0.156 | 0.2±0.081 | 0.48±0.18 | -0.28±0.19 | nd | |
| U50,488h | hKOR | 10.010±0.012 | 8.507±0.026 | 0±0.017 | 0±0.037 | 0±0.041 | 1 | Appendix 1—figure 4A |
| MP1305 | hKOR | 9.22±0.012 | 7.17±0.025 | -0.79±0.017 | -1.341±0.036 | 0.55±0.04 | 4 | |
| U50,488h | hKOR | 10.03±0.014 | 8.414±0.009 | 0±0.020 | 0±0.012 | 0±0.023 | 1 | Appendix 1—figure 4A |
| MP1601 | hKOR | 9.85±0.014 | 8.51±0.009 | -0.19±0.020 | 0.097±0.012 | -0.282±0.023 | 0.52 | |
| DAMGO | hMOR | 9.102±0.009 | 7.925±0.013 | 0±0.012 | 0±0.019 | 0±0.022 | 1 | Appendix 1—figure 4B |
| MP1104 | hMOR | 10.12±0.009 | 9.18±0.013 | 1.018±0.012 | 1.26±0.019 | -0.24±0.022 | 0.58 | |
| DAMGO | hMOR | 8.44±0.011 | 7.18±0.001 | 0±0.015 | 0±0.001 | 0±0.015 | 1 | Appendix 1—figure 4B |
| MP1202 | hMOR | 9.99±0.012 | 7.24±0.002 | 1.55±0.016 | 0.058±0.002 | 1.49±0.016 | 31 | |
| DAMGO | hMOR | 8.86±0.075 | 7.82±0.060 | 0±0.106 | 0±0.084 | 0±0.135 | 1 | Appendix 1—figure 4B |
| IBNtxA | hMOR | 9.99±0.081 | 7.572±0.25 | 1.14±0.11 | -0.25±0.25 | 1.38±0.28 | 24 | |
| DAMGO | hMOR | 8.62±0.054 | 6.78±0.010 | 0±0.076 | 0±0.014 | 0±0.077 | 1 | Appendix 1—figure 4B |
| MP1305 | hMOR | 9.79±0.053 | 6.89±0.048 | 1.17±0.076 | 0.109±0.049 | 1.059±0.090 | 11 | |
| DAMGO | hMOR | 8.40±0.001 | 6.78±0.009 | 0±0.002 | 0±0.012 | 0±0.013 | 1 | Appendix 1—figure 4B |
| MP1601 | hMOR | 9.84±0.002 | 7.65±0.035 | 1.44±0.002 | 0.87±0.036 | 0.57±0.036 | 4 | |
| U50,488h | WT hKOR | 10.22±0.051 | 8.44±0.004 | 0±0.072 | 0±0.006 | 0±0.070 | 1 | Appendix 1—figure 7L |
| MP1202 | WT hKOR | 11.88±0.050 | 10.30±0.004 | 1.66±0.072 | 1.856±0.006 | -0.19±0.072 | nd | |
| U50,488h | Y312W-hKOR | 8.568±0.005 | 7.559±0.051 | 0±0.007 | 0±0.072 | 0±0.073 | 1 | Appendix 1—figure 7L |
| MP1202 | Y312W-hKOR | 10.63±0.005 | 8.091±0.051 | 2.062±0.007 | 0.532±0.073 | 1.53±0.073 | 34 | |
| DAMGO | hMOR | 8.563±0.004 | 5.037±0.176 | 0±0.006 | 0±0.249 | 0±0.249 | 1 | Appendix 1—figure 8J |
| Methoxycarbonyl | hMOR | 10.020±0.004 | 7.546±0.184 | 1.457±0.006 | 2.509±0.255 | -1.052±0.255 | 0.09 | |
| fentanyl |
Appendix 1—table 11 shows the bias analysis of ligands at rodent opioid receptors (nd:not determined; ns compared to control).
Appendix 1—table 11
Bias analysis of ligands at rodent opioid receptors.
| Drug | Receptor | BRET-G | BRET-Arr | ΔlogRA | ΔlogRA | ΔΔlog RA | Bias factor | Figure | |
|---|---|---|---|---|---|---|---|---|---|
| Log RA | LogRA | BRET-G | BRET-arr | (BRETG-BRETArr) | (BRETG-BRETArr) | ||||
| U50,488h | rKOR | 9.003±0.044 | 7.14±0.034 | 0±0.062 | 0±0.047 | 0±0.078 | 1 | Appendix 1—figure 4C | |
| MP1104 | rKOR | 10.07±0.047 | 8.84±0.033 | 1.067±0.064 | 1.702±0.047 | -0.64±0.079 | 0.23 | ||
| U50,488h | rKOR | 8.312±0.077 | 6.798±0.168 | 0±0.109 | 0±0.238 | 0±0.261 | 1 | Appendix 1—figure 4C | |
| MP1202 | rKOR | 9.906±0.088 | 8.791±0.171 | 1.594±0.117 | 1.993±0.239 | -0.399±0.27 | nd | ||
| U50,488h | rKOR | 7.55±0.103 | 5.988±0.222 | 0±0.146 | 0±0.313 | 0±0.345 | 1 | Appendix 1—figure 4C | |
| IBNtxA | rKOR | 10.19±0.141 | 8.846±0.266 | 2.64±0.175 | 2.858±0.346 | -0.218±0.388 | nd | ||
| U50,488h | rKOR | 7.593±0.012 | 6.783±0.005 | 0±0.016 | 0±0.007 | 0±0.018 | 1 | Appendix 1—figure 4C | |
| MP1601 | rKOR | 7.917±0.018 | 7.113±0.052 | 0.324±0.052 | 0.33±0.052 | -0.006±0.057 | nd | ||
| DAMGO | mMOR | 8.56±0.12 | 7.873±0.06 | 0±0.176 | 0±0.09 | 0±0.197 | 1 | Appendix 1—figure 4C | |
| MP1104 | mMOR | 8.917±0.12 | 9.196±0.06 | 0.357±0.173 | 1.323±0.09 | -0.966±0.195 | 0.11 | ||
| DAMGO | mMOR | 8.713±0.013 | 7.291±0.044 | 0±0.019 | 0±0.063 | 0±0.066 | 1 | Appendix 1—figure 8J | |
| Methoxycarbonyl | mMOR | 9.697±0.013 | 8.464±0.045 | 0.984±0.019 | 1.173±0.063 | -0.189±0.066 | nd | ||
| fentanyl | |||||||||
Appendix 1—figure 1
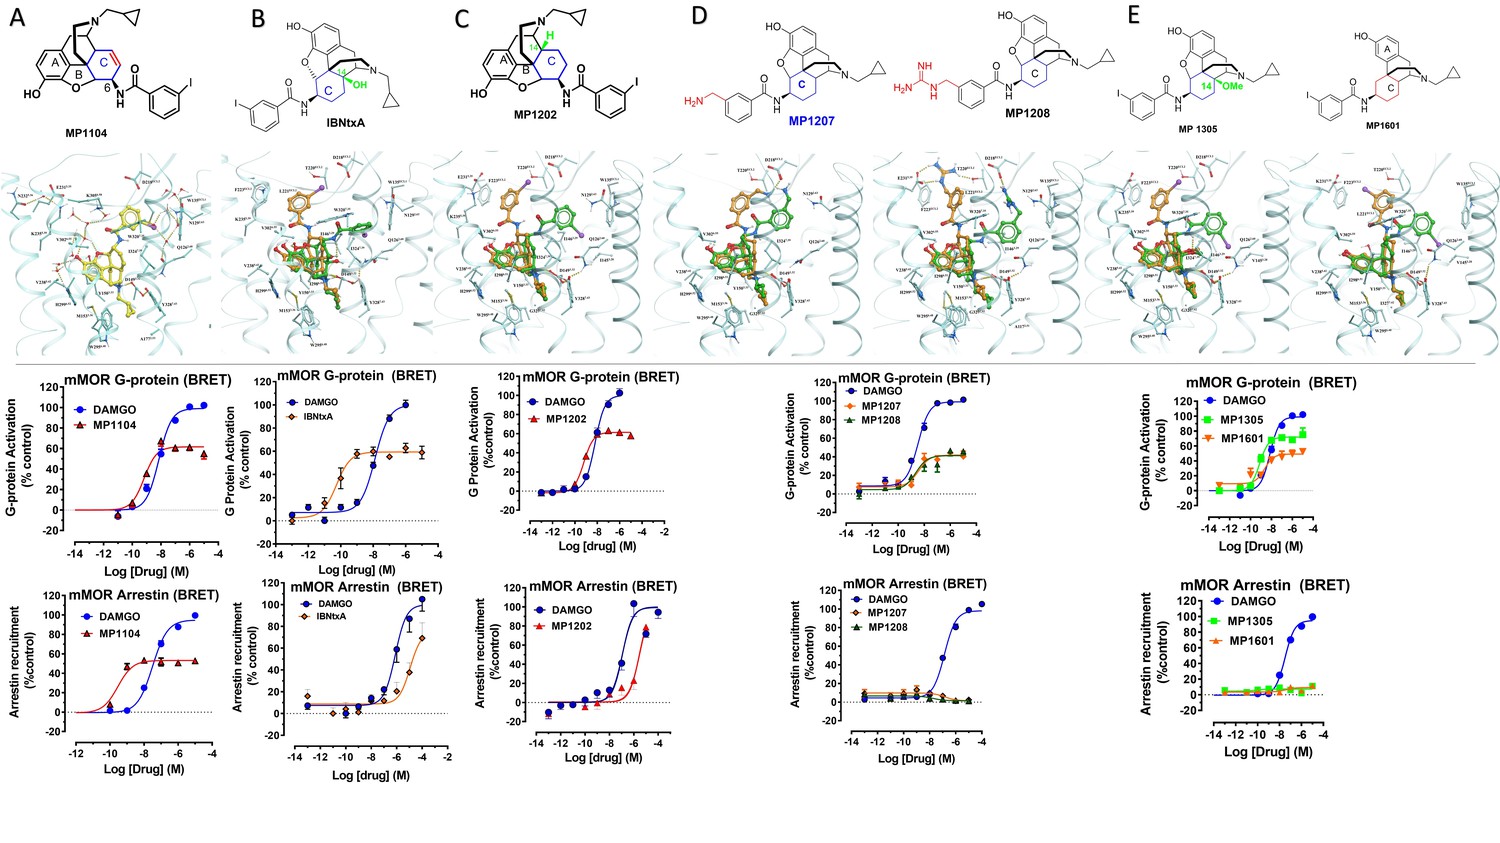
Characterization of ligands (MP1104, IBNtxA, MP1202, MP1207, MP1208, MP1305, and MP1601) at mouse mu opioid receptor (mMOR) using BRET assays-chemical structure, docking in MOR, G protein activity, and arrestin recruitment.
(A) MP1104 targets the TM2-TM3 region and is arrestin-biased at mMOR: The preferred docking pose of MP1104 (boat form, yellow stick) at an active state of MOR is shown. Ring C of MP1104 in boat form forces the iodophenyl moiety to reside in a region between TM2-TM3. MP1104 (red) is a partial agonist in mMOR measuring G protein activation (N = 4) and arrestin recruitment (N = 4) compared to DAMGO (blue) in BRET assays. (B) IBNtxA targets the TM5-ECL2 region while showing reduced arrestin potency at mMOR compared to DAMGO: The docking poses of IBNtxA (chair form, orange stick) at an active state of MOR is shown. The saturated ringC in IBNtxA leads to interaction of the ligand in the ECL2 and TM5 region, which leads to a preference of chair form in our docking studies. At mMOR, it is a partial agonist for G protein signaling (N = 4) compared to DAMGO (blue) while showing reduced arrestin potency compared to DAMGO (N = 4) in BRET assays. (C) MP1202 targets the TM5-ECL2 region and shows reduced arrestin potency at mMOR compared to DAMGO. The preferred docking pose of MP1202 (chair form, orange stick) at an active state of MOR. The saturated ringC in MP1202 leads to interaction of the ligand in the ECL2 and TM5 region. MP1202 (red) is a partial agonist for G-signaling (N = 5) in mMOR and reduced arrestin potency (N = 5) compared to DAMGO (blue) in BRET assays. (D) MP1207 and MP1208 target the TM5-ECL2 region and show no arrestin recruitment at mMOR: Docking results showed that m-aminomethyl (MP1207) or m-guanidinomethyl (MP1208) moieties (replacing an iodo group in MP1202) forced these compounds in chair form preferred confirmation at MOR (chair form in orange stick and boat form in green stick). MP1207 (orange) and MP1208 (green) are partial agonists at mMOR in BRET assays (N = 3) compared to DAMGO (blue). At MOR, chair forms of MP1207 and MP1208 introduce additional interactions between m-amino or m-guanidino group and D218ECL2 and T220ECL2. No arrestin recruitment was observed for both agonists (N = 3). (E) MP1305 and MP1601 target the TM5-ECL2 region and show no arrestin recruitment at mMOR. Chair and boat forms of MP1305 and MP1601 at an active state MOR (in cyan) are shown. Docking modes of MP1305 and MP1601 are analogous and they both maintain chair confirmation at MOR. In BRET assays using mMOR, MP1305 (green) and MP1601 (red) are partial agonists for G-signaling (N = 3) compared to DAMGO (blue) with no measurable arrestin recruitment (N = 3). In summary, targeting TM5-ECL2 and ring C taking chair form leads to reduced arrestin signaling at MOR in both rodents as well as human receptors with analogs. See Appendix 1—table 8 for values, Appendix 1—figure 4 and Appendix 1—table 11 for bias calculations.
Appendix 1—figure 2
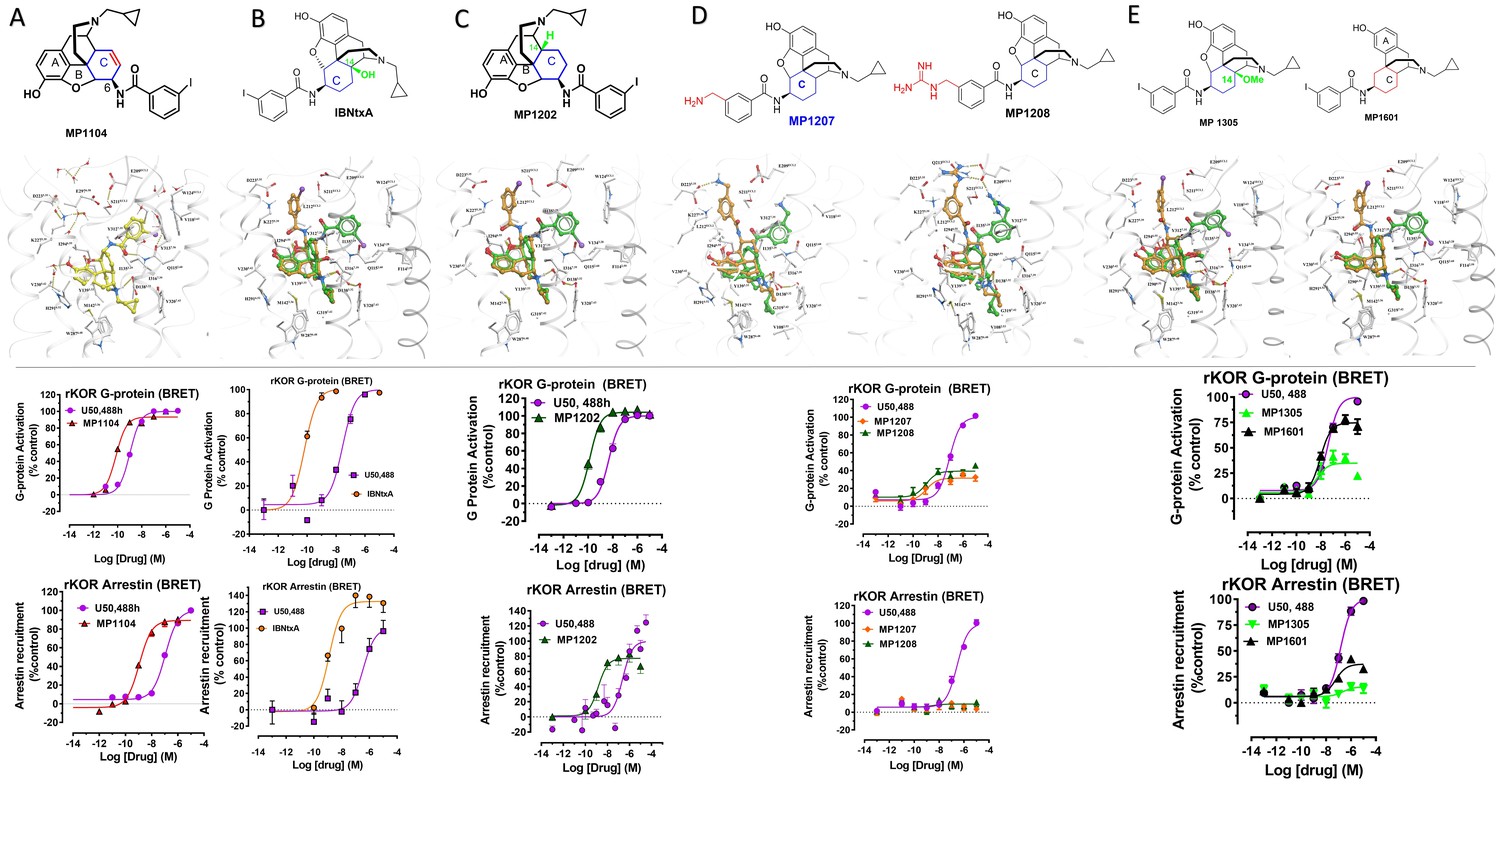
Characterization of ligands (MP1104, IBNtxA, MP1202, MP1207, MP1208, MP1305 and MP1601) at rat kappa opioid receptor (rKOR) using BRET assays-chemical structures, docking in MOR, G protein activity, and arrestin recruitment.
A) MP1104 targets the TM2-TM3 region and is arrestin biased at rKOR: The preferred docking pose of MP1104 (boat form, yellow stick) at an active state of KOR is shown. The iodophenylamido moiety aligns in the hydrophobic pocket between TM2 and TM3 in KOR, a cavity lined with V1182.63, W124ECL1, and L1353.29. In addition, polar residue Q1152.60 adopts a slightly different conformation which allows more room for the hydrophobic moiety. Such increase in hydrophobic nature of the KOR binding pocket may well be associated yielding the best docking scores of MP1104 in its boat conformation. MP1104 (red) is a full agonist in rKOR in BRET assays measuring G protein activation (N = 6) and arrestin recruitment (N = 6) compared to U50,488H (purple). (B) IBNtxA prefers the boat form at KOR and is not biased for any pathway at mKOR: The docking poses of IBNtxA (chair form, orange stick) and (boat form, green stick) at an active state of KOR are shown. At rKOR, the iodophenylamido moiety of IBNtxA aligns in the hydrophobic pocket between TM2 and TM3 in KOR, a cavity lined with V1182.63, W124ECL1 and L1353.29. In BRET assays using rKOR, IBNtxA is a full agonist for G protein (N = 3) as well as Arrestin signaling (N = 3) compared with U50,488H (purple). (C) MP1202 prefers the boat form at KOR and is not biased for any pathway at rKOR. The preferred docking pose of MP1104 (boat form, yellow stick) and MP1202 (chair form, orange stick) at an active state of KOR. The iodophenylamido moiety aligns in the hydrophobic pocket between TM2 and TM3 in KOR, a cavity lined with V1182.63, W124ECL1, and L1353.29. In addition, polar residue Q1152.60 adopts a slightly different conformation allowing more room for the hydrophobic moiety. Such increase in hydrophobic nature of the KOR binding pocket may well be associated yielding the best docking scores of both MP1104, IBNtxA and MP1202 with their boat conformation. MP1202 (green) is a full agonist in rKOR measuring G protein activation (N = 3) and arrestin recruitment (N = 9) compared to U50,488H (purple) in BRET assays. (D) m-Aminomethyl (MP1207) and m-guanidinomethyl (MP1208) analogs prefer the chair conformation and target the TM5-ECL2 region and show no arrestin recruitment at KOR. Docking results showed that m-amino methyl (MP1207) or m-guanidinomethyl (MP1208) moieties (replacing an iodo group in MP1202) forced these compounds in chair form preferred confirmation at KOR (chair form in orange stick and boat form in green stick). Unlike boat MP1202, chair MP1207 at KOR may form a new salt bridge interaction between amino group and D2235.35 and E209A pulling the amidophenyl moiety away from the hydrophobic pocket between TM2 and TM3. Likewise, chair MP1208 forms salt bridge interactions between guanidino group and D2235.35 as well as with E209ECL2. MP1207 (orange) and MP1208 (green) are partial agonists for G-signaling (N = 3) at rKOR in BRET assays compared to U50,488H (purple). No arrestin recruitment was observed for both agonists (N = 5) against U50,488H as a control at rKOR. (E) MP1305 showed no arrestin recruitment and MP1601 was not biased for any pathway at rKOR: Chair and boat forms of MP130) and MP1601 at an active state KOR (in gray) are shown. Both MP1305 (green) and MP1601 (black) are partial agonists for G-signaling (N = 3) at rKOR in BRET assays compared to U50,488H (blue). No arrestin recruitment was observed for MP1305 (N = 6) while MP1601 was a partial agonist for arrestin signaling pathway (N = 6). In summary, targeting TM5-ECL2 and ring C taking chair form leads to preference for G protein pathway at KOR in both rodents as well as human receptors with analogs. See Appendix 1—table 8 for values, Appendix 1—figure 4 and Appendix 1—table 11 for bias calculations.
Appendix 1—figure 3

IBNtxA is arrestin biased at KOR but shows G protein biased agonism at MOR.
(A–B) At hMOR, IBNtxA (orange) is a G protein biased agonist compared with DAMGO (blue) (N = 4). (C–D) At hKOR, IBNtxA (pink) is a full agonist in cAMP inhibition (N = 3) and Tango-arrestin recruitment assays (N = 3) compared to U50,488H (purple). (F–G) However, at mMOR, it is a partial agonist in G-signaling assays (N = 4) and shows reduced arrestin potency (N = 4) compared to DAMGO (blue) in BRET assays. (H–I) In BRET assays using rKOR, IBNtxA is a full agonist in both G-signaling (N = 3) and arrestin signaling assays (N = 3) compared with U50,488H (purple). (E and J) The docking poses of IBNtxA (chair form, orange stick) and (boat form, green stick) at an active state of MOR and KOR are shown. At MOR, the saturated ring C in IBNtxA leads to interaction of the ligand in the ECL2 and TM5 region leading to a preference of chair form shown by a red arrow. At KOR, the iodophenylamido moiety of IBNtxA aligns in the hydrophobic pocket between TM2 and TM3 in KOR, a cavity lined with V1182.63, W124ECL1 and L1353.29 similar to MP1202. This flip of ring C conformation from chair to boat is shown by a blue arrow. Preference for chair form correlates with G protein bias while preference for boat form correlates with increased arrestin signaling or no preference for any pathway. See Appendix 1—table 9 for values, Appendix 1—figure 4 and Appendix 1—tables 10–11 for bias calculations.
Appendix 1—figure 4
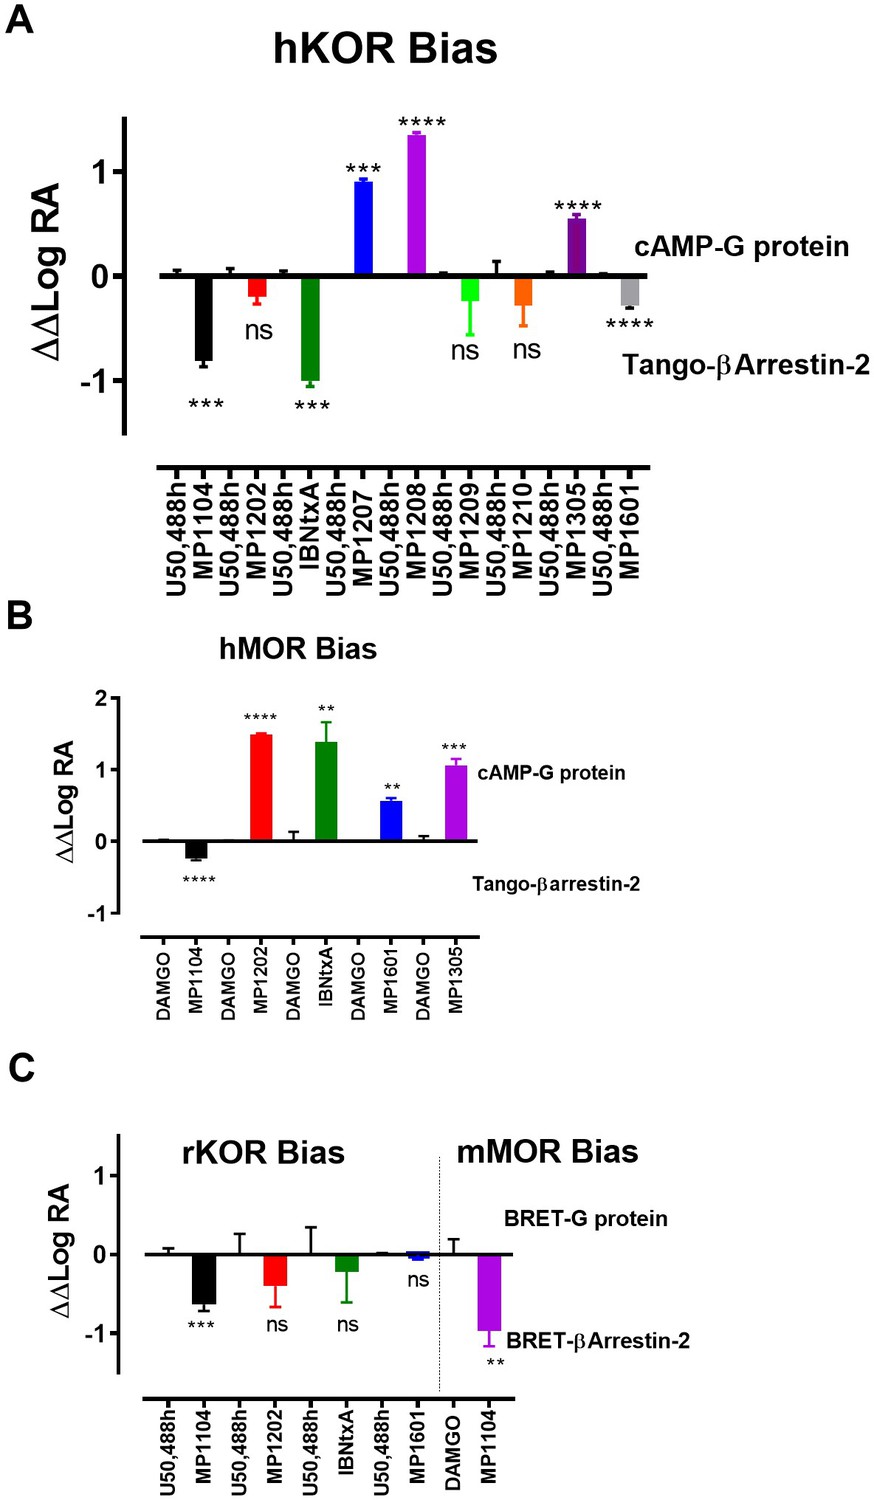
Bias plots for ligands at hKOR (A), hMOR (B) using cAMP and Tango assay and at rKOR /mMOR (C) using BRET assays.
Bias analysis for signaling was performed as described in Materials and methods. Data analyzed against DAMGO and/or U50,488h for each ligand using unpaired t-test with Welch’s correction. At hKOR, MP1104 (**p=0.0015); IBNtxA (***p=0.0002) showed preference for arrestin over G-signaling while MP1209, 1210, 1305 and 1601 showed no preference for any signaling pathway. MP1209 (***p=0.0001) and MP1208 (****p<0.0001) were G-biased. At hMOR, MP1104 (*p=0.0427) preferred arrestin pathway while MP1202 (****p=<0.0001); IBNtxA (**p=0.0089); MP1601 (**p=0.0017) and MP1305 (***p=0.001) were G-biased. At rKOR, MP1104 (***p=0.0002) preferred arrestin pathway while IBNtxA, MP1202, 1601 and 1305 showed no preference for any signaling pathway. At mMOR, MP1104 (**p=0.0021) showed preference for arrestin pathway. To summarize bias factors suggest that in spite of differences in assays and species tested, ligands which engage TM5-ECL2 region of MOR/KOR and where ringC takes chair conformation.
Appendix 1—figure 5

The preferred docking pose of known KOR biased ligand 6′GNTI (chair form, orange stick) at an active state of KOR with the guanidino group engaging a region between TM5 and ECl2.
Note: possible engagement of residues D223 and E209 similar to MP1207 and MP1208 in TM5-ECL2 region.
Appendix 1—figure 6
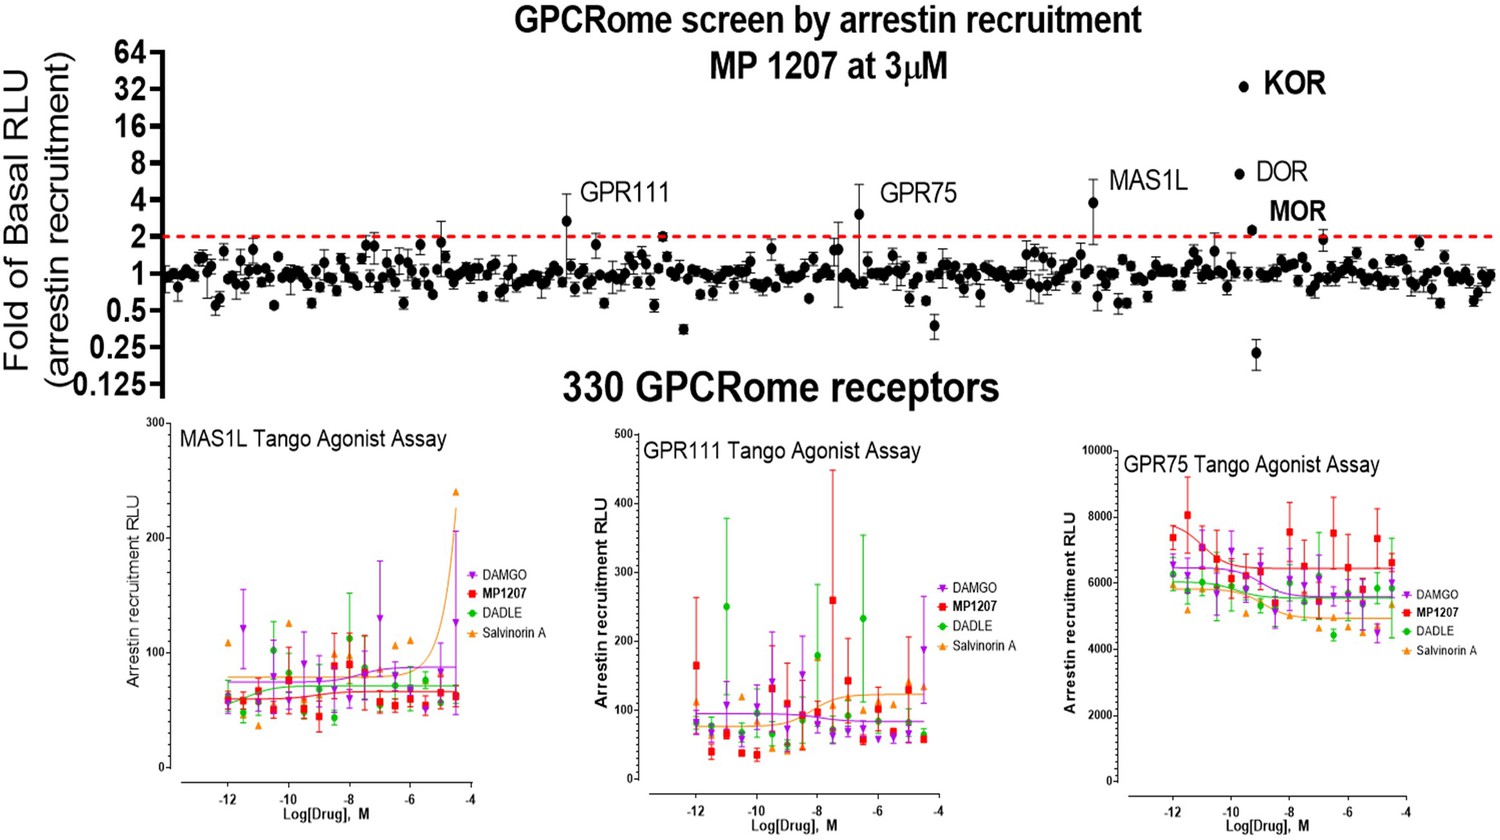
MP1207 is selective for opioid receptors in the GPCRome screen.
MP1207 was screened against 330 non-olfactory GPCRs for agonism in the arrestin recruitment TANGO assay. Each point shows luminescence normalized to basal level at a given GPCR at 3 µM MP1207 dose (>3000 higher dose than the binding affinity at opioid receptors), with vertical lines indicating the standard error of the mean. MP1207 induces an increase in signal twofold over basal at opioid receptors predominantly at KOR and DOR and much less at MOR. Results show selectivity for opioid receptors over non-opioid targets when tested at >10µM and >1500 fold higher than the binding affinity and agonistic potency at opioid receptors. The low signal at MOR is consistent with null arrestin recruitment at MOR. Several potential targets (GPR111, MAS1L, GPR75) did not show dose-dependent increase in signal and probably represent screening false positives.
Appendix 1—figure 7
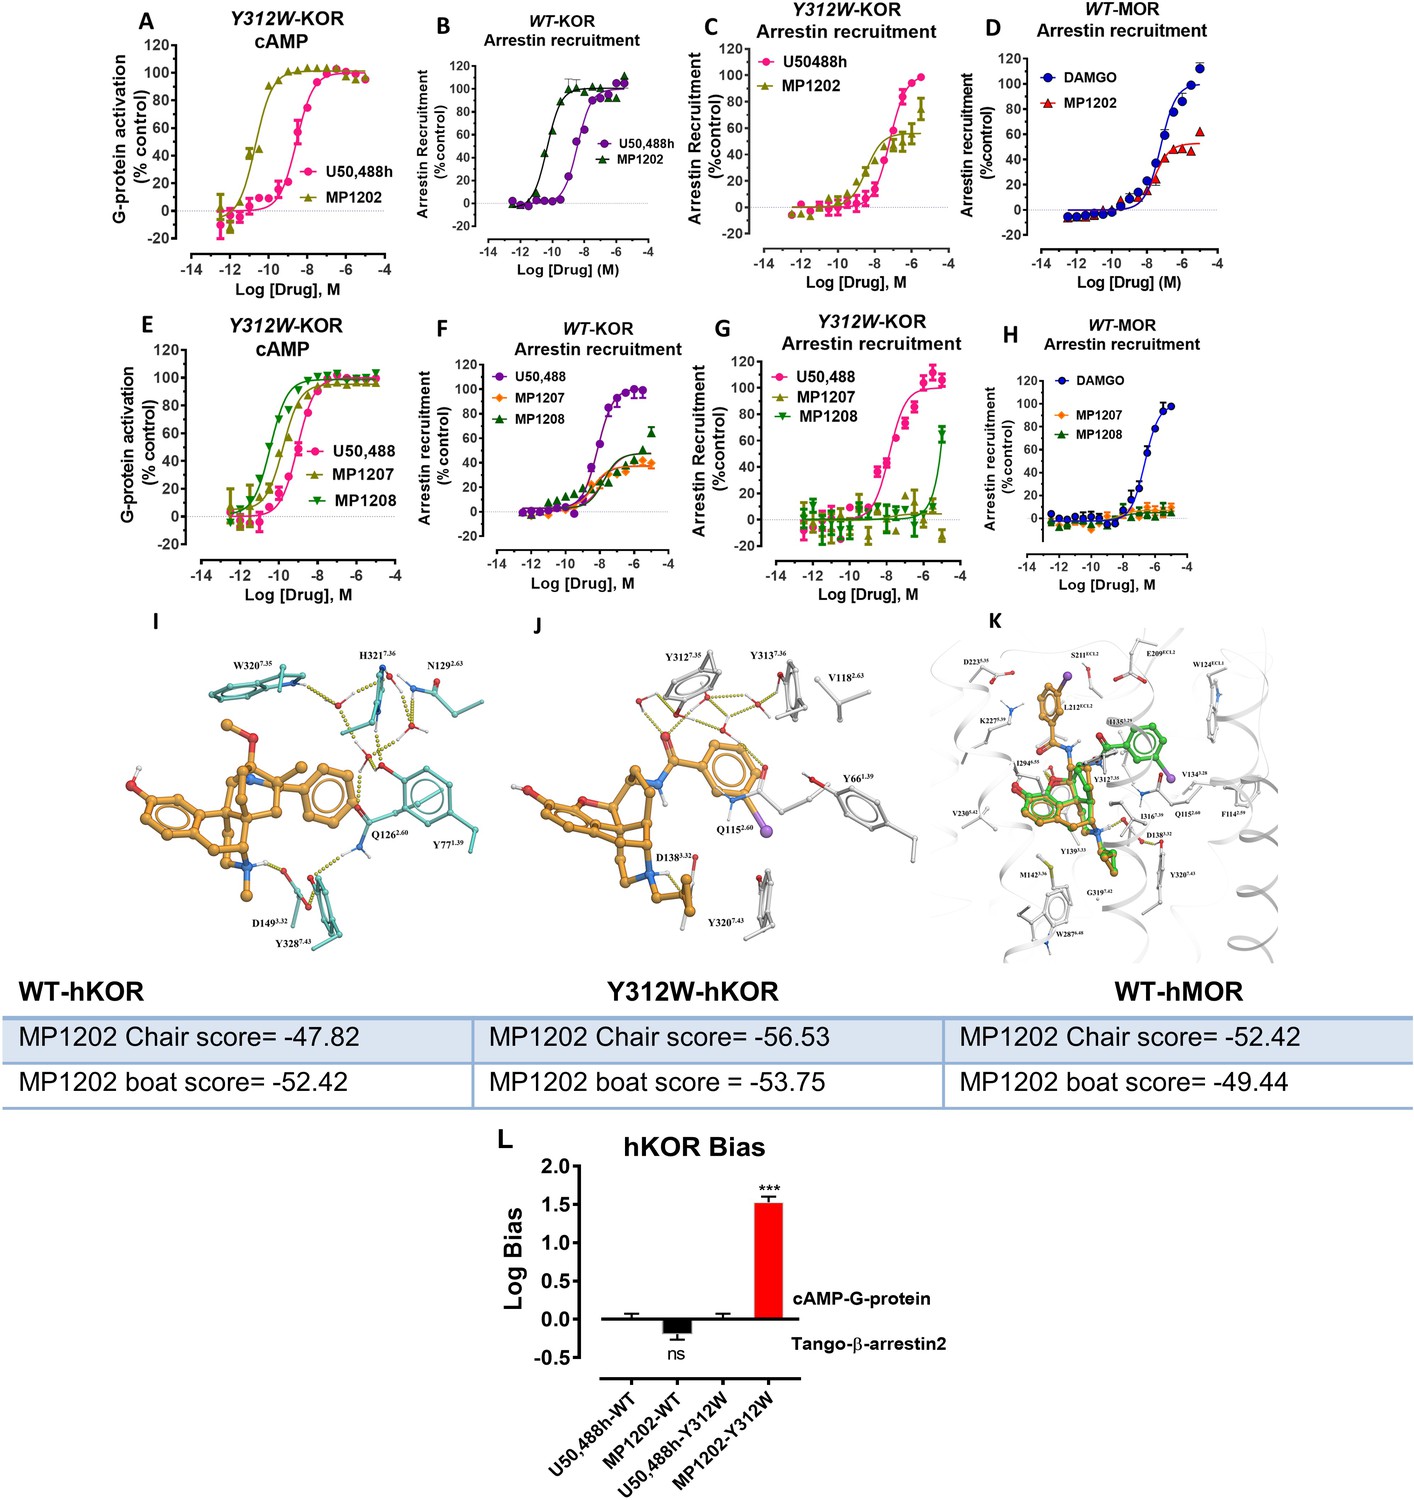
Mutation of KOR Y312W leads to a receptor mimicking MOR arrestin recruitment.
MP1202 flips to a G protein biased agonist and arrestin recruitment for MP1207 and MP1208 is reduced. (A and C) At Y312W-hKOR, MP1202 (light green) is a G-biased agonist in cAMP inhibition (N = 3) (A) and Tango-arrestin recruitment assays (N = 3) (C) compared to U50,488H (pink). (B) At WT-hKOR, MP1202 (purple) acts as a full agonist for arrestin recruitment (N = 3). (D) At WT-hMOR, MP1202 (red) acts as a partial agonist for arrestin recruitment (N = 3). (E and G) At Y312W-hKOR, MP1207 (light green) and 1208 (dark green) show full agonism in cAMP inhibition (N = 3) (E) and reduced arrestin measurement in Tango-arrestin recruitment assays (N = 3) (G) compared to U50,488H (pink). (F) At WT-KOR, MP1207 (orange) and MP1208 (green) act as partial agonists for arrestin recruitment (N = 3) compared to control U50,488H (purple). (H) At WT-MOR, no arrestin recruitment (N = 3) was observed for both agonists MP1207 and MP1208. (I) Conformation of selected residues seen in high resolution active state MOR structure along with crystallographic waters around TM2-TM3 region and crystallized ligand (BU72). MOR, conformation of conserved Q2.60 is maintained by a rather extensive hydrogen-bonding network mediated by W7.35 and at least four tightly bound waters as found in the crystal structure. (J) Conformation of selected residues and MP1202 seen in active state KOR structure, along with modeled waters around TM2-TM3 region. In KOR, no crystallographic waters were resolved in the structure, the non-conserved residues, including Y7.35 instead of W7.35, would rearrange water network and change conformation of Q2.60, paramount for ligand binding. A theoretical water network was modeled using SampleFlood method of ICM Molsoft in the orthosteric ligand site, and resulting waters were optimized via several rounds of extensive conformational sampling. As a result of significant difference observed in the water network, compared to MOR, KOR’s Q1152.60 moves further inwards and is positioned between D1383.32 and Y3127.43, and this new position of Q1152.60 is stabilized via a water-mediated hydrogen bond with Y3127.35. (K) Docking poses of chair and boat conformations of MP1202 in Y312W KOR mutant. The chair form (−56.53) is favored over boat form (−53.75) at this mutant receptor for MP1202. (L) Bias plots for U50,488h and MP1202 at hKOR and Y312W hKOR mutant. MP1202 is not significantly different from U50,488h with respect bias for G over βarrestin-2 signaling at wild type receptor while at the hKOR mutant it shows G-biased signaling. Data are mean± SEM from N = 3 replicates. Data analyzed using unpaired t-test with Welch’s correction,***p=0.0001. See Appendix 1—table 9 for values, Appendix 1—figure 4 and Appendix 1—table 10 for bias calculations.
Appendix 1—figure 8
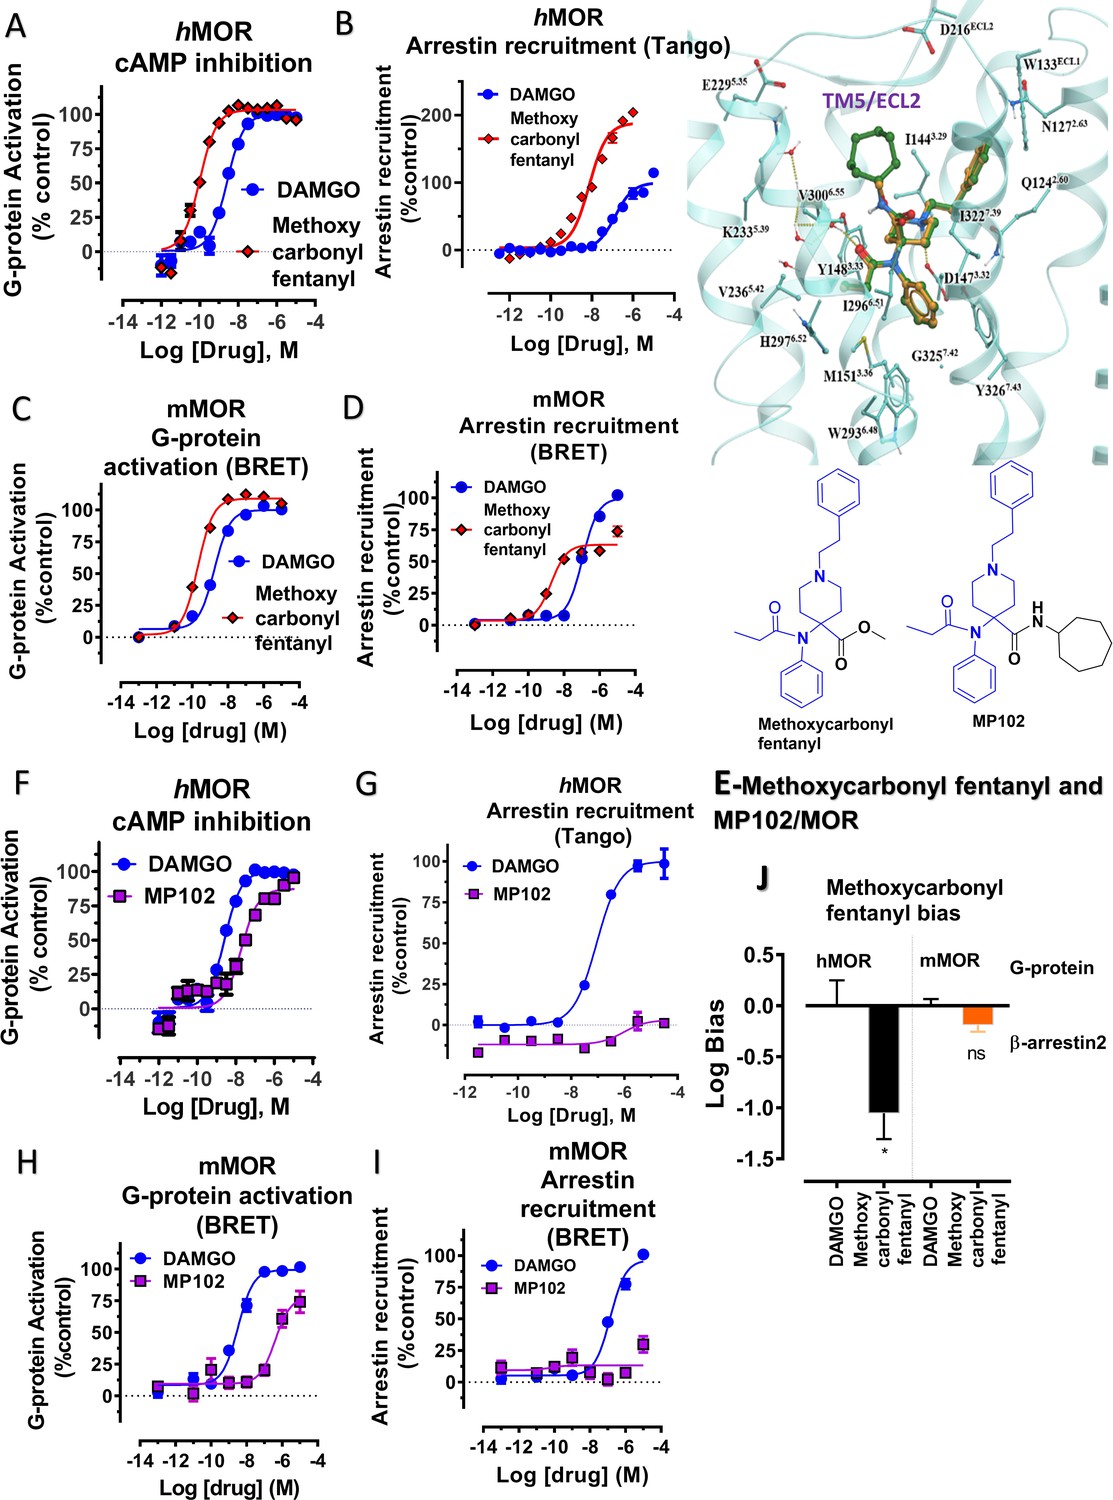
Methoxycarbonyl fentanyl amide analog MP102 targeting TM5 in MOR shows no arrestin recruitment compared to methoxycarbonyl fentanyl at mMOR in BRET assays.
(A-B) Methoxycarbonyl fentanyl (red) is a full agonist at hMOR in cAMP (N = 3) and arrestin recruitment assays (N = 3) compared to DAMGO (blue). (C–D) Methoxycarbonyl fentanyl (red) is a full agonist at mMOR in BRET G protein activation (N = 4) and partial agonist in arrestin recruitment assays (N = 4) compared to DAMGO (blue). (E) Molecular docking of MP102 (green stick) engaging TM5 region and methoxycarbonyl fentanyl (yellow stick) not occupying TM5 region in hMOR. and chemical structures of methoxycarbonyl fentanyl and methoxycarbonyl fentanyl amide, MP102. (F-G) MP102 (purple) is a full agonist at mMOR in cAMP assays (N = 3) and shows no arrestin recruitment assays (N = 3) compared to DAMGO (blue). (H–I) Similarly, MP102 (purple) is a partial agonist at mMOR in BRET G protein activation assays (N = 3) and shows no arrestin recruitment assays (N = 6) compared to DAMGO (blue). (J) Bias plots for DAMGO and methoxycarbonyl fentanyl at hMOR and mMOR. Methoxycarbonyl fentanyl is arrestin biased at hMOR and shows no preference for any pathway at mMOR. Data are mean± SEM from N = 3 replicates and is analyzed using unpaired t-test with Welch’s correction,***p=0.0001. See Appendix 1—tables 7– eight for values, and Appendix 1—table 10 and Appendix 1—table 11 for bias calculations.
Appendix 1—figure 9
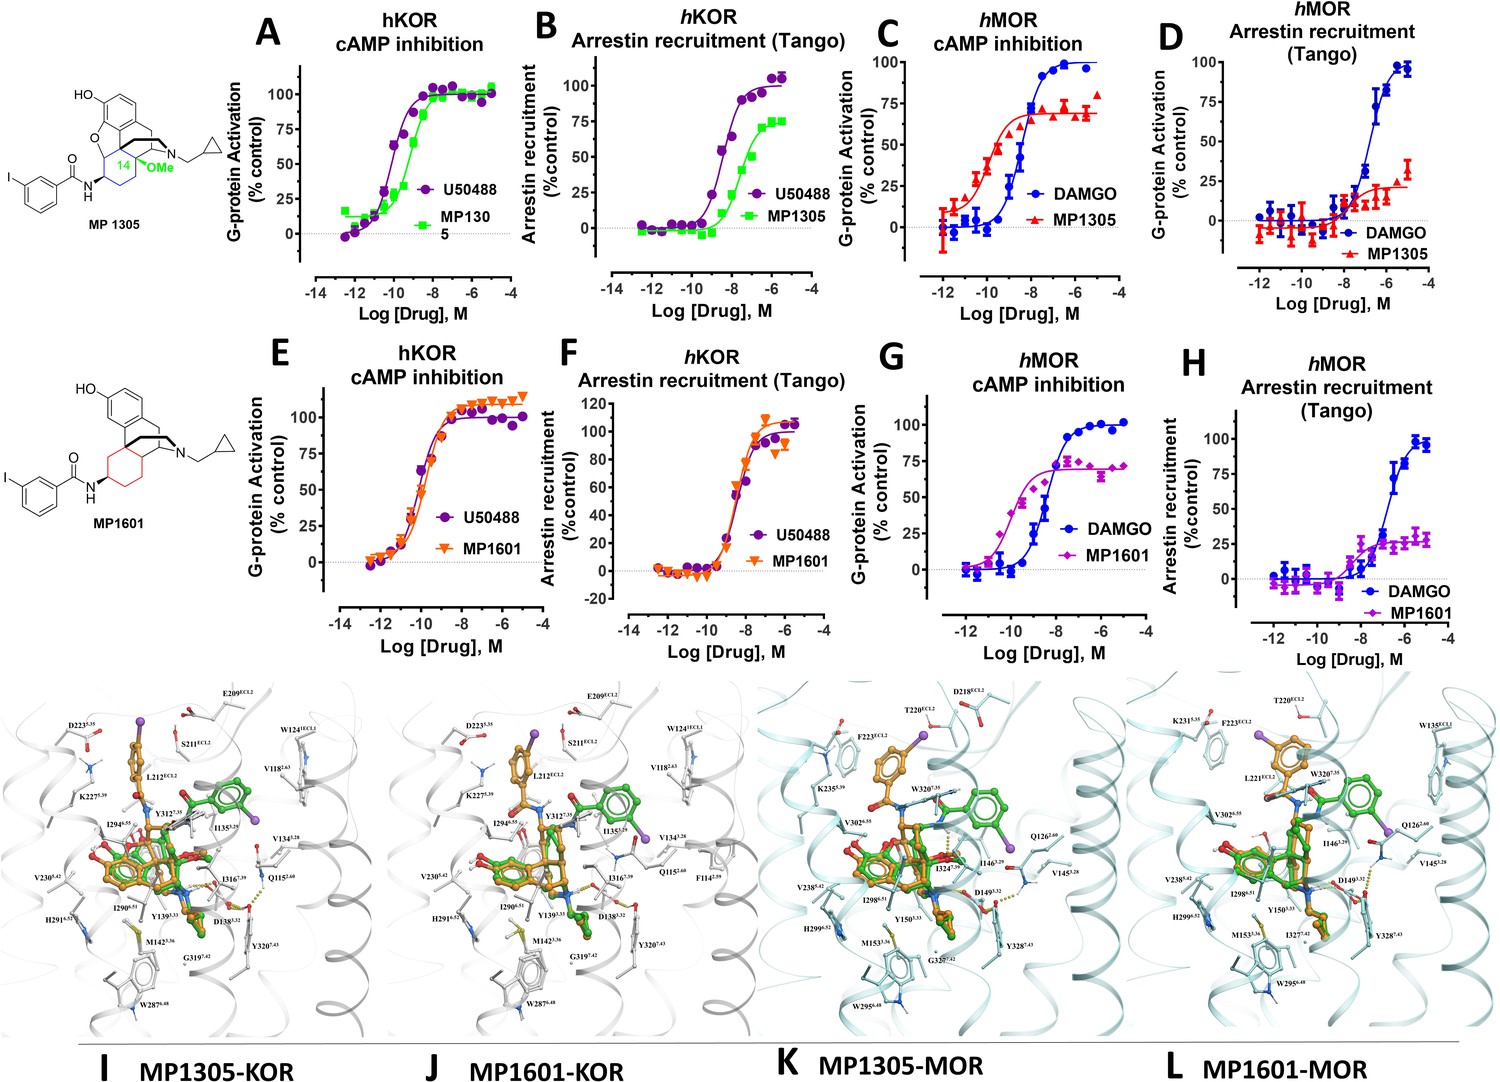
At human receptors, MP1305 is G-biased at MOR and KOR whereas MP1601 is G-biased at MOR and arrestin biased at KOR.
(A-B) MP1305 (green) is a full agonist at hKOR in cAMP inhibition (N = 6) and partial agonist in Tango-arrestin recruitment assays (N = 6) compared to U50,488H (purple) at hKOR. (C–D) MP1305 (red) is a partial agonist at hMOR in cAMP inhibition (N = 3) and partial agonist in Tango-arrestin recruitment assays (N = 3) compared to DAMGO (blue). (E–F) MP1601 (orange) is a full agonist at hKOR in cAMP inhibition (N = 6) and Tango-arrestin recruitment assays (N = 6) compared to U50,488H (purple). (G–H) Similarly, MP1601 (purple) is a partial agonist at hMOR in cAMP inhibition (N = 3) and Tango-arrestin recruitment assays (N = 3) compared to DAMGO (blue). (I–J) Molecular docking of MP1305 and MP1601 with a chair (orange stick) or a boat confirmation (green stick) at hKOR and hMOR. (K–L) Chair and boat forms of MP1305 and MP1601 at an active state hKOR (in gray) and Chair and boat forms of MP1305 and MP1601 at an active state hMOR (in cyan). Preferred docking modes of MP1305 and MP1601 are analogous and they both maintain chair confirmation at hMOR and are biased toward G protein, while being balanced agonists at hKOR taking boat conformation. See Appendix 1—table 9 for values, Appendix 1—figures 4 and Appendix 1—table 10 for bias calculations.
Appendix 1—figure 10
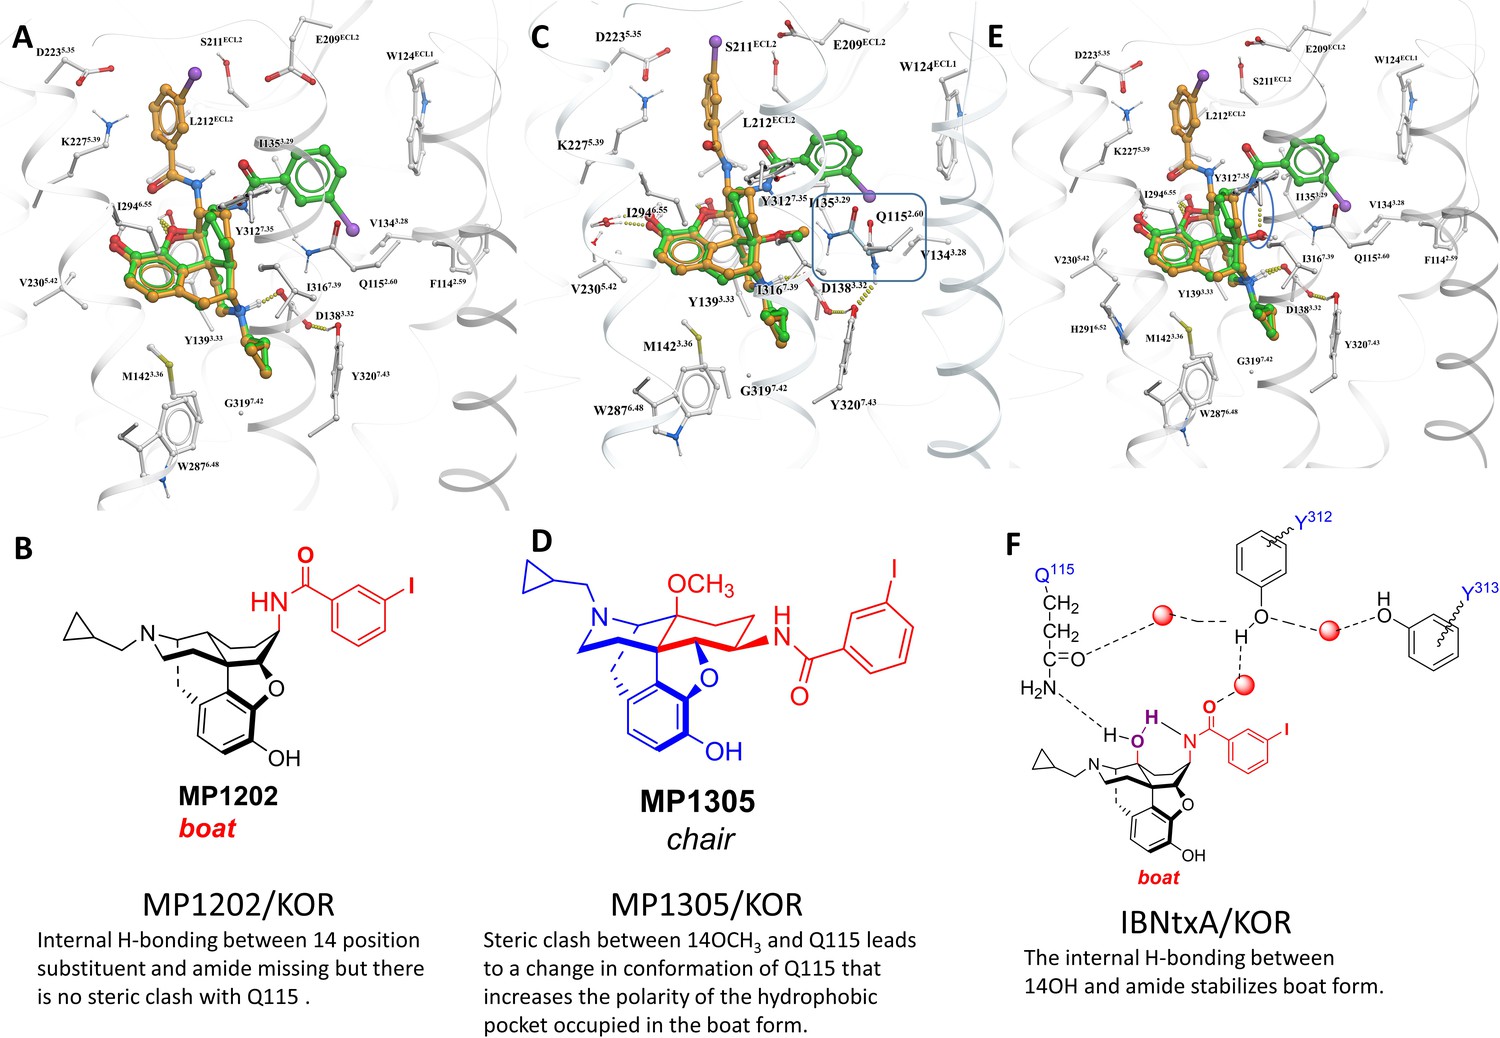
MP1305 is G protein biased at KOR.
Docking pose for ligands inside active state KOR shown in white carbon sticks and white ribbon representations. (A–B) MP1202 in KOR favors boat conformation. (C–D) MP1305 in KOR favors chair conformation. 14th-position-Methoxy of MP1305 causes sidechain of Q1152.60 residue to undergo a conformational change, when compared to ligands with non-Methoxy substitutions at 14th-position (shown in cyan colored carbon sticks representation). (E) IBNtxA in KOR favors boat conformation. (F) Stabilization of IBNtxA in boat form through internal hydrogen-bonding between 14-OH and amide and with Q1152.60 is shown. The docked and energy minimized pose of MP1305 shows the substitution of 14-OH with larger methoxy group displaces the conserved Q1152.60 of KOR. In ligands with 14-OH, the Q1152.60 residue of KOR is directed toward the ligand and forms hydrogen bonds with the 14-OH. In the case of MP1305, the methoxy group pushes Q1152.60 residue away to avoid steric clashes, and the polar terminus of the side chain ends up in the previously hydrophobic TM2-TM3 sub-pocket of KOR. Furthermore, due to internal ligand sterics, the internal hydrogen bond between the amide and 14-OH, as seen in compounds such as IBNtxA, is not possible for MP1305. The combination of these two factors, increasing polarity of the hydrophobic TM2-TM3 sub-pocket (an effect similar to Y312W6.35 KOR sub-pocket mutation- and lack of an internal hydrogen bond stabilizing the boat form, shifts the equilibrium toward the chair form for MP1305).
Appendix 1—figure 11
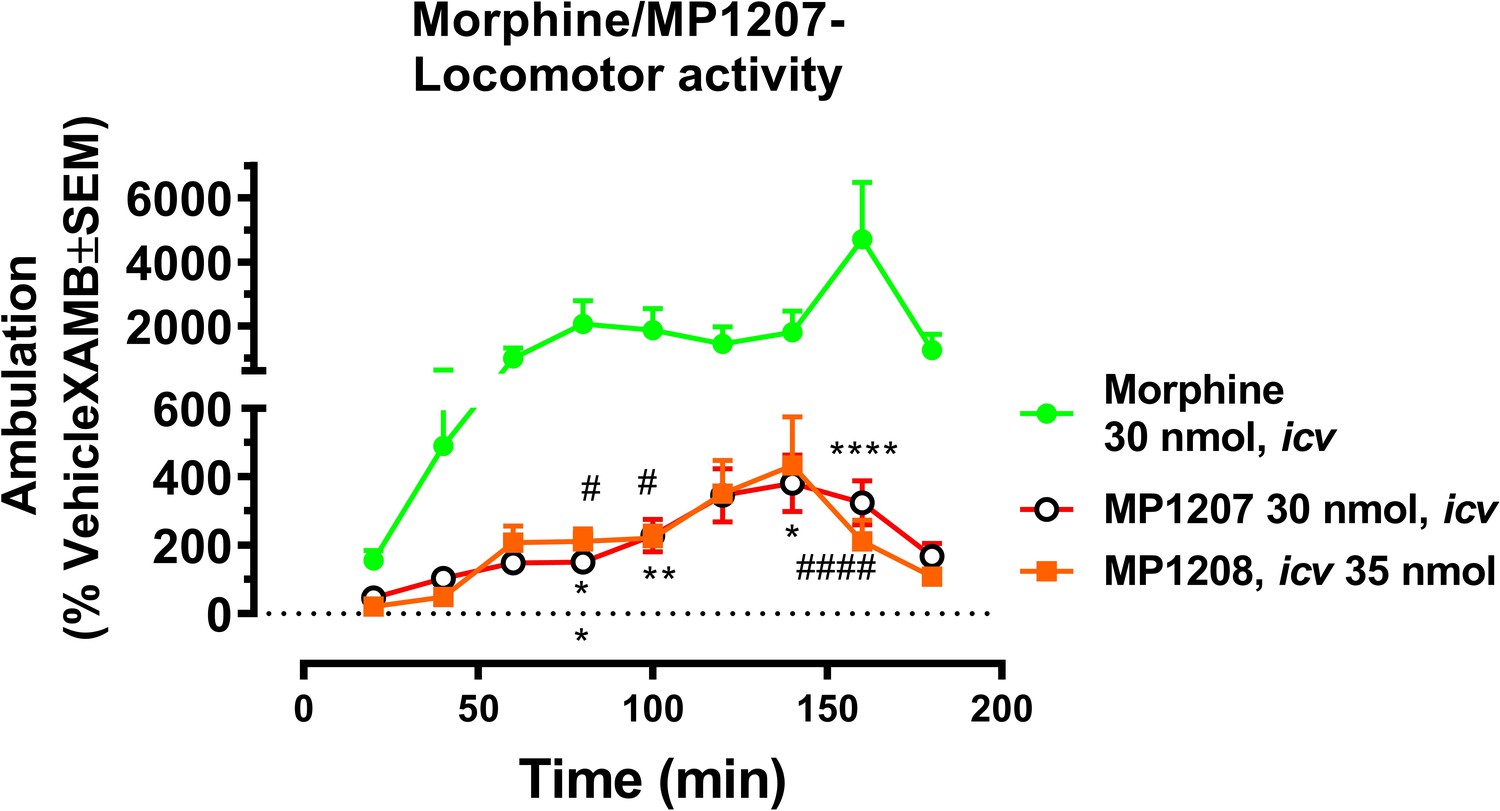
MP1207 and 1208 show significantly less hyperlocomotion compared to morphine.
Mice were administered icv either morphine (30 nmol; n = 18), MP1207 (30 nmol; n = 26) or MP1208 (35 nmol; n = 10) and the ambulation of each group of mice monitored using the CLAMS/Oxymax system. Morphine (30 nmol, icv) significantly increased forward ambulation in comparsion to MP1207 at 80 min (**p=0.002), 100 min (**p=0.01), 140 min (*p=0.03), and 160 min (****p<0.0001) as determined by two-way ANOVA followed by Dunnett’s multiple-comparison test. Similarly, significant morphine-induced increases in ambulation as compared to the response of MP1208 were observed at 80 min (#p=0.0249), 100 min (#p=0.0497), and 160 min (####p<0.0001) as determined by two-way ANOVA followed by Dunnett’s multiple-comparison test.
Appendix 1—scheme 1
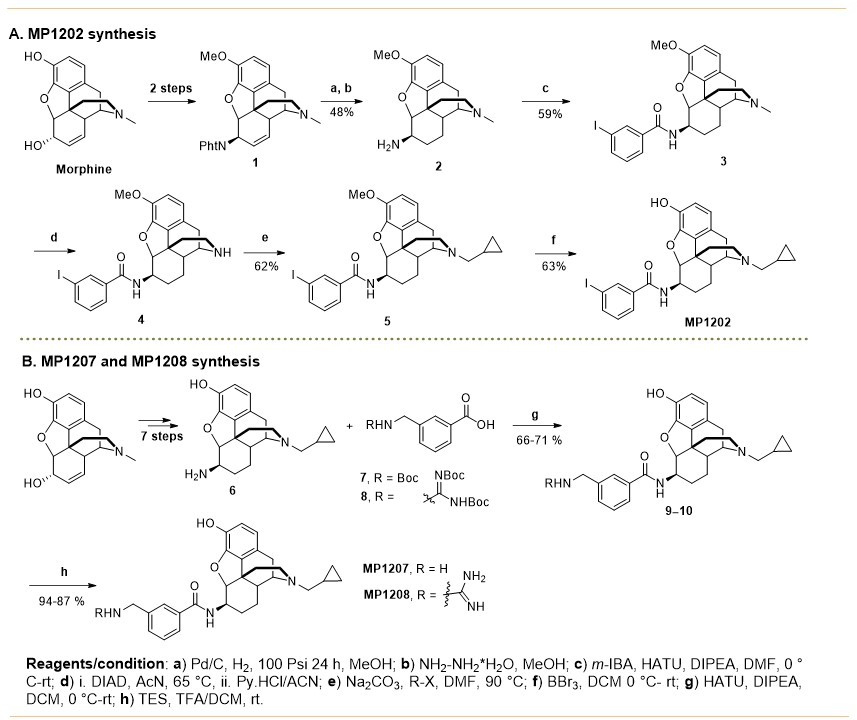
Synthesis of m-arylamido dihydromorphinans MP1202 (A), MP1207, MP1208 (B).
Appendix 1—scheme 2
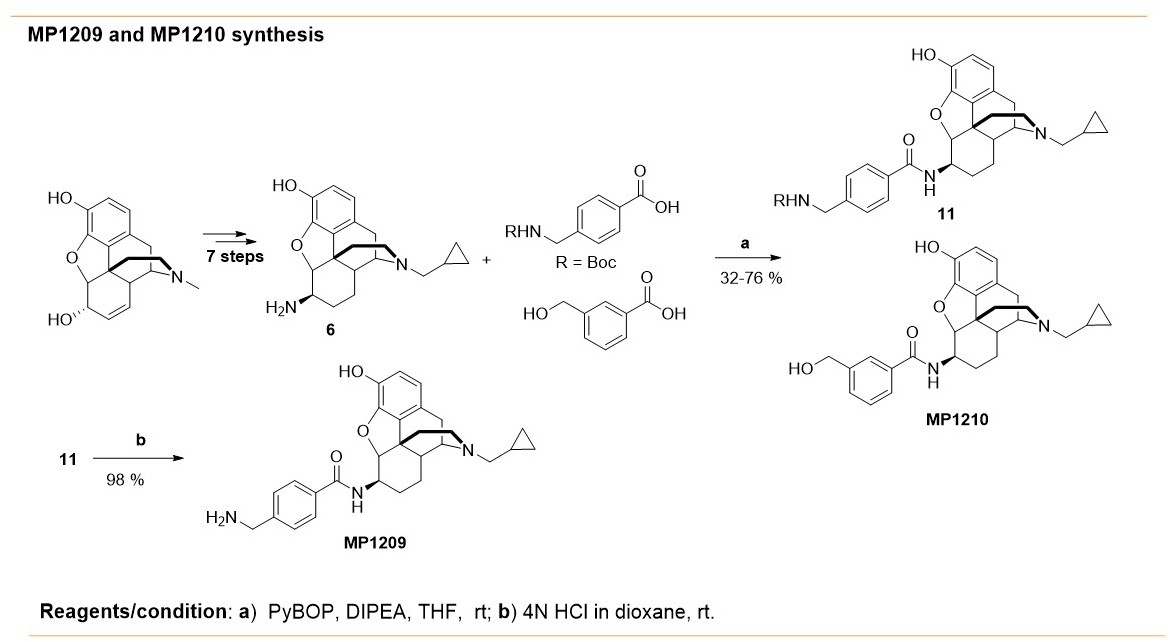
Synthesis of m-arylamido dihydromorphinans MP1210 and p-arylamido dihydromorphinan analog, MP1209.
Appendix 1—scheme 3
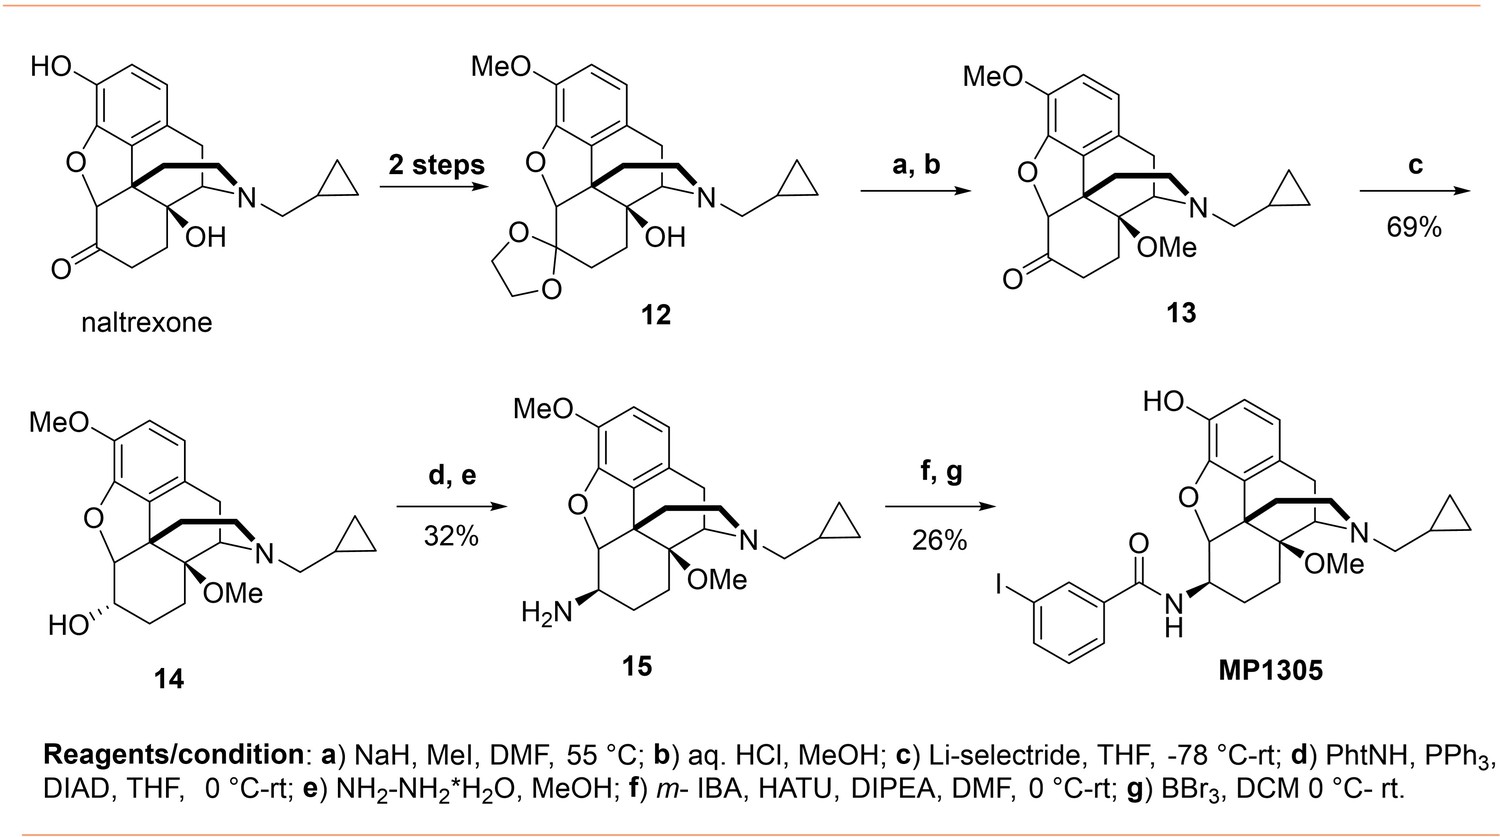
Synthesis of 14-O-methyl m-iodoarylamidomorphinan MP1305.
Appendix 1—scheme 4
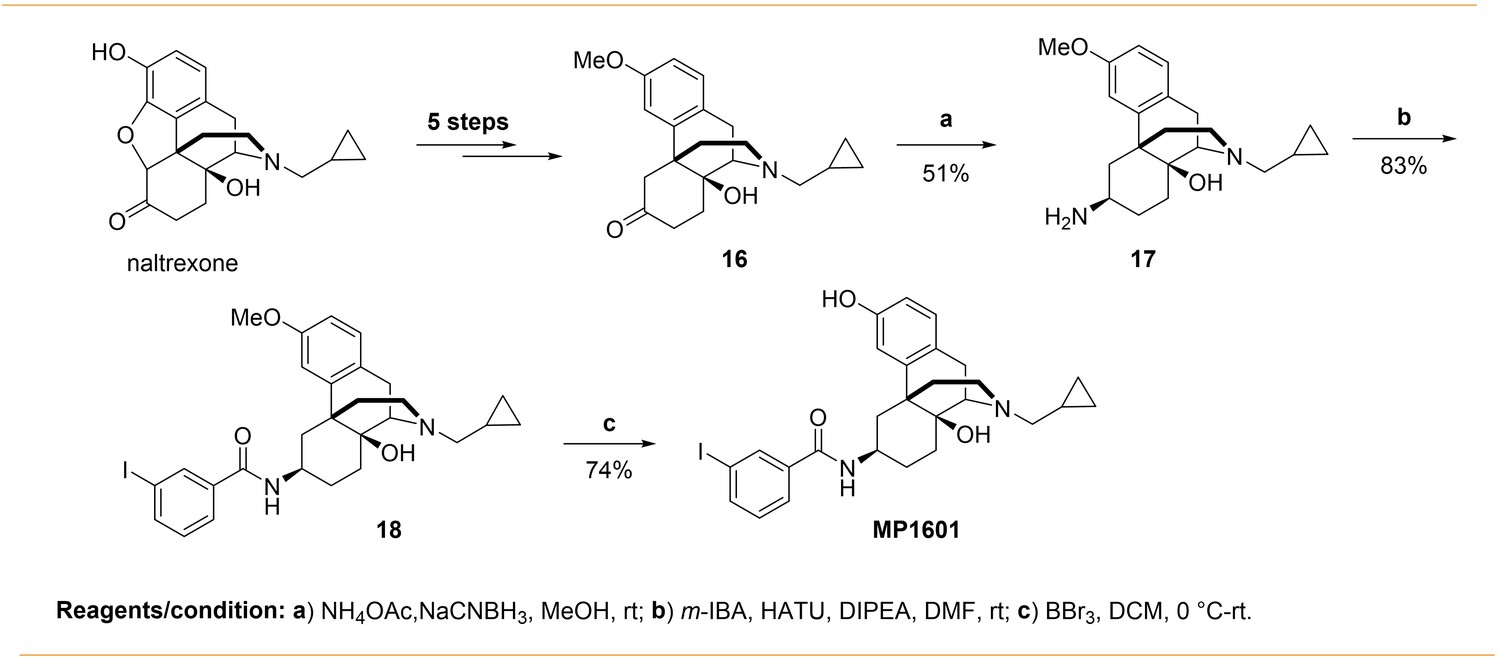
Synthesis of m-iodoarylamido-4,5-deoxymorphinan MP1601.
Data availability
All data generated or analysed during this study are included in the manuscript and supporting files.
References
-
Optimization of the additive CHARMM all-atom protein force field targeting improved sampling of the backbone φ, ψ and side-chain χ(1) and χ(2) dihedral anglesJournal of Chemical Theory and Computation 8:3257–3273.https://doi.org/10.1021/ct300400x
-
Operational models of pharmacological agonismProceedings of the Royal Society of London. Series B, Biological Sciences 220:141–162.https://doi.org/10.1098/rspb.1983.0093
-
Multifunctional opioid receptor agonism and antagonism by a novel macrocyclic tetrapeptide prevents reinstatement of morphine‐seeking behaviourBritish Journal of Pharmacology 177:4209–4222.https://doi.org/10.1111/bph.15165
-
P-glycoprotein is a major determinant of norbuprenorphine brain exposure and antinociceptionJournal of Pharmacology and Experimental Therapeutics 343:53–61.https://doi.org/10.1124/jpet.112.193433
-
Nanobody-enabled monitoring of kappa opioid receptor statesNature Communications 11:1145.https://doi.org/10.1038/s41467-020-14889-7
-
β-Arrestin 2 dependence of δ opioid receptor agonists is correlated with alcohol intakeBritish Journal of Pharmacology 173:332–343.https://doi.org/10.1111/bph.13374
-
Opiate receptor binding properties of morphine-, dihydromorphine-, and codeine 6-O-sulfate ester congenersBioorganic & Medicinal Chemistry Letters 16:4291–4295.https://doi.org/10.1016/j.bmcl.2006.05.060
-
Comparison of the respiratory effects of intravenous buprenorphine and fentanyl in humans and ratsBritish Journal of Anaesthesia 94:825–834.https://doi.org/10.1093/bja/aei145
-
A G protein-biased ligand at the μ-opioid receptor is potently analgesic with reduced gastrointestinal and respiratory dysfunction compared with morphineJournal of Pharmacology and Experimental Therapeutics 344:708–717.https://doi.org/10.1124/jpet.112.201616
-
The kappa opioid agonist U-50,488H antagonizes respiratory effects of mu opioid receptor agonists in conscious ratsThe Journal of Pharmacology and Experimental Therapeutics 264:631–637.https://doi.org/10.21236/ada263043
-
Synthesis and pharmacology of a novel μ-δ opioid receptor Heteromer-Selective agonist based on the carfentanyl templateJournal of Medicinal Chemistry 63:13618–13637.https://doi.org/10.1021/acs.jmedchem.0c00901
-
Critical assessment of G Protein-Biased agonism at the μ-Opioid receptorTrends in Pharmacological Sciences 41:947–959.https://doi.org/10.1016/j.tips.2020.09.009
-
A practical guide to approaching biased agonism at G protein coupled receptorsFrontiers in Neuroscience 11:17.https://doi.org/10.3389/fnins.2017.00017
-
Pharmacological effects produced by intracerebral injection of drugs in the conscious mouseBritish Journal of Pharmacology and Chemotherapy 12:12–15.https://doi.org/10.1111/j.1476-5381.1957.tb01354.x
-
The novel μ-opioid receptor agonist PZM21 depresses respiration and induces tolerance to antinociceptionBritish Journal of Pharmacology 175:2653–2661.https://doi.org/10.1111/bph.14224
-
Comparison of pharmacological activities of buprenorphine and norbuprenorphine: norbuprenorphine is a potent opioid agonistThe Journal of Pharmacology and Experimental Therapeutics 297:688–695.
-
Stereochemical studies on medicinal agents. 23. synthesis and biological evaluation of 6-amino derivatives of naloxone and naltrexoneJournal of Medicinal Chemistry 20:1100–1102.https://doi.org/10.1021/jm00218a023
-
A simple method for quantifying functional selectivity and agonist BiasACS Chemical Neuroscience 3:193–203.https://doi.org/10.1021/cn200111m
-
CHARMM-GUI ligand reader and modeler for CHARMM force field generation of small moleculesJournal of Computational Chemistry 38:1879–1886.https://doi.org/10.1002/jcc.24829
-
Morphine-induced respiratory depression is independent of β-arrestin2 signallingBritish Journal of Pharmacology 177:2923–2931.https://doi.org/10.1111/bph.15004
-
Common anionic receptor site hypothesis: its relevance to the antagonist action of naloxoneJournal of Medicinal Chemistry 25:116–120.https://doi.org/10.1021/jm00344a005
-
PRESTO-Tango as an open-source resource for interrogation of the druggable human GPCRomeNature Structural & Molecular Biology 22:362–369.https://doi.org/10.1038/nsmb.3014
-
Synthetic and receptor signaling explorations of the Mitragyna alkaloids: mitragynine as an atypical molecular framework for opioid receptor modulatorsJournal of the American Chemical Society 138:6754–6764.https://doi.org/10.1021/jacs.6b00360
-
Functional characterization of a novel opioid, PZM21, and its effects on the behavioural responses to morphineBritish Journal of Pharmacology 176:4434–4445.https://doi.org/10.1111/bph.14805
-
Opioid receptors: toward separation of analgesic from undesirable effectsTrends in Biochemical Sciences 38:275–282.https://doi.org/10.1016/j.tibs.2013.03.003
-
CHARMM-GUI input generator for NAMD, GROMACS, AMBER, OpenMM, and CHARMM/OpenMM simulations using the CHARMM36 additive force fieldJournal of Chemical Theory and Computation 12:405–413.https://doi.org/10.1021/acs.jctc.5b00935
-
Transient mammalian cell transfection with polyethylenimine (PEI)Methods in Enzymology 529:227–240.https://doi.org/10.1016/B978-0-12-418687-3.00018-5
-
Protein measurement with the folin phenol reagentThe Journal of Biological Chemistry 193:265–275.
-
Fulfilling the promise of "Biased" G Protein-Coupled Receptor AgonismMolecular Pharmacology 88:579–588.https://doi.org/10.1124/mol.115.099630
-
Generation of novel radiolabeled opiates through site-selective iodinationBioorganic & Medicinal Chemistry Letters 21:4001–4004.https://doi.org/10.1016/j.bmcl.2011.05.008
-
Structure-inspired design of β-arrestin-biased ligands for aminergic GPCRsNature Chemical Biology 14:126–134.https://doi.org/10.1038/nchembio.2527
-
Estimates of pain prevalence and severity in adults: united states, 2012The Journal of Pain 16:769–780.https://doi.org/10.1016/j.jpain.2015.05.002
-
mu-Opposing actions of the kappa-opioid receptorTrends in Pharmacological Sciences 19:94–98.https://doi.org/10.1016/S0165-6147(98)01169-9
-
Mild, Pd-catalyzed stannylation of radioiodination targetsBioorganic & Medicinal Chemistry Letters 25:1761–1764.https://doi.org/10.1016/j.bmcl.2015.02.055
-
Ligand-directed signalling within the opioid receptor familyBritish Journal of Pharmacology 167:960–969.https://doi.org/10.1111/j.1476-5381.2012.02075.x
-
Morphine side effects in beta-arrestin 2 knockout miceThe Journal of Pharmacology and Experimental Therapeutics 314:1195–1201.https://doi.org/10.1124/jpet.105.087254
-
6'-Guanidinonaltrindole (6'-GNTI) is a G protein-biased κ-opioid receptor agonist that inhibits arrestin recruitmentJournal of Biological Chemistry 287:27050–27054.https://doi.org/10.1074/jbc.C112.387332
-
Solid phase synthesis of guanidinesTetrahedron 53:6697–6705.https://doi.org/10.1016/S0040-4020(97)00225-1
-
Functional selectivity of 6'-guanidinonaltrindole (6'-GNTI) at κ-opioid receptors in striatal neuronsJournal of Biological Chemistry 288:22387–22398.https://doi.org/10.1074/jbc.M113.476234
-
Selective κ receptor partial agonist HS666 produces potent antinociception without inducing aversion after i.c.v. administration in miceBritish Journal of Pharmacology 174:2444–2456.https://doi.org/10.1111/bph.13854
-
A novel approach to the synthesis of morphine alkaloids: the synthesis of (d,l)-thebainone-AJournal of the American Chemical Society 114:5959–5966.https://doi.org/10.1021/ja00041a008
-
Novel 6β-acylaminomorphinans with analgesic activityEuropean Journal of Medicinal Chemistry 69:786–789.https://doi.org/10.1016/j.ejmech.2013.09.031
-
Synthesis of carfentanil amide opioids using the ugi multicomponent reactionACS Chemical Neuroscience 6:1570–1577.https://doi.org/10.1021/acschemneuro.5b00137
-
The G Protein–Biased κ -Opioid Receptor Agonist RB-64 Is Analgesic with a Unique Spectrum of Activities In VivoJournal of Pharmacology and Experimental Therapeutics 352:98–109.https://doi.org/10.1124/jpet.114.216820
-
Abuse liability of mitragynine assessed with a self-administration procedure in ratsPsychopharmacology 235:2823–2829.https://doi.org/10.1007/s00213-018-4974-9
-
Synthesis and pharmacological evaluation of 6,7-indolo/thiazolo-morphinans--further SAR of levorphanolJournal of Medicinal Chemistry 50:2747–2751.https://doi.org/10.1021/jm0701674
Article and author information
Author details
Abdelfattah Faouzi

Jonathan A Javitch
Funding
National Institute on Drug Abuse (DA045884)
- Susruta Majumdar
National Institute on Drug Abuse (DA046487)
- Susruta Majumdar
National Institute on Alcohol Abuse and Alcoholism (AA026949)
- Susruta Majumdar
National Institute on Drug Abuse (DA038858)
- Vsevolod Katritch
National Institute on Drug Abuse (DA035764)
- Bryan L Roth
- Vsevolod Katritch
National Institute on Drug Abuse (DA007242)
- Ying Xian Pan
- Gavril W Pasternak
National Institute on Drug Abuse (DA042888)
- Ying Xian Pan
National Institute of Mental Health (MH018870)
- Steven G Grinnell
National Institute of Mental Health (MH112205)
- Jonathan A Javitch
National Institute on Drug Abuse (DA045657)
- Jonathan A Javitch
National Institute on Drug Abuse (DA006241)
- Ying Xian Pan
- Gavril W Pasternak
National Institute on Drug Abuse (DA046714)
- Ying Xian Pan
National Institutes of Health (W81XWH-17-1-0256)
- Susruta Majumdar
St. Louis College of Pharmacy and Washington University
- Susruta Majumdar
National Institute on Drug Abuse (MH54137)
- Jonathan A Javitch
Hope for Depression Research Foundation
- Jonathan A Javitch
National Institute of Mental Health
- Bryan L Roth
University of Florida Foundation
- Jay P McLaughlin
The funders had no role in study design, data collection and interpretation, or the decision to submit the work for publication.
Acknowledgements
SM is supported by funds from NIH grants DA045884, DA046487, AA026949 and W81XWH-17-1-0256 (Office of the Assistant Secretary of Defense for Health Affairs through the Peer Reviewed Medical Research Program) and start-up funds from Center for Clinical Pharmacology, St. Louis College of Pharmacy and Washington University to SM. This research was funded in part through the NIH/NCI Cancer Center Support Grant P30 CA008748 to MSKCC. Studies were also supported by NIDA grants R33DA038858 (VK) and P01DA035764 (VK and BLR), DA042888 and DA046714 (YXP) and DA007242 and DA006241 (GWP/YXP). T32 MH018870 (SGG), MH54137 and the Hope for Depression Research Foundation (JAJ). This work was also supported by NIH grants (R37DA045657 and RO1MH112205), the NIMH Psychoactive Drug Screening Program Contract, and the Michael Hooker Distinguished Chair of Pharmacology (to B.L.R.) and funds from the University of Florida (J.P.M.).
Ethics
Animal experimentation: All animal studies were preapproved by the Institutional Animal Care and Use Committees of University of Florida in accordance with the 2002 National Institutes of Health Guide for the Care and Use of Laboratory Animals. protocols 201808990 and 202011105.
Copyright
© 2021, Uprety et al.
This article is distributed under the terms of the Creative Commons Attribution License, which permits unrestricted use and redistribution provided that the original author and source are credited.
Metrics
-
- 6,307
- views
-
- 881
- downloads
-
- 65
- citations
Views, downloads and citations are aggregated across all versions of this paper published by eLife.
Citations by DOI
-
- 65
- citations for umbrella DOI https://doi.org/10.7554/eLife.56519
Download links
A two-part list of links to download the article, or parts of the article, in various formats.
Downloads (link to download the article as PDF)
Open citations (links to open the citations from this article in various online reference manager services)
Cite this article (links to download the citations from this article in formats compatible with various reference manager tools)
Controlling opioid receptor functional selectivity by targeting distinct subpockets of the orthosteric site
eLife 10:e56519.
https://doi.org/10.7554/eLife.56519


