Controlling opioid receptor functional selectivity by targeting distinct subpockets of the orthosteric site
- Department of Neurology and Molecular Pharmacology, Memorial Sloan Kettering Cancer Center, United States
- Department of Pharmacology, University of North Carolina, United States
- Center for Clinical Pharmacology, St. Louis College of Pharmacy and Washington University School of Medicine, United States
- Department of Anesthesiology, Washington University in St. Louis School of Medicine, United States
- Department of Quantitative and Computational Biology, Department of Chemistry, Bridge Institute, Michelson Center for Convergent Bioscience, University of Southern California, United States
- Division of Molecular Therapeutics, New York State Psychiatric Institute and Departments of Psychiatry, Pharmacology, Columbia University Vagelos College of Physicians & Surgeons, United States
- Department of Pharmacodynamics, University of Florida, United States
- Department of Anesthesiology, Rutgers New Jersey Medical School, New Jersey, United States
Figures
Figure 1
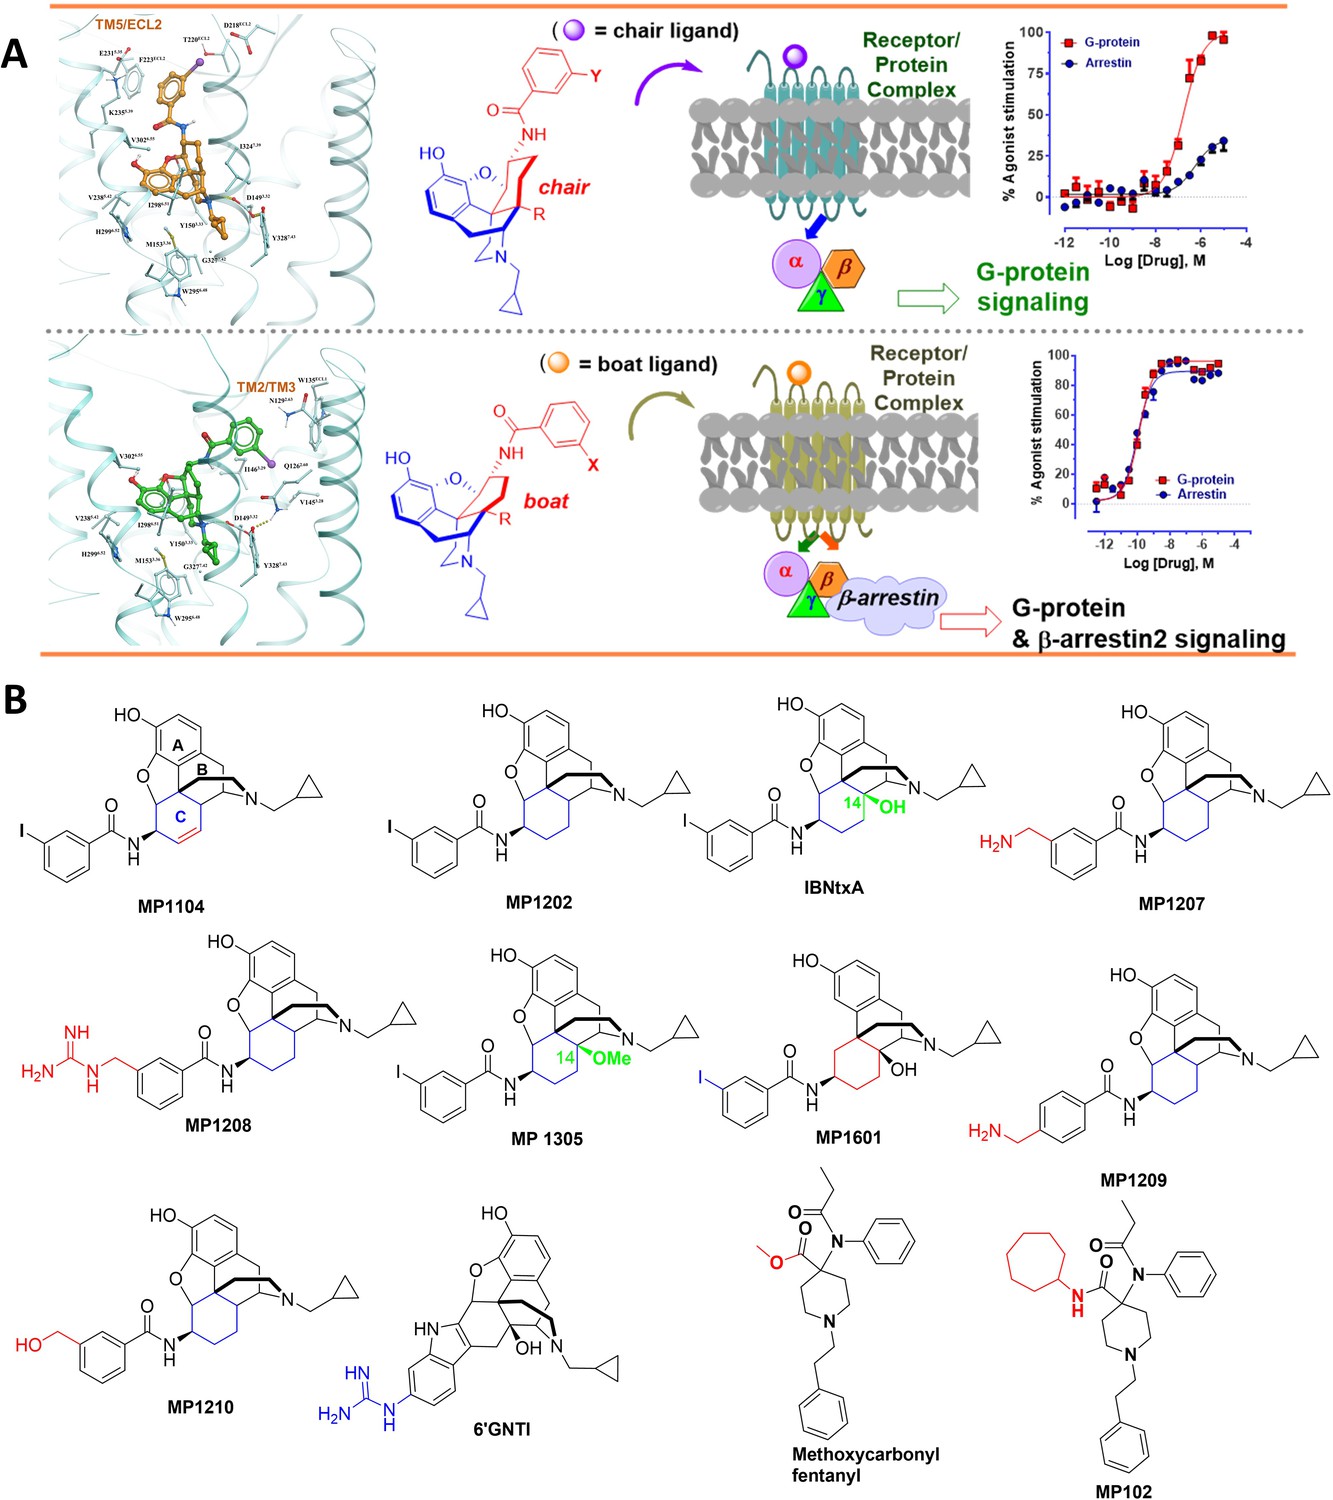
The design concept, structures of ligands synthesized and evaluated at opioids receptors.
(A) Overview of the key hypothesis, suggesting that TM5-ECL2 engagement by morphinan ligand with ring-C chair form leads to preferred G protein signaling, whereas TM2-TM3 engagement and ring-C boat form leads to balanced G protein and arrestin signaling. (B) Structures of the studied m and p-substituted arylamidoepoxymorphinans (MP1104, MP1202, IBNtxA, MP1305, MP1207, MP1208, MP1209, MP1210), m-iodoarylamidomorphinan, (MP1601), methoxycarbonylfentanyl, methoxycarbonyl fentanyl amide MP102 and 6′GNTI.
Figure 2
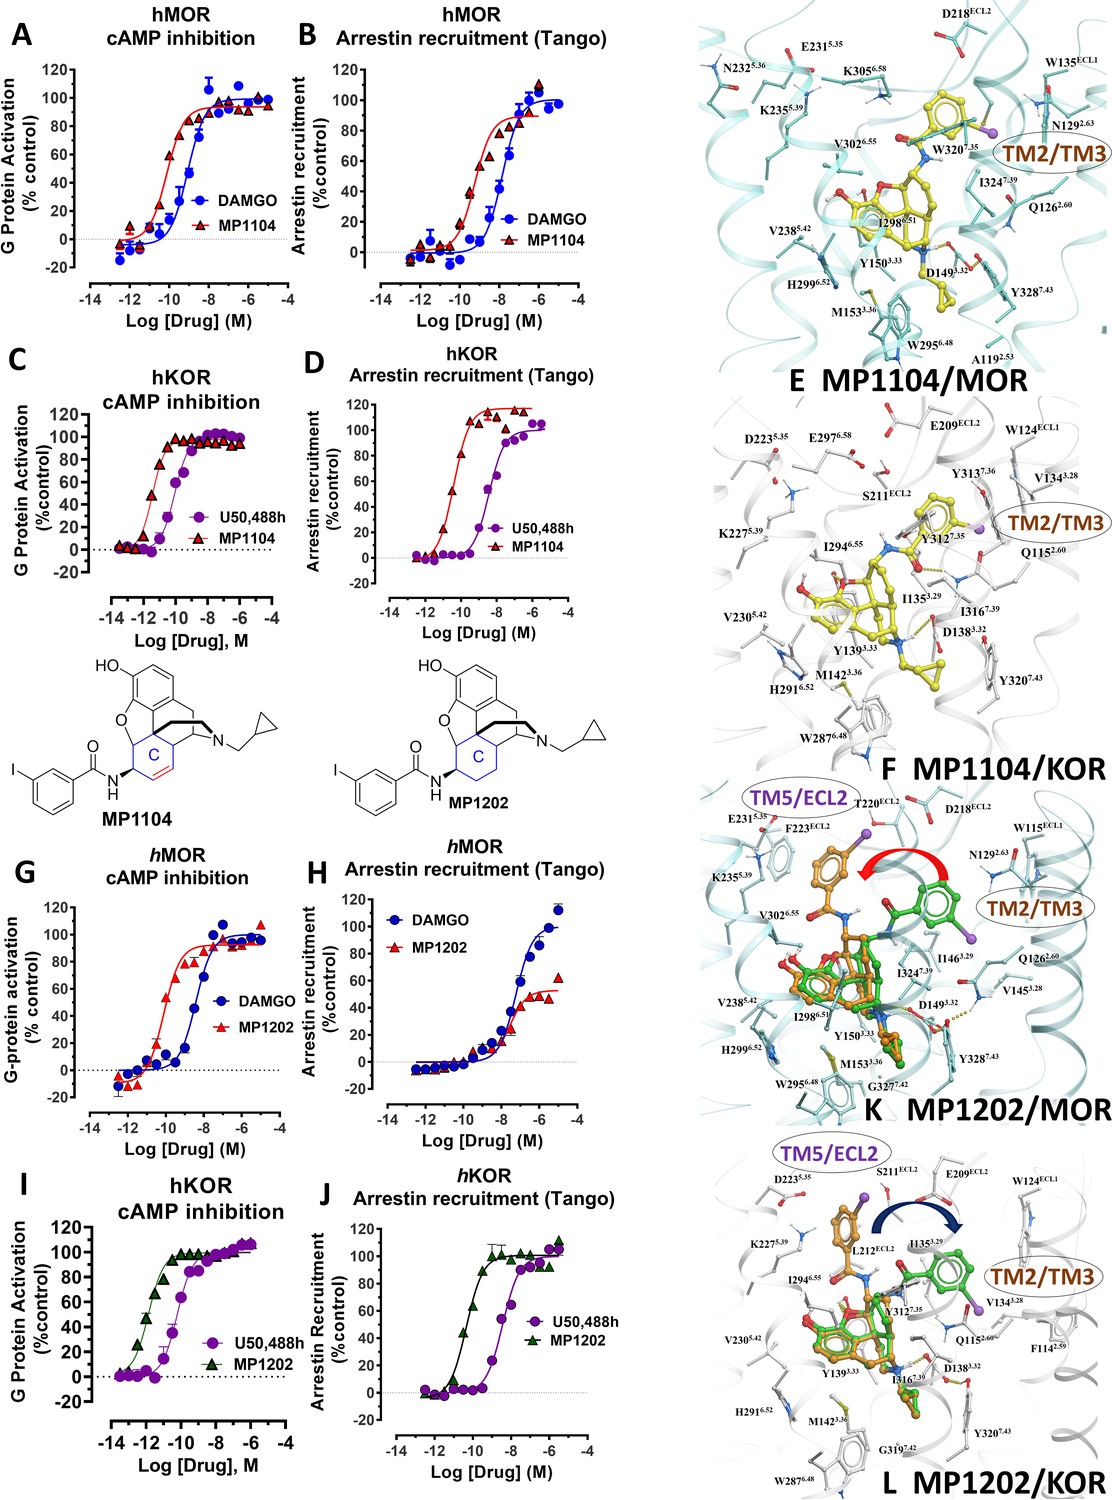
MP1104 at both MOR and KOR and MP1202 at KOR targets the TM2-TM3 region while MP1202 at MOR targets the TM5-ECL2 region and show distinct signaling properties.
(A-B) MP1104 (red) is a full agonist in hMOR in cAMP inhibition (N = 5) and Tango-arrestin recruitment assays (N = 5) compared to DAMGO (blue). (C–D) MP1104 (red) is a full agonist in hKOR in cAMP inhibition (N = 3) and Tango-arrestin recruitment assays (N = 3) compared to U50,488H (purple). (E–F) The preferred docking pose of MP1104 (boat form, yellow stick) at MOR and MP1104 (boat form, yellow stick) in the active state of KOR. Ring-C of MP1104 in boat form forces the iodophenyl moiety to reside in a region between TM2-TM3 at MOR/KOR. (G–H) MP1202 (red) is a full agonist in hMOR in cAMP inhibition (N = 3) and partial agonist in Tango-arrestin recruitment assays (N = 3) compared to DAMGO (blue). (I–J) MP1202 (green) is a full agonist in hKOR in cAMP inhibition (N = 3) and in Tango-arrestin recruitment assays (N = 3) compared to U50,488h (purple). (K–L) The docking poses of MP1202 (chair form, brown stick) and (boat form, green stick) at an active states of MOR and KOR are shown. At MOR, the saturated ring C in MP1202 leads to interaction of the ligand in the ECL2 and TM5 region leading to a preference of chair form shown by a red arrow. At KOR, MP1202 behaves similar to MP1104 and the flip of ring C conformation from chair to boat is shown by a blue arrow. See Appendix 1—table 7 for values, Appendix 1—figure 4 and Appendix 1—table 10 for bias calculations.
Figure 3
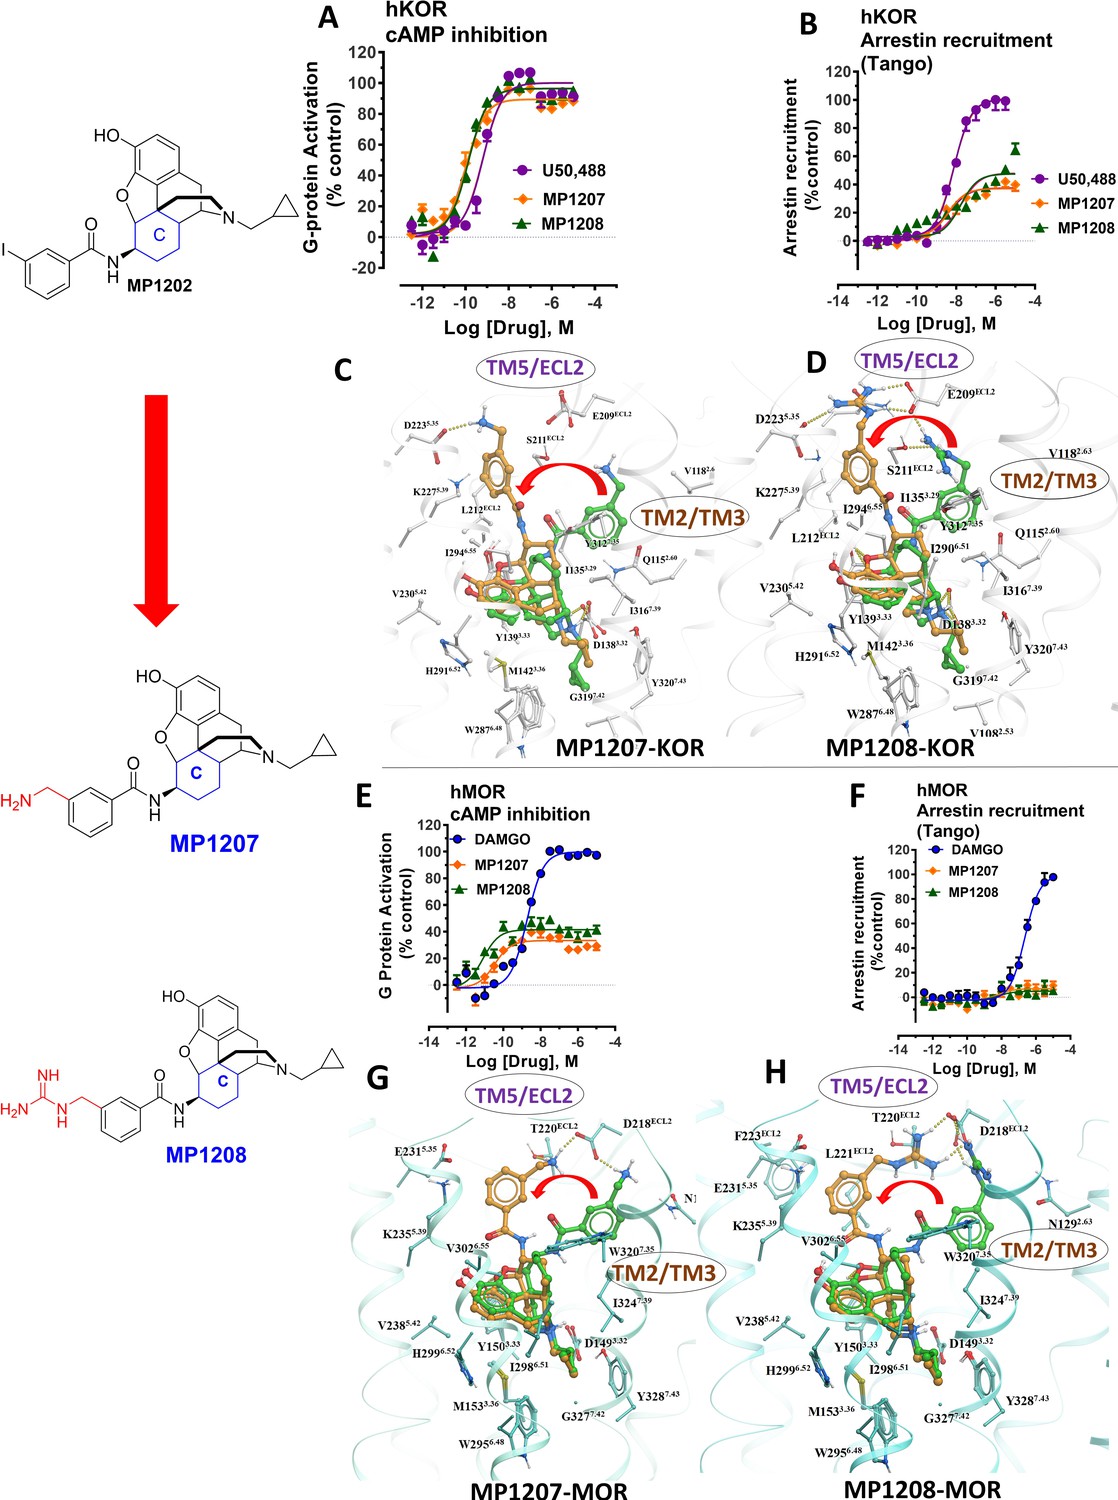
meta-Amino (MP1207) and meta-guanidino (MP1208) analogs prefer the chair conformation and target the TM5-ECL2 region and are G protein biased agonists at KOR and at MOR show no measurable arrestin recruitment.
(A-B) MP1207 (orange) and MP1208 (green) are full agonists at hKOR in cAMP inhibition (N = 3) and partial agonists in Tango-arrestin recruitment assays (N = 3) compared to U50, 488 (purple). (C–D) Docking results showed that amino methyl (MP1207) or guanidino (MP1208) moieties (replacing the iodo group in MP1202) forced these compounds in chair form preferred confirmation at hKOR (chair form in brown stick and boat form in green stick). Unlike boat MP1202, chair MP1207 at hKOR may form a new salt bridge interaction between amino group and D2235.35 and E209ECL2 pulling amidophenyl moiety away from the hydrophobic pocket between TM2 and TM3 (C). Likewise, chair MP1208 forms salt bridge interactions between guanidino group and D2235.35 as well as with E209ECL2 (D) The flip in conformation of ringC from boat to chair for both MP1207 and MP1208 is shown by a red arrow. (E–F) MP1207 (orange) and MP1208 (green) are partial agonists at hMOR in cAMP inhibition (N = 3). No arrestin recruitment was observed for both agonists in Tango-arrestin recruitment assays (N = 3) compared to DAMGO (blue). (G–H) At hMOR chair forms of MP1207 and MP1208 introduce additional interactions between amino or guanidino group and D218ECL2 and T220ECL2. Thus, biased signaling events of MP1207 and MP1208 are dictated from chair favored binding via the involvement of their m-amino or m-guanidino group with TM5 -ECL2 region. See Appendix 1—table 7 for values, Appendix 1—figure 4 and Appendix 1—table 10 for bias calculations.
Figure 4

MD simulations in hKOR with MP1207 show the guanidine group interacts with E209/D223 and analogs of MP1207 not oriented toward TM5-ECL2 region suggest G protein bias of MP1207/08 is dependent on salt-bridge formation in this region.
(A) Docking of MP1202 (green sticks) and MP1207 (yellow sticks) in wild type KOR showing MP1207 chair form engaging D223 and E209 residues in TM5-ECL2 region while MP1202 boat form not engaging this region. (B) Graph plotting distances between methyl nitrogen atom of MP1207 and side-chain carboxylate atoms of Glu209ECL2 and Asp2235.35 during two 1000 ns long MDs runs of MOR-MP1207 complex. Distances of each trajectory frame and running average are plotted for Glu209ECL2 (light orange and orange) and Asp2235.35 (light green and green). (C–D) MP1209 (blue) and MP1210 (light green) are full agonists at hKOR in cAMP inhibition (N = 3) and Tango-arrestin recruitment assays (N = 3) compared to U50,488h (purple). (E–F) Similarly, MP1209 (red) and MP1210 (orange) are partial agonists at hMOR in cAMP inhibition (N = 3). No arrestin recruitment was observed for both agonists in Tango-arrestin recruitment assays (N = 3) compared to DAMGO (blue). Regioselectivity of ring substituent is important for kappa bias. The p-methyl amino and m-methyl alcohol do not form salt-bridge within TM5-ECL2 unlike the m-methyl amino group of MP1207 as a result similar to MP1202 with respect to bias at KOR and lower arrestin signaling at MOR. See Appendix 1—table 7 for values, Appendix 1—figure 4 and Appendix 1—table 10 for bias calculations.
Figure 5
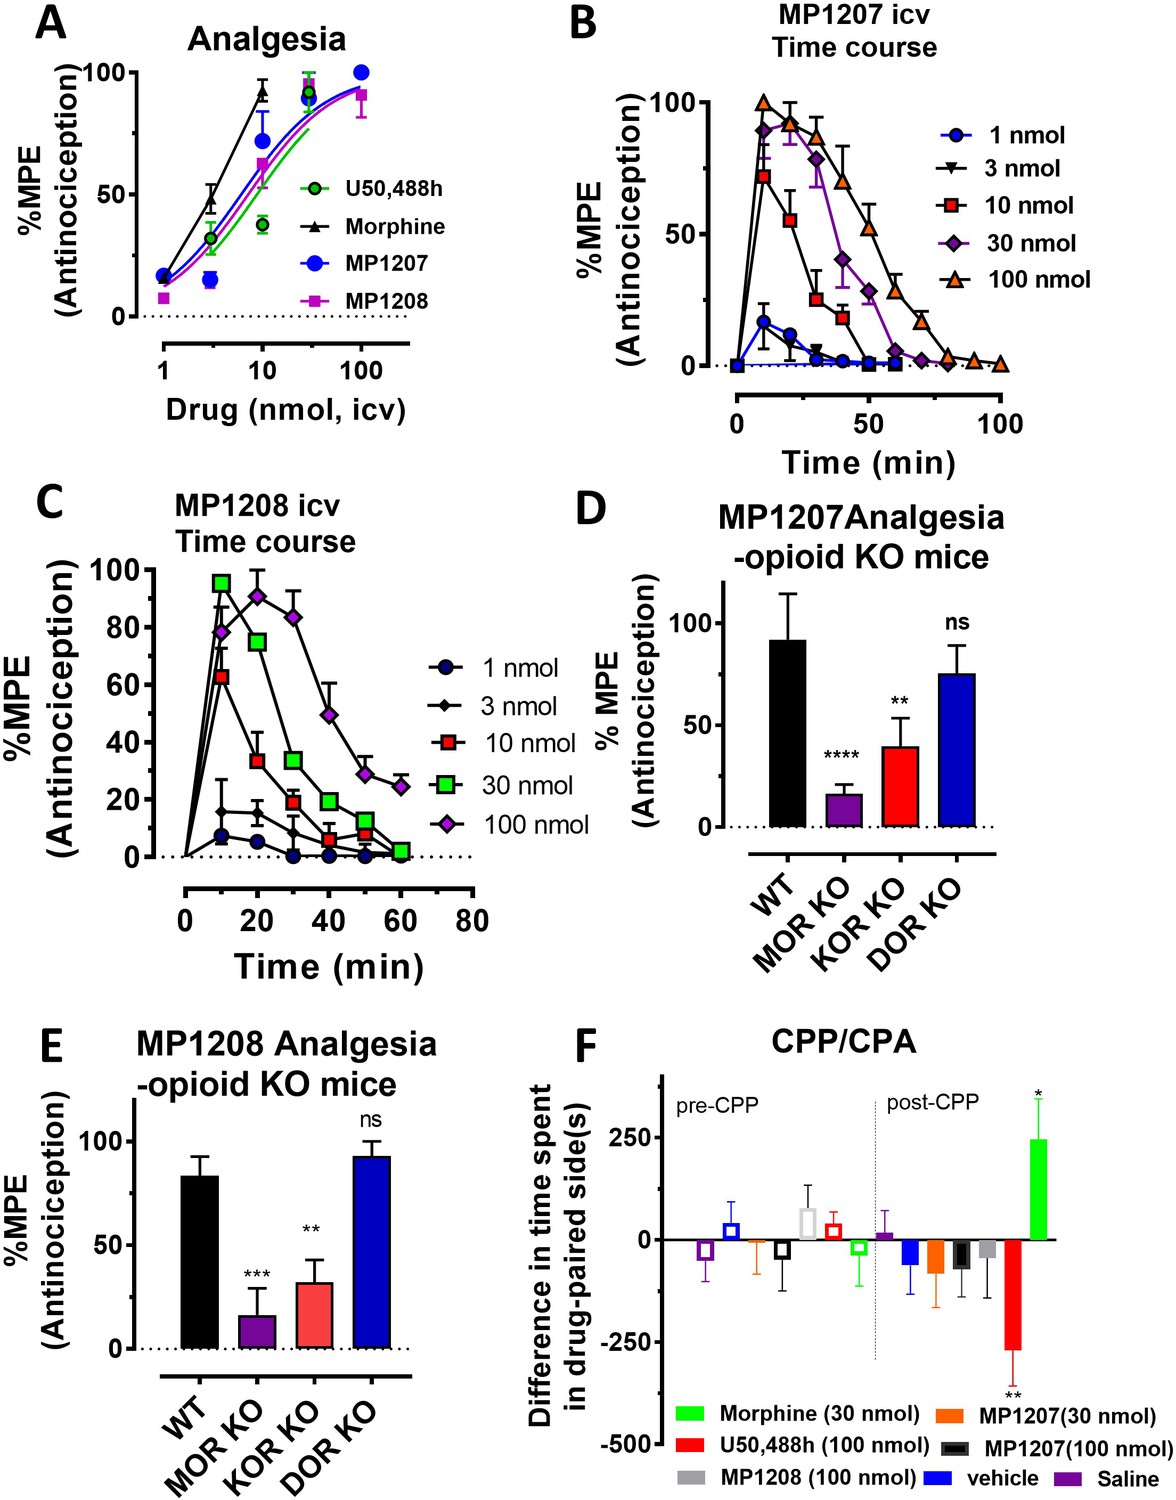
MP1207/1208 show MOR/KOR-mediated antinociception without showing place preference or aversion.
(A) Dose-response curve: Groups of C57BL/6J mice were supraspinally (icv) administered MP1207, MP1208, morphine and U50,488h and antinociception measured using the 55°C tail withdrawal assay at peak effect. Data are shown as mean % antinociception (MPE) ± SEM. ED50 (with 95% CI) values = 6.1 (4.1–8.9) nmol, 7.2 (5.0–10.2) nmol, 4.77 (1.49–28.8) nmol, and 8.8 (5.7–13.5) nmol were calculated for MP1207, MP1208, morphine and U50,488h respectively. (B–C) Antinociceptive time course: Effect of MP1207 (B) and MP1208 (C) at doses of 1, 3, 10, 30, and 100 (n = 8 each group, with n = 16 for MP1208 at 30 nmol) with repeated measures over time. (D–E) MP1207/08 analgesia in KO mice: Analgesic effect of MP1207 (30 nmol icv, D ) and MP1208 (35 nmol icv, E) was evaluated in groups (n = 8) of WT (C57BL/6J), MOR KO, KOR KO, and DOR KO mice. Antinociception of MP1207/08 remained intact in DOR KO mice while it was attenuated in MOR KO and KOR KO mice. Results for MP1207 were analyzed with one-way ANOVA followed by Dunnett’s post hoc test; F3,28=10.11, p=0.0001.**p=0.005 relative to WT, ****p<0.0001 relative to WT, ns = p>0.05 relative to WT. Similarly, MP1208 results were analyzed with one-way ANOVA followed by Dunnett’s post hoc test, F3,28=15.35, p<0.0001.**p=0.005 relative to WT, ****p<0.0001 relative to WT, ns = p>0.05 relative to WT. All values are expressed as the mean MPE ± SEM. (F) Conditioned place preference or aversion (CPP/CPA): Place conditioning evaluation of MP1207, 1208, morphine, U50,488h, saline and vehicle in C57BL/6J mice after icv administration. Following determination of initial preconditioning preferences (pre-CPP), mice were place‐conditioned daily for 2 days with MP1207 (30 nmol, n = 23 and 100 nmol, n = 24), MP1208 (100 nmol, n = 26), U50,488 (100 nmol, n = 19) or morphine (30 nmol, n = 12) and examined the fourth day for final conditioned place preference (post-CPP). Mean differences in time spent on the drug‐paired side ± SEM are presented. *p=0.03 (morphine) or **p=0.003 (U50,488h), significantly different from matching pre-conditioning preference; unpaired t-test with Welsch’s correction. Both MP1207/08 were neither reinforcing nor aversive in mice.
Figure 6
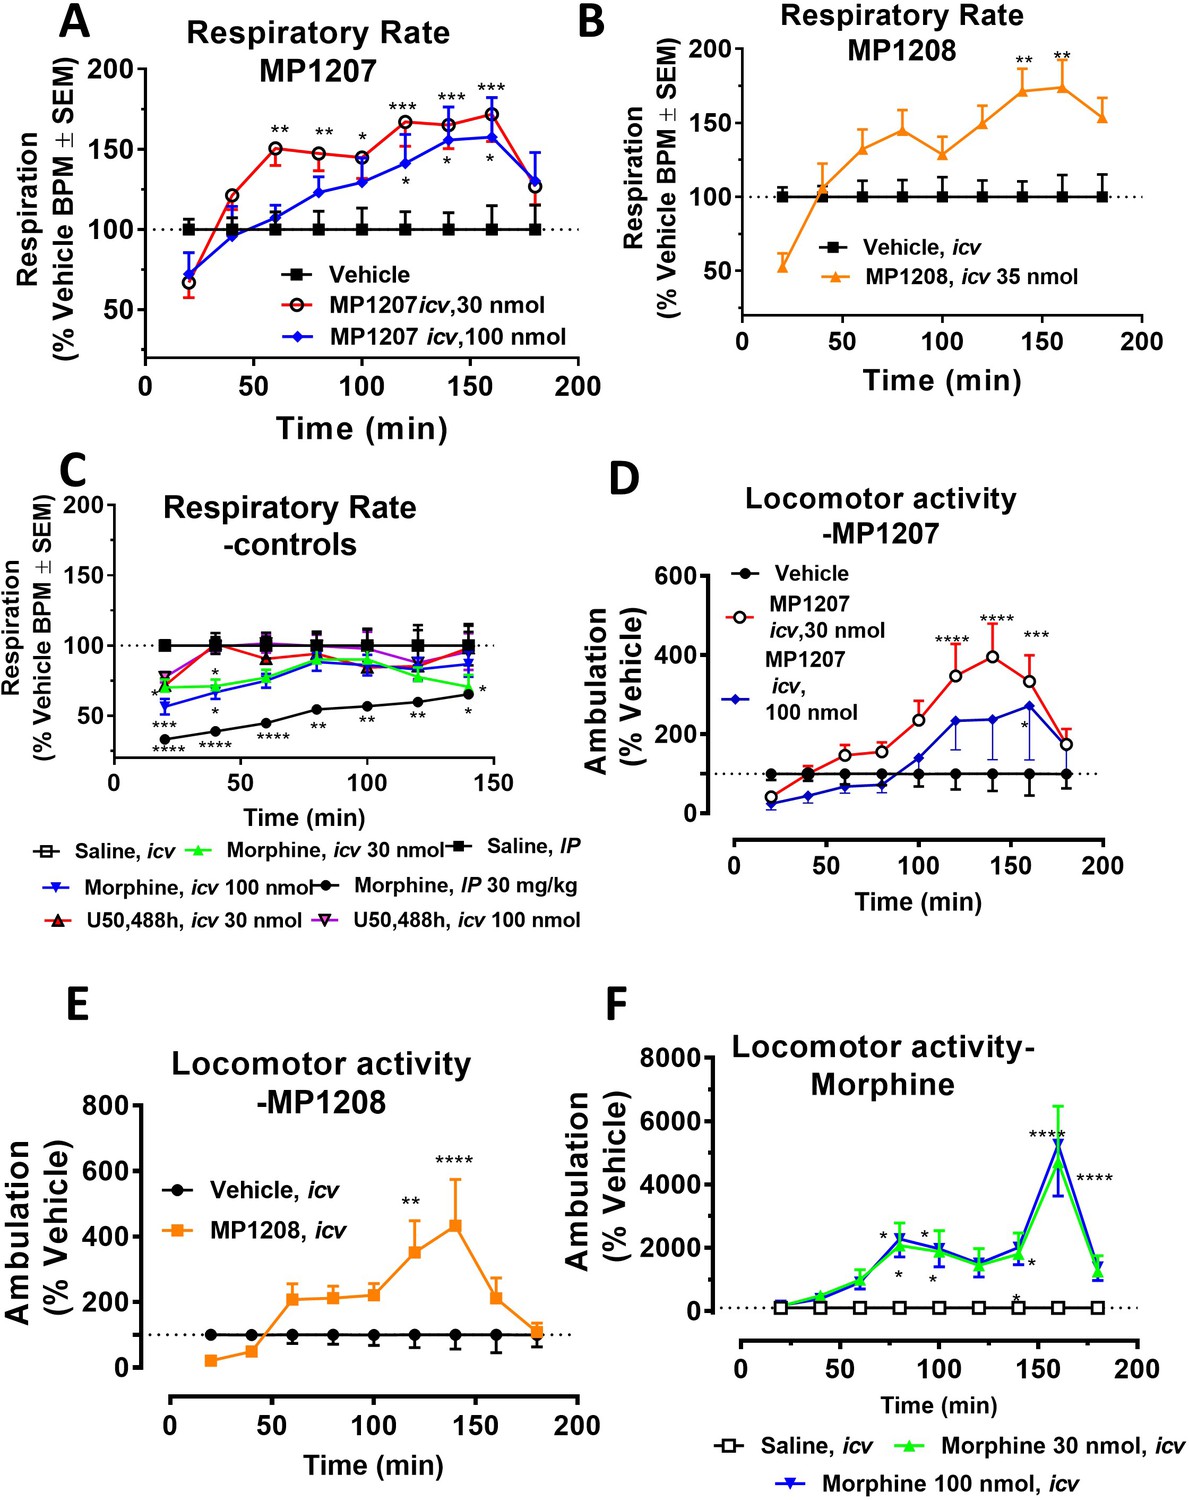
MP1207/08 show attenuated respiratory depression and locomotor effects compared to morphine in mice.
Mice were administered either saline (n = 15), vehicle (n = 24), morphine (30 mg/kg, IP; n = 12 or 30 nmol; n = 18 or 100 nmol, icv; n = 16), MP1207 (30 nmol; n = 26 or 100 nmol icv, n = 10), MP1208 (100 nmol icv, n = 10) and the breaths (A–C) or ambulations (D–F) measured every minute and averaged in 20 min segments. Data presented as % vehicle response ±.SEM; A–C, breaths per minute (BPM) or (D–F): ambulation (XAMB). (A) MP1207 (30 nmol icv) increased breathing rates at 60 min (**p=0.005), 80 min (**p=0.008), 100 min (*p=0.01), 120 min (***p=0.0001), 140 min (***p=0.0002), and 160 min (***p=0.0002) compared to vehicle. MP1207 (100 nmol icv) showed increased respiration at 120–160 min (*p=0.02) as determined by two-way ANOVA followed by Dunnett’s multiple-comparison test. (B) MP1208 (35 nmol icv) increased respiratory rate similar to MP1207 and significantly different from vehicle at 140 min (**p=0.0018) and 160 min (**p=0.0028) as determined by two-way ANOVA followed by Sidak’s multiple comparison test. (C) Morphine (30 mg/kg, IP) depressed respiration compared to saline, IP at 20–60 min (****p<0.0001), 80 min (**p=0.0011), 100 min (**p=0.0021), and 120 min (*p=0.02). Respiration after U50,488h (30 or 100 nmol icv) did not significantly differ from that of saline, icv. Morphine (30 nmol, icv) showed respiratory depression at 20 min (*p=0.03), 40 min (*p=0.04) while morphine (100 nmol, icv) showed respiratory depression at 20 min (***p=0.0009) and 40 min (*p=0.02) compared to saline, icv. (D–F) Locomotor effect: (D) MP1207 (30 nmol, icv) significantly increased forward ambulations at 120–140 min (****p<0.0001) and 160 min (***p=0.01) and at 160 min (*p=0.01), whereas the 100 nmol, icv dose did not as determined by two-way ANOVA followed by Dunnett’s multiple-comparison test in comparsion to vehicle. (E) MP1208 (35 nmol icv) increased ambulatory activity similar to MP1207 but less than morphine, and significantly different from vehicle at 120 min (**p=0.002) and 140 min (****p=0.0001) as determined by two-way ANOVA followed by Sidak’s multiple comparison test. (F) Morphine at 30 nmol icv showed significant hyperlocomotion (note axis scale) compared to saline at 80 min (*p=0.02), 100 min (*p=0.05), and 160 min (****p<0.0001). Similarly morphine at 100 nmol was significantly different at 80 min (*p=0.01), 100 min (*p=0.0395), 140 min (*p=0.034) and 160 min (****p<0.0001).
Appendix 1—figure 1
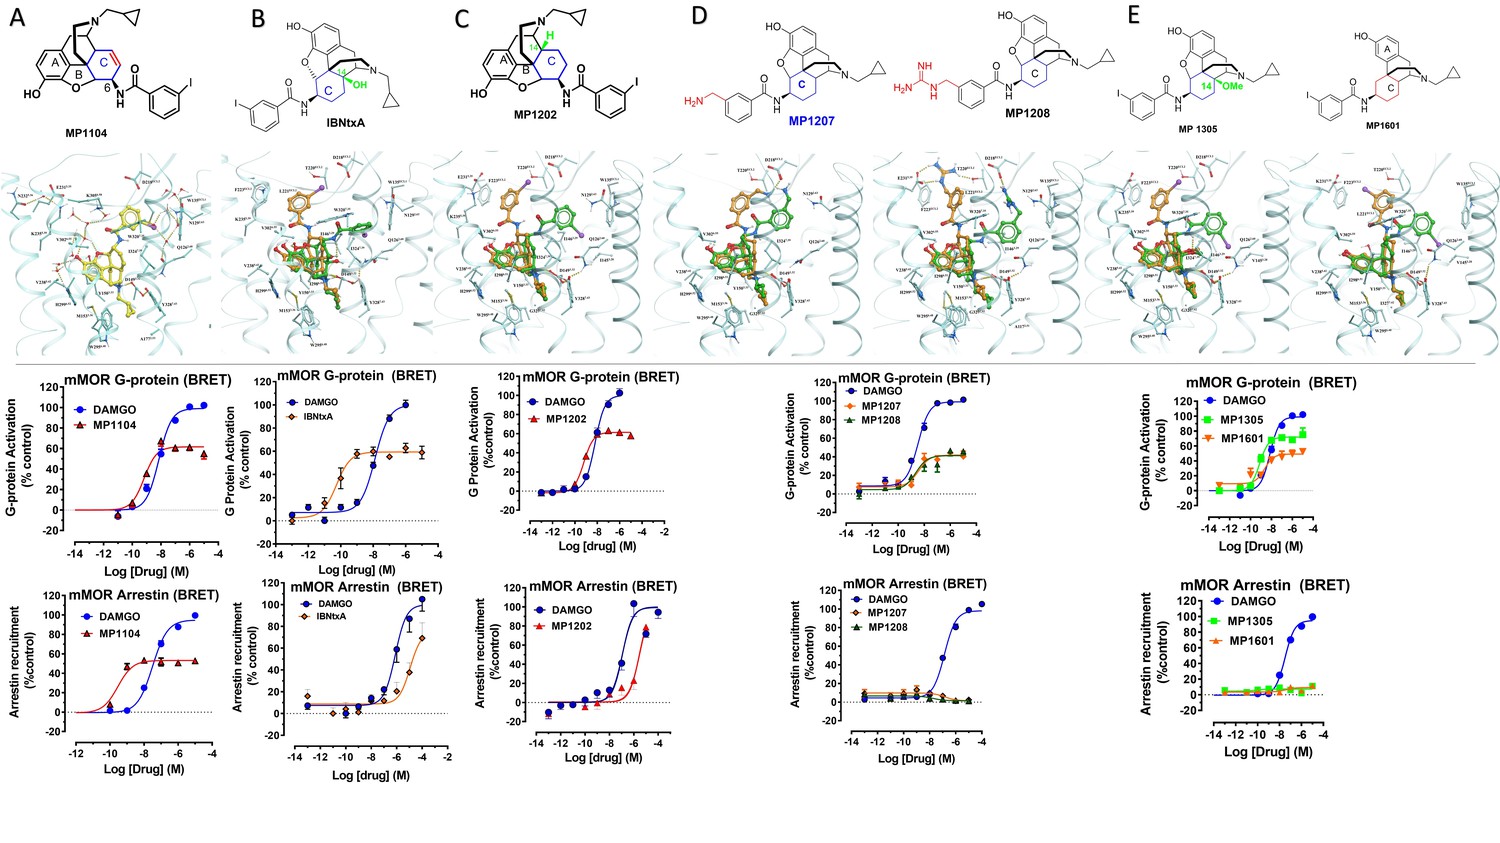
Characterization of ligands (MP1104, IBNtxA, MP1202, MP1207, MP1208, MP1305, and MP1601) at mouse mu opioid receptor (mMOR) using BRET assays-chemical structure, docking in MOR, G protein activity, and arrestin recruitment.
(A) MP1104 targets the TM2-TM3 region and is arrestin-biased at mMOR: The preferred docking pose of MP1104 (boat form, yellow stick) at an active state of MOR is shown. Ring C of MP1104 in boat form forces the iodophenyl moiety to reside in a region between TM2-TM3. MP1104 (red) is a partial agonist in mMOR measuring G protein activation (N = 4) and arrestin recruitment (N = 4) compared to DAMGO (blue) in BRET assays. (B) IBNtxA targets the TM5-ECL2 region while showing reduced arrestin potency at mMOR compared to DAMGO: The docking poses of IBNtxA (chair form, orange stick) at an active state of MOR is shown. The saturated ringC in IBNtxA leads to interaction of the ligand in the ECL2 and TM5 region, which leads to a preference of chair form in our docking studies. At mMOR, it is a partial agonist for G protein signaling (N = 4) compared to DAMGO (blue) while showing reduced arrestin potency compared to DAMGO (N = 4) in BRET assays. (C) MP1202 targets the TM5-ECL2 region and shows reduced arrestin potency at mMOR compared to DAMGO. The preferred docking pose of MP1202 (chair form, orange stick) at an active state of MOR. The saturated ringC in MP1202 leads to interaction of the ligand in the ECL2 and TM5 region. MP1202 (red) is a partial agonist for G-signaling (N = 5) in mMOR and reduced arrestin potency (N = 5) compared to DAMGO (blue) in BRET assays. (D) MP1207 and MP1208 target the TM5-ECL2 region and show no arrestin recruitment at mMOR: Docking results showed that m-aminomethyl (MP1207) or m-guanidinomethyl (MP1208) moieties (replacing an iodo group in MP1202) forced these compounds in chair form preferred confirmation at MOR (chair form in orange stick and boat form in green stick). MP1207 (orange) and MP1208 (green) are partial agonists at mMOR in BRET assays (N = 3) compared to DAMGO (blue). At MOR, chair forms of MP1207 and MP1208 introduce additional interactions between m-amino or m-guanidino group and D218ECL2 and T220ECL2. No arrestin recruitment was observed for both agonists (N = 3). (E) MP1305 and MP1601 target the TM5-ECL2 region and show no arrestin recruitment at mMOR. Chair and boat forms of MP1305 and MP1601 at an active state MOR (in cyan) are shown. Docking modes of MP1305 and MP1601 are analogous and they both maintain chair confirmation at MOR. In BRET assays using mMOR, MP1305 (green) and MP1601 (red) are partial agonists for G-signaling (N = 3) compared to DAMGO (blue) with no measurable arrestin recruitment (N = 3). In summary, targeting TM5-ECL2 and ring C taking chair form leads to reduced arrestin signaling at MOR in both rodents as well as human receptors with analogs. See Appendix 1—table 8 for values, Appendix 1—figure 4 and Appendix 1—table 11 for bias calculations.
Appendix 1—figure 2
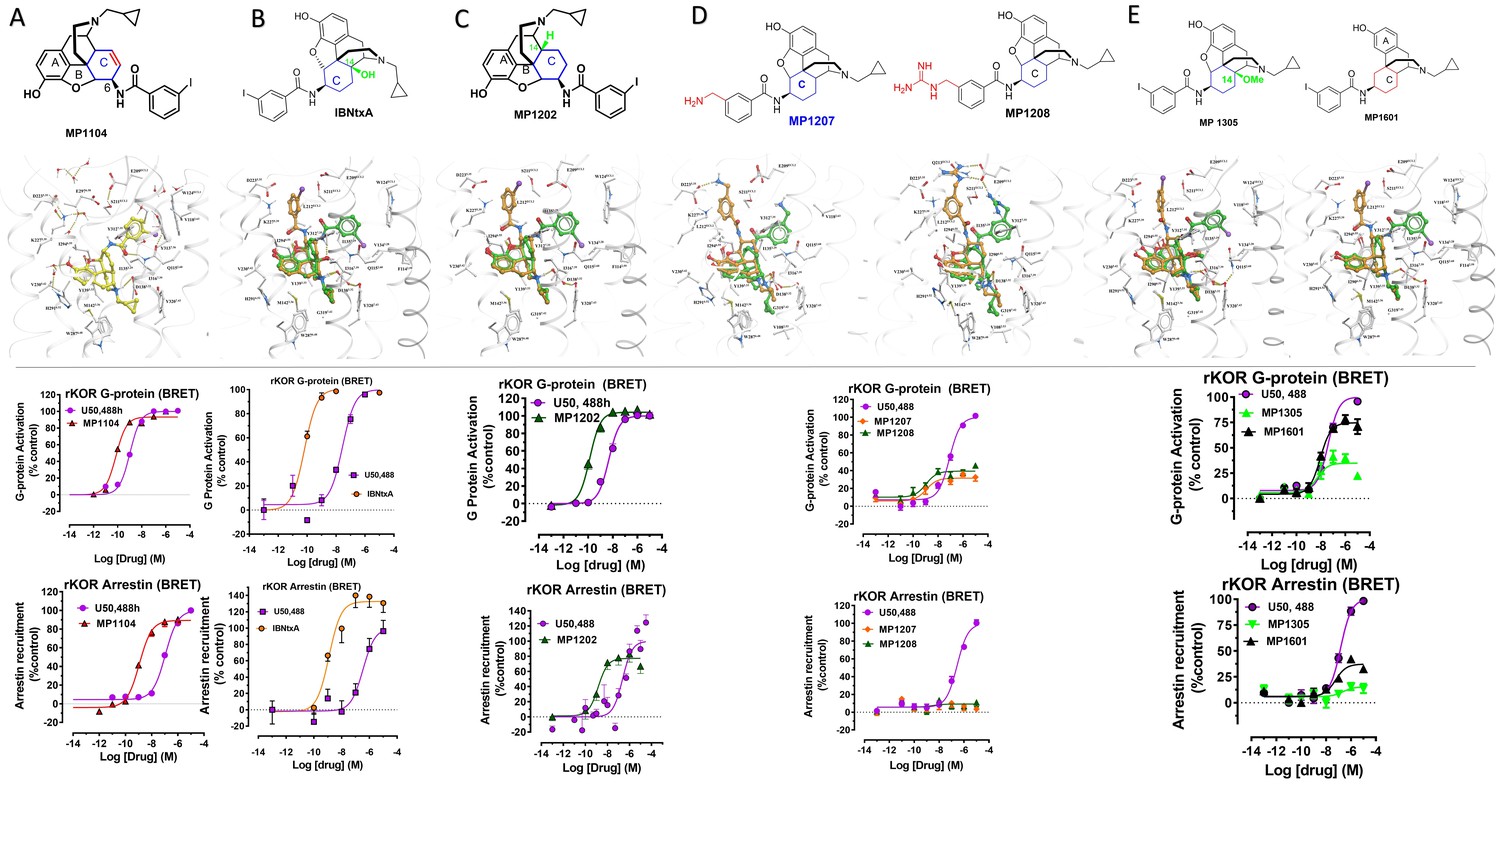
Characterization of ligands (MP1104, IBNtxA, MP1202, MP1207, MP1208, MP1305 and MP1601) at rat kappa opioid receptor (rKOR) using BRET assays-chemical structures, docking in MOR, G protein activity, and arrestin recruitment.
A) MP1104 targets the TM2-TM3 region and is arrestin biased at rKOR: The preferred docking pose of MP1104 (boat form, yellow stick) at an active state of KOR is shown. The iodophenylamido moiety aligns in the hydrophobic pocket between TM2 and TM3 in KOR, a cavity lined with V1182.63, W124ECL1, and L1353.29. In addition, polar residue Q1152.60 adopts a slightly different conformation which allows more room for the hydrophobic moiety. Such increase in hydrophobic nature of the KOR binding pocket may well be associated yielding the best docking scores of MP1104 in its boat conformation. MP1104 (red) is a full agonist in rKOR in BRET assays measuring G protein activation (N = 6) and arrestin recruitment (N = 6) compared to U50,488H (purple). (B) IBNtxA prefers the boat form at KOR and is not biased for any pathway at mKOR: The docking poses of IBNtxA (chair form, orange stick) and (boat form, green stick) at an active state of KOR are shown. At rKOR, the iodophenylamido moiety of IBNtxA aligns in the hydrophobic pocket between TM2 and TM3 in KOR, a cavity lined with V1182.63, W124ECL1 and L1353.29. In BRET assays using rKOR, IBNtxA is a full agonist for G protein (N = 3) as well as Arrestin signaling (N = 3) compared with U50,488H (purple). (C) MP1202 prefers the boat form at KOR and is not biased for any pathway at rKOR. The preferred docking pose of MP1104 (boat form, yellow stick) and MP1202 (chair form, orange stick) at an active state of KOR. The iodophenylamido moiety aligns in the hydrophobic pocket between TM2 and TM3 in KOR, a cavity lined with V1182.63, W124ECL1, and L1353.29. In addition, polar residue Q1152.60 adopts a slightly different conformation allowing more room for the hydrophobic moiety. Such increase in hydrophobic nature of the KOR binding pocket may well be associated yielding the best docking scores of both MP1104, IBNtxA and MP1202 with their boat conformation. MP1202 (green) is a full agonist in rKOR measuring G protein activation (N = 3) and arrestin recruitment (N = 9) compared to U50,488H (purple) in BRET assays. (D) m-Aminomethyl (MP1207) and m-guanidinomethyl (MP1208) analogs prefer the chair conformation and target the TM5-ECL2 region and show no arrestin recruitment at KOR. Docking results showed that m-amino methyl (MP1207) or m-guanidinomethyl (MP1208) moieties (replacing an iodo group in MP1202) forced these compounds in chair form preferred confirmation at KOR (chair form in orange stick and boat form in green stick). Unlike boat MP1202, chair MP1207 at KOR may form a new salt bridge interaction between amino group and D2235.35 and E209A pulling the amidophenyl moiety away from the hydrophobic pocket between TM2 and TM3. Likewise, chair MP1208 forms salt bridge interactions between guanidino group and D2235.35 as well as with E209ECL2. MP1207 (orange) and MP1208 (green) are partial agonists for G-signaling (N = 3) at rKOR in BRET assays compared to U50,488H (purple). No arrestin recruitment was observed for both agonists (N = 5) against U50,488H as a control at rKOR. (E) MP1305 showed no arrestin recruitment and MP1601 was not biased for any pathway at rKOR: Chair and boat forms of MP130) and MP1601 at an active state KOR (in gray) are shown. Both MP1305 (green) and MP1601 (black) are partial agonists for G-signaling (N = 3) at rKOR in BRET assays compared to U50,488H (blue). No arrestin recruitment was observed for MP1305 (N = 6) while MP1601 was a partial agonist for arrestin signaling pathway (N = 6). In summary, targeting TM5-ECL2 and ring C taking chair form leads to preference for G protein pathway at KOR in both rodents as well as human receptors with analogs. See Appendix 1—table 8 for values, Appendix 1—figure 4 and Appendix 1—table 11 for bias calculations.
Appendix 1—figure 3

IBNtxA is arrestin biased at KOR but shows G protein biased agonism at MOR.
(A–B) At hMOR, IBNtxA (orange) is a G protein biased agonist compared with DAMGO (blue) (N = 4). (C–D) At hKOR, IBNtxA (pink) is a full agonist in cAMP inhibition (N = 3) and Tango-arrestin recruitment assays (N = 3) compared to U50,488H (purple). (F–G) However, at mMOR, it is a partial agonist in G-signaling assays (N = 4) and shows reduced arrestin potency (N = 4) compared to DAMGO (blue) in BRET assays. (H–I) In BRET assays using rKOR, IBNtxA is a full agonist in both G-signaling (N = 3) and arrestin signaling assays (N = 3) compared with U50,488H (purple). (E and J) The docking poses of IBNtxA (chair form, orange stick) and (boat form, green stick) at an active state of MOR and KOR are shown. At MOR, the saturated ring C in IBNtxA leads to interaction of the ligand in the ECL2 and TM5 region leading to a preference of chair form shown by a red arrow. At KOR, the iodophenylamido moiety of IBNtxA aligns in the hydrophobic pocket between TM2 and TM3 in KOR, a cavity lined with V1182.63, W124ECL1 and L1353.29 similar to MP1202. This flip of ring C conformation from chair to boat is shown by a blue arrow. Preference for chair form correlates with G protein bias while preference for boat form correlates with increased arrestin signaling or no preference for any pathway. See Appendix 1—table 9 for values, Appendix 1—figure 4 and Appendix 1—tables 10–11 for bias calculations.
Appendix 1—figure 4
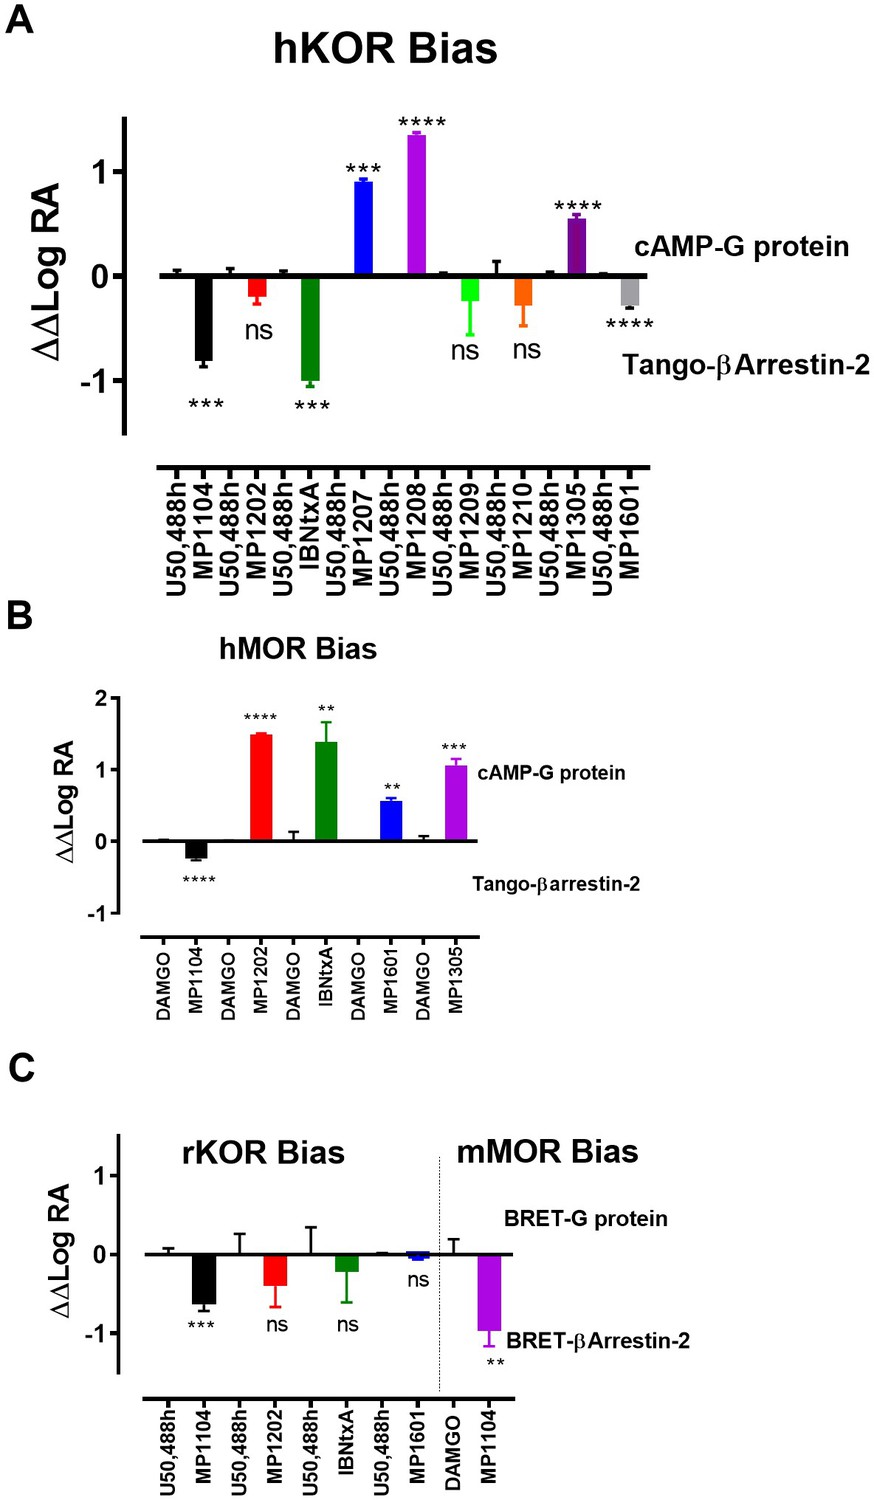
Bias plots for ligands at hKOR (A), hMOR (B) using cAMP and Tango assay and at rKOR /mMOR (C) using BRET assays.
Bias analysis for signaling was performed as described in Materials and methods. Data analyzed against DAMGO and/or U50,488h for each ligand using unpaired t-test with Welch’s correction. At hKOR, MP1104 (**p=0.0015); IBNtxA (***p=0.0002) showed preference for arrestin over G-signaling while MP1209, 1210, 1305 and 1601 showed no preference for any signaling pathway. MP1209 (***p=0.0001) and MP1208 (****p<0.0001) were G-biased. At hMOR, MP1104 (*p=0.0427) preferred arrestin pathway while MP1202 (****p=<0.0001); IBNtxA (**p=0.0089); MP1601 (**p=0.0017) and MP1305 (***p=0.001) were G-biased. At rKOR, MP1104 (***p=0.0002) preferred arrestin pathway while IBNtxA, MP1202, 1601 and 1305 showed no preference for any signaling pathway. At mMOR, MP1104 (**p=0.0021) showed preference for arrestin pathway. To summarize bias factors suggest that in spite of differences in assays and species tested, ligands which engage TM5-ECL2 region of MOR/KOR and where ringC takes chair conformation.
Appendix 1—figure 5

The preferred docking pose of known KOR biased ligand 6′GNTI (chair form, orange stick) at an active state of KOR with the guanidino group engaging a region between TM5 and ECl2.
Note: possible engagement of residues D223 and E209 similar to MP1207 and MP1208 in TM5-ECL2 region.
Appendix 1—figure 6
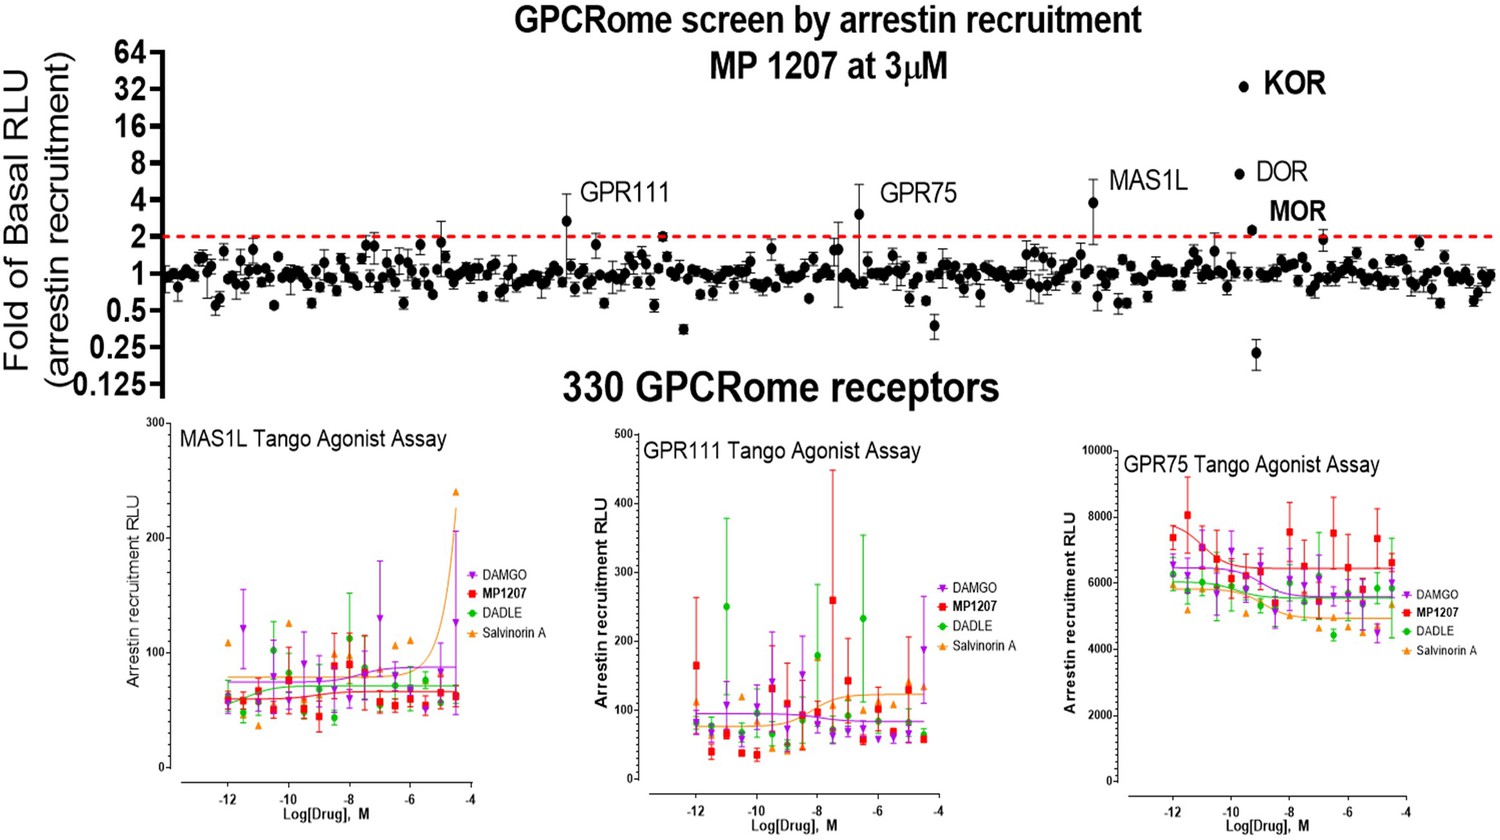
MP1207 is selective for opioid receptors in the GPCRome screen.
MP1207 was screened against 330 non-olfactory GPCRs for agonism in the arrestin recruitment TANGO assay. Each point shows luminescence normalized to basal level at a given GPCR at 3 µM MP1207 dose (>3000 higher dose than the binding affinity at opioid receptors), with vertical lines indicating the standard error of the mean. MP1207 induces an increase in signal twofold over basal at opioid receptors predominantly at KOR and DOR and much less at MOR. Results show selectivity for opioid receptors over non-opioid targets when tested at >10µM and >1500 fold higher than the binding affinity and agonistic potency at opioid receptors. The low signal at MOR is consistent with null arrestin recruitment at MOR. Several potential targets (GPR111, MAS1L, GPR75) did not show dose-dependent increase in signal and probably represent screening false positives.
Appendix 1—figure 7
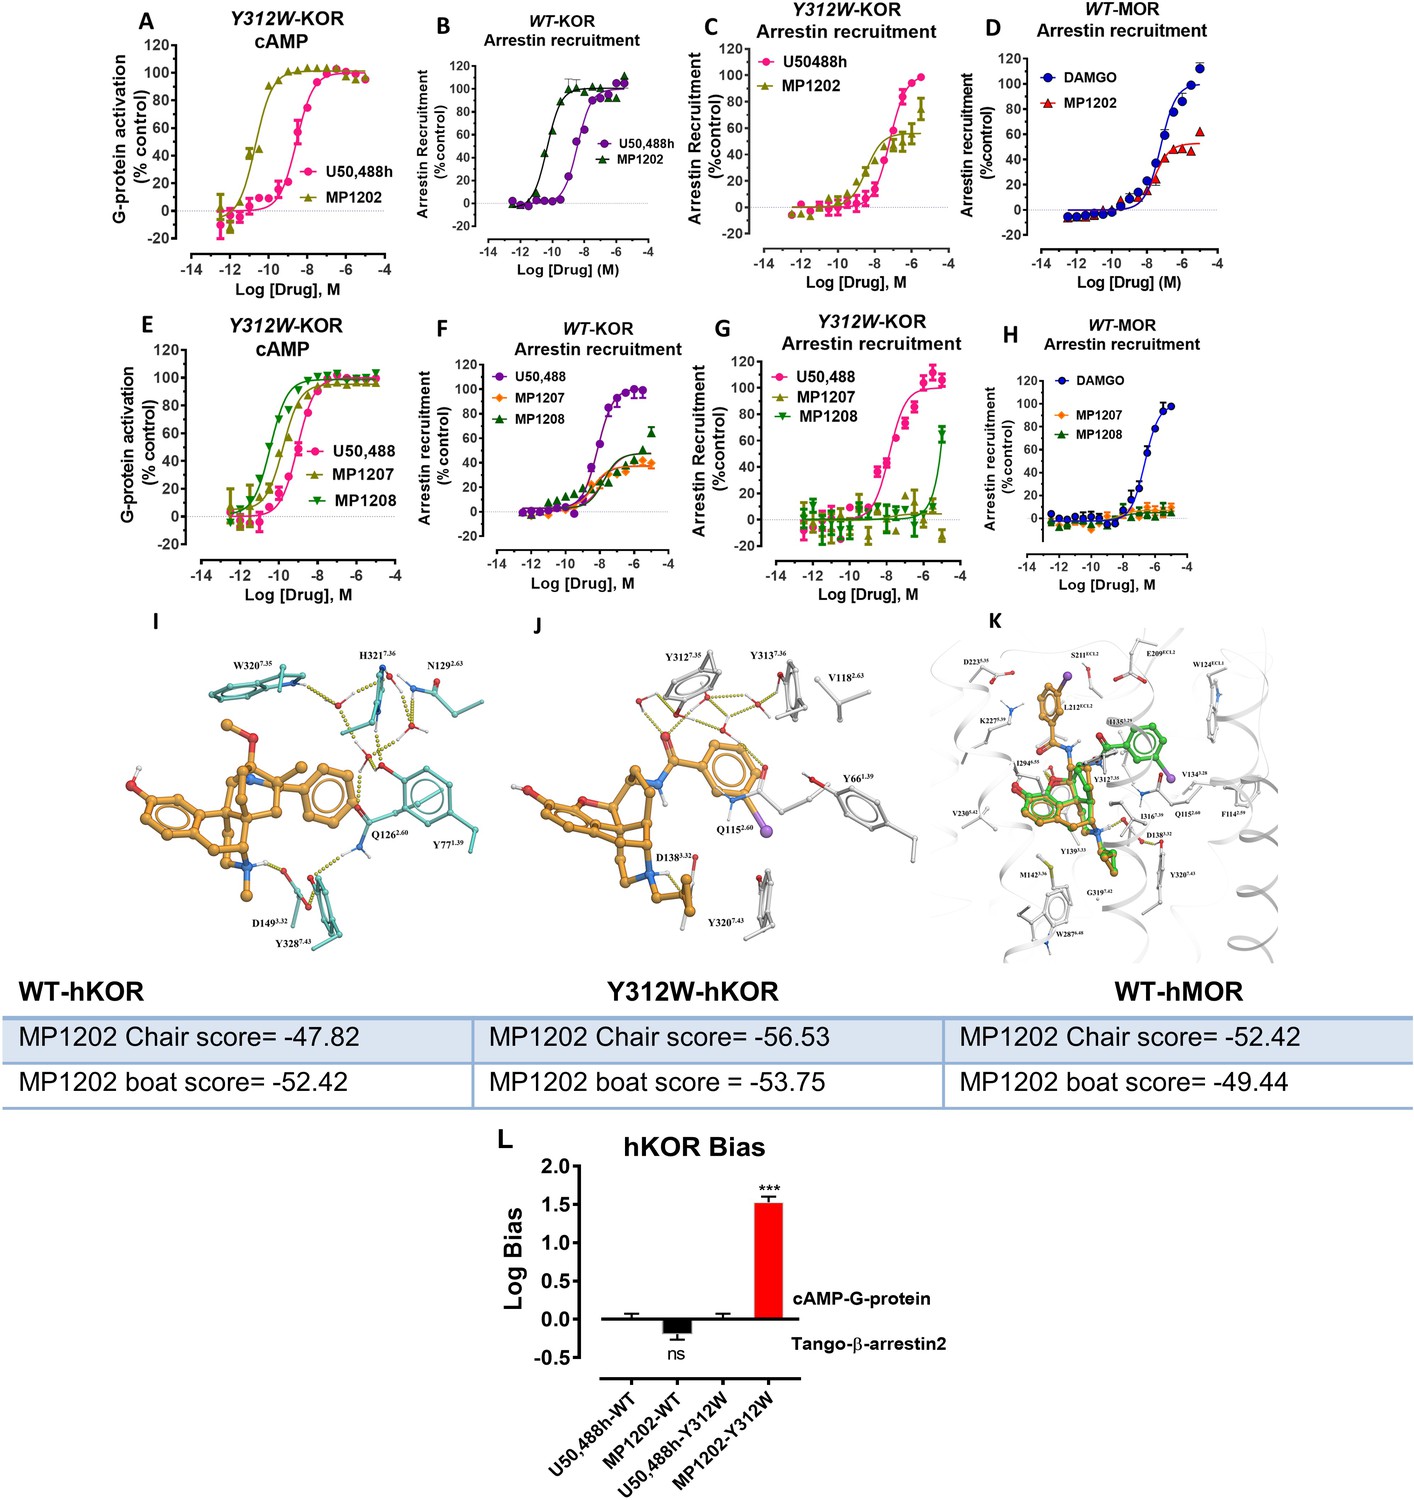
Mutation of KOR Y312W leads to a receptor mimicking MOR arrestin recruitment.
MP1202 flips to a G protein biased agonist and arrestin recruitment for MP1207 and MP1208 is reduced. (A and C) At Y312W-hKOR, MP1202 (light green) is a G-biased agonist in cAMP inhibition (N = 3) (A) and Tango-arrestin recruitment assays (N = 3) (C) compared to U50,488H (pink). (B) At WT-hKOR, MP1202 (purple) acts as a full agonist for arrestin recruitment (N = 3). (D) At WT-hMOR, MP1202 (red) acts as a partial agonist for arrestin recruitment (N = 3). (E and G) At Y312W-hKOR, MP1207 (light green) and 1208 (dark green) show full agonism in cAMP inhibition (N = 3) (E) and reduced arrestin measurement in Tango-arrestin recruitment assays (N = 3) (G) compared to U50,488H (pink). (F) At WT-KOR, MP1207 (orange) and MP1208 (green) act as partial agonists for arrestin recruitment (N = 3) compared to control U50,488H (purple). (H) At WT-MOR, no arrestin recruitment (N = 3) was observed for both agonists MP1207 and MP1208. (I) Conformation of selected residues seen in high resolution active state MOR structure along with crystallographic waters around TM2-TM3 region and crystallized ligand (BU72). MOR, conformation of conserved Q2.60 is maintained by a rather extensive hydrogen-bonding network mediated by W7.35 and at least four tightly bound waters as found in the crystal structure. (J) Conformation of selected residues and MP1202 seen in active state KOR structure, along with modeled waters around TM2-TM3 region. In KOR, no crystallographic waters were resolved in the structure, the non-conserved residues, including Y7.35 instead of W7.35, would rearrange water network and change conformation of Q2.60, paramount for ligand binding. A theoretical water network was modeled using SampleFlood method of ICM Molsoft in the orthosteric ligand site, and resulting waters were optimized via several rounds of extensive conformational sampling. As a result of significant difference observed in the water network, compared to MOR, KOR’s Q1152.60 moves further inwards and is positioned between D1383.32 and Y3127.43, and this new position of Q1152.60 is stabilized via a water-mediated hydrogen bond with Y3127.35. (K) Docking poses of chair and boat conformations of MP1202 in Y312W KOR mutant. The chair form (−56.53) is favored over boat form (−53.75) at this mutant receptor for MP1202. (L) Bias plots for U50,488h and MP1202 at hKOR and Y312W hKOR mutant. MP1202 is not significantly different from U50,488h with respect bias for G over βarrestin-2 signaling at wild type receptor while at the hKOR mutant it shows G-biased signaling. Data are mean± SEM from N = 3 replicates. Data analyzed using unpaired t-test with Welch’s correction,***p=0.0001. See Appendix 1—table 9 for values, Appendix 1—figure 4 and Appendix 1—table 10 for bias calculations.
Appendix 1—figure 8
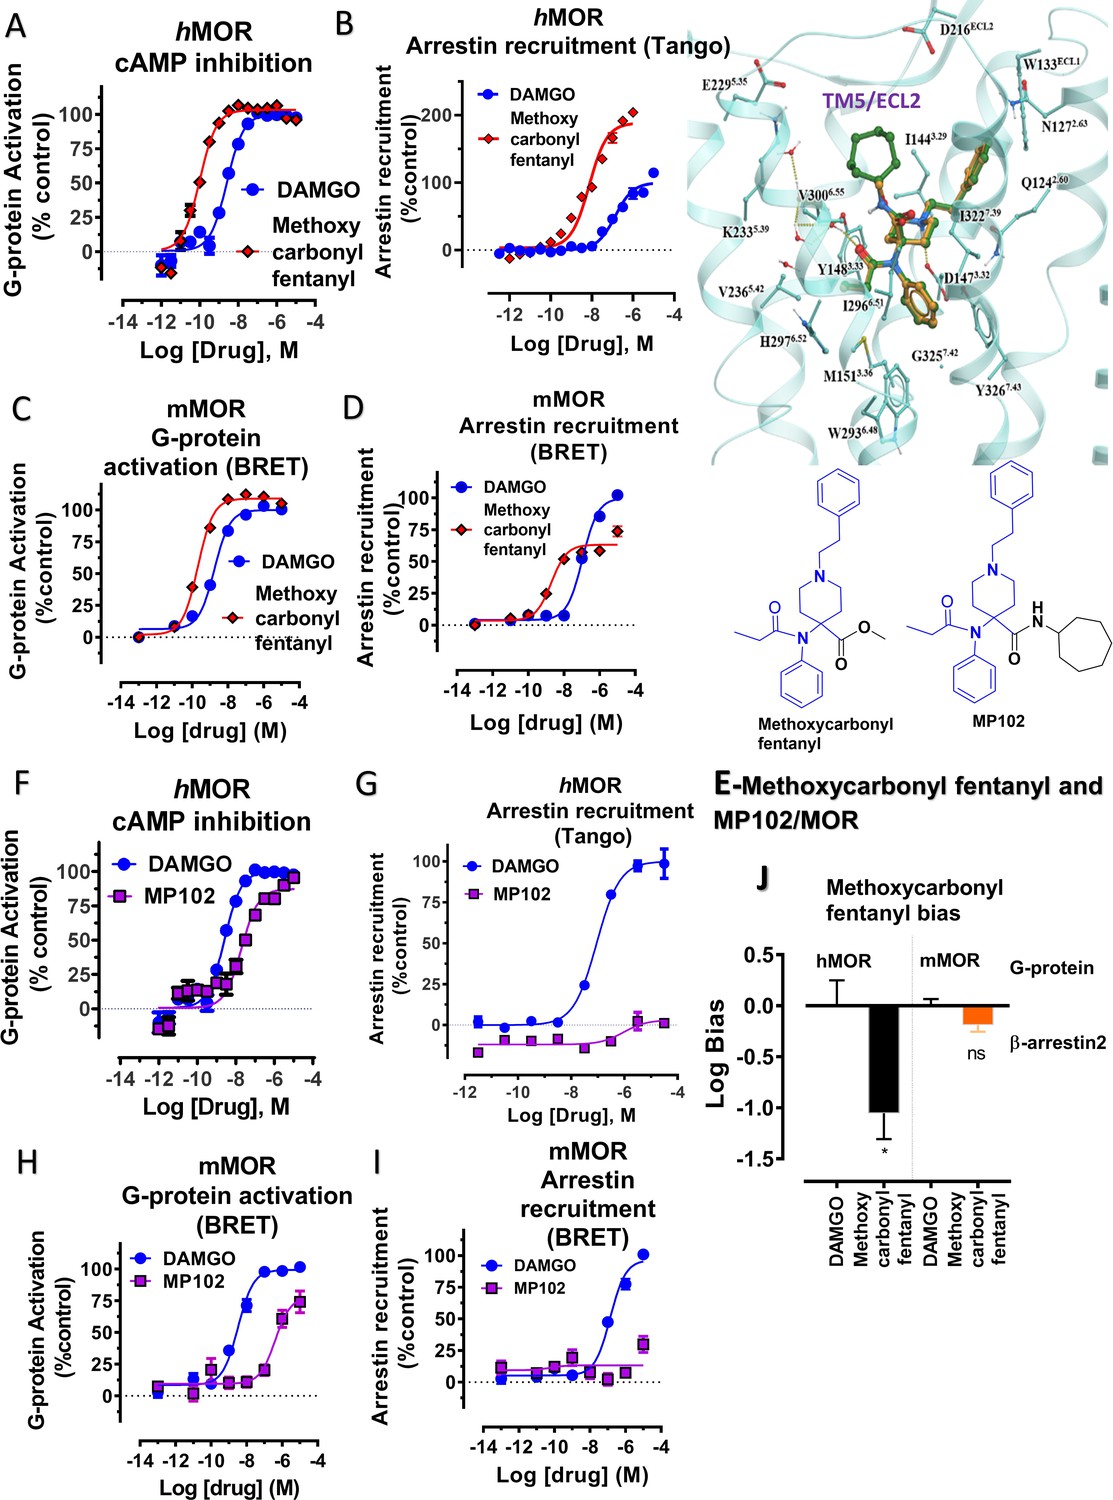
Methoxycarbonyl fentanyl amide analog MP102 targeting TM5 in MOR shows no arrestin recruitment compared to methoxycarbonyl fentanyl at mMOR in BRET assays.
(A-B) Methoxycarbonyl fentanyl (red) is a full agonist at hMOR in cAMP (N = 3) and arrestin recruitment assays (N = 3) compared to DAMGO (blue). (C–D) Methoxycarbonyl fentanyl (red) is a full agonist at mMOR in BRET G protein activation (N = 4) and partial agonist in arrestin recruitment assays (N = 4) compared to DAMGO (blue). (E) Molecular docking of MP102 (green stick) engaging TM5 region and methoxycarbonyl fentanyl (yellow stick) not occupying TM5 region in hMOR. and chemical structures of methoxycarbonyl fentanyl and methoxycarbonyl fentanyl amide, MP102. (F-G) MP102 (purple) is a full agonist at mMOR in cAMP assays (N = 3) and shows no arrestin recruitment assays (N = 3) compared to DAMGO (blue). (H–I) Similarly, MP102 (purple) is a partial agonist at mMOR in BRET G protein activation assays (N = 3) and shows no arrestin recruitment assays (N = 6) compared to DAMGO (blue). (J) Bias plots for DAMGO and methoxycarbonyl fentanyl at hMOR and mMOR. Methoxycarbonyl fentanyl is arrestin biased at hMOR and shows no preference for any pathway at mMOR. Data are mean± SEM from N = 3 replicates and is analyzed using unpaired t-test with Welch’s correction,***p=0.0001. See Appendix 1—tables 7– eight for values, and Appendix 1—table 10 and Appendix 1—table 11 for bias calculations.
Appendix 1—figure 9
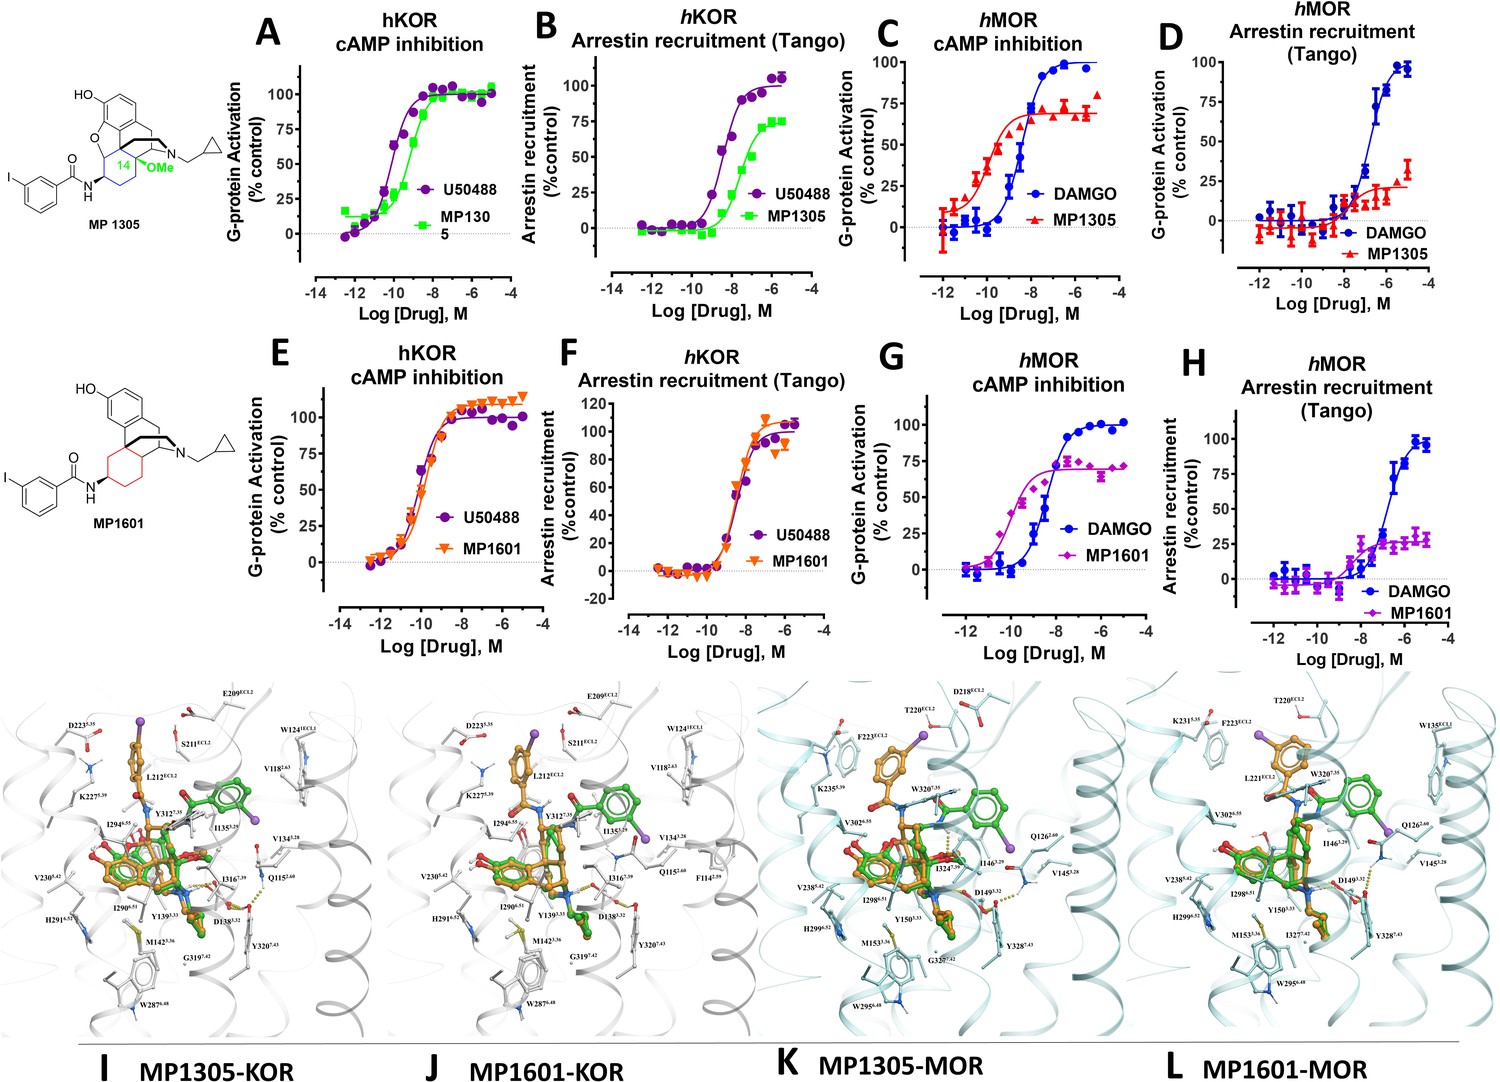
At human receptors, MP1305 is G-biased at MOR and KOR whereas MP1601 is G-biased at MOR and arrestin biased at KOR.
(A-B) MP1305 (green) is a full agonist at hKOR in cAMP inhibition (N = 6) and partial agonist in Tango-arrestin recruitment assays (N = 6) compared to U50,488H (purple) at hKOR. (C–D) MP1305 (red) is a partial agonist at hMOR in cAMP inhibition (N = 3) and partial agonist in Tango-arrestin recruitment assays (N = 3) compared to DAMGO (blue). (E–F) MP1601 (orange) is a full agonist at hKOR in cAMP inhibition (N = 6) and Tango-arrestin recruitment assays (N = 6) compared to U50,488H (purple). (G–H) Similarly, MP1601 (purple) is a partial agonist at hMOR in cAMP inhibition (N = 3) and Tango-arrestin recruitment assays (N = 3) compared to DAMGO (blue). (I–J) Molecular docking of MP1305 and MP1601 with a chair (orange stick) or a boat confirmation (green stick) at hKOR and hMOR. (K–L) Chair and boat forms of MP1305 and MP1601 at an active state hKOR (in gray) and Chair and boat forms of MP1305 and MP1601 at an active state hMOR (in cyan). Preferred docking modes of MP1305 and MP1601 are analogous and they both maintain chair confirmation at hMOR and are biased toward G protein, while being balanced agonists at hKOR taking boat conformation. See Appendix 1—table 9 for values, Appendix 1—figures 4 and Appendix 1—table 10 for bias calculations.
Appendix 1—figure 10
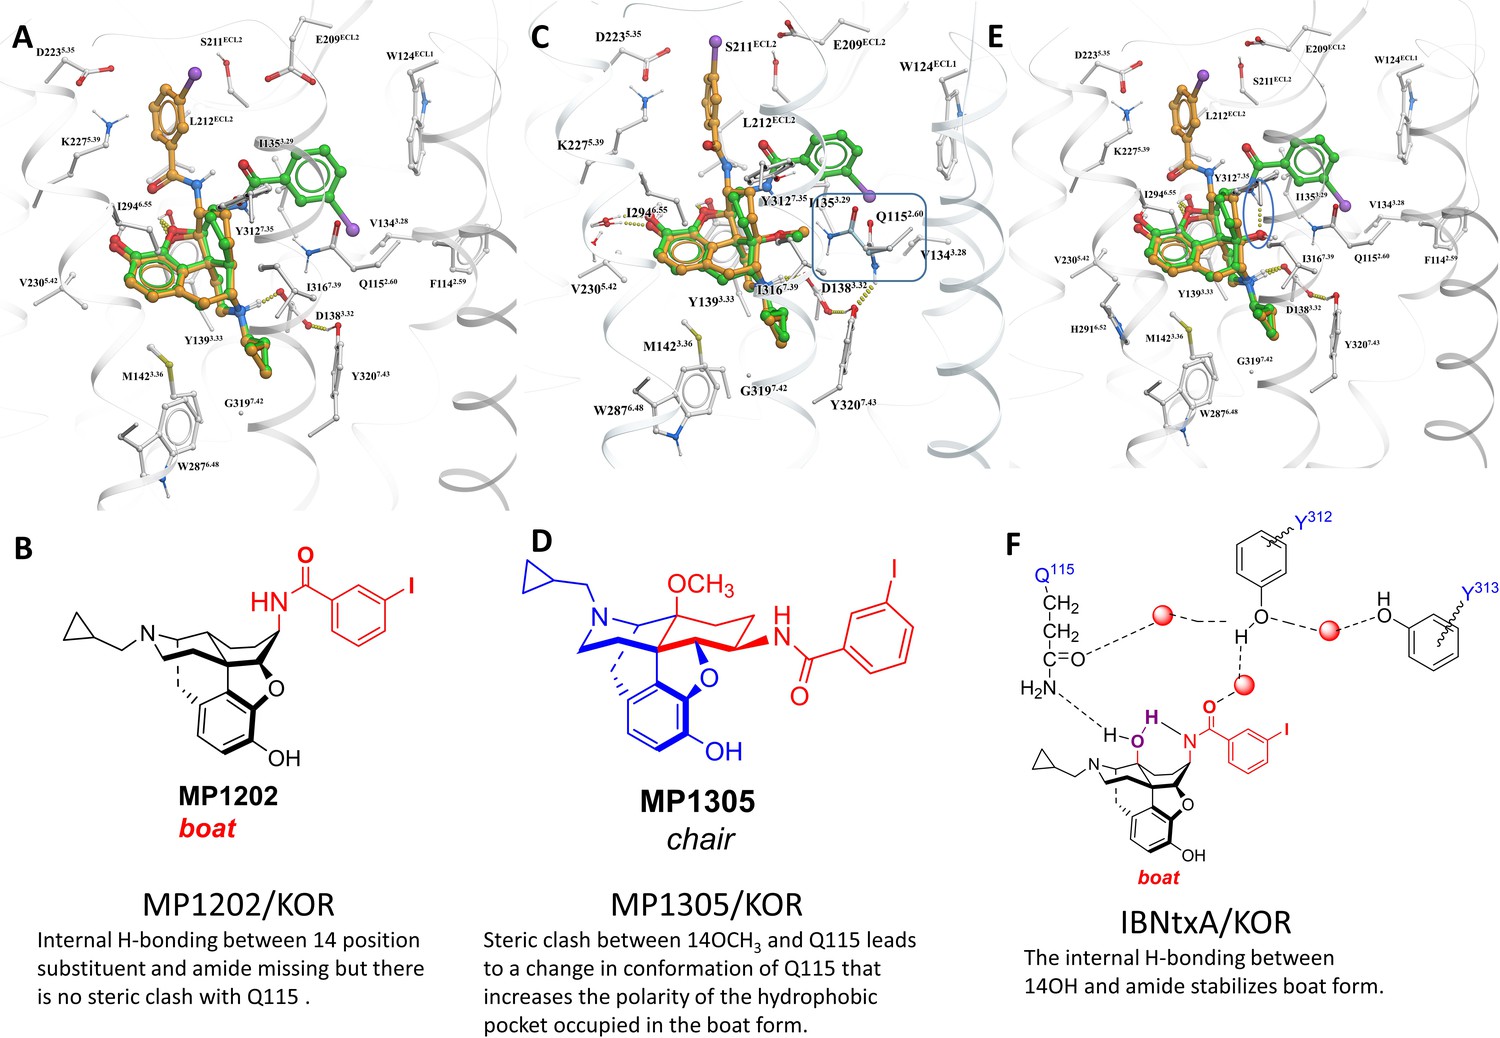
MP1305 is G protein biased at KOR.
Docking pose for ligands inside active state KOR shown in white carbon sticks and white ribbon representations. (A–B) MP1202 in KOR favors boat conformation. (C–D) MP1305 in KOR favors chair conformation. 14th-position-Methoxy of MP1305 causes sidechain of Q1152.60 residue to undergo a conformational change, when compared to ligands with non-Methoxy substitutions at 14th-position (shown in cyan colored carbon sticks representation). (E) IBNtxA in KOR favors boat conformation. (F) Stabilization of IBNtxA in boat form through internal hydrogen-bonding between 14-OH and amide and with Q1152.60 is shown. The docked and energy minimized pose of MP1305 shows the substitution of 14-OH with larger methoxy group displaces the conserved Q1152.60 of KOR. In ligands with 14-OH, the Q1152.60 residue of KOR is directed toward the ligand and forms hydrogen bonds with the 14-OH. In the case of MP1305, the methoxy group pushes Q1152.60 residue away to avoid steric clashes, and the polar terminus of the side chain ends up in the previously hydrophobic TM2-TM3 sub-pocket of KOR. Furthermore, due to internal ligand sterics, the internal hydrogen bond between the amide and 14-OH, as seen in compounds such as IBNtxA, is not possible for MP1305. The combination of these two factors, increasing polarity of the hydrophobic TM2-TM3 sub-pocket (an effect similar to Y312W6.35 KOR sub-pocket mutation- and lack of an internal hydrogen bond stabilizing the boat form, shifts the equilibrium toward the chair form for MP1305).
Appendix 1—figure 11
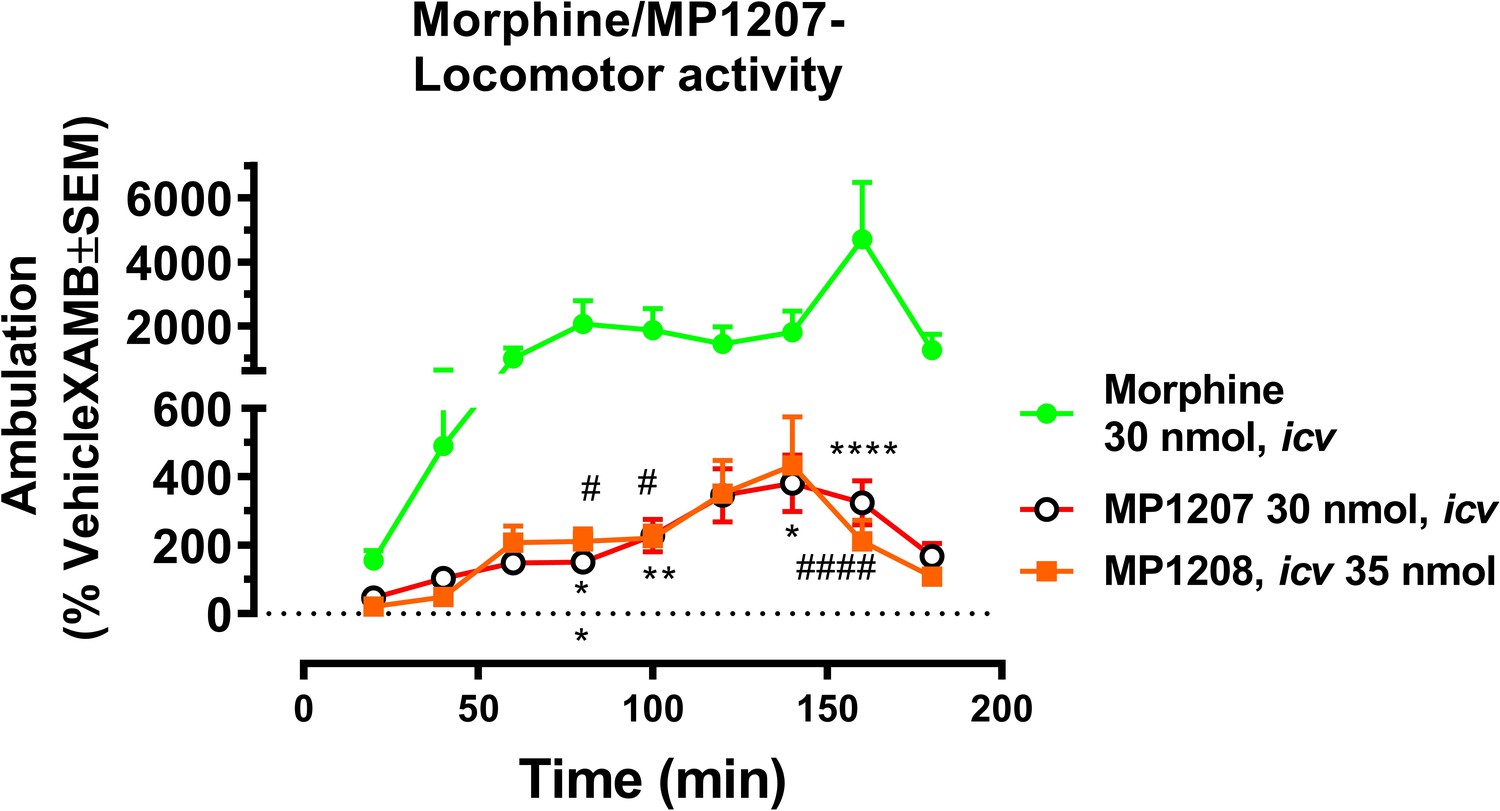
MP1207 and 1208 show significantly less hyperlocomotion compared to morphine.
Mice were administered icv either morphine (30 nmol; n = 18), MP1207 (30 nmol; n = 26) or MP1208 (35 nmol; n = 10) and the ambulation of each group of mice monitored using the CLAMS/Oxymax system. Morphine (30 nmol, icv) significantly increased forward ambulation in comparsion to MP1207 at 80 min (**p=0.002), 100 min (**p=0.01), 140 min (*p=0.03), and 160 min (****p<0.0001) as determined by two-way ANOVA followed by Dunnett’s multiple-comparison test. Similarly, significant morphine-induced increases in ambulation as compared to the response of MP1208 were observed at 80 min (#p=0.0249), 100 min (#p=0.0497), and 160 min (####p<0.0001) as determined by two-way ANOVA followed by Dunnett’s multiple-comparison test.
Appendix 1—scheme 1
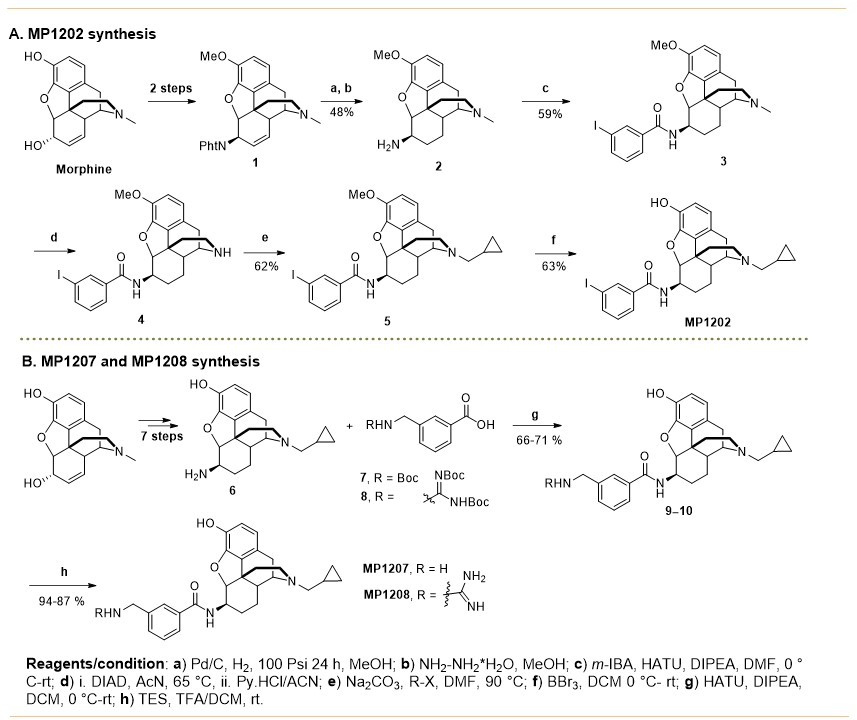
Synthesis of m-arylamido dihydromorphinans MP1202 (A), MP1207, MP1208 (B).
Appendix 1—scheme 2
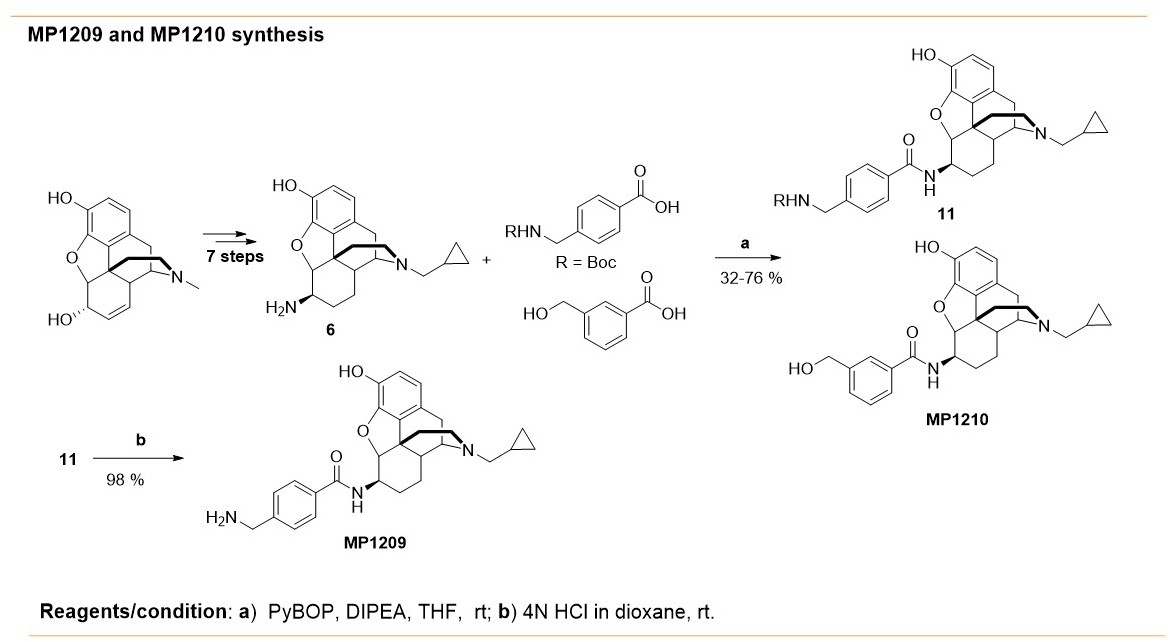
Synthesis of m-arylamido dihydromorphinans MP1210 and p-arylamido dihydromorphinan analog, MP1209.
Appendix 1—scheme 3
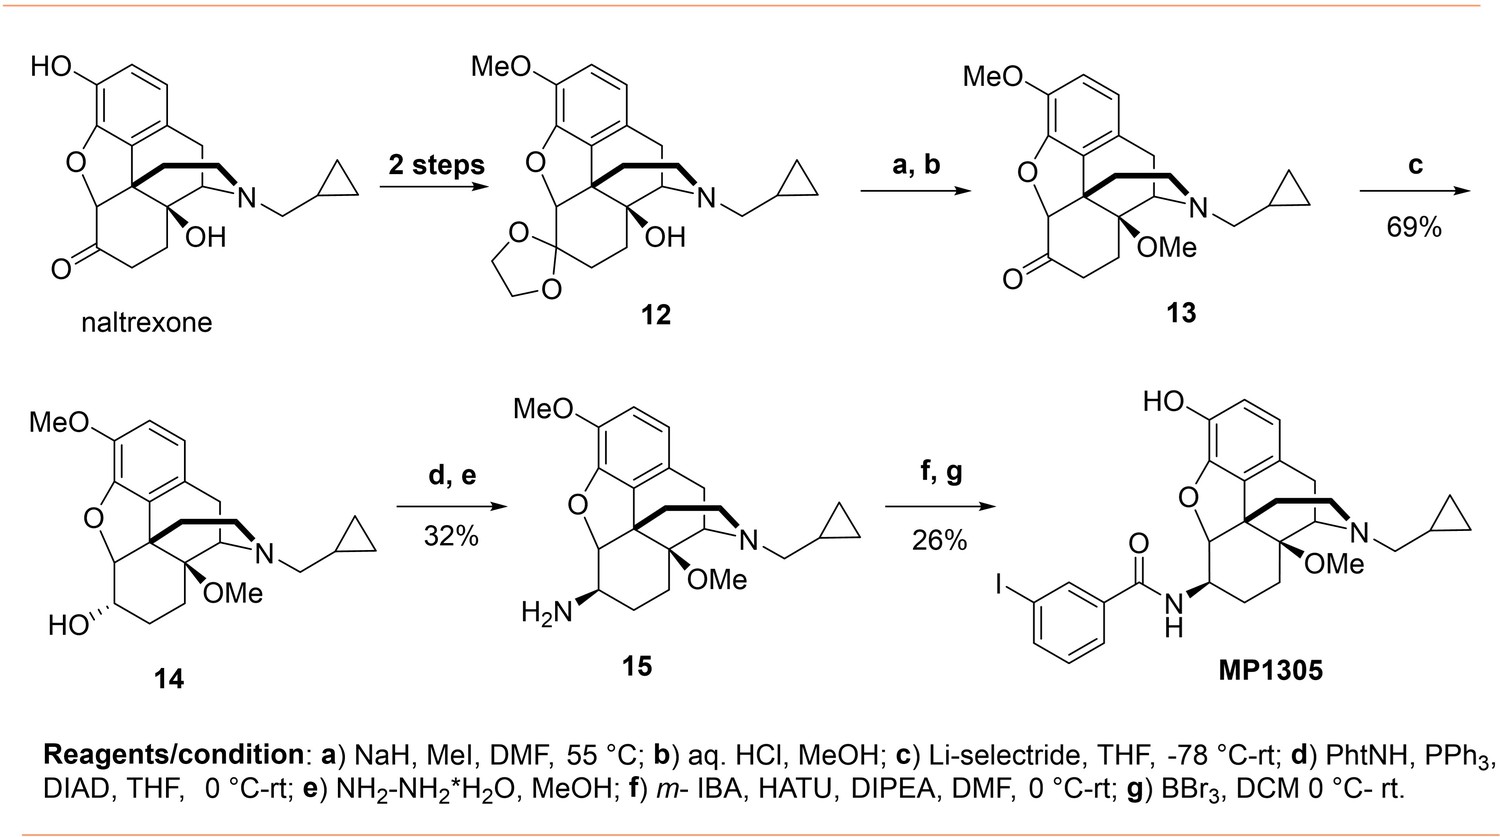
Synthesis of 14-O-methyl m-iodoarylamidomorphinan MP1305.
Appendix 1—scheme 4
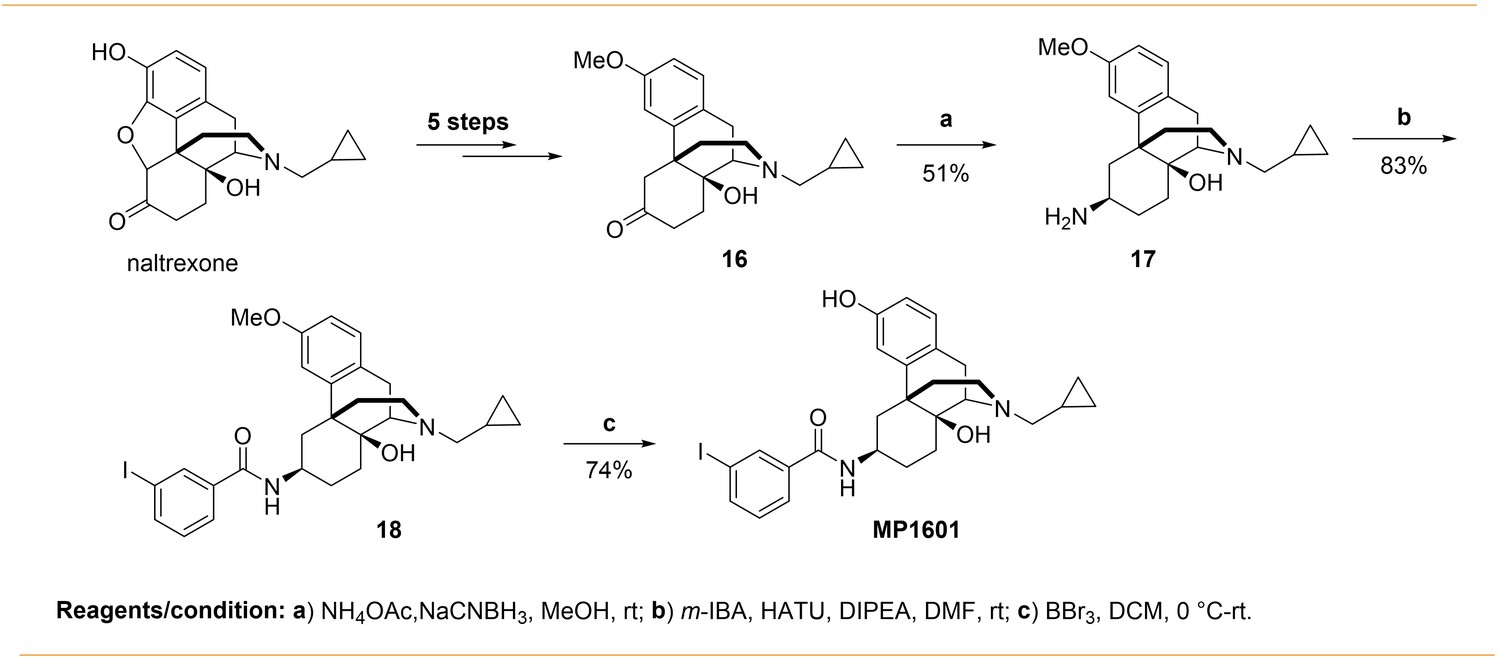
Synthesis of m-iodoarylamido-4,5-deoxymorphinan MP1601.
Author response image 1
Tables
Appendix 1—table 1
Receptor affinities of arylamidomorphinans in mouse opioid receptor transfected cell lines.
| Compd. | Ki [nM]a | ||||
|---|---|---|---|---|---|
| mMOR | mKOR | mDOR | |||
| IBNtxA | 0.11 ± 0.02 | 0.03 ± 0.001 | 0.24 ± 0.05 | ||
| MP1104 | 0.021 ± 0.00 | 0.0064 ± 0.0 | 0.08 ± 0.01 | ||
| MP1202 | 0.071 ± 0.031 | 0.11 ± 0.064 | 1.3 ± 0.8 | ||
| MP1207 | 0.23 ± 0.02 | 0.39 ± 0.05 | 15.62 ± 2.64 | ||
| MP1208 | 0.34 ± 0.01 | 0.28 ± 0.02 | 19.28 ± 6.48 | ||
| MP1305 | 0.25 ± 0.02 | 2.5 ±0.3 | 11.7 ± 1.4 | ||
| MP1601 | 0.2 ± 0.01 | 2.13 ± 0.3 | 5.37 ± 0.9 | ||
| Morphine | 4.60 ± 1.81b | _ | _ | ||
| DAMGO | 3.34 ± 0.43b | _ | _ | ||
| U50, 488h | _ | 0.73 ± 0.32b | _ | ||
| DPDPE | _ | _ | 1.39 ± 0.67b | ||
Appendix 1—table 2
[35S]GTPγS Functional assays in mouse opioid receptor transfected cell lines.
| Compd. | mMOR | mKOR | mDOR | |||||||
|---|---|---|---|---|---|---|---|---|---|---|
| EC50 (nM) | Emax (%) | EC50 (nM) | Emax (%) | EC50 (nM) | Emax (%) | IC50 (nM) | ||||
| IBNtxA | 0.49 ± 0.12 | 101 ± 3 | 0.22 ± 0.02 | 102 ± 4 | 4.08 ± 0.67 | 95 ± 2 | - | |||
| MP1104 | 0.21 ± 0.03 | 103 ± 2 | 0.027 ± 0.002 | 104 ± 2 | 0.41 ± 0.11 | 88 ± 0 | - | |||
| MP1202 | 0.32 ± 0.03 | 68 ± 1 | 0.13 ± 0.02 | 94 ± 5 | 4 ± 1.6 | 71 ± 2 | - | |||
| MP1207 | 1.29 ±0.65 | 41 ± 1 | 1.52 ± 0.07 | 39.3 ± 1.3 | nd | 10-15% | 27.34±1.95 | |||
| MP1208 | 1.13 ± 0.05 | 54 ± 0.7 | 1.36 ± 0.23 | 43 ± 0.8 | nd | 10-15% | 11.39±0.3 | |||
| MP1305 | 0.7 ± 0.1 | 81.2 ± 16 | 7.4 ± 1.8 | 42.2 ± 5.3 | 31.7 ± 3.6 | 22± 0.9 | - | |||
| MP1601 | 0.5 ± 0.2 | 45 ± 4.6 | 3 ± 0.7 | 72 ± 4.5 | 10 ± 1.6 | 67 ± 3.9 | - | |||
| DAMGO | 3.4 ± 0.2 | - | - | - | - | - | - | |||
| U50,488h | - | - | 9.5 ± 1.8 | - | - | - | - | - | ||
| DPDPE | - | - | - | - | 16.2 ± 5.1 | - | - | |||
| Morphine | 14.77±3.9 | 102±5 | - | - | - | - | - | |||
| Buprenorphineb | 1.8(1.3,2.3)c | Full agonistd | - | - | - | - | - | |||
Appendix 1—table 3
Energies for boat and chair conformations calculated by computational QM calculations for ligands.
| Ligand (Basis set) | Energy(Chair – Boat) HF |
Energy(Chair – Boat) kcal/mol | Energy(Chair – Boat) kJ/mol |
|---|---|---|---|
| MP1104 (LanL2DZ) | 0.03671637 | 23.0396323 | 96.3988294 |
| MP1104 (DGDZVP) | 0.03493887 | 21.9242457 | 91.7320032 |
| IBNtxA (LanL2DZ) | −0.0014450 | −0.90674184 | −3.7938475 |
| IBNtxA (DGDZVP) | −0.0016583 | −1.040599833 | −4.353869701 |
| MP1202 (LanL2DZ) | −0.01402513 | −8.8009031585 | −36.822978815 |
| MP1202 (DGDZVP) | −0.011652 | −7.31174652 | −30.59234743997 |
Appendix 1—table 4
Best docking scores of each ligand with a chair or a boat conformation at active state human mu and kappa opioid receptors.
| Drugs | MP1104 | IBNtxA | MP1202 | MP1207 | MP1208 | MP1305 | MP1601 | 6'GNTI | MP1209 | MP1210 |
|---|---|---|---|---|---|---|---|---|---|---|
| Docking score of Chair/hMOR | -36.22 | -52.42 | -55.04 | -69.74 | -38.63 | -40.61 | -51.03 | -44.17 | ||
| Boat /hMOR | -48.28 | -31.36 | -49.44 | -50.81 | -67.72 | -28.83 | -38.23 | -43.67 | -36.18 | |
| Chair /hKOR | -46.93 | -47.82 | -55.99 | -86.24 | -46.77 | -46.08 | -64.86 | -57.63 | -53.91 | |
| Boat /hKOR | -55.06 | -49.51 | -52.42 | -45.9 | -65.88 | -44.87 | -47.54 | -60.77 | -55.43 |
Appendix 1—table 5
Docking scores for proposed analogs of MP1202, where m-iodo group is substituted with a polar moiety (R).
| Serial | R | Chair score | Boat score | Scores for chair preference |
|---|---|---|---|---|
| 1 | -mNH2 | −55.35 | −58.47 | +3.12 |
| 2 | -mN(CH3)2 | −51.81 | −48.34 | −3.47 |
| 3 | -mOH | −54.81 | −57.34 | +2.53 |
| 4 (MP1207) | -mCH2NH2 | −55.99 | −45.9 | −10.09 |
| 5 | -mCH2CH2NH2 | −59.42 | −51.79 | −7.63 |
| 6 | -mCH2CH2CH2NH2 | −64.07 | −49.91 | −14.16 |
| 7 | -mCH2CH2CH2CH2NH2 | −52.42 | −49.67 | −2.75 |
| 8 | -mgaunidine | −76.29 | −66.34 | −9.95 |
| 9 (MP1208) | -mCH2guanidine | −86.24 | −65.88 | −20.36 |
| 10 | -mCOguanidine | −82.09 | −77.53 | −4.56 |
| 11 | -pCH2NH2 | −57.63 | −60.77 | +3.14 |
| 12 | -mCH2OH | −53.91 | −55.43 | +1.5 |
Appendix 1—table 6
Functional data at hDOR and mDOR.
| Functional data at hDOR and mDOR | |||||
|---|---|---|---|---|---|
| Compd. | cAMP inhibition | Arrestin recruitment | |||
| EC50,nM (pEC50± SEM) | Emax%± SEM | EC50,nM (pEC50± SEM) | Emax%± SEM | ||
| IBNtxA | 0.43 (9.3 ± 0.03) | 106 ± 1 | 14.1(7.8 ± 0.06) | 224±5 | |
| DPDPE (CTRL.) | 0.69 (9.1 ± 0.07) | 100 ± 2 | 2.99(8.5 ± 0.04) | 100±1.5 | |
| MP1104 | 0.40 (9.4 ± 0.04) | 99 ± 1.1 | 3.73 (8.4 ± 0.06) | 189 ± 5.5 | |
| DADLE (CTRL.) | 0.66(9.2 ± 0.05) | 100 ± 1.3 | 0.349 (9.45 ± 0.10) | 100 ± 3.2 | |
| MP1202 | 8.18(8.1 ± 0.06) | 99 ± 2.2 | 18.14(7.7 ± 0.25) | 26 ± 3.1 | |
| DADLE (CTRL.) | 1.45(8.8 ± 0.06) | 100 ± 2 | 8.41(8.1 ± 0.08) | 100 ± 2.7 | |
| MP1207 | 11.4 (7.9 ± 0.1) | 38 ± 2 | 64.06(7.2 ± 0.23) | 34 ± 3.7 | |
| MP1208 | 2.49 (8.6 ± 0.13) | 39 ±1.8 | 3624.0(5.5 ± 0.27) | 62±16.7 | |
| DADLE (CTRL.) | 0.48 (9.3 ± 0.05) | 100 ±1.5 | 1.41 (8.8 ± 0.07) | 100±2.3 | |
| MP1305 | 74.18 (7.1 ± 0.08) | 71 ± 2.4 | 227.5(6.6 ± 0.06) | 89 ± 2.8 | |
| MP1601 | 2.76(8.6 ± 0.06) | 106 ± 2.3 | 86.7(7.1 ± 0.06) | 203±5.4 | |
| DPDPE(CTRL.) | 0.69 (9.1 ± 0.07) | 100 ± 2 | 2.99(8.5 ± 0.04) | 100±1.5 | |
| B. Functional data at mDOR using BRET assays | |||||
| Compd. | G protein activation | Arrestin recruitment | |||
| EC50,nM (pEC50± SEM) | Emax%± SEM | EC50,nM (pEC50± SEM) | Emax%± SEM | ||
| IBNtxA | 0.48(9.3 ± 0.10) | 108 ± 3.7 | 26.6(7.5 ± 0.2) | 88 ± 6.8 | |
| DPDPE(CTRL.) | 2.72(8.5 ± 0.09) | 100 ± 3 | 184.3(6.73 ± 0.1) | 100 ± 6.4 | |
| MP1104 | 1.4(8.9 ± 0.06) | 91 ± 1.7 | 26.0(7.6 ± 0.11) | 40 ± 1.7 | |
| DPDPE(CTRL.) | 1.3(8.9 ± 0.04) | 100 ± 1.2 | 98.0(7.0 ± 0.04) | 100 ± 1.8 | |
| MP1202 | 7.03(8.1 ± 0.15) | 103 ± 4.6 | 524.8(6.3 ± 0.20) | 26 ± 2.3 | |
| DPDPE(CTRL.) | 2.19(8.6 ± 0.10) | 100 ± 3.5 | 109.3(6.7 ± 0.06) | 100 ± 3 | |
| MP1207 | 116.4(6.9 ± 0.12) | 52 ± 2.3 | nd | nd | |
| MP1208 | 26.6(7.6 ± 0.20) | 58 ± 3.3 | nd | nd | |
| MP1305 | 40.4(7.4 ± 0.20) | 105 ± 5.9 | nd | nd | |
| MP1601 | 6.27(8.2 ± 0.20) | 105 ± 6.7 | 9.0 (8.0 ± 0.33) | 16 ± 1.4 | |
| DPDPE(CTRL.) | 0.44(9.3 ± 0.13) | 100 ± 2.5 | 21.8 (7.6 ± 0.04) | 100 ± 1.3 | |
Appendix 1—table 7
Gprotein & arrestin pathway potency and efficacy of ligands at hMOR, hKOR and mMOR.
| Receptors | Compounds | cAMP inhibition (Gi) assay | Arrestin recruitment (Tango) assay | Figure | ||
|---|---|---|---|---|---|---|
| EC50 (pEC50± SEM) | Emax%± SEM | EC50 (pEC50± SEM) | Emax%± SEM | |||
| hMOR | MP1104 | 0.074 (10.13 ± 0.05) nM | 94±1 | 0.573(9.24±0.08) nM | 90±2.28 | Figure 2A–B |
| DAMGO | 0.84(9.07±0.08) nM | 100 | 13.9 (7.86±0.06) nM | 100 | ||
| hKOR | MP1104 | 0.00327 (11.49±0.035) nM | 10±1.64 | 0.03944(10.4±0.06) nM | 117 ± 2 | Figure 2C–D |
| U50488h | 0.089(10.05±0.04) nM | 100 | 3.6(8.44±0.04) nM | 100 | ||
| hMOR | MP1202 | 0.077 (10.11 ± 0.06) nM | 92±1.4 | 26.8(7.57±0.1) nM | 53±2 | Figure 2G–H |
| DAMGO | 3.78(8.4±0.06) nM | 100 | 58.8(7.23±0.06) nM | 100 | ||
| hKOR | MP1202 | 0.00139 (11.86±0.05) nM, | 97.9±2.5 | 0.0457(10.34±0.05) nM | 101±1 | Figure 2I–J |
| U50,488h | 0.006 (10.2±0.056) nM | 100 | 3.6(8.44±0.04) nM | 100 | ||
| hKOR | MP1207 | 0.11 (9.98 ± 0.07) nM | 90±1.7 | 3.97(8.4±0.18) nM | 37±2 | Figure 3A–B |
| MP1208 | 0.14 (9.9 ± 0.07) nM | 96±1.9 | 16.41(7.79±0.14) nM | 48±2.4 | ||
| U50,488h | 0.64(9.2±0.06) nM | 100 | 7.55(8.12±0.06) nM | 100 | ||
| hMOR | MP1207 | 0.034 (10.47 ± 0.15) nM | 33±1.4 | nd | nd | Figure 3E–F |
| MP1208 | 0.008 (8.73 ± 0.12) nM | 42±1.3 | nd | nd | ||
| U50,488h | 1.86(8.73±0.06) nM | 100 | ||||
| hKOR | MP1209 | 0.024 (10.6 ± 0.05) nM | 100±1.23 | 0.37(9.43 ± 0.19) nM | 67±3 | Figure 4E–F |
| MP1210 | 0.025 (10.6 ± 0.05) nM | 101.1±1.1 | 1.16 (8.94 ± 0.17) nM | 63±3.3 | ||
| U50,488h | 0.05 (10.29±0.06) nM | 100 | 7.85 (8.11±0.1) nM. | 100 | ||
| hMOR | MP1209 | 0.25(9.61 ± 0.04) nM | 98.5±0.96 | nd | nd | Figure 4G–H |
| MP1210 | 0.15(9.81 ± 0.05) nM | 94.6±0.98 | nd | nd | ||
| DAMGO | 0.2 (9.7±0.06) nM | 100 | ||||
| hMOR | Methoxycarbonyl fentanyl | 0.099 (10 ± 0.06) nM | 103±1.8 | 18.94 (7.7±0.1) nM | 194±8 | Appendix 1—figure 8A–B |
| DAMGO | 2.58 (8.59±0.07) nM | 100 | 404.1(6.39±0.05) nM | 100 | ||
| hMOR | MP102 | 19.7(7.7 ± 0.08) nM | 87±2.66 | nd | nd | Appendix 1—figure 8F–G |
| DAMGO | 2.58 (8.59±0.07) nM | 100 | ||||
| Morphine | 21.8 (7.66 ± 0.08) nM | 97±3.06 | 888 (6.05±0.25) nM | 25.32±4.4 | ||
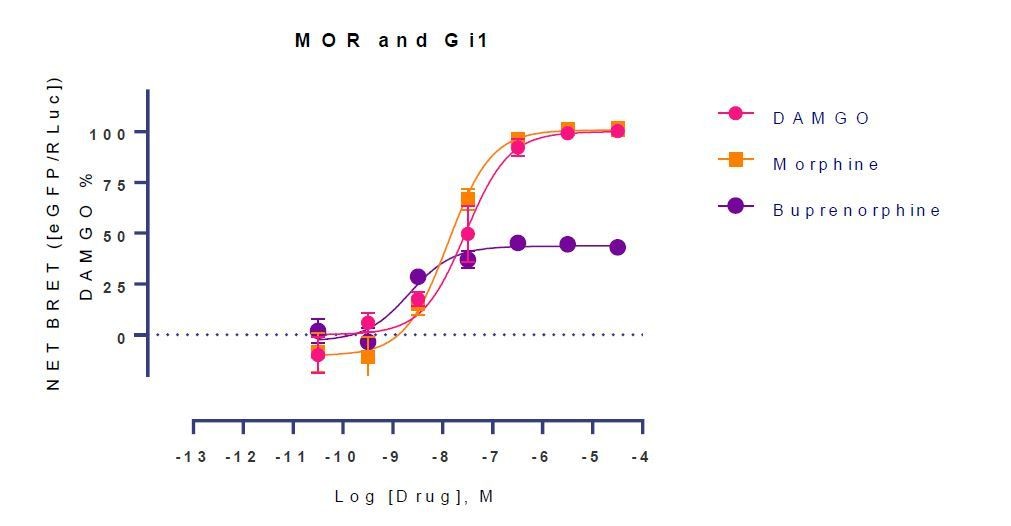
| hMOR | DAMGO | 8.1 (8.09 ± 0.06) nM | 100 | 140.7 (6.85±0.08) nM | 100 | |
| Buprenorphine | 0.7 (10.14 ± 0.11) pM | 75±2.36 | 1.79 (8.75±0.13) nM | 43±2 | ||
| DAMGO | 4.36 (8.36 ± 0.08) nM | 100 | 22 (7.64±0.063) nM | 100 | ||
| Receptors | Compounds | G protein activation (BRET) assay | Arrestin recruitment (BRET) assay | Figure | ||
| EC50 (pEC50± SEM) | Emax%± SEM | EC50 (pEC50± SEM) | Emax%± SEM | |||
| mMOR | MP1207 | 3.61 (8.44 ± 0.26) nM | 42±2.6 | nd | nd | Figure 3I–J |
| MP1208 | 2.27 (8.64 ± 0.29) nM | 41±3 | nd | nd | ||
| DAMGO | 3.27(8.49±0.08) nM | 100 | ||||
| DAMGO | 9.09 (8.04 ± 0.13) nM | 100 | ||||
| mMOR | Morphine | 9.09 (8.04 ± 0.13) nM | 109±3.1 | |||
| Buprenorphine | 1.17 (8.93 ± 0.14) nM | 59±2.4 | ||||
Appendix 1—table 8
Gprotein & arrestin pathway potency and efficacy of ligands at mMOR and rKOR.
| Receptors | Compound | G protein activation (BRET) assay | Arrestin recruitment (BRET) assay | Figure | |||
|---|---|---|---|---|---|---|---|
| EC50 (pEC50± SEM) | Emax%± SEM | EC50 (pEC50± SEM) | Emax%± SEM | ||||
| mMOR | MP1104 | 0.66 (9.2±0.11) nM | 62±2 | 0.285 (9.55±0.12) nM | 53 ± 1.6 | Appendix 1—figure 1A | |
| DAMGO | 7.3 (8.1±0.07) nM | 100 | 31.5 (7.5±0.06) nM | 100 | |||
| IBNtxA | 0.054(10.3 ± 0.02) nM | 59±2.2 | 11.32(4.9±0.3) µM | 75±13.9 | Appendix 1—figure 1B | ||
| DAMGO | 12.9(7.8±0.06) nM | 100 | 0.77(6.11±0.16) µM | 100 | |||
| MP1202 | 0.63 (9.2±0.09) nM | 61±1.5 | 3140 (5.5±0.28) nM | 53 ± 1.6 | Appendix 1—figure 1C | ||
| DAMGO | 6.31 (8.2±0.07) nM | 100 | 114 (6.9±0.15) nM | 100 | |||
| MP1207 | 3.61 (8.44 ± 0.26) nM | 42±2.6 | nd | nd | Appendix 1—figure 1D | ||
| MP1208 | 2.27 (8.64 ± 0.29) nM | 41±3 | nd | nd | |||
| DAMGO | 3.27(8.49±0.08) nM | 100 | |||||
| MP1305 | 0.74(9.1 ± 0.12) nM | 72±2 | nd | nd | Appendix 1—figure 1E | ||
| DAMGO | 3.3(8.4±0.08) nM | 100 | |||||
| MP1601 | 2.2(8.6 ± 0.3) nM | 49±3 | nd | nd | |||
| DAMGO | 0.9(9.0±0.1) nM | 100 | |||||
| rKOR | MP1104 | 0.073 (10.14±0.04) nM | 93±1 | 1.14(8.94±0.07) nM | 89 ± 2.6 | Appendix 1—figure 2A | |
| U50, 488h | 1.05(8.98±0.03) nM | 100 | 110(6.95±0.05) nM | 100 | |||
| IBNtxA | 0.064(10.2 ± 0.1) nM | 101±2.3 | 1.23(8.9±0.02) nM | 133±7.3 | Appendix 1—figure 2B | ||
| U50, 488h | 27.7(7.6±0.01)nM | 100 | 345.6(6.4±0.03) nM | 100 | |||
| MP1202 | 0.134(9.87±0.09) nM | 104±2 | 1.44(8.84±0.25) nM | 77 ± 5 | Appendix 1—figure 2C | ||
| U50, 488h | 4.79 (8.32±0.07) nM | 100 | 235(6.63±0.18) nM | 100 | |||
| MP1207 | 1.13 (8.95 ± 0.31) nM | 32±2.3 | nd | nd | Appendix 1—figure 2D | ||
| MP1208 | 1.1(8.97 ± 0.29) nM | 40±2.4 | nd | nd | |||
| U50, 488h | 82.6(7.1±0.09) nM | 100 | |||||
| MP1305 | 5.04 (8.3 ± 0.32) nM | 35±3 | nd | nd | Appendix 1—figure 2E | ||
| U50, 488h | 40.3(7.4±0.07) nM | 100 | |||||
| MP1601 | 8.9(8.1 ± 0.12) nM | 75±3 | 56.5(7.2±0.23) nM | 37±3 | |||
| U50, 488h | 26.7(7.6±0.09) nM | 100 | 169.6(6.7±0.07) nM | 100 | |||
| mMOR | IBNtxA | 0.054(10.3 ± 0.02) nM | 59±2.2 | 11.32(4.9±0.3) µM | 75±13.9 | Figure 3F–G | |
| DAMGO | 12.9(7.8±0.06) nM | 100 | 0.77(6.11±0.16) µM | 100 | |||
| rKOR | IBNtxA | 0.064(10.2 ± 0.1) nM | 101±2.3 | 1.23(8.9±0.02) nM | 133±7.3 | Figure 3H–I | |
| U50, 488h | 27.7(7.6±0.01) nM | 100 | 345.6(6.4±0.03) nM | 100 | |||
| mMOR | Methoxycarbonyl fentanyl | 0.21(9.7 ± 0.04) nM | 109±0.94 | 1.96(8.71±0.11) nM | 63±1.8 | Appendix 1—figure 7C–D | |
| DAMGO | 1.73(8.76±0.05) nM | 100 | 110.1(6.96±0.06) nM | 100 | |||
| MP102 | 404.5 (6.39 ± 0.2) nM | 78±7 | nd | nd | Appendix 1—figure 7E | ||
| DAMGO | 3.27(8.5±2) nM | 100 | |||||
Appendix 1—table 9
cAMP & arrestin potency and efficacy at hMOR, hKOR and Y312W-hKOR of select ligands.
| Receptors | Compounds | cAMP inhibition (Gi) assay | Arrestin recruitment (Tango) assay | Figure | |||
|---|---|---|---|---|---|---|---|
| EC50 (pEC50± SEM) | Emax%± SEM | EC50 (pEC50± SEM) | Emax%± SEM | ||||
| hMOR | IBNtxA | 0.07(10.2 ± 0.006) nM | 95±2 | 5.86(8.2±0.002) nM | 29±0.02 | Appendix 1—figure 3A-B | |
| DAMGO | 0.99(9.0±0.007) nM | 100 | 14.16(7.9±0.003) nM | 100 | |||
| hKOR | IBNtxA | 2.46 (11.6 ± 0.037) pM | 101±1.79 | 0.013(10.9±0.07) nM | 109±1.8 | Appendix 1—figure 3C-D | |
| U50488h | 0.089(10.05±0.042) nM | 100 | 3.63(8.4±0.03) nM | 100 | |||
| Y312W-hKOR | MP1202 | 0.21 (10.69 ± 0.07)pM | 101±1.5 | 3.4(8.5±0.14) nM | 55±2.6 | Appendix 1—figure 7A,C | |
| U50,488h | 2.7(8.56±0.06)nM | 100 | 0.63(7.2±0.06) nM | 100 | |||
| WT-hKOR | MP1202 | 0.0457(10.34±0.05) nM | 101±1 | Appendix 1—figure 7B,D | |||
| U50,488h | 3.6(8.44±0.04) nM | 100 | |||||
| WT-hMOR | MP1202 | 26.8(7.57±0.1) nM | 53±2 | ||||
| DAMGO | 58.8(7.23±0.06) nM | 100 | |||||
| Y312W-hKOR | MP1207 | 0.16 (9.8 ± 0.08) nM | 95±1.8 | nd | nd | Appendix 1—figure 7E,G | |
| MP1208 | 0.36 (10.44 ± 0.05) pM | 97±1 | nd | nd | |||
| U50,488h | 0.92(9.04±0.04)nM | 100 | 14(7.85±0.1) nM | 100 | |||
| WT-hKOR | MP1207 | 3.97(8.4±0.18) nM | 37±2 | nd | nd | Appendix 1—figure 7F | |
| MP1208 | 16.41(7.79±0.14) nM | 48±2.4 | nd | nd | |||
| U50,488h | 7.55(8.12±0.06) nM | 100 | |||||
| hKOR | MP1305 | 0.72 (9.14 ± 0.05) nM | 102±1.2 | 25.72(7.6±0.04) nM | 75±1 | Appendix 1—figure 9A-B | |
| U50, 488h | 0.076(10.11±0.04) nM | 100 | 3.6(8.44±0.04) nM | 100 | |||
| hMOR | MP1305 | 0.12(9.9 ± 0.12) nM | 69±1.8 | 16.4(7.8±0.3) nM | 21±3 | Appendix 1—figure 9C-D | |
| DAMGO | 3.88(8.4±0.05) nM | 100 | 168.1(6.77±0.09) nM | 100 | |||
| hKOR | MP1601 | 0.17(9.76 ± 0.05) nM | 109±1 | 3.23(8.49±0.07) nM | 107±3 | Appendix 1—figure 9E-F | |
| U50, 488h | 0.077(10.11±0.04) nM | 100 | 3.6(8.44±0.04) nM | 100 | |||
| hMOR | MP1601 | 0.1(9.99 ± 0.09) nM | 69±1 | 4.02(8.4±0.2) nM | 27±2 | Appendix 1—figure 9G-H | |
| DAMGO | 3.88(8.4±0.05) nM | 100 | 168.1(6.77±0.09) nM | 100 | |||
Appendix 1—table 10
Bias analysis of ligands at human opioid receptors.
| Drug | Receptor | cAMP | Tango | ΔlogRA | ΔlogRA | ΔΔlog RA | Bias factor | Figure |
|---|---|---|---|---|---|---|---|---|
| Log RA | LogRA | cAMP | Tango | (cAMP-Tango) | (cAMP-Tango) | |||
| U50,488h | hKOR | 10.09±0.035 | 8.29±0.019 | 0±0.049 | 0±0.027 | 0±0.056 | 1 | Appendix 1—figure 4A |
| MP1104 | hKOR | 11.44±0.034 | 10.45±0.019 | 1.35±0.048 | 2.16±0.027 | -0.81±0.055 | 0.15 | |
| U50,488h | hKOR | 10.22±0.051 | 8.44±0.004 | 0±0.072 | 0±0.006 | 0±0.070 | 1 | Appendix 1—figure 4A |
| MP1202 | hKOR | 11.88±0.050 | 10.30±0.004 | 1.66±0.072 | 1.856±0.006 | -0.19±0.072 | nd | |
| U50,488h | hKOR | 10.06±0.036 | 8.36±0.011 | 0±0.051 | 0±0.015 | 0±0.050 | 1 | Appendix 1—figure 4A |
| IBNtxA | hKOR | 11.59±0.036 | 10.89±0.010 | 1.53±0.050 | 2.53±0.015 | -1.002±0.052 | 0.10 | |
| U50,488h | hKOR | 9.175±0.004 | 8.14±0.007 | 0±0.005 | 0±0.010 | 0±0.012 | 1 | Appendix 1—figure 4A |
| MP1207 | hKOR | 9.902±0.004 | 7.97±0.024 | 0.73±0.006 | -0.176±0.025 | 0.903±0.026 | 8.00 | |
| U50,488h | hKOR | 9.176±0.004 | 8.14±0.008 | 0±0.005 | 0±0.011 | 0±0.012 | 1 | Appendix 1—figure 4A |
| MP1208 | hKOR | 9.83±0.004 | 7.447±0.020 | 0.65±0.005 | -0.697±0.022 | 1.35±0.022 | 22 | |
| U50,488h | hKOR | 10.42±0.06 | 8.37±0.22 | 0±0.084 | 0±0.31 | 0±0.32 | 1 | Appendix 1—figure 4A |
| MP1209 | hKOR | 10.55±0.06 | 8.735±0.220 | 0.13±0.084 | 0.368±0.31 | -0.238±0.32 | nd | |
| U50,488h | hKOR | 10.39±0.06 | 8.096±0.084 | 0±0.081 | 0±0.12 | 0±0.144 | 1 | Appendix 1—figure 4A |
| MP1210 | hKOR | 10.59±0.06 | 8.576±0.156 | 0.2±0.081 | 0.48±0.18 | -0.28±0.19 | nd | |
| U50,488h | hKOR | 10.010±0.012 | 8.507±0.026 | 0±0.017 | 0±0.037 | 0±0.041 | 1 | Appendix 1—figure 4A |
| MP1305 | hKOR | 9.22±0.012 | 7.17±0.025 | -0.79±0.017 | -1.341±0.036 | 0.55±0.04 | 4 | |
| U50,488h | hKOR | 10.03±0.014 | 8.414±0.009 | 0±0.020 | 0±0.012 | 0±0.023 | 1 | Appendix 1—figure 4A |
| MP1601 | hKOR | 9.85±0.014 | 8.51±0.009 | -0.19±0.020 | 0.097±0.012 | -0.282±0.023 | 0.52 | |
| DAMGO | hMOR | 9.102±0.009 | 7.925±0.013 | 0±0.012 | 0±0.019 | 0±0.022 | 1 | Appendix 1—figure 4B |
| MP1104 | hMOR | 10.12±0.009 | 9.18±0.013 | 1.018±0.012 | 1.26±0.019 | -0.24±0.022 | 0.58 | |
| DAMGO | hMOR | 8.44±0.011 | 7.18±0.001 | 0±0.015 | 0±0.001 | 0±0.015 | 1 | Appendix 1—figure 4B |
| MP1202 | hMOR | 9.99±0.012 | 7.24±0.002 | 1.55±0.016 | 0.058±0.002 | 1.49±0.016 | 31 | |
| DAMGO | hMOR | 8.86±0.075 | 7.82±0.060 | 0±0.106 | 0±0.084 | 0±0.135 | 1 | Appendix 1—figure 4B |
| IBNtxA | hMOR | 9.99±0.081 | 7.572±0.25 | 1.14±0.11 | -0.25±0.25 | 1.38±0.28 | 24 | |
| DAMGO | hMOR | 8.62±0.054 | 6.78±0.010 | 0±0.076 | 0±0.014 | 0±0.077 | 1 | Appendix 1—figure 4B |
| MP1305 | hMOR | 9.79±0.053 | 6.89±0.048 | 1.17±0.076 | 0.109±0.049 | 1.059±0.090 | 11 | |
| DAMGO | hMOR | 8.40±0.001 | 6.78±0.009 | 0±0.002 | 0±0.012 | 0±0.013 | 1 | Appendix 1—figure 4B |
| MP1601 | hMOR | 9.84±0.002 | 7.65±0.035 | 1.44±0.002 | 0.87±0.036 | 0.57±0.036 | 4 | |
| U50,488h | WT hKOR | 10.22±0.051 | 8.44±0.004 | 0±0.072 | 0±0.006 | 0±0.070 | 1 | Appendix 1—figure 7L |
| MP1202 | WT hKOR | 11.88±0.050 | 10.30±0.004 | 1.66±0.072 | 1.856±0.006 | -0.19±0.072 | nd | |
| U50,488h | Y312W-hKOR | 8.568±0.005 | 7.559±0.051 | 0±0.007 | 0±0.072 | 0±0.073 | 1 | Appendix 1—figure 7L |
| MP1202 | Y312W-hKOR | 10.63±0.005 | 8.091±0.051 | 2.062±0.007 | 0.532±0.073 | 1.53±0.073 | 34 | |
| DAMGO | hMOR | 8.563±0.004 | 5.037±0.176 | 0±0.006 | 0±0.249 | 0±0.249 | 1 | Appendix 1—figure 8J |
| Methoxycarbonyl | hMOR | 10.020±0.004 | 7.546±0.184 | 1.457±0.006 | 2.509±0.255 | -1.052±0.255 | 0.09 | |
| fentanyl |
Appendix 1—table 11
Bias analysis of ligands at rodent opioid receptors.
| Drug | Receptor | BRET-G | BRET-Arr | ΔlogRA | ΔlogRA | ΔΔlog RA | Bias factor | Figure | |
|---|---|---|---|---|---|---|---|---|---|
| Log RA | LogRA | BRET-G | BRET-arr | (BRETG-BRETArr) | (BRETG-BRETArr) | ||||
| U50,488h | rKOR | 9.003±0.044 | 7.14±0.034 | 0±0.062 | 0±0.047 | 0±0.078 | 1 | Appendix 1—figure 4C | |
| MP1104 | rKOR | 10.07±0.047 | 8.84±0.033 | 1.067±0.064 | 1.702±0.047 | -0.64±0.079 | 0.23 | ||
| U50,488h | rKOR | 8.312±0.077 | 6.798±0.168 | 0±0.109 | 0±0.238 | 0±0.261 | 1 | Appendix 1—figure 4C | |
| MP1202 | rKOR | 9.906±0.088 | 8.791±0.171 | 1.594±0.117 | 1.993±0.239 | -0.399±0.27 | nd | ||
| U50,488h | rKOR | 7.55±0.103 | 5.988±0.222 | 0±0.146 | 0±0.313 | 0±0.345 | 1 | Appendix 1—figure 4C | |
| IBNtxA | rKOR | 10.19±0.141 | 8.846±0.266 | 2.64±0.175 | 2.858±0.346 | -0.218±0.388 | nd | ||
| U50,488h | rKOR | 7.593±0.012 | 6.783±0.005 | 0±0.016 | 0±0.007 | 0±0.018 | 1 | Appendix 1—figure 4C | |
| MP1601 | rKOR | 7.917±0.018 | 7.113±0.052 | 0.324±0.052 | 0.33±0.052 | -0.006±0.057 | nd | ||
| DAMGO | mMOR | 8.56±0.12 | 7.873±0.06 | 0±0.176 | 0±0.09 | 0±0.197 | 1 | Appendix 1—figure 4C | |
| MP1104 | mMOR | 8.917±0.12 | 9.196±0.06 | 0.357±0.173 | 1.323±0.09 | -0.966±0.195 | 0.11 | ||
| DAMGO | mMOR | 8.713±0.013 | 7.291±0.044 | 0±0.019 | 0±0.063 | 0±0.066 | 1 | Appendix 1—figure 8J | |
| Methoxycarbonyl | mMOR | 9.697±0.013 | 8.464±0.045 | 0.984±0.019 | 1.173±0.063 | -0.189±0.066 | nd | ||
| fentanyl | |||||||||
Additional files
-
Source data 1
Analgesia and CLAMS data.
- https://cdn.elifesciences.org/articles/56519/elife-56519-data1-v2.zip
-
Transparent reporting form
- https://cdn.elifesciences.org/articles/56519/elife-56519-transrepform-v2.docx
Download links
A two-part list of links to download the article, or parts of the article, in various formats.
Downloads (link to download the article as PDF)
Open citations (links to open the citations from this article in various online reference manager services)
Cite this article (links to download the citations from this article in formats compatible with various reference manager tools)
Controlling opioid receptor functional selectivity by targeting distinct subpockets of the orthosteric site
eLife 10:e56519.
https://doi.org/10.7554/eLife.56519


