Growth cone-localized microtubule organizing center establishes microtubule orientation in dendrites
- Department of Biology, Stanford University, United States
- Howard Hughes Medical Institute, Stanford University, United States
- RIKEN Center for Brain Science, Japan
Figures
Figure 1 with 1 supplement
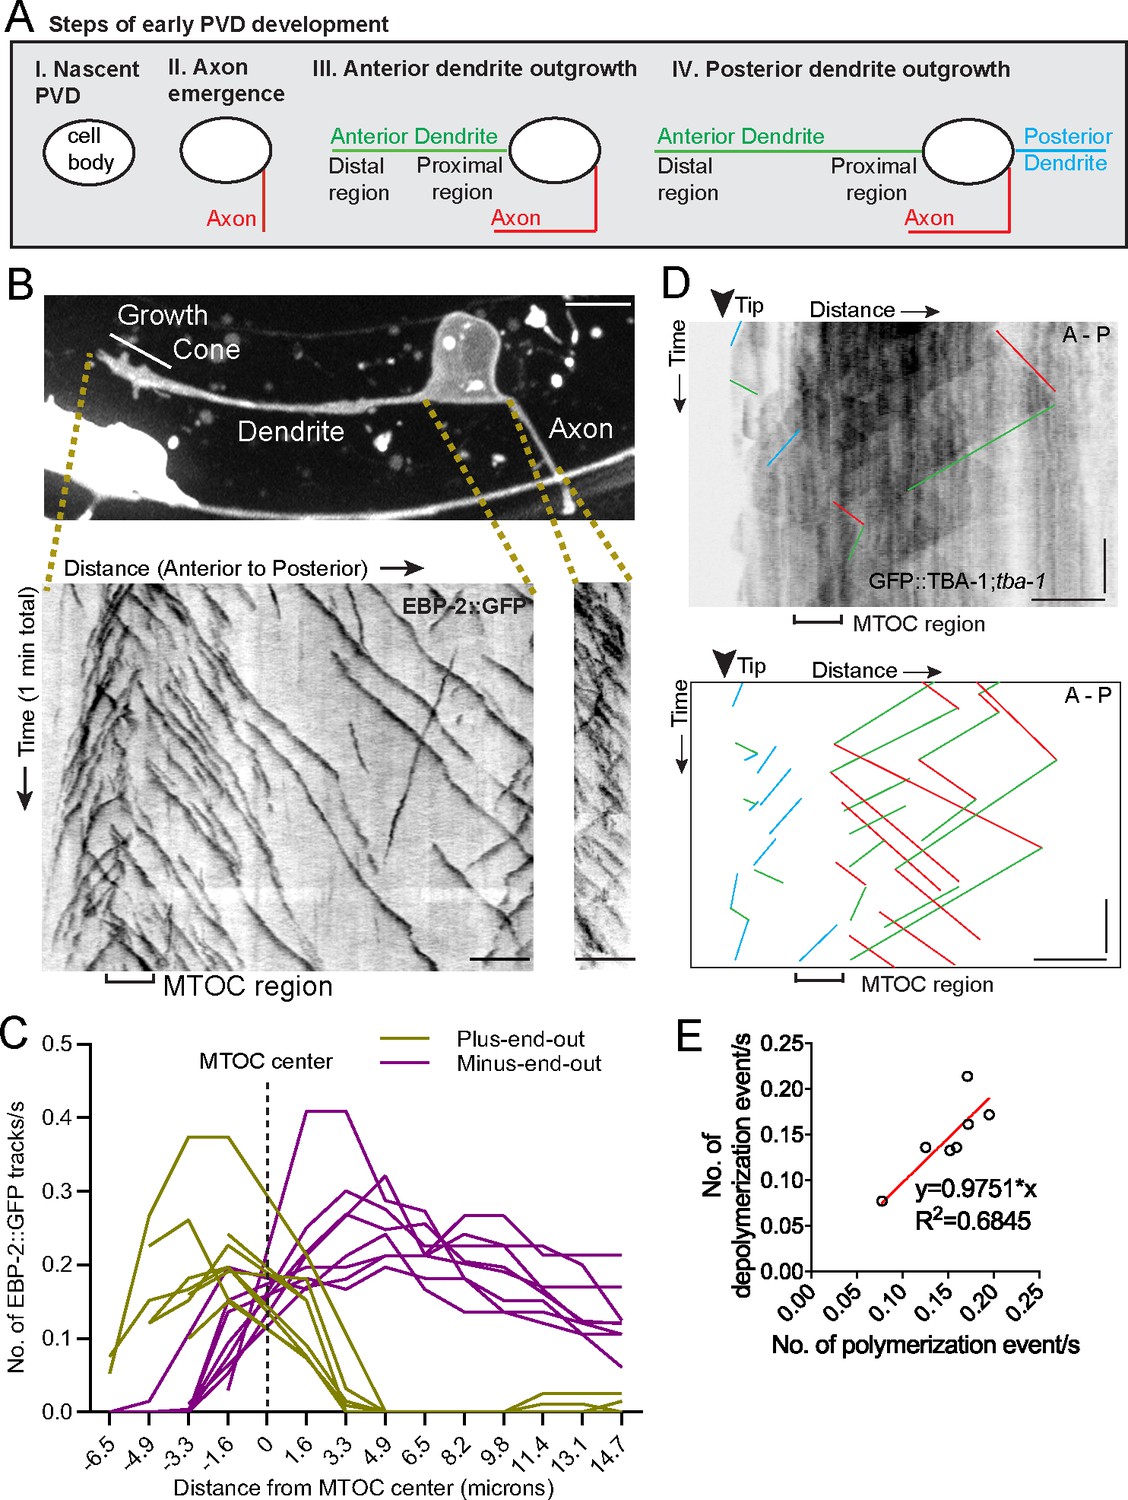
An active MTOC localizes to the growth cone of the outgrowing PVD primary dendrite.
(A) Diagram of the spatiotemporal sequence of PVD neurite emergence and outgrowth during early development. (B) Top: A labeled example of PVD morphology during early anterior dendrite outgrowth. Bottom: Kymographs of EBP-2::GFP in an outgrowing dendrite (left) and axon (right). Scale bar, 5 µm. (C) Number of plus-end-out and minus-end-out EBP-2 tracks per second at interval distances from the MTOC center (dashed line) in eight individual animals. (D) Kymograph of GFP::TBA-1 in the growth cone region. The GFP::TBA-1 was expressed in a tba-1 null mutant background to get a better incorporation of the GFP::TBA-1. Blue lines, growing plus-end-out MTs in distal region; red lines, growing minus-end-out MTs in proximal region; green lines, retracting MTs; horizontal scale bar, 5 μm; vertical scale bar, 10 s. (E) Frequency of polymerization relative to depolymerization events in the proximal region of the anterior dendrite (n = 7 individual animals). All images are lateral views oriented with anterior to the left and ventral down.
-
Figure 1—source data 1
Quantification data for Figure 1 and Figure 1—figure supplement 1.
- https://cdn.elifesciences.org/articles/56547/elife-56547-fig1-data1-v2.xlsx
Figure 1—figure supplement 1

The dgMTOC is unique to outgrowing anterior dendrites and is conserved in C. elegans and D. melanogaster.
(A) Diagram of the spatiotemporal sequence of PVD neurite emergence, outgrowth, and branching from birth to maturity. (B) Early PVD morphogenesis events occur with a stereotyped temporal sequence and orientation, representative images from different animals are shown in sequence, arrowheads: site of emerging neurite (axon, anterior dendrite, posterior dendrite). Unrelated fluorescence: horizontal lines at bottom of images (other neurons), bright spots (gut granules). (C) Morphology of PVD during posterior dendrite outgrowth (top right) and kymograph (bottom left) of EBP-2::GFP in indicated region, vertical scale bar 10 s. Note that the posterior dendrite behaves differently from the anterior dendrite - it outgrows later and has majority plus-end-out MTs. (D) Top: A Drosophila vpda neuron expressing EB1::GFP in the early stage of dendrite outgrowth with two dendritic processes emanating from the cell body. Bottom: Kymographs of EB1::GFP in each process over four minutes. White arrowheads: EB1 comets generated from a region near the tip of the dendrite and moving toward the cell body. (E–F) GFP::TBA-1 in an outgrowing dendrite (E), Distribution of relative TBA-1 intensity from the dendritic tip to the cell body (F). Scale bar, 5 μm.
Figure 2 with 1 supplement

γ-TuRC localizes to the growth cone region and is required for minus-end-out MT polarity in the dendrite.
(A) Endogenously tagged GFP::GIP-1 (top) and GIP-2::GFP (bottom) localization in an outgrowing PVD dendrite. White arrowhead, GIP cluster Unrelated structures outside of PVD include: gut granules (large green spots), HSN cell body (bright magenta region) (B) GIP-1 (top) and GIP-2 (bottom) localization at different time points during live imaging. White arrowhead, GIP cluster. (C) Kymograph of EBP-2::GFP and tagRFP::GIP-1 in the growth cone region, horizontal scale bar, 10 s (D–E) Quantification of the width measured as the distance between the most distal and proximal regions containing the indicated activity or protein (D) and shortest distance from the GIP or MTOC region to the dendrite tip (E). MTOC region was identified using EBP-2-GFP kymographs as in Figure 1A. Error bars represent the standard deviation (SD). (F) Kymograph of EBP-2::GFP following PVD-specific depletion of GIP-1 in an outgrowing (left) and mature (right) dendrite. (G) Quantification of MT polarity in the proximal dendrite following PVD-specific GIP-1 depletion (outgrowing dendrite, wt: n = 11 individual animals, GIP-1PVD(-): n = 13 individual animals; mature dendrite, wt :n = 13 individual animals, GIP-1PVD(-): n = 12 individual animals). Scale bar, 5 µm. **p<0.01, p=0.0028 for left panel and p=0.0011 for right panel, unpaired Student’s t-test with Welch’s correction, error bars represent SD. All images are lateral views oriented with anterior to the left and ventral down.
-
Figure 2—source data 1
Quantification data for Figure 2 and Figure 2—figure supplement 1.
- https://cdn.elifesciences.org/articles/56547/elife-56547-fig2-data1-v2.xlsx
Figure 2—figure supplement 1

γ-TuRC only localizes to outgrowing anterior dendrites and is conserved among different neurons in C. elegans.
(A) Lateral view of PVD through three-dimensional space. Cartoon at left drawn from a maximum projection of the cell depicts the boundaries of PVD. The outgrowing axon is indicated with white brackets. Because structures outside the cell can appear to be inside following z-slice projection, serial z-stack images from the top to the bottom of the cell are displayed as a montage to the right. Note the absence of endogenously-tagged GIP-2::GFP (green) in the outgrowing PVD axon (white brackets). (B) GFP::GIP-1 (green) localization in the outgrowing posterior PVD dendrite (magenta). White brackets: growth cone. Note the absence of a GIP-1 cluster. (C) GIP-2::GFP localization in the emerging anterior PVD dendrite. White arrowhead: GIP-2::GFP cluster. (D) GIP-2::GFP localization in mature dendrite. White bracket: distal dendrite. (E) GIP-2::GFP localization in an outgrowing C. elegans DA9 dendrite. (F) GFP::GIP-1 localization in a GIP-1PVD(-) animal (n = 11). All images are oriented with anterior to the left and posterior to the right; unrelated structures within C. elegans tissues include gut granules (large green dots); horizontal scale bars, 5 μm.
Figure 3 with 1 supplement

γ-TuRC localizes to RAB-11.1 endosomes.
(A) Electron micrograph of the dendritic growth cone. Red arrows, MTs; white arrowhead, clear-core vesicle; scale bar, 0.2 μm. (B) Reconstruction of serial electron microscopy sections through the anterior dendrite. Yellow lines, MTs in the distal dendrite; green lines, MTs crossing the predicted MTOC region; red lines, MTs in the proximal region; white circles, clear-core vesicles; blue circles, dense-core vesicles; scale bar, 1 μm. (C) MT number distribution determined by serial electron microscopy in the anterior dendrite growth cone region in three PVD neurons during development. (D) GIP-2 and RAB-11.1 colocalization in the dendritic growth cone region. Scale bar, 5 μm. (E) Quantification of GIP-2 and RAB-11.1 fluorescence overlap in the growth cone region (n = 11 individual animals). ****p<0.0001, Brown-Forsythe and Welch ANOVA test, error bars represent SEM. (F) Normalized intensity of GIP-2 and RAB-11.1 from the dendritic tip along the dendrite shaft to the cell body at different time points. Black arrow, direction of GIP-2 and RAB-11.1 movement. Vertical dashed line, the center of GIP-2 and RAB-11 endosomes at t=0s. (G) Kymograph of GIP-2::GFP and mCherry::RAB-11.1 in the growth cone region. Horizontal scale bar, 2 μm; vertical scale bar, 10 s. (H) GIP-2 localization in worms overexpressing RAB-11.1(S25N) dominant negative mutant. (I) GIP-2 localization in rab-11PVD(-) worms (Punc-86::Cre; rab-11.1(wy1444[lox])): multiple dim GIP-2 puncta in cell body (i1 and i2), dispersed dim GIP-2 puncta along the dendrite shaft (i3). Dashed white lines: PVD outline; white arrows, GIP-2 puncta; gray arrows, unrelated signal from gut granules. (J) Quantification of GIP-2::GFP class of localization in wt worms, worms overexpressing a RAB-11, RAB-11(S25N) dominant negative mutant or rab-11PVD(-) worms (Punc-86::Cre; rab-11.1(wy1444[lox])). Scale bar, 5 μm. A, anterior; P, posterior. Images in D and H were taken in the glo-1(zu391) mutant background to reduce the gut granule signal.
-
Figure 3—source data 1
Quantification data for Figure 3 and Figure 3—figure supplement 1.
- https://cdn.elifesciences.org/articles/56547/elife-56547-fig3-data1-v2.xlsx
Figure 3—figure supplement 1
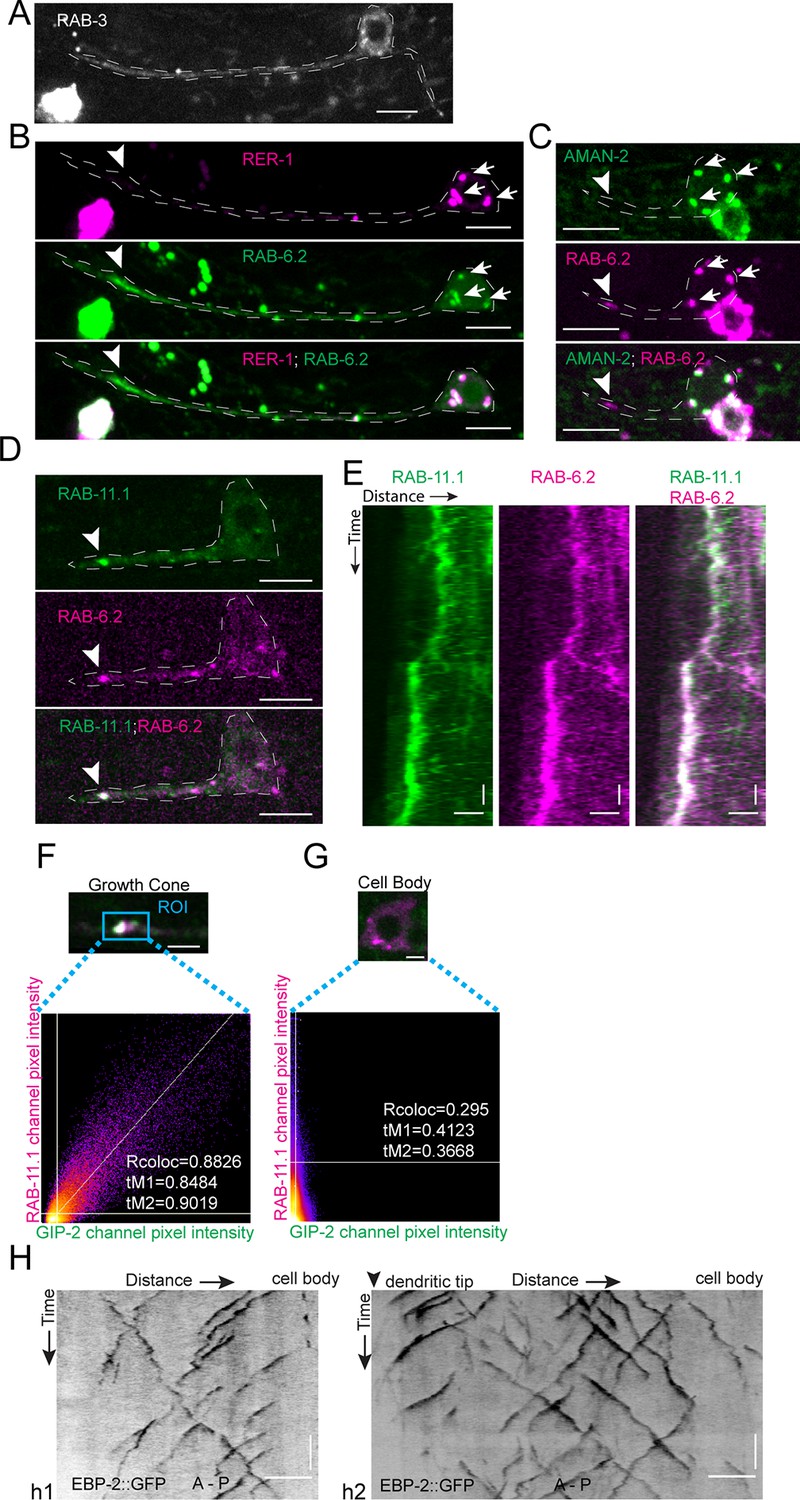
Synaptic vesicles and Golgi stacks and outposts do not localize to the growth cone region.
(A–C) GFP::RAB-3 (A), mCherry::RER-1 and GFP::RAB-6.2 (n = 13 animals) (B), and AMAN-2::GFP and mCherry::RAB-6.2 (n = 7 animals) (C) localization in outgrowing anterior PVD dendrite. White arrows: Golgi stack in cell body; white arrowheads: RAB-6.2 in growth cone. (D) GFP::RAB-11.1 and mCherry::RAB-6.2 localization in outgrowing dendrite (n = 20 animals). White arrowhead: GFP::RAB-11.1 and mCherry::RAB-6.2 in growth cone. (E) Kymograph of GFP::RAB-11.1 and mCherry::RAB-6.2 in growth cone region. Horizontal scale bar, 2 μm; vertical scale bar, 10 s. (F–G) Frame to frame colocalization analysis between GIP-2::GFP and mCherry::RAB-11.1 in growth cone (F) and cell body (G) (100 frames in one animal). (H) Kymograph of EBP-2::GFP in outgrowing anterior dendrite of a worm expressing RAB-11.1(S25N). h1, worm with an almost reversed MT polarity; h2, worm with a mixed MT polarity. All images: Scale bar, 5 μm (horizontal) (except E);10 s (vertical); white dashed line, outline of PVD; anterior to the left and posterior to the right. Images in D were taken in the glo-1(zu391) mutant background to reduce the gut granule signal.
Figure 4 with 2 supplements

UNC-116/Kinesin-1 transports the dgMTOC anteriorly through stereotyped movements.
(A) Kymograph of EBP-2::GFP in the outgrowing dendrite of an unc-116 mutant. (B) Quantification of MT polarity in wt (n = 11 for outgrowing dendrite, n = 13 for mature dendrite) and unc-116 mutants (n = 12 for outgrowing dendrite, n = 19 for mature dendrite). ****p<0.0001, ***p=0.0001, unpaired Student’s t-test with Welch’s correction, error bars represent SEM. (C) Top (c1): Time projection of EBP-2::GFP dynamics in an unc-116 mutant. Bottom (c2): Schematic of the EBP-2::GFP trajectories generated by tracing the EBP-2::GFP frame by frame. Orange lines: the outline of the outgrowing PVD; dashed orange circles: nucleus; black arrows: EBP-2::GFP trajectories. (D) GIP-2::GFP localization in PVD in an unc-116 mutant. Growth cone (GC) region (d1); cell body region (d2); Arrowhead: GIP-2::GFP cluster in cell body; white dotted line in d2: PVD outline. (E) GFP::RAB-11.1 localization in PVD in an unc-116 mutant. Arrowhead: GFP::RAB-11.1 cluster in cell body; asterisk: no GFP::RAB-11.1 enrichment at PVD growth cone region; white dotted lines: PVD outline. (F–G) GIP-2::GFP dynamics in the growth cone region. Wild type (E); unc-116 mutant (F); kymograph of GIP-2::GFP (f1 and g1); GIP-2::GFP cluster in different time points (f2 and g2); dashed lines: the position of GIP-2 cluster at t=0s.(H) Schematic of GIP-2 diameter and position for quantification. Green line: GIP-2::GFP intensity along the blue ROI; red dashed lines: the edges of the GIP-2::GFP cluster used for diameter quantification; black arrow points to the black dashed line centered between the two red dashed lines, the position of GIP-2::GFP cluster. (I–J) GIP-2::GFP cluster diameter (red line) and distance from t = 0 (black line) during GIP-2 cluster movement. Wild type (I); unc-116 mutant (J). (K) Quantification of GIP-2::GFP cluster anterior displacement in wt (n = 6) and unc-116 mutants (n = 5). p=0.0003, unpaired Student’s t-test with Welch’s correction, error bars represent SEM. (L) Quantification of GIP-2 diameter change in wt (n = 7) and unc-116 mutants (n = 5). p=0.0165, unpaired Student’s t-test with Welch’s correction, error bars represent SEM. A, anterior; P, posterior; vertical scale bar, 10 s; horizontal scale bar, 5 μm in A, C D and E, 2 μm in F-H.
-
Figure 4—source data 1
Quantification data for Figure 4, Figure 4—figure supplement 1, and Figure 4—figure supplement 2.
- https://cdn.elifesciences.org/articles/56547/elife-56547-fig4-data1-v2.xlsx
Figure 4—figure supplement 1
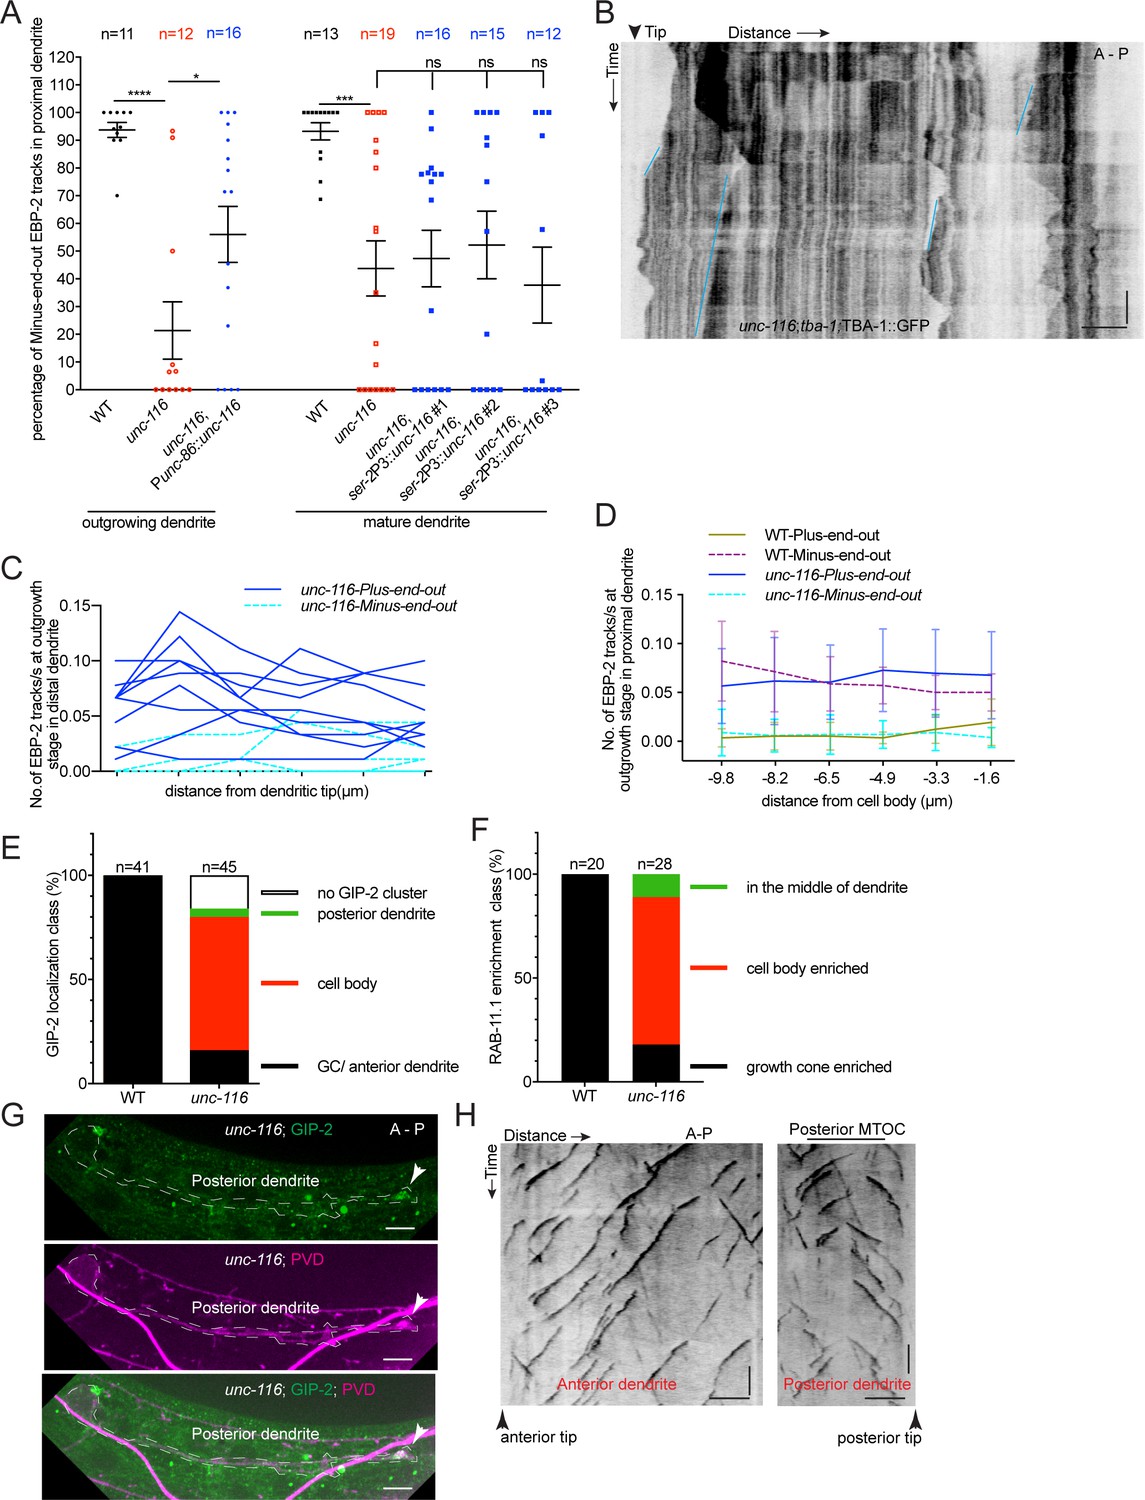
MT polarity and dgMTOC localization require UNC-116/kinesin-1.
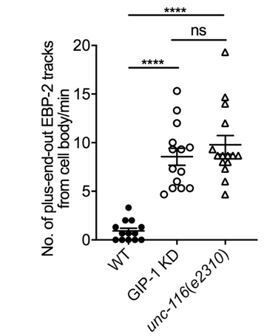
(A) Quantification of MT polarity in wt, unc-116 mutants, and unc-116 mutants expressing UNC-116 early (unc-86 promoter), and late (ser-2 promoter). The data of wt and unc-116 mutant are the same as used in Figure 4B. For outgrowing dendrite quantification: ****p<0.0001, *p=0.0475. For mature dendrite quantification: ***p=0.0004 for WT and unc-116, p=0.9984 for WT and unc-116;ser-2P3::unc-116 #1, p=0.9708 for WT and unc-116;ser-2P3::unc-116 #2, p=0.9934 for WT and unc-116;ser-2P3::unc-116 #3. Brown-Forsythe and Welch ANOVA test, error bars represent SEM. (B) Kymograph of GFP::TBA-1 in an unc-116 mutant. Blue lines: plus-end-out MTs. (C–D) Plus-end-out and minus-end-out MT polymerization frequency measured by EBP-2::GFP tracks at interval distances from the dendritic tip toward the cell body (C) in unc-116 mutants (n = 9) and from the cell body outwards toward the dendritic tip (D) in both WT (n = 7) and unc-116 mutants (n = 11). Distances on the x-axis are displayed to imitate the anterior-left and posterior-right orientation. (E) Quantification of GIP-2::GFP localization class in wt and unc-116 mutants.(F) Quantification of GFP::RAB-11.1 localization class in wt and unc-116 mutants. (G) Posterior dendrite localized GIP-2::GFP in an unc-116 mutant. White arrowheads, GIP-2::GFP in growth cone. (H) Kymograph of EBP-2::GFP in both anterior (left) and posterior (right) dendrite in unc-116 mutant which showed a posterior dendrite localized MTOC. Horizontal scale bar, 5 μm; vertical scale bar, 10 s.
Figure 4—figure supplement 2

Distribution of GIP-2::GFP cluster distance from t = 0 (black line) and diameter (red line) during GIP-2 cluster movement in different wt (n = 4, (A), unc-116 mutants (n = 4, (B), and dhc-1 mutants (n = 4, (C).
Figure 5 with 1 supplement
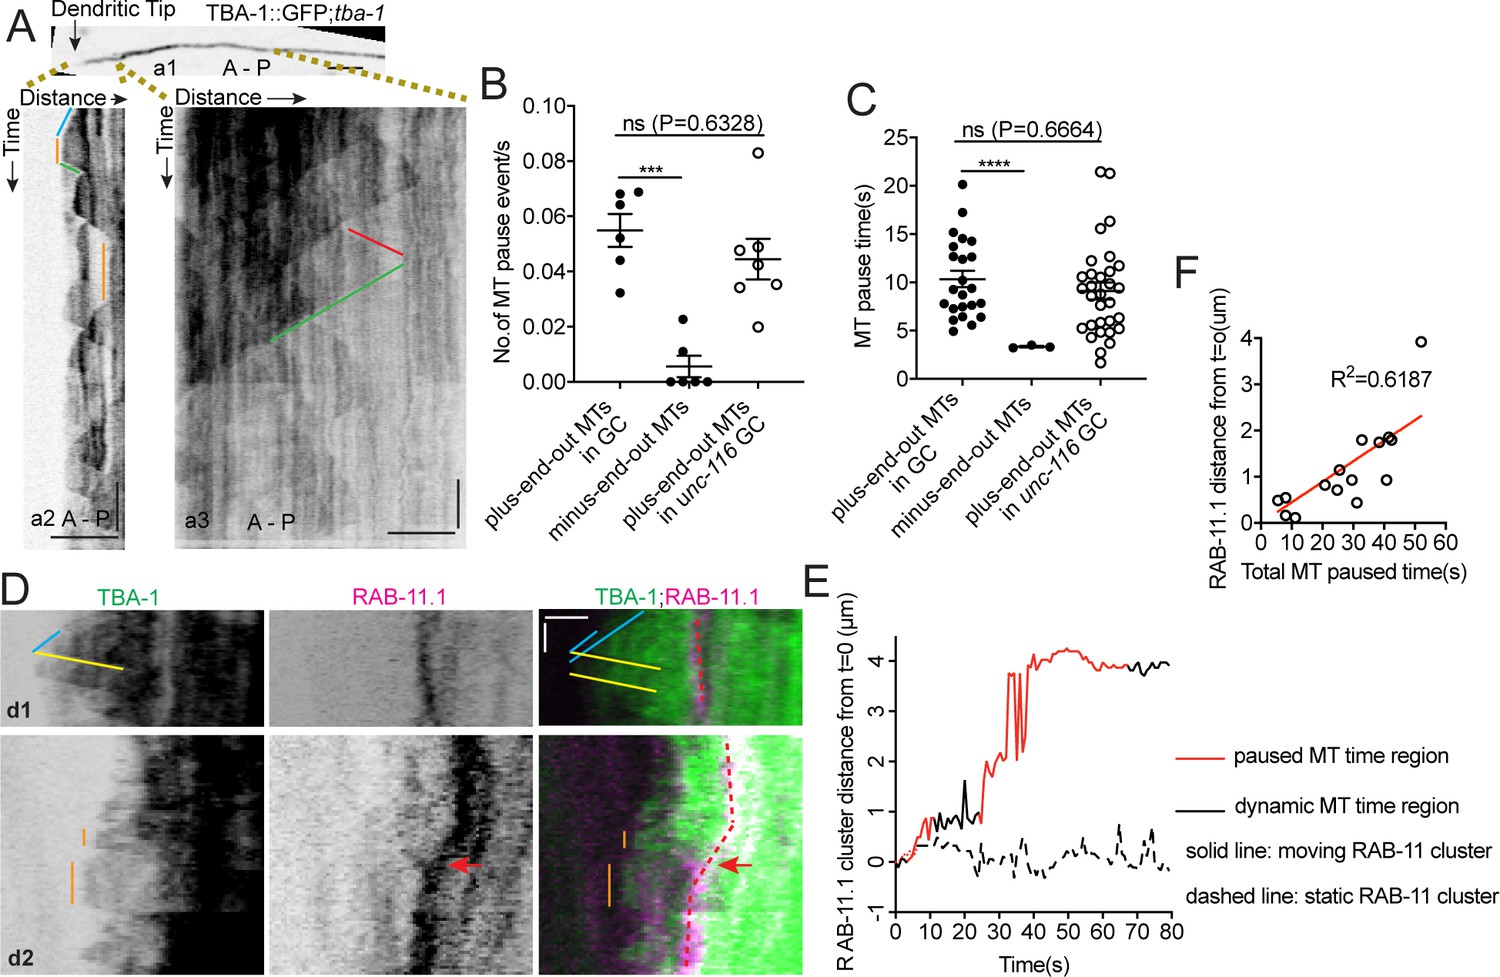
UNC-116/Kinesin-1 transports the dgMTOC on transiently stabilized plus-end-out MTs.
(A) GFP::TBA-1 in the outgrowing dendrite (a1) and kymograph of GFP::TBA-1 in the indicated distal (a2) and proximal (a3) region. Blue line: growing plus-end-out MTs in distal region; red line: growing minus-end-out MTs in proximal region; green lines: retracting MTs; orange lines: pausing MTs. (B–C) Quantification of MT pause frequency (B) (n = 6 individual animals for both wt and unc-116 mutant) and pause time (C) of distal plus-end-out (n = 23 for wt and n = 31 for unc-116 mutant)and proximal minus-end-out (n = 3) individual MTs. ***p=0.0002, ****p<0.0001, Brown-Forsythe and Welch ANOVA test, error bars represent SEM. (D) Kymograph of GFP::TBA-1and mCherry::RAB-11.1 in the growth cone region. Blue line: growing plus-end-out MTs; yellow lines: retracting MTs; orange lines: pausing MTs. Red dashed lines indicate the position of mCherry::RAB-11.1 in the growth cone, red arrows indicate the moving mCherry::RAB-11.1 cluster. (E) Distribution of mCherry::RAB-11.1 cluster distance from t = 0 correlated with MT dynamics over time. (F) Correlation of mCherry::RAB-11.1 moving distance from t = 0 and distal plus-end-out MT pause time in different worms(n = 15). ***p<0.001, *p<0.05, unpaired Student’s t-test, error bars represent SEM; A, anterior; P, posterior; vertical scale bar, 10 s; horizontal scale bar, 2 μm.
-
Figure 5—source data 1
Quantification data for Figure 5 and Figure 5—figure supplement 1.
- https://cdn.elifesciences.org/articles/56547/elife-56547-fig5-data1-v2.xlsx
Figure 5—figure supplement 1
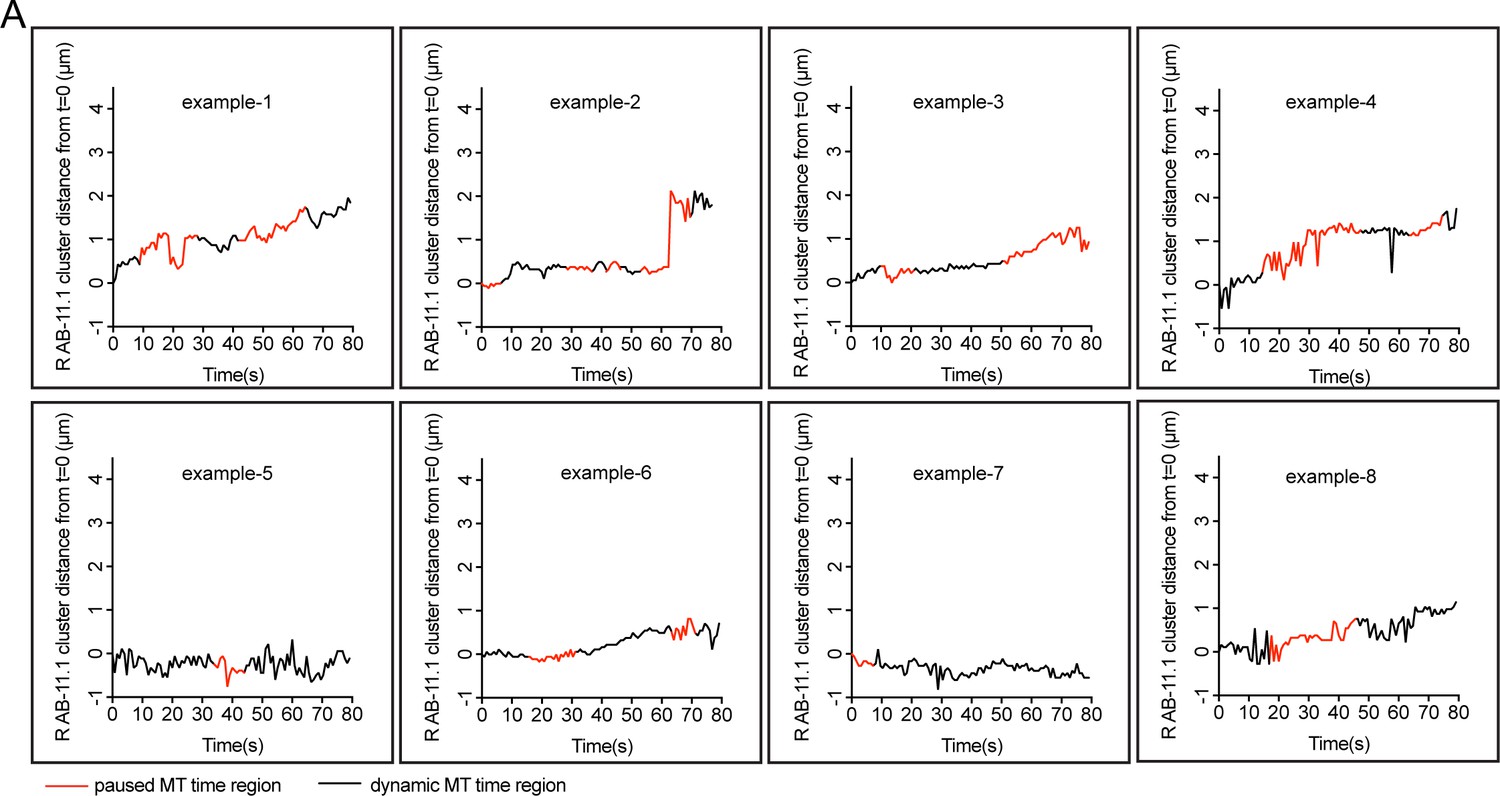
Distribution of mCherry::RAB-11.1 cluster distance from t = 0 correlated with MT dynamics over time in multiple worms.
Figure 6 with 1 supplement
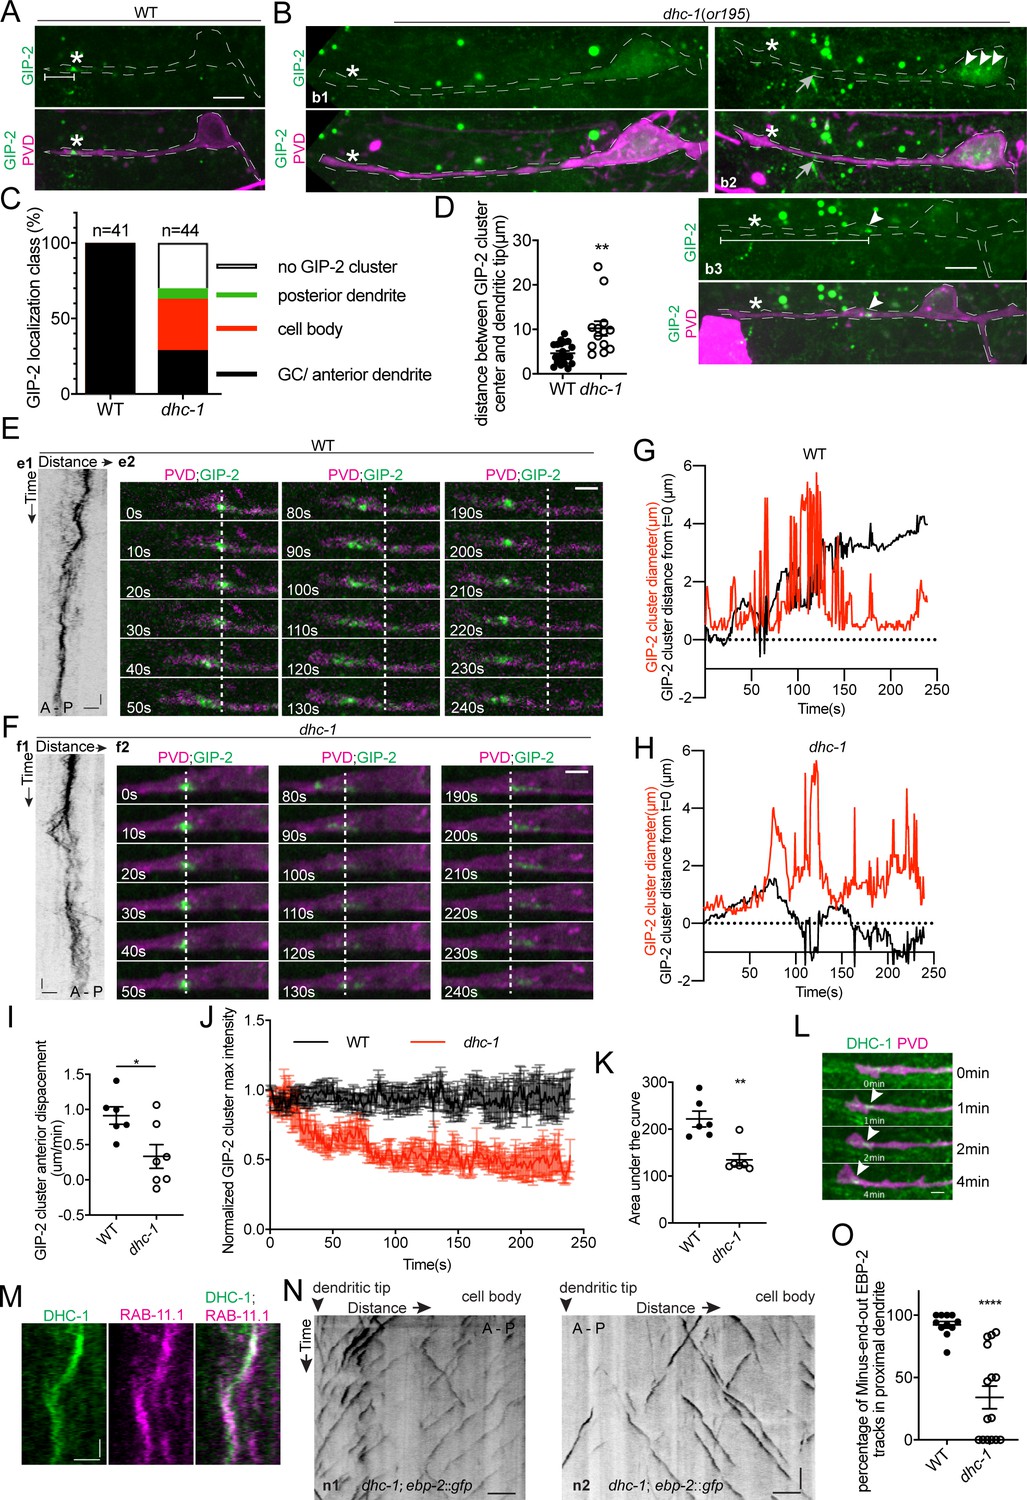
DHC-1/dynein clusters GIP-2 to form a single dgMTOC during outgrowth.
(A–B) Endogenous GIP-2::GFP localization in wild type (A) and dhc-1 mutants (B). White asterisks, GIP-2::GFP clusters in wt animal and growth cone region in dhc-1 mutant; White arrowheads, GIP-2::GFP clusters in dhc-1 mutant; gray arrows in b2, unrelated signal from gut granules; white brackets, distance between GIP-2 cluster and dendritic tip. (C) Quantification of GIP-2::GFP class of localization in dhc-1 mutants. (D) Quantification of distance between GIP-2::GFP cluster and dendritic tip in wt (n = 20) and dhc-1 mutants (n = 13). **p=0.0059, unpaired Student’s t-test with Welch’s correction, error bars represent SEM. (E–F) GIP-2::GFP dynamics in wt (E) and dhc-1 mutants (F). Kymograph of GIP-2::GFP (e1 and f1); GIP-2::GFP cluster at different time points (e2 and f2); dashed lines, the position of GIP-2 cluster at the beginning.(G–H) Distribution of GIP-2::GFP cluster diameter (red line) and distance from t = 0 (black line) during GIP-2::GFP cluster movement in wt (G) and dhc-1 mutant (H). (I) Quantification of GIP-2::GFP cluster anterior displacement in wt (n = 6) and dhc-1 mutants (n = 7). *p=0.0185, unpaired Student’s t-test with Welch’s correction, error bars represent SEM. (J) Quantification of GIP-2::GFP cluster maximum intensity in wt (n = 7 , black) and dhc-1 mutants (n = 7, red). (K) Quantification of the area under the lines in J). **p=0.0025, unpaired Student’s t-test with Welch’s correction, error bars represent SEM. (L) Endogenous DHC-1::GFP localization in an outgrowing dendrite at different time points. White arrowheads, DHC-1::GFP in the growth cone. (M) Kymograph of DHC-1::GFP and mCherry::RAB-11.1 in the growth cone region. (N) Kymograph of EBP-2::GFP in a dhc-1 outgrowing anterior dendrite. n1, worm with a reversed MT polarity; n2, worm with a mixed MT polarity. (O) Quantification of MT polarity in wt (n = 11) or dhc-1 mutants (n = 15). ****p<0.0001, unpaired Student’s t-test with Welch’s correction, error bars represent SEM. Horizontal scale bar, 10 s. Vertical scale bar, 5 μm for A, B and N; others, 2 μm. Both e2 and f2 images were corrected using simple ratio method with ImageJ Bleach correction plugin.
-
Figure 6—source data 1
Quantification data for Figure 6.
- https://cdn.elifesciences.org/articles/56547/elife-56547-fig6-data1-v2.xlsx
Figure 6—figure supplement 1

Proposed model for the establishment of minus-end-out MT polarity by a dendritic growth cone tracking MTOC.
(A) A growth cone localized endosome-associated MTOC (dgMTOC) generates minus-end-out MTs in the dendrite and plus-end-out MTs towards the growing tip. (B) The plus-end-out MTs are transiently stabilized by interaction with the growth cone and serve as the tracks on which kinesin-1 transports the endosomes further towards the distal dendritic tip. (C) Dynein clusters the endosomes to form a single MTOC that remains with the growth cone in between the bouts of kinesin-1 mediated movements. The unique location of the dgMTOC is accomplished by a balance between dynein and kinesin-1 activity. We speculate that the switch between kinesin-1 and dynein dominance in the growth cone region could be mediated by the state of plus-end-out MT stability: when stabilized microtubules are present in the growth cone region, kinesin-1 would have stronger activity and move the dgMTOC toward the dendritic tip, and while the plus-end-out MTs are dynamic, dynein activity dominates and clusters the separated endosomes. Dynein activity may be regulated by adaptors or activators in the growth cone region which could reduce dynein activity while the dgMTOC is moved by kinesin-1.
Author response image 1
Videos
Video 1
EBP-2::GFP comets reveal an MTOC in the outgrowing anterior dendrite growth cone of a wt PVD neuron in C. elegans.
Video 2
EB1::GFP comets reveal an MTOC near the outgrowing dendrite tip of vpda in D. melanogaster.
Video 3
EBP-2::GFP comets in the outgrowing PVD dendrite of a GIP-1PVD(-) animal shows plus-end-out MTs.
Video 4
EBP-2::GFP comets in the outgrowing PVD dendrite of an unc-116(e2310) mutant shows predominantly plus-end-out MTs.
Video 5
EBP-2::GFP comets in the cell body of PVD in an unc-116 mutant during dendrite outgrowth suggests an MTOC is mislocalized to the cell body.
Video 6
GIP-2::GFP shows a stereotyped movement in the outgrowing PVD dendrite.
Video 7
GIP-2::GFP does not move in an unc-116(e2310) mutant.
Video 8
GIP-2::GFP dispersion in a dhc-1(or195) mutant.
Tables
Key resources table
| Reagent type (species) or resource | Designation | Source or reference | Identifiers | Additional information |
|---|---|---|---|---|
| Strain, strain background (C. elegans) | zif-1(gk117) III; wyEx9745 [Punc86::mCherry::PLCdeltaPH] | Injected -This study | TV24185 | See C. elegans strains section in the Materials and methods |
| Strain, strain background (C. elegans) | zif-1(gk117) III; gip-1(wow5[zf::gfp::gip-1]) III; wyEx9745 | Crossed -This study | TV24455 | See C. elegans strains section in the Materials and methods |
| Strain, strain background (C. elegans) | ebp-2(wow47[ebp-2::gfp::3xflag]) II; zif-1(gk117) III; wyEx9745 | Crossed -This study | TV24458 | See C. elegans strains section in the Materials and methods |
| Strain, strain background (C. elegans) | gip-2(lt19[gip-2::gfp::loxP::cb-unc- 119(+)::loxP]) I; wyEx9745 | Crossed -This study | TV24424 | See C. elegans strains section in the Materials and methods |
| Strain, strain background (C. elegans) | ebp-2(wow47) II; gip-1(wow25[tagRFP-t::3xMyc::gip-1]) III; wyEx9745 | Crossed -This study | TV24830 | See C. elegans strains section in the Materials and methods |
| Strain, strain background (C. elegans) | zif-1(gk117) gip-1(wow5[zf::gfp::gip-1]) III;wyEx9744[Punc-86::mCherry::PLCdeltaPH Punc-86::zif-1] | Crossed -This study | TV24645 | See C. elegans strains section in the Materials and methods |
| Strain, strain background (C. elegans) | ebp-2(wow47[ebp-2::gfp::3xflag]) II;zif-1(gk117) gip-1(wow5[zf::gfp::gip-1]) III; wyEx9744[Punc-86::mCherry::PLCdeltaPH Punc-86::zif-1] | Crossed -This study | TV24646 | See C. elegans strains section in the Materials and methods |
| Strain, strain background (C. elegans) | gip-2(lt19) I; wyIs581[ser-2P3::myri-mCherry] | Crossed -This study | TV25492 | See C. elegans strains section in the Materials and methods |
| Strain, strain background (C. elegans) | tba-1(ok1135) II; wyIs813[Punc-86::gfp::tba-1 Punc- 86:mCherry::PLCdeltaPH] | Integrated -This study | TV21720 | See C. elegans strains section in the Materials and methods |
| Strain, strain background (C. elegans) | gip-2(lt19) I; glo-1(zu391) X; wyEx10112 | Injected - this study | TV25509 | See C. elegans strains section in the Materials and methods |
| Strain, strain background (C. elegans) | gip-2(lt19) I; glo-1(zu391) X; wyEx10041[Punc-86::mCherry::rab-11.1 cDNA Podr-1::gfp] | Injected - this study | TV25234 | See C. elegans strains section in the Materials and methods |
| Strain, strain background (C. elegans) | gip-2(lt19) I; glo-1(zu391) X; wyEx10042[Punc-86::mCherry::RAB-11.1(S25N) Podr-1::gfp] | Injected - this study | TV25235 | See C. elegans strains section in the Materials and methods |
| Strain, strain background (C. elegans) | wyEx9876 [Punc-86::AMAN-2(1-84aa)::GFP novo2 Punc-86::mCherry::PLCdeltaPH Podr-1::gfp] | Injected - this study | TV24622 | See C. elegans strains section in the Materials and methods |
| Strain, strain background (C. elegans) | wyEx10015[Punc-86::gfp::rab-6.2 Punc-86::mCherry::rer-1 Podr-1::gfp] | Injected - this study | TV25150 | See C. elegans strains section in the Materials and methods |
| Strain, strain background (C. elegans) | glo-1(zu391) X; wyEx10092[Punc-86::gfp::rab-11.1 cDNA Punc-86::mCherry::rab-6.2 Podr-1::gfp] | Injected - this study | TV25463 | See C. elegans strains section in the Materials and methods |
| Strain, strain background (C. elegans) | ebp-2(wow47) II; unc-116(e2310) III | Crossed -This study | TV23841 | See C. elegans strains section in the Materials and methods |
| Strain, strain background (C. elegans) | ebp-2(wow47) II; unc-116(e2310) III; wyEx9745 | Crossed -This study | TV24433 | See C. elegans strains section in the Materials and methods |
| Strain, strain background (C. elegans) | gip-2(lt19) I; unc-116(e2310) III; wyEx9745 | Crossed -This study | TV24434 | See C. elegans strains section in the Materials and methods |
| Strain, strain background (C. elegans) | unc-116(e2310); ebp-2(wow47); wyEx10049[Punc-86::unc-116(1 ng/ul) Punc-86::mCherry:: PLCdeltaPH Podr-1::gfp] | Injected - this study | TV25242 | See C. elegans strains section in the Materials and methods |
| Strain, strain background (C. elegans) | unc-116(e2310); ebp-2(wow47); wyEx10117[ser-2P3::unc-116(20 ng/ul) ser-2P3::mCherry (10 ng/ul) Podr-1::gfp] | Injected - this study | TV25535 | See C. elegans strains section in the Materials and methods |
| Strain, strain background (C. elegans) | unc-116(e2310); ebp-2(wow47); wyEx10104[ser-2P3::unc-116(20 ng/ul) ser-2P3::mCherry (10 ng/ul) Podr-1::gfp] | Injected - this study | TV25476 | See C. elegans strains section in the Materials and methods |
| Strain, strain background (C. elegans) | unc-116(e2310); ebp-2(wow47); wyEx10090[ser-2P3::unc-116(20 ng/ul) ser-2P3::mCherry (10 ng/ul) Podr-1::gfp] | Injected - this study | TV25461 | See C. elegans strains section in the Materials and methods |
| Strain, strain background (C. elegans) | tba-1(ok1135) I; unc-116(e2310) III; wyEx8784[Punc-86::gfp::tba-1 Punc-86:mCherry::PLCdeltaPH] | Crossed -This study | TV21585 | See C. elegans strains section in the Materials and methods |
| Strain, strain background (C. elegans) | tba-1(ok1135) I; wyIs813; wyEx10099[Punc-86::mcherry::rab-11.1 cDNA Podr-1::gfp] | Injected - this study | TV25470 | See C. elegans strains section in the Materials and methods |
| Strain, strain background (C. elegans) | dhc-1(or195) gip-2(lt19) I; wyEx9745 | Crossed -This study | TV25536 | See C. elegans strains section in the Materials and methods |
| Strain, strain background (C. elegans) | dhc-1(ie28 [dhc-1::degron::gfp]) I; wyEx9745 | Crossed -This study | TV24721 | See C. elegans strains section in the Materials and methods |
| Strain, strain background (C. elegans) | dhc-1(ie28) I; glo-1(zu391) X; wyEx10110 [Punc-86::mCherry::RAB-11.1 cDNA Podr-1::gfp] | Injected - this study | TV25507 | See C. elegans strains section in the Materials and methods |
| Strain, strain background (C. elegans) | dhc-1(or195) I; ebp-2(wow47) II; wyEx9745 | Crossed -This study | TV25111 | See C. elegans strains section in the Materials and methods |
| Strain, strain background (C. elegans) | wyIs22[Punc-86::rab-3a::gfp Podr-1::rfp] | Patel et al., 2006 | TV201 | |
| Strain, strain background (C. elegans) | unc-116(e2310);wyEx9975[Punc-86::gfp::rab-11.1 cDNA Punc-86::mCherry::PLC delta PH ] | Injected - this study | TV26124 | See C. elegans strains section in the Materials and methods |
| Strain, strain background (C. elegans) | rab-11.1(wy1444[lox]);gip-2(lt19);wyEx10192[Punc-86::Cre Plin-32::mCherry Podr-1::gfp] | cross- this study | TV26120 | See C. elegans strains section in the Materials and methods |
| Commercial assay or kit | In-Fusion HD Cloning System | Clontech | Cat 639645 | |
| Commercial assay or kit | T4 DNA ligase | NEB | Cat M0202L | |
| Recombinant DNA reagent | Punc-86::mCherry::PLCdeltaPH | This study | pMK41 | See Molecular biology, transgenic lines, and CRISPR section in the Materials and methods |
| Recombinant DNA reagent | Punc-86::ZIF-1 | This study | pMK32 | See Molecular biology, transgenic lines, and CRISPR section in the Materials and methods |
| Recombinant DNA reagent | Pmig-13::mCherry | This study | pCM327 | See Molecular biology, transgenic lines, and CRISPR section in the Materials and methods |
| Recombinant DNA reagent | Punc-86::mCherry::rab-11.1 cDNA | This study | pLX107 | See Molecular biology, transgenic lines, and CRISPR section in the Materials and methods |
| Recombinant DNA reagent | Punc-86::mCherry::RAB-11(S25N) | This study | pLX110 | See Molecular biology, transgenic lines, and CRISPR section in the Materials and methods |
| Recombinant DNA reagent | Punc-86::AMAN-2(1-84aa)::GFP novo2 | This study | pLX85 | See Molecular biology, transgenic lines, and CRISPR section in the Materials and methods |
| Recombinant DNA reagent | Punc-86::gfp::rab-6.2 cDNA | This study | pLX86 | See Molecular biology, transgenic lines, and CRISPR section in the Materials and methods |
| Recombinant DNA reagent | Punc-86::mCherry::rab-6.2 cDNA | This study | pLX90 | See Molecular biology, transgenic lines, and CRISPR section in the Materials and methods |
| Recombinant DNA reagent | Punc-86::mCherry::rer-1cDNA | This study | pLX104 | See Molecular biology, transgenic lines, and CRISPR section in the Materials and methods |
| Recombinant DNA reagent | Punc-86::gfp::rab-11.1 cDNA | This study | pLX99 | See Molecular biology, transgenic lines, and CRISPR section in the Materials and methods |
| Recombinant DNA reagent | Punc-86::unc-116 | This study | pLX96 | See Molecular biology, transgenic lines, and CRISPR section in the Materials and methods |
| Recombinant DNA reagent | ser-2P3::unc-116 | This study | pLX98 | See Molecular biology, transgenic lines, and CRISPR section in the Materials and methods |
| Recombinant DNA reagent | Punc-86::Cre | This study | pCY26 | See Molecular biology, transgenic lines, and CRISPR section in the Materials and methods |
| Sequence-based reagent | gip-1(wow5) gRNA | Sallee et al., 2018 | TCAGATAAATGCGTCGACAAGG | |
| Sequence-based reagent | gip-1(wow5)-HA_F | Sallee et al., 2018 | GGAGAAAATTAACCAAAAACTTGAAATTTTATGAAAAAAAAATGGAAAAATTTCAGATAAATGCCGACAGAATACAAAACGCGACTTTGTGATG | |
| Sequence-based reagent | gip-1(wow5)-HA_R | Sallee et al., 2018 | CTATCATGAAACCCGAAAGCATTTAAAAATTGCTGTACAGCTTCAACTTCTTCGCTGCCTTGACGTCGCATGGCTCCGCTAGCTCCTGATTTGTATAGTTCGTCCATGCCATGTGTAATCCC | |
| Sequence-based reagent | ebp-2(wow47) sgRNA | Sallee et al., 2018 | GCAGGCAAATCTGGACGATACGG | |
| Sequence-based reagent | ebp-2(wow47) 5’HA-F | Sallee et al., 2018 | TTGTAAAACGACGGCCAGTCGCCGGCAGTTGCTGCTCCTGCTAGACC | |
| Sequence-based reagent | ebp-2(wow47) 5’HA-R | Sallee et al., 2018 | CATCGATGCTCCTGAGGCTCCCGATGCTCCGAAAGTCTCGGTATCGTCCAGATT | |
| Sequence-based reagent | ebp-2(wow47) 3’HA-F | Sallee et al., 2018 | CGTGATTACAAGGATGACGATGACAAGAGATAAATATTGTTGTTTCCCATTGCTT | |
| Sequence-based reagent | ebp-2(wow47) 3’HA-R | Sallee et al., 2018 | GGAAACAGCTATGACCATGTTATCGATTTCTTTGCGATTGATGATGTCGT | |
| Sequence-based reagent | gip-1(wow25) gRNA | Sallee et al., 2018 | TCAGATAAATGCGTCGACAAGG | |
| Sequence-based reagent | gip-1(wow25) 5’HA-F | Sallee et al., 2018 | CACGACGTTGTAAAACGACGGCCAGTCGTACTGGAAATTTGGGCAACA | |
| Sequence-based reagent | gip-1(wow25) 5’HA-R | Sallee et al., 2018 | CTTGATGAGCTCCTCTCCCTTGGAGACCATTTATCTGAAATTTTTCCATTTT | |
| Sequence-based reagent | gip-1(wow25) 3’HA-F | Sallee et al., 2018 | GAGCAGAAGTTGATCAGCGAGGAAGACTTGCGTCGACAAGGCAGCG | |
| Sequence-based reagent | gip-1(wow25) 3’HA-R | Sallee et al., 2018 | TCACACAGGAAACAGCTATGACCATGTTATCAAAATTCAAAATCCCCGTTT | |
| Sequence-based reagent | rab-11.1(wy1444) 5’donor | This study | gctgatgaatcatgtgaccaatgccctttttcttttttacaatcgtcccaataacttcgtataatgtatgctatacgaagttatatatatacacaactttcaaacaagctttatcattttacagctcagcagtaaag | |
| Sequence-based reagent | rab-11.1(wy1444) 3’donor | This study | gagttttatcgaattcttgcaagcactgcgtttgcaagtcttcaccgtttataacttcgtataatgtatgctatacgaagttattggtgtgtagtatttgtaactttctttcagatttatttgtaattgcctcc | |
| Sequence-based reagent | rab-11.1(wy1444) 5’ gRNA | This study | TTGAAAGTTGTGTATATATT GGG | |
| Sequence-based reagent | rab-11.1(wy1444) 3’ gRNA | This study | tttgcaagtcttcaccgttttgg | |
| Chemical compound, drug | Levamisol hydrochloride | Sigma-Aldrich | Cat 31742 | |
| Software, algorithm | Image J | NIH | RRID:SCR_003070 | https://imagej.net/ImageJ |
| Software, algorithm | Fiji | GitHub | RRID:SCR_002285 | https://fiji.sc/ |
| Software, algorithm | GraphPad Prism 8 | GraphPad | RRID:SCR_002798 | https://www.graphpad.com/scientific-software/prism/ |
| Software, algorithm | MetaMorph | Molecular Devices | RRID:SCR_002368 |
Additional files
-
Supplementary file 1
Plasmid and sequence.
- https://cdn.elifesciences.org/articles/56547/elife-56547-supp1-v2.xlsx
-
Transparent reporting form
- https://cdn.elifesciences.org/articles/56547/elife-56547-transrepform-v2.docx
Download links
A two-part list of links to download the article, or parts of the article, in various formats.
Downloads (link to download the article as PDF)
Open citations (links to open the citations from this article in various online reference manager services)
Cite this article (links to download the citations from this article in formats compatible with various reference manager tools)
Growth cone-localized microtubule organizing center establishes microtubule orientation in dendrites
eLife 9:e56547.
https://doi.org/10.7554/eLife.56547


