Weight loss, insulin resistance, and study design confound results in a meta-analysis of animal models of fatty liver
- School of Clinical Medicine, University of Cambridge, United Kingdom
- Leeds Institute for Medical Research & Leeds Institute for Data Analytics, University of Leeds, United Kingdom
- Institute of Metabolic Science, University of Cambridge, United Kingdom
Figures
Figure 1
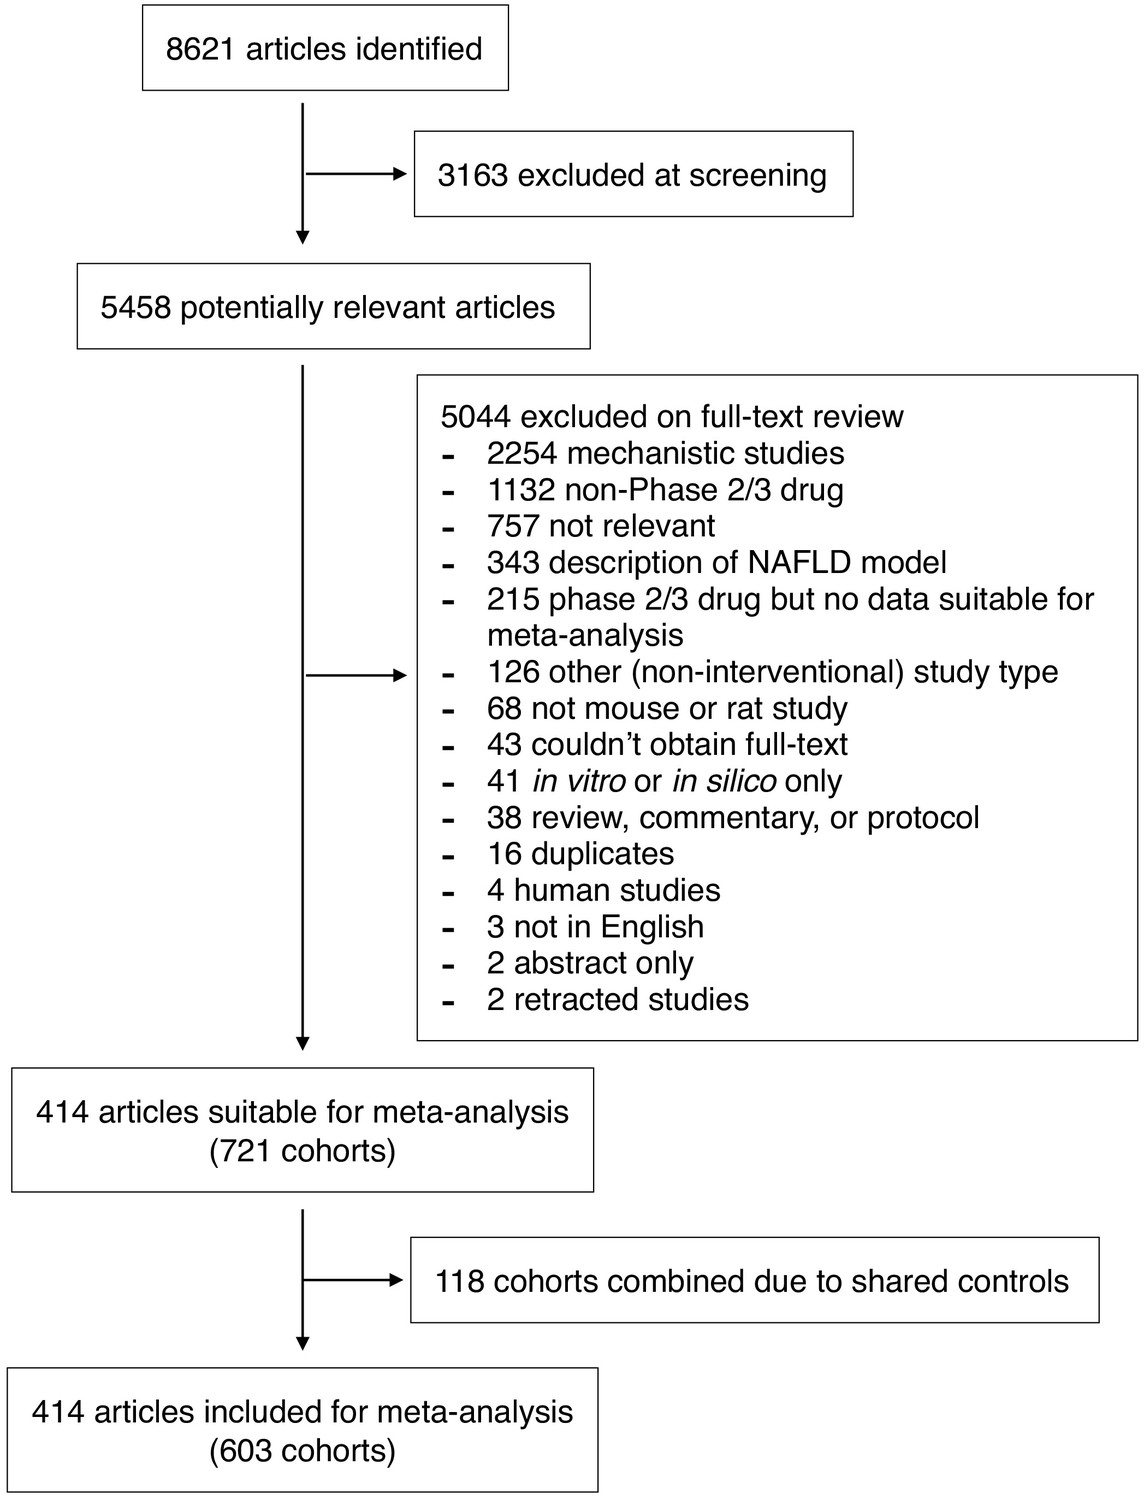
Study inclusion and exclusion flow chart.
-
Figure 1—source data 1
Dataset used in this meta-analysis.
Details and raw data of all studies included in the meta-analysis. This data can be used with the R code found in Supplementary Methods to run all analyses.
- https://cdn.elifesciences.org/articles/56573/elife-56573-fig1-data1-v2.xlsx
Figure 2 with 2 supplements
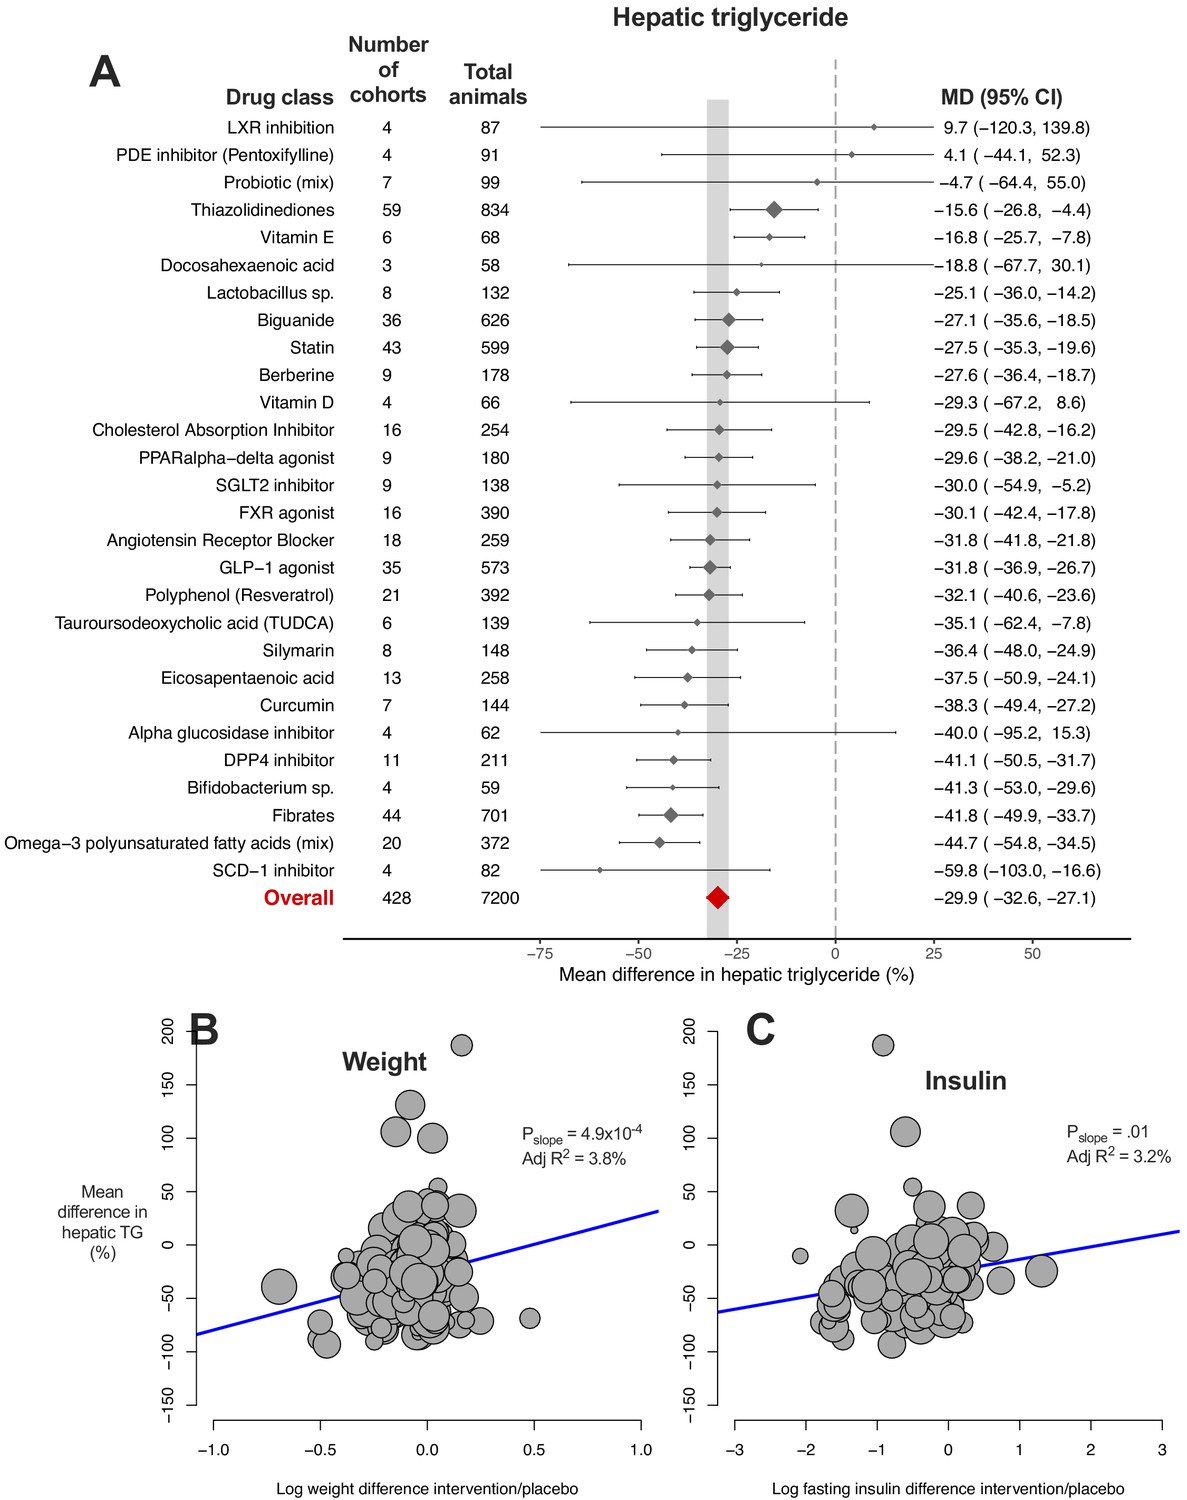
Meta-analysis of hepatic triglyceride content in rodent studies of NAFLD.
(A) Forest plot with subgrouping by class of drug. Individual studies have been hidden and only subgroup summaries are illustrated. Results are expressed as a percentage difference relative to control (/placebo). The total number of animals per subgroup is calculated from the sum of control and interventional animals for each subgroup. CI, confidence interval; DPP4, Dipeptidyl peptidase-4; FXR, Farnesoid X receptor; GLP-1, Glucagon-like peptide-1; MD, mean difference; LXR, Liver X receptor; PDE, Phosphodiesterase; PPAR, Peroxisome proliferator-activated receptor; SCD-1, Stearoyl–CoA desaturase-1; SGLT2, Sodium-glucose co-transporter-2; TUDCA, Tauroursodeoxycholic acid. (B) Meta-regression bubble plot using (log) difference in weight between intervention and control animals, after removal of studies using models that induce weight loss. (C) Meta-regression bubble plot using (log) difference in fasting insulin between intervention and control animals, after removal of studies using models that induce weight loss.
-
Figure 2—source data 1
Results of meta-analysis and meta-regression of hepatic triglyceride content in rodent studies of NAFLD.
Tab 1. Results from meta-analysis of hepatic triglyceride with subgroup by drug class. Tab 2. Results from meta-analysis of hepatic triglyceride with subgroup by individual drug. Tab 3. Results from meta-analysis of hepatic triglyceride with subgroup by drug class, after removal of outlier studies. Tab 4. Results from univariable meta-regression analyses. Tab 5. Results from model 1 (without drug) and model 2 (including drug used) multivariable meta-regression analyses.
- https://cdn.elifesciences.org/articles/56573/elife-56573-fig2-data1-v2.xlsx
Figure 2—figure supplement 1
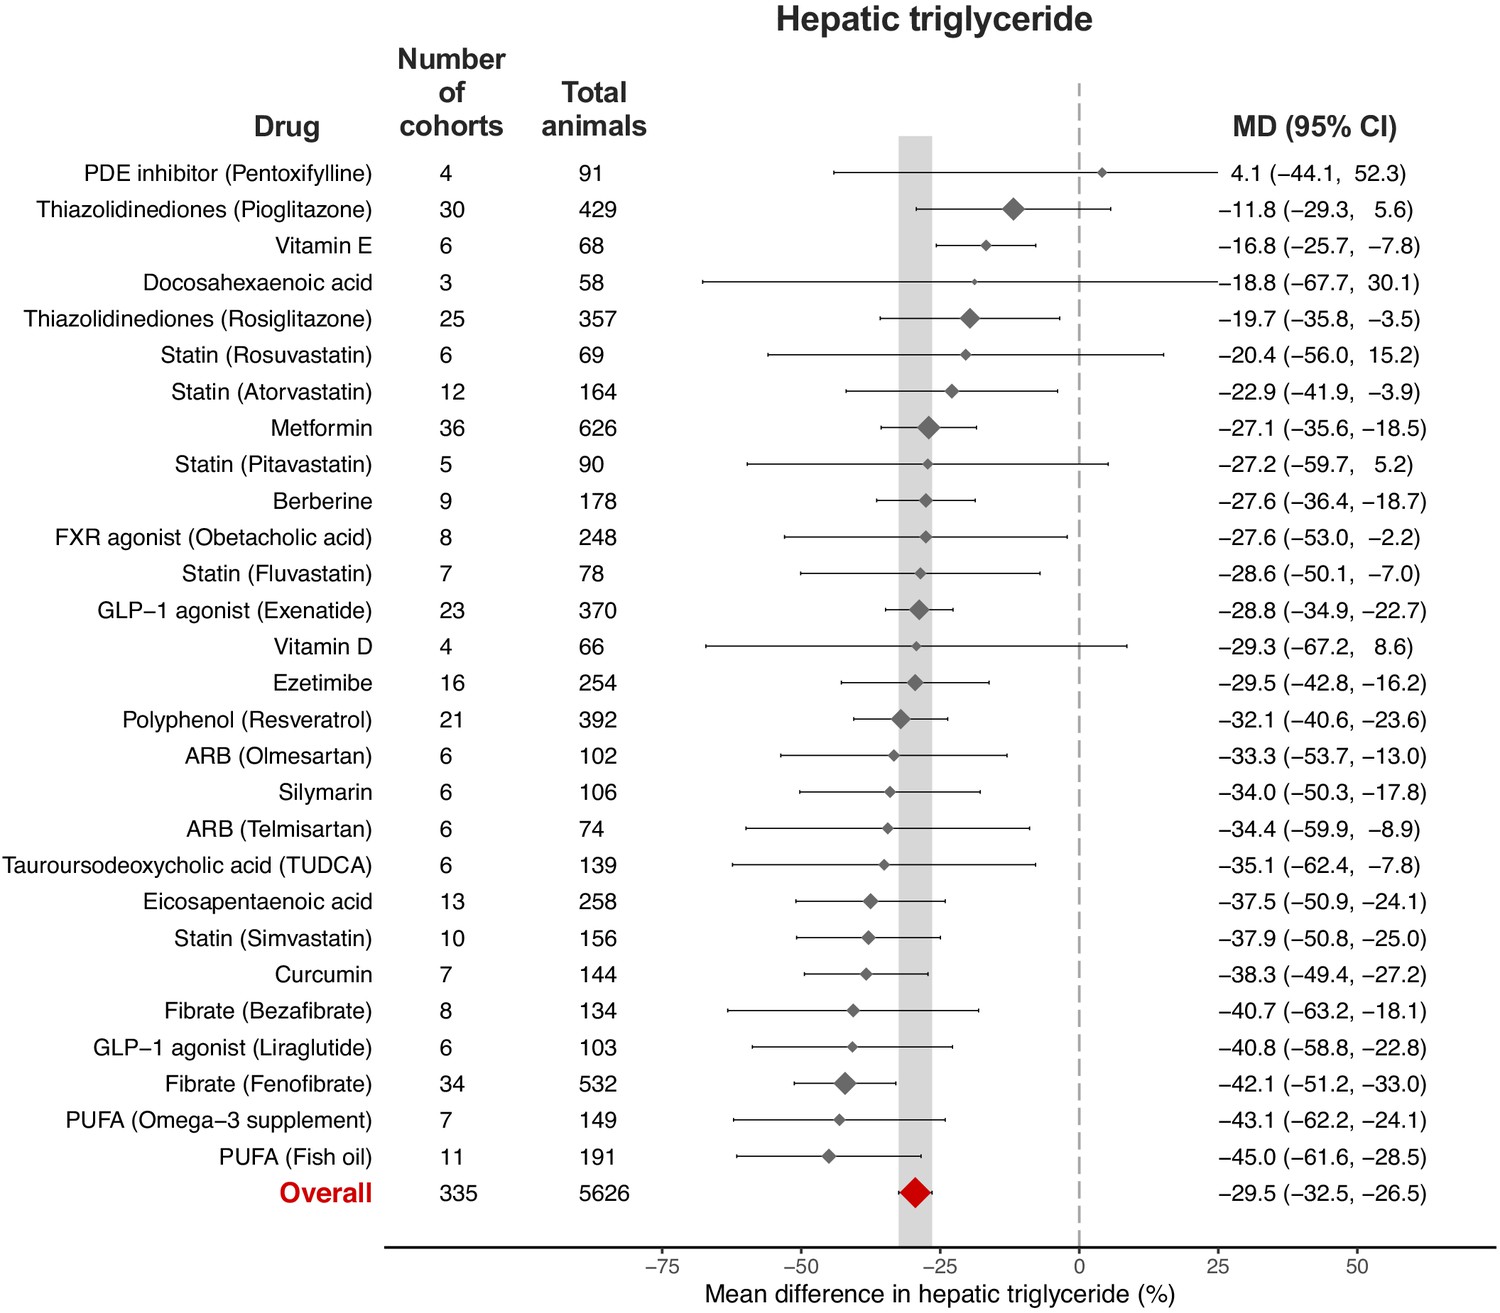
Meta-analysis of hepatic triglyceride content in rodent studies of NAFLD by individual drug.
Forest plot with subgrouping by individual drug. Individual studies have been hidden and only subgroup summaries are illustrated. Results are expressed as a percentage change relative to control (/placebo). Total animals is the sum of control and interventional animals for each subgroup. ARB, angiotensin receptor blocker; CI, confidence interval; DPP4, Dipeptidyl peptidase-4; FXR, Farnesoid X receptor; GLP-1, Glucagon-like peptide-1; MD, mean difference; LXR, Liver X receptor; PDE, Phosphodiesterase; PPAR, Peroxisome proliferator-activated receptor; PUFA; omega-3 polyunsaturated fatty acid; SCD-1, Stearoyl–CoA desaturase-1; SGLT2, Sodium-glucose co-transporter-2; TUDCA, Tauroursodeoxycholic acid.
Figure 2—figure supplement 2
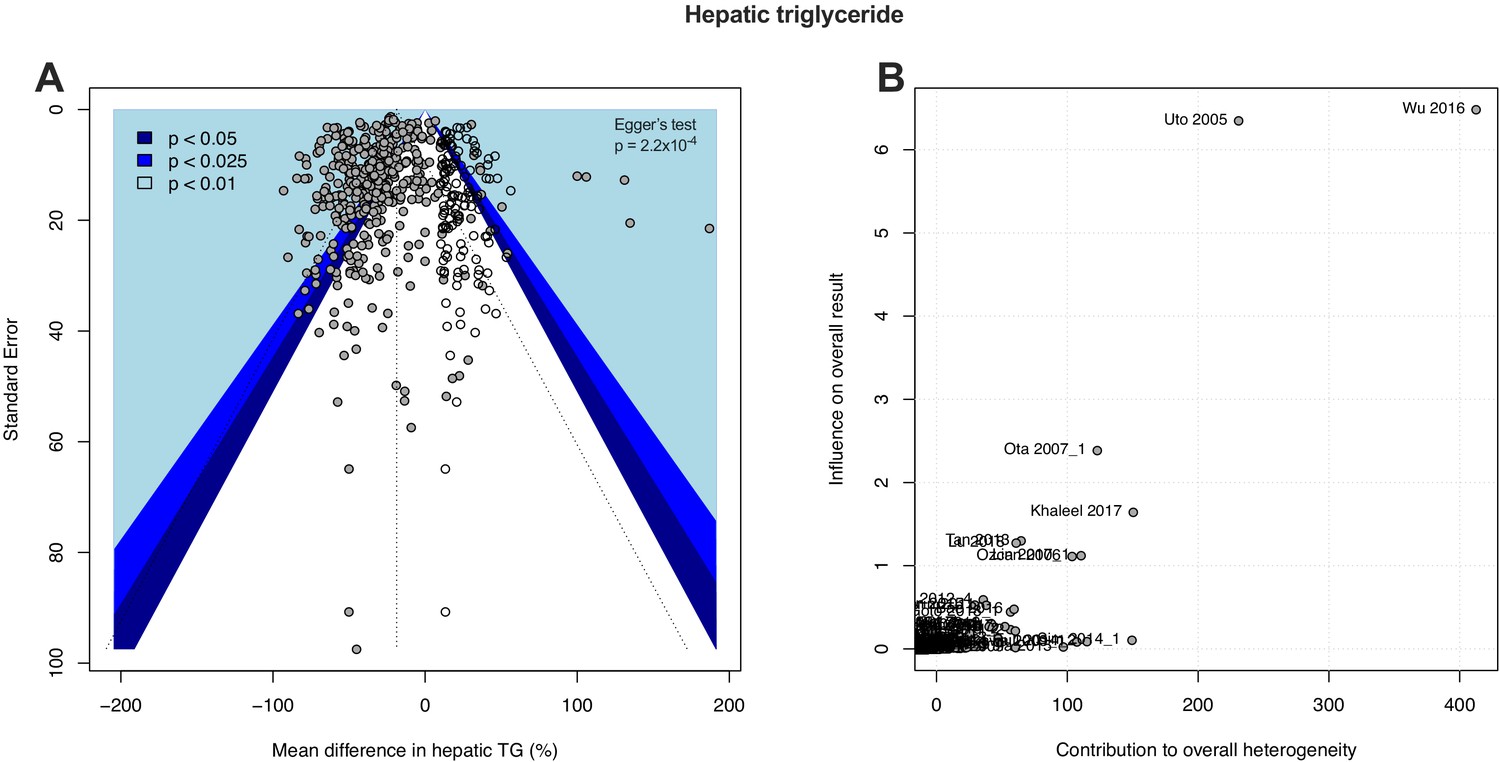
Funnel plot with trim-and-fill added studies and Baujat plot from meta-analysis of hepatic triglyceride content.
(A) Funnel plot illustrating study distribution (publication) bias in 428 original studies (solid grey circles) with 125 added studies (from trim-and-fill). The statistical significance associated with each study is illustrated with the coloured background. Egger’s test p-value indicates the likelihood that the original studies came from a symmetrical distribution. (B) Baujat plot showing individual study contributions to heterogeneity in the meta-analysis. The studies with highest contribution were excluded in a sensitivity analysis.
Figure 3 with 1 supplement
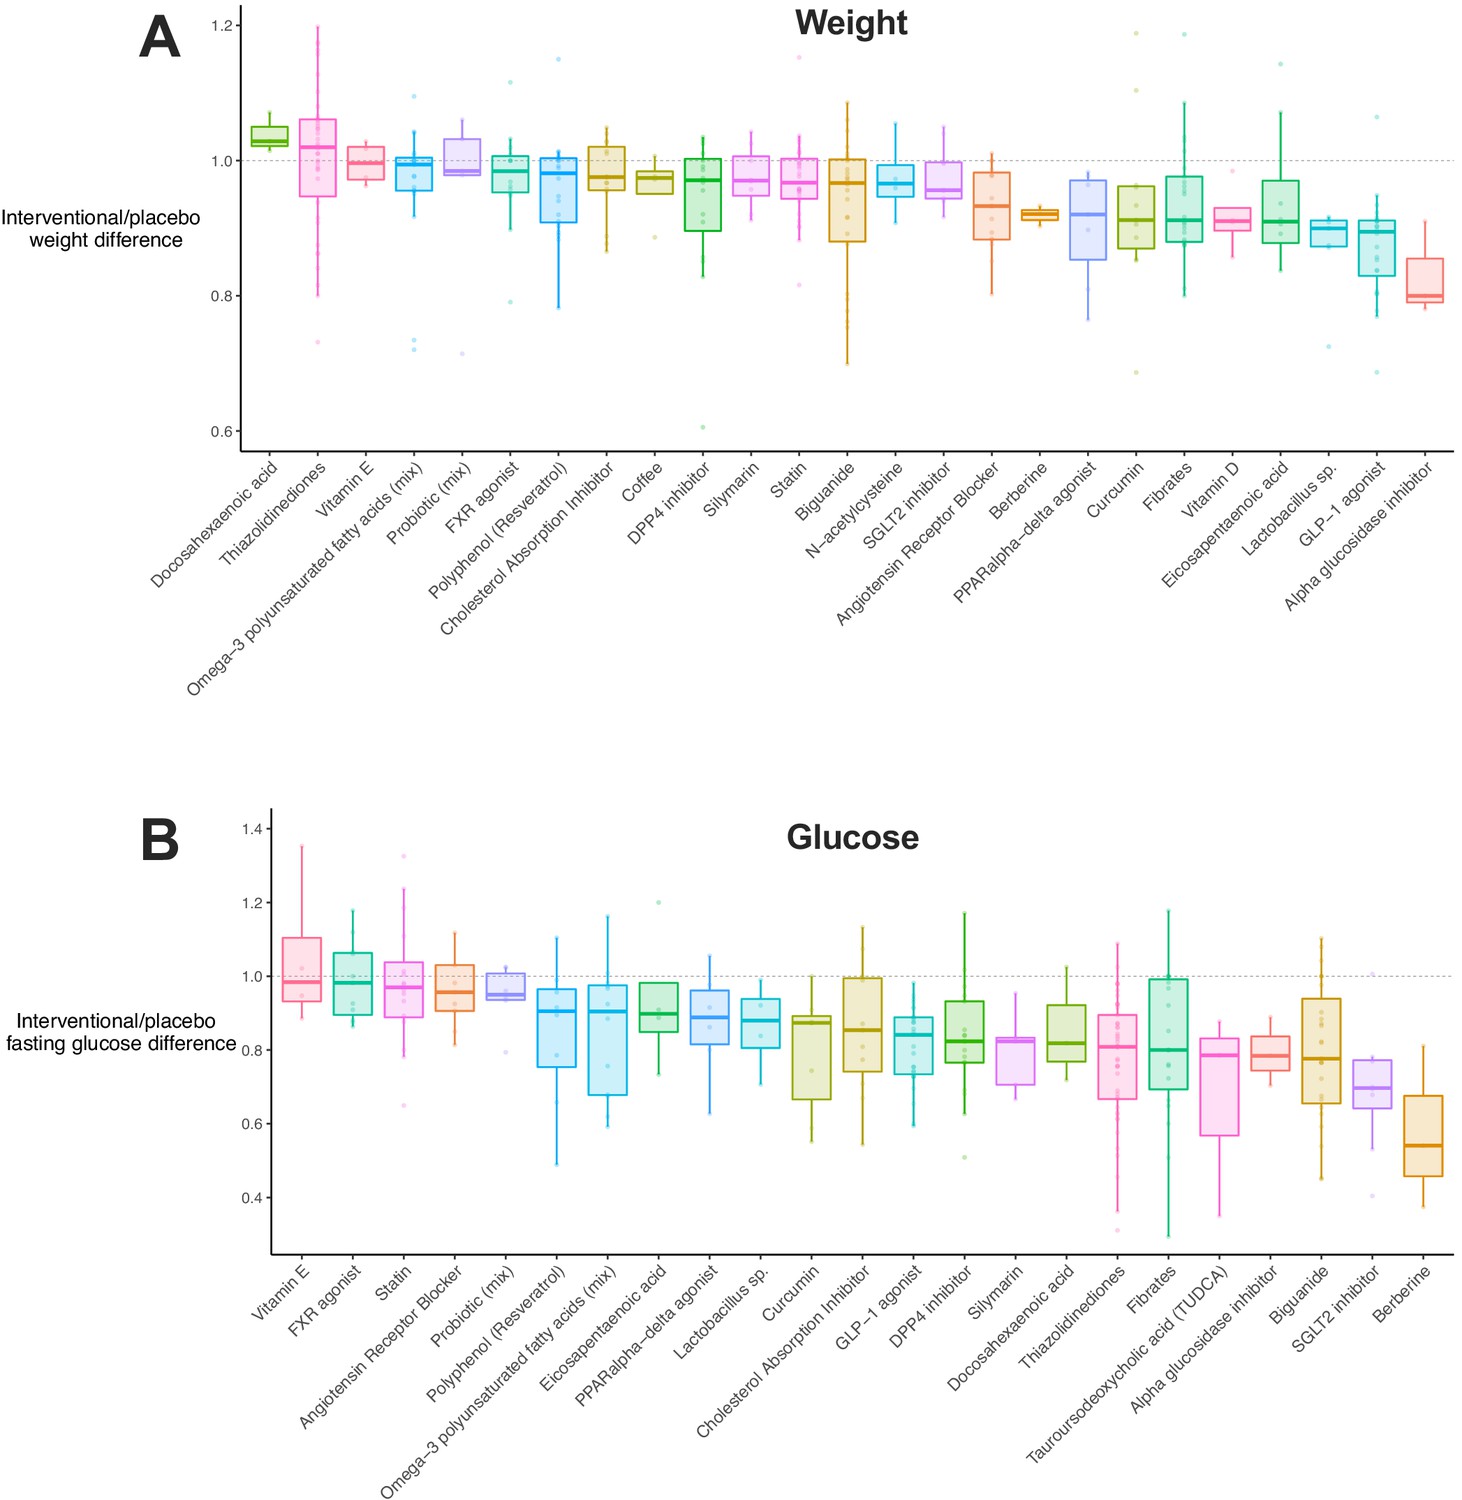
Weight and glucose difference associated with use of each drug class.
(A) Box plot illustrating the difference in weight in interventional animals, expressed as a decimal of the weight of the control animals. Raw data points are plotted for each drug class. (B) Box plot for difference in fasting glucose in interventional animals, expressed as a decimal of the weight of the control animals. Raw data points are plotted for each drug class.
-
Figure 3—source data 1
Results of difference in weight, glucose, and insulin for each drug class.
Mean, standard deviation, and 95% confidence intervals for the percentage difference in weight, fasting glucose, and fasting insulin between interventional and placebo animals. ACC, acetyl-CoA carboxylase; ACE, angiotensin-2 converting enzyme; CB1, cannabinoid receptor 1; DPP4 Dipeptidyl peptidase-4; FXR, Farnesoid X receptor; GLP-1, glucagon-like peptide-1; LXR, liver X receptor; PDE, phosphodiesterase; PPAR, peroxisome proliferator-activated receptor; SCD1, stearoyl–CoA desaturase-1; SGLT2, sodium-glucose co-transporter-2; TUDCA, tauroursodeoxycholic acid; and UDCA, ursodeoxycholic acid.
- https://cdn.elifesciences.org/articles/56573/elife-56573-fig3-data1-v2.xlsx
Figure 3—figure supplement 1
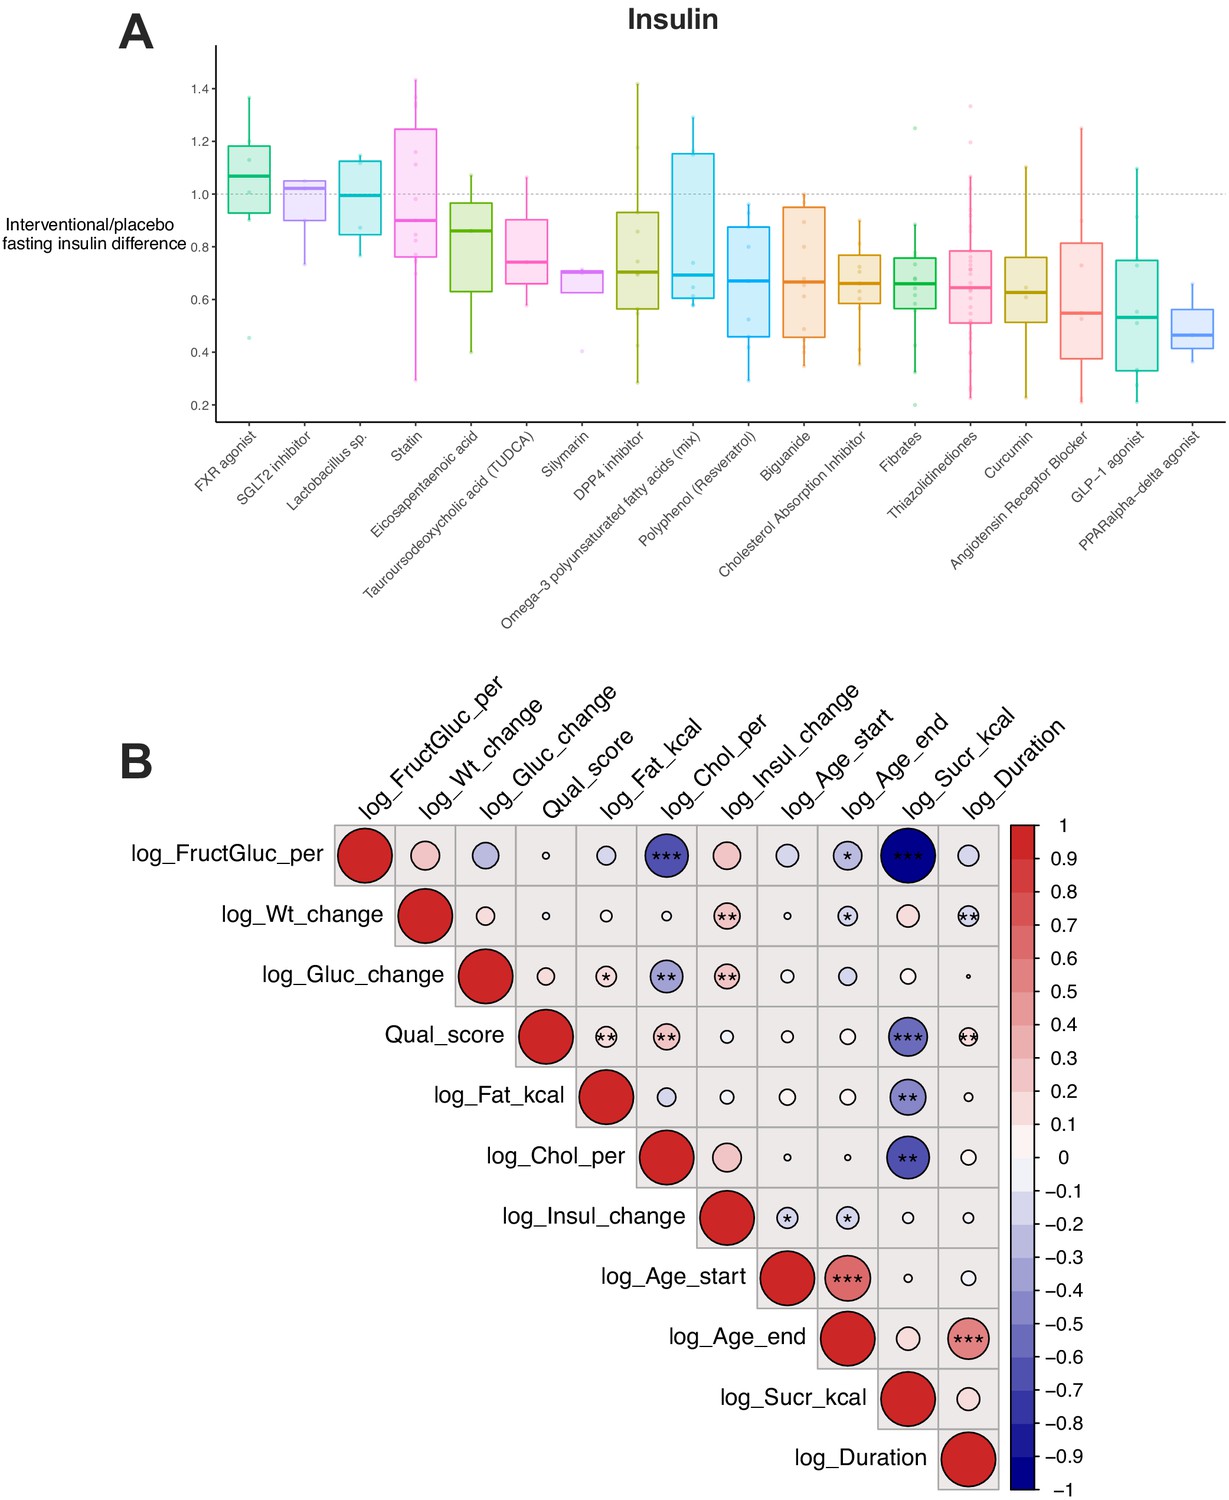
Insulin difference associated with use of each drug class and correlation plot of characteristics of studies.
(A) Box plot illustrating the difference in fasting insulin in interventional animals, expressed as a decimal of the weight of the control animals. Raw data points are plotted for each drug class. (B) Plot of Pearson correlation co-efficients (encoded by colour, where red = 1, blue = −1) for continuous traits associated with each cohort. Traits have been log-transformed prior to analysis. Stars indicate p-value associated with each correlation: ***p<0.001, **p<0.01, *p<0.05.
Figure 4 with 1 supplement

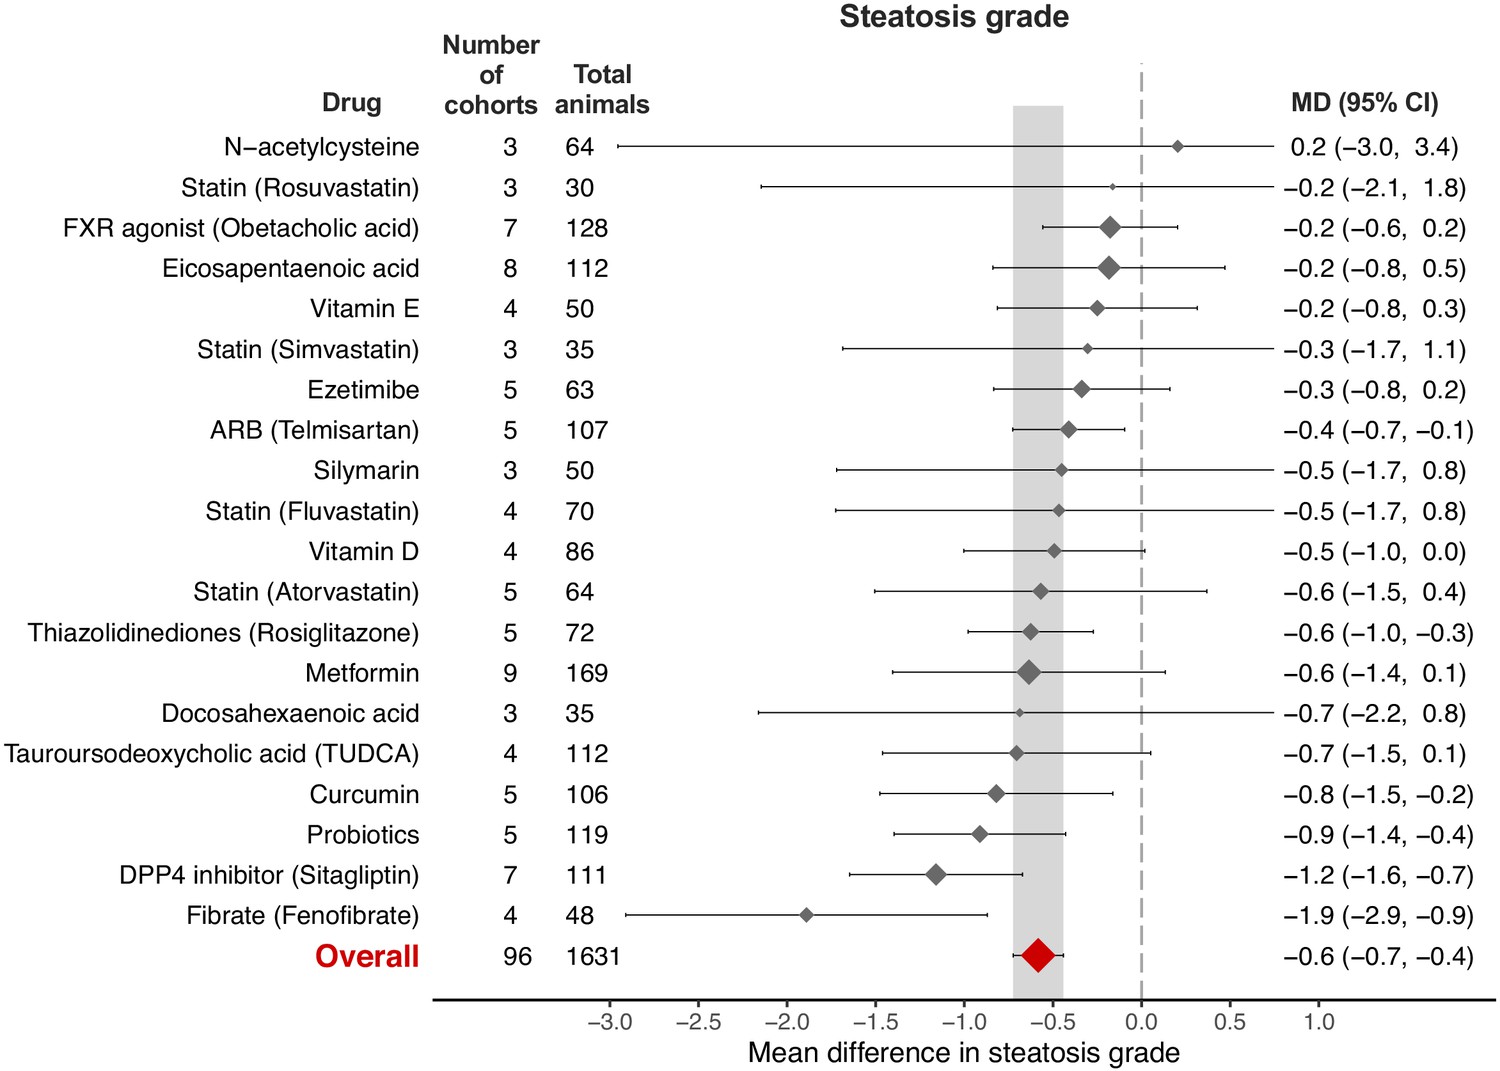
Meta-analysis of steatosis grade in rodent studies of NAFLD.
(A) Forest plot with subgrouping by class of drug. Individual studies have been hidden and only subgroup summaries are illustrated. The total number of animals is calculated from the sum of control and interventional animals for each subgroup. CI, confidence interval; DPP4, Dipeptidyl peptidase-4; FXR, Farnesoid X receptor; GLP-1, Glucagon-like peptide-1; MD, mean difference; TUDCA, Tauroursodeoxycholic acid. (B) Meta-regression bubble plot using (log) difference in fasting glucose between interventional and control animals, after removal of studies using models that induce weight loss. (C) Meta-regression bubble plot using (log) difference in fasting insulin between interventional and control animals, after removal of studies using models that induce weight loss.
-
Figure 4—source data 1
Results of meta-analysis and meta-regression of steatosis grade in rodent studies of NAFLD.
Tab 1. Results from meta-analysis of steatosis grade with subgroup by drug class. Tab 2. Results from meta-analysis of steatosis grade with subgroup by individual drug. Tab 3. Results from meta-analysis of steatosis grade with subgroup by drug class, after removal of outlier studies. Tab 4. Results from univariable meta-regression analyses. Tab 5. Results from model 1 (without drug) and model 2 (including drug class used) multivariable meta-regression analyses.
- https://cdn.elifesciences.org/articles/56573/elife-56573-fig4-data1-v2.xlsx
Figure 4—figure supplement 1
Meta-analysis of steatosis grade in rodent studies of NAFLD by individual drug.
Forest plot with subgrouping by individual drug. Individual studies have been hidden and only subgroup summaries are illustrated. Total animals is the sum of control and interventional animals for each subgroup. ARB, angiotensin receptor blocker; CI, confidence interval; DPP4, Dipeptidyl peptidase-4; FXR, Farnesoid X receptor; MD, mean difference; TUDCA, tauroursodeoxycholic acid.
Figure 5 with 1 supplement
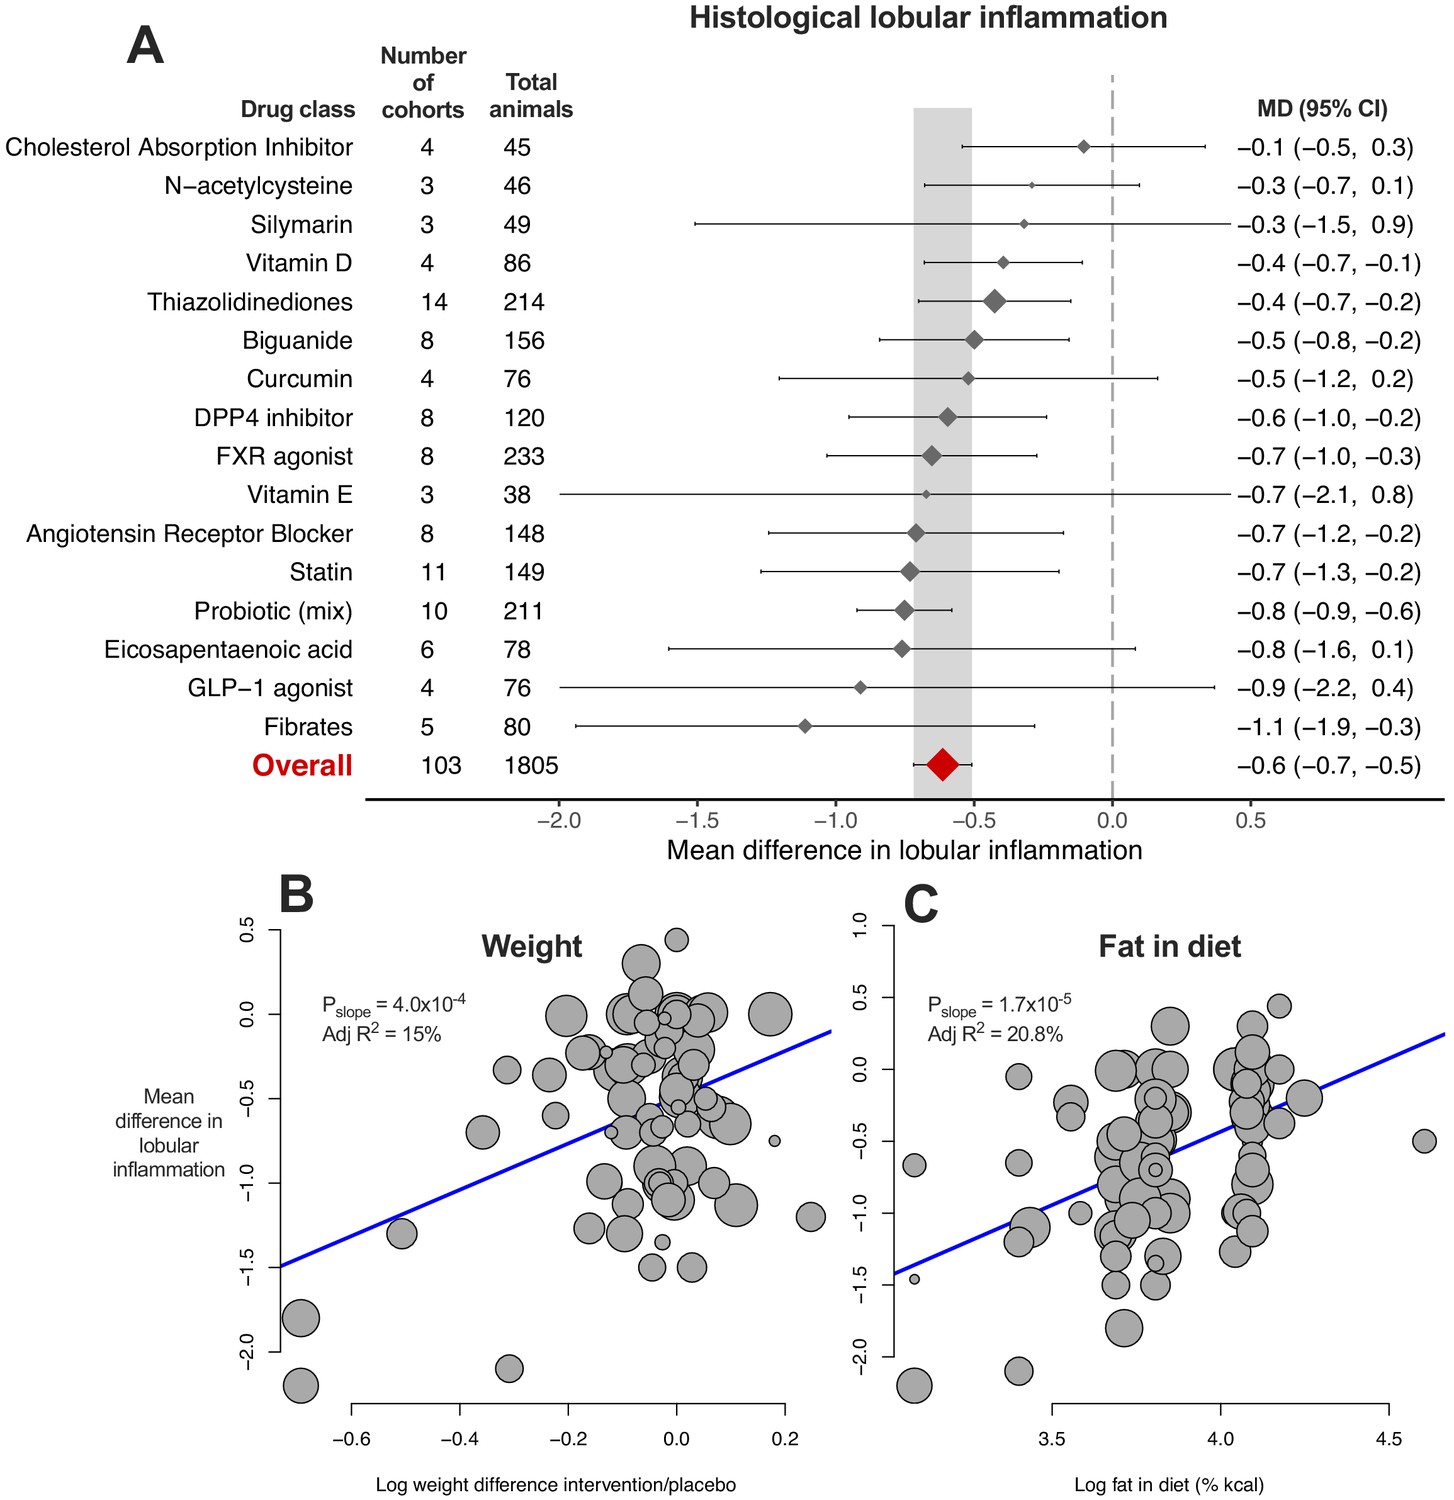
Meta-analysis of lobular inflammation in rodent studies of NAFLD.
(A) Forest plot with subgrouping by class of drug. Individual studies have been hidden and only subgroup summaries are illustrated. The total number of animals is calculated from the sum of control and interventional animals for each subgroup. CI, confidence interval; DPP4, Dipeptidyl peptidase-4; FXR, Farnesoid X receptor; GLP-1, Glucagon-like peptide-1; MD, mean difference. (B) Meta-regression bubble plot using (log) difference in weight between interventional and control animals, after removal of studies using models that induce weight loss. (C) Meta-regression bubble plot using (log) fat (%kcal) in diet for each cohort.
-
Figure 5—source data 1
Results of meta-analysis and meta-regression of lobular inflammation in rodent studies of NAFLD.
Tab 1. Results from meta-analysis of lobular inflammation with subgroup by drug class. Tab 2. Results from meta-analysis of lobular inflammation with subgroup by individual drug. Tab 3. Results from meta-analysis of lobular inflammation with subgroup by drug class, after removal of outlier studies. Tab 4. Results from univariable meta-regression analyses. Tab 5. Results from multivariable meta-regression analyses.
- https://cdn.elifesciences.org/articles/56573/elife-56573-fig5-data1-v2.xlsx
Figure 5—figure supplement 1
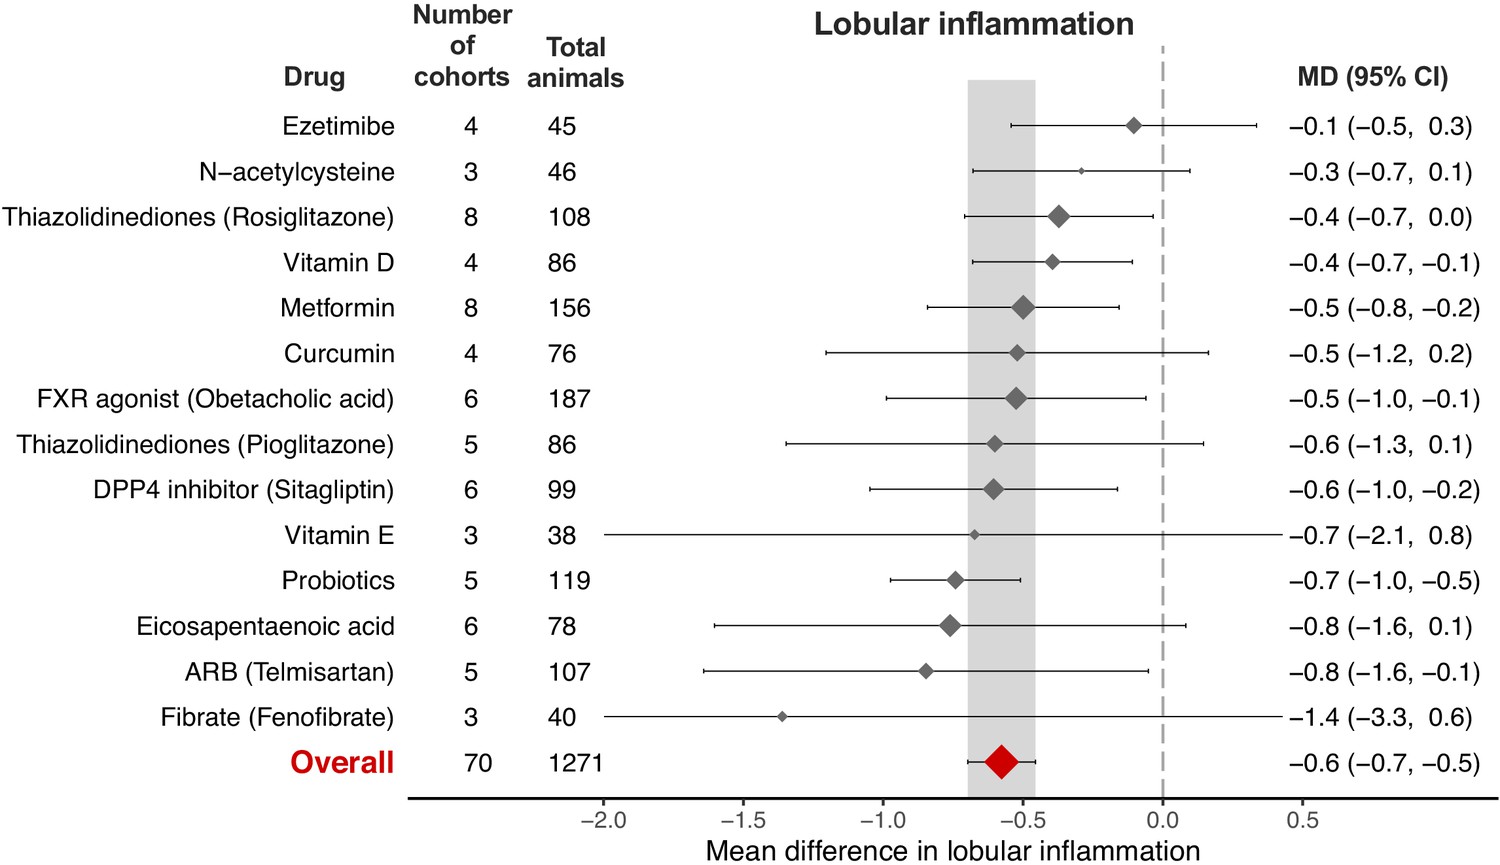
Meta-analysis of lobular inflammation in rodent studies of NAFLD by individual drug.
Forest plot with subgrouping by individual drug. Individual studies have been hidden and only subgroup summaries are illustrated. Total animals is the sum of control and interventional animals for each subgroup. ARB, angiotensin receptor blocker; CI, confidence interval; DPP4, Dipeptidyl peptidase-4; FXR, Farnesoid X receptor; MD, mean difference.
Figure 6 with 1 supplement
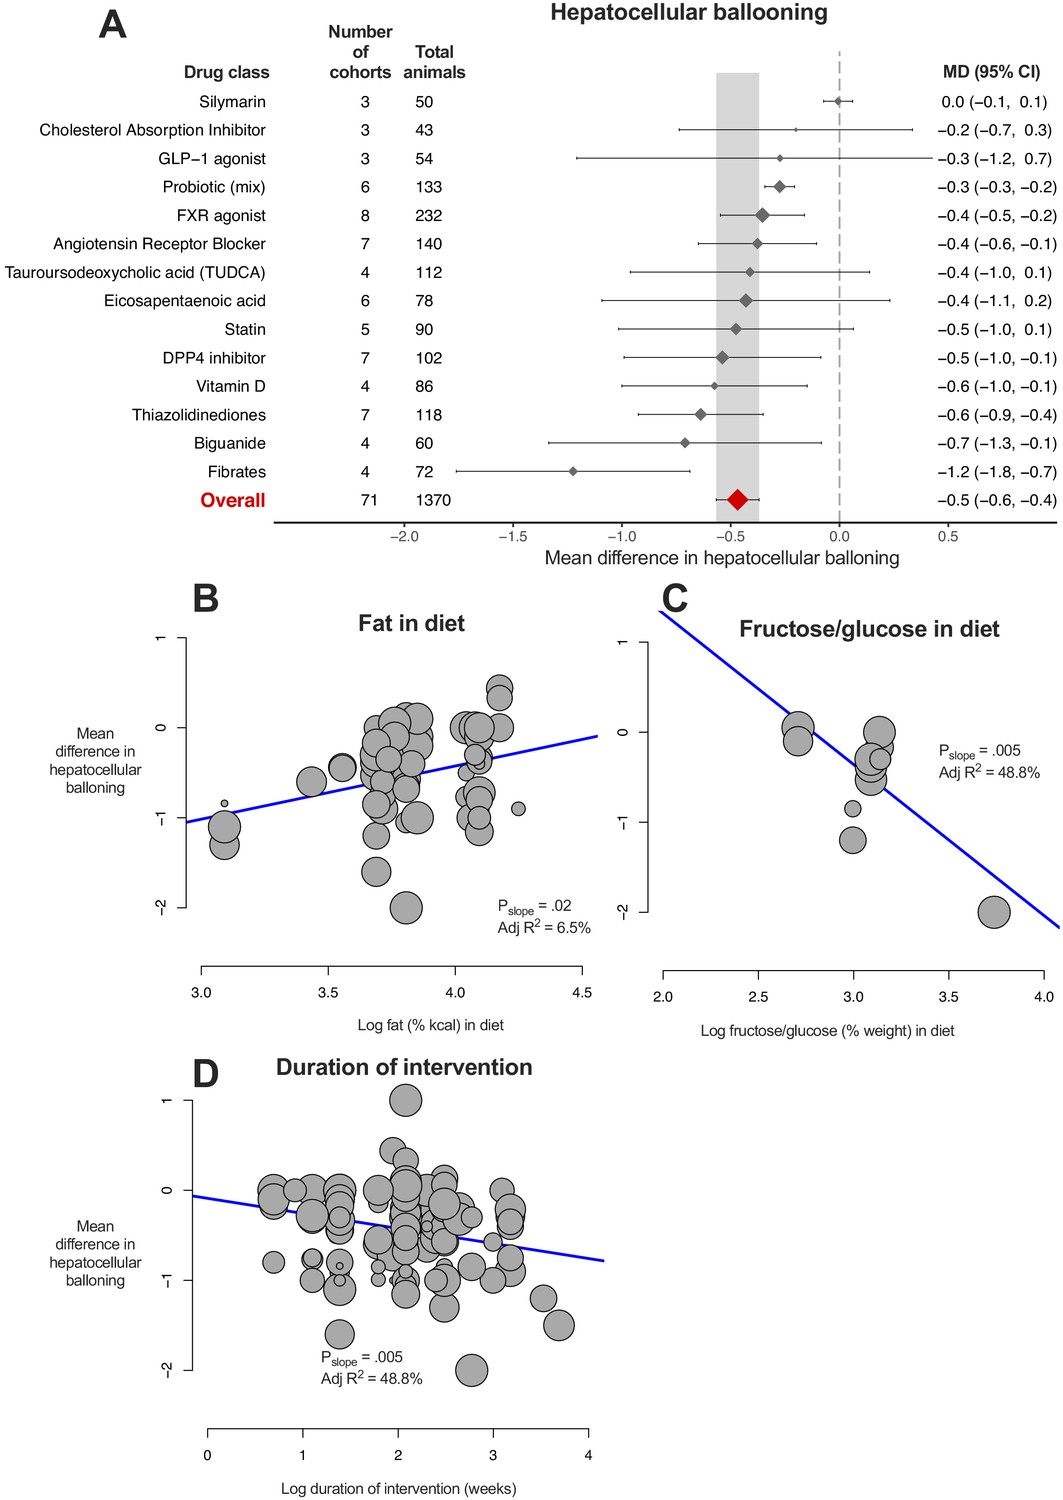
Meta-analysis of hepatocellular ballooning in rodent studies of NAFLD.
(A) Forest plot with subgrouping by class of drug. Individual studies have been hidden and only subgroup summaries are illustrated. The total number of animals is calculated from the sum of control and interventional animals for each subgroup. CI, confidence interval; DPP4, Dipeptidyl peptidase-4; FXR, Farnesoid X receptor; GLP-1, Glucagon-like peptide-1; MD, mean difference; TUDCA, tauroursodeoxycholic acid. (B) Meta-regression bubble plot using (log) fat (%kcal) in diet for each cohort. (C) Meta-regression bubble plot using (log) fructose/glucose (% weight) in diet for each cohort. (D) Meta-regression bubble plot using (log) duration of intervention (in weeks) for each cohort.
-
Figure 6—source data 1
Results of meta-analysis and meta-regression of hepatocellular ballooning in rodent studies of NAFLD.
Tab 1. Results from meta-analysis of hepatocellular ballooning with subgroup by drug class. Tab 2. Results from meta-analysis of hepatocellular ballooning with subgroup by individual drug. Tab 3. Results from meta-analysis of hepatocellular ballooning with subgroup by drug class, after removal of outlier studies. Tab 4. Results from univariable meta-regression analyses.
- https://cdn.elifesciences.org/articles/56573/elife-56573-fig6-data1-v2.xlsx
Figure 6—figure supplement 1
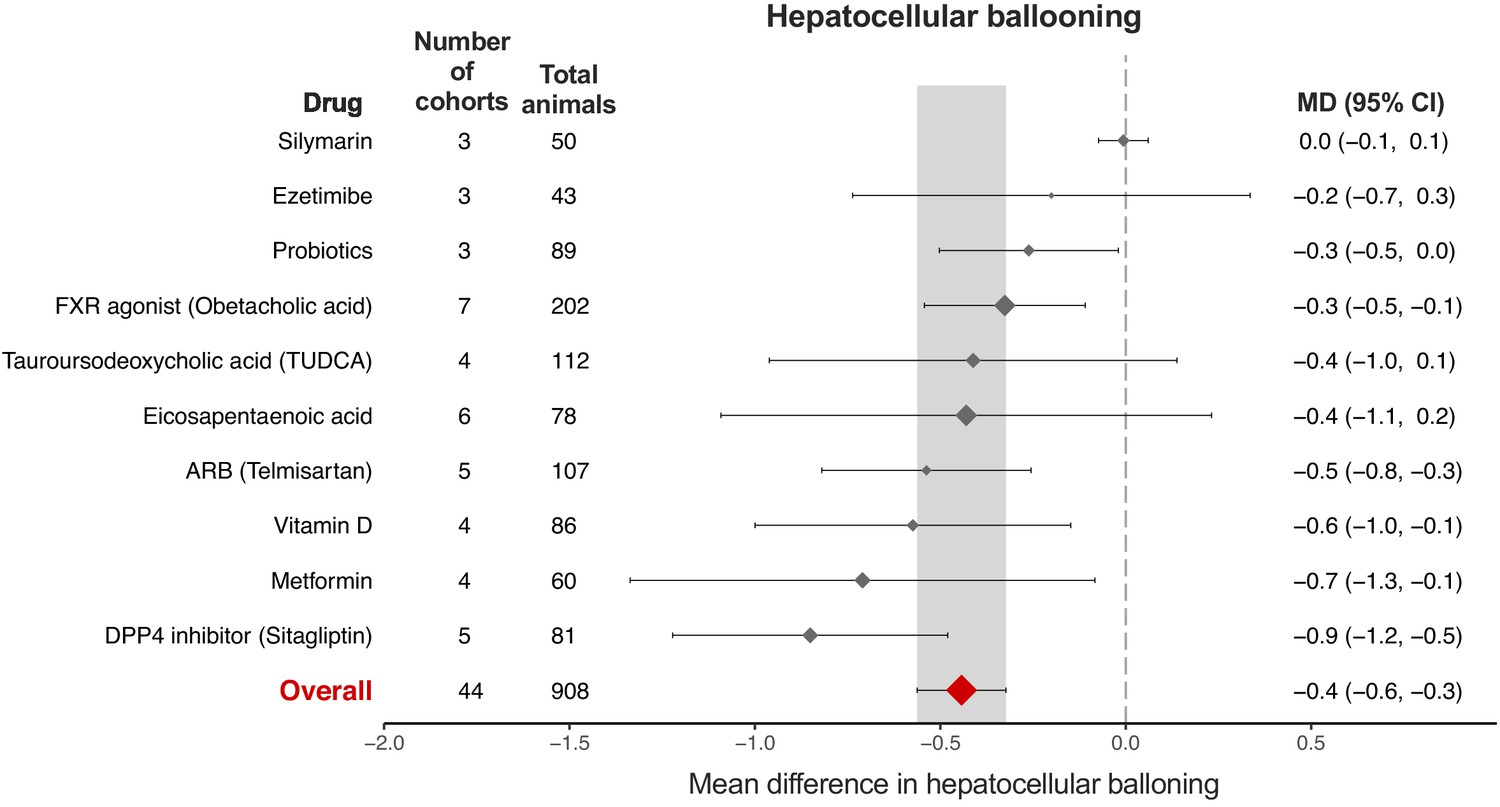
Meta-analysis of hepatocellular ballooning in rodent studies of NAFLD by individual drug.
Forest plot with subgrouping by individual drug. Individual studies have been hidden and only subgroup summaries are illustrated. Total animals is the sum of control and interventional animals for each subgroup. ARB, angiotensin receptor blocker; CI, confidence interval; DPP4, Dipeptidyl peptidase-4; FXR, Farnesoid X receptor; MD, mean difference; TUDCA, tauroursodeoxycholic acid.
Figure 7 with 1 supplement
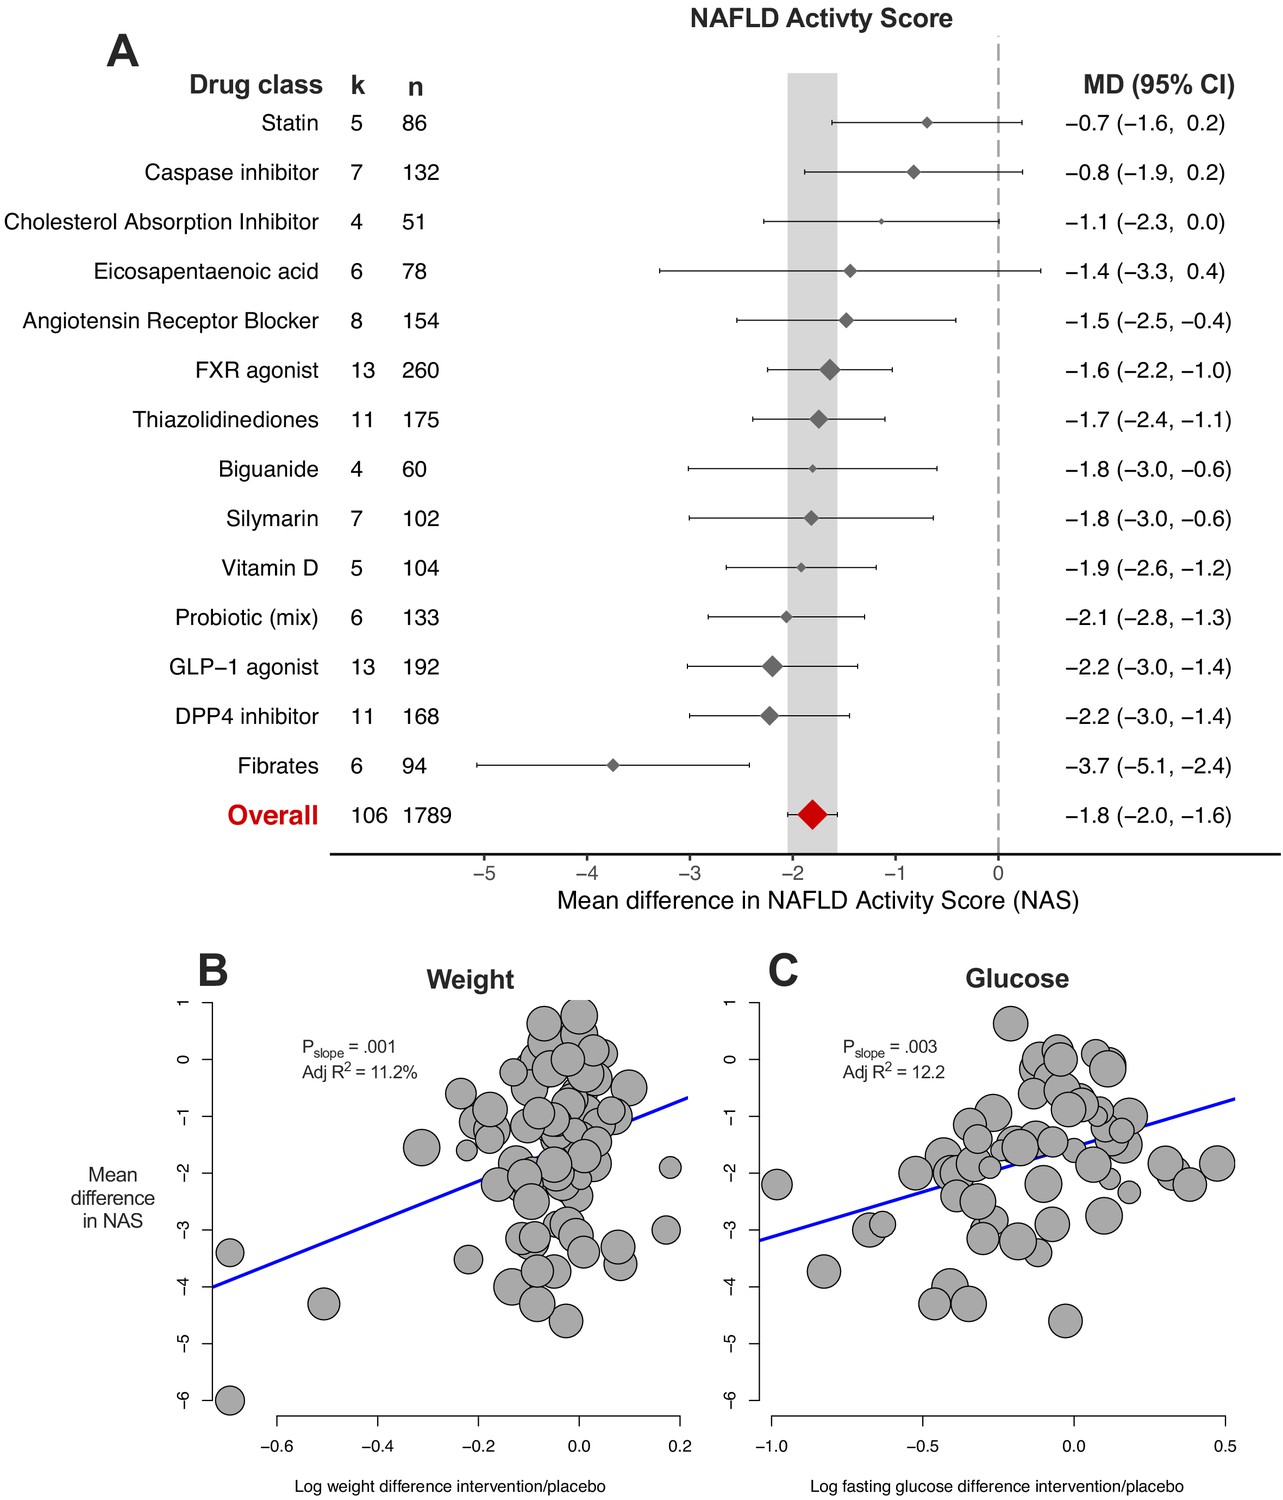
Meta-analysis of NAFLD Activity Score (NAS) in rodent studies of NAFLD.
(A) Forest plot with subgrouping by class of drug. Individual studies have been hidden and only subgroup summaries are illustrated. k represents the number of cohorts in each subgroup. The total number of animals is calculated from the sum of control and interventional animals for each subgroup. CI, confidence interval; DPP4, Dipeptidyl peptidase-4; FXR, Farnesoid X receptor; GLP-1, Glucagon-like peptide-1; MD, mean difference. (B) Meta-regression bubble plot using (log) difference in weight between interventional and control animals, after removal of studies using models that induce weight loss. (C) Meta-regression bubble plot using (log) difference in glucose between interventional and control animals, after removal of studies using models that induce weight loss.
-
Figure 7—source data 1
Results of meta-analysis and meta-regression of NAFLD Activity Score (NAS) in rodent studies of NAFLD.
Tab 1. Results from meta-analysis of NAS with subgroup by drug class. Tab 2. Results from meta-analysis of NAS with subgroup by individual drug. Tab 3. Results from meta-analysis of NAS with subgroup by drug class, after removal of outlier studies. Tab 4. Results from univariable meta-regression analyses. Tab 5. Results from model 1 (without drug) and model 2 (including drug used) multivariable meta-regression analyses.
- https://cdn.elifesciences.org/articles/56573/elife-56573-fig7-data1-v2.xlsx
Figure 7—figure supplement 1

Meta-analysis of NAFLD Activity Score (NAS) in rodent studies of NAFLD by individual drug.
Forest plot with subgrouping by individual drug. Individual studies have been hidden and only subgroup summaries are illustrated. k represents the number of cohorts in each subgroup. Total animals is the sum of control and interventional animals for each subgroup. ARB, angiotensin receptor blocker; CI, confidence interval; DPP4, Dipeptidyl peptidase-4; FXR, Farnesoid X receptor; MD, mean difference.
Figure 8 with 1 supplement
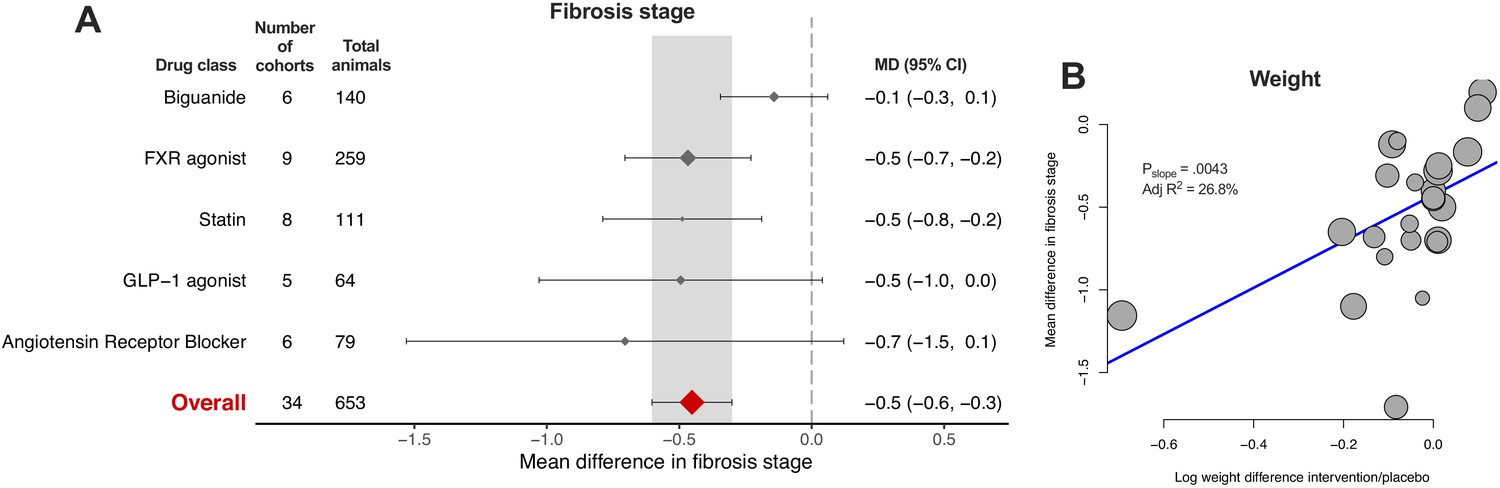
Meta-analysis of fibrosis stage in rodent studies of NAFLD.
(A) Forest plot with subgrouping by class of drug. Individual studies have been hidden and only subgroup summaries are illustrated. The total number of animals is calculated from the sum of control and interventional animals for each subgroup. CI, confidence interval; FXR, Farnesoid X receptor; GLP-1, Glucagon-like peptide-1; MD, mean difference. (B) Meta-regression bubble plot using (log) difference in weight between interventional and control animals, after removal of studies using models that induce weight loss.
-
Figure 8—source data 1
Results of meta-analysis and meta-regression of fibrosis stage in rodent studies of NAFLD.
Tab 1. Results from meta-analysis of fibrosis stage with subgroup by drug class. Tab 2. Results from meta-analysis of fibrosis stage with subgroup by individual drug. Tab 3. Results from meta-analysis of fibrosis stage with subgroup by drug class, after removal of outlier studies. Tab 4. Results from univariable meta-regression analyses. Tab 5. Results from multivariable meta-regression analyses.
- https://cdn.elifesciences.org/articles/56573/elife-56573-fig8-data1-v2.xlsx
Figure 8—figure supplement 1
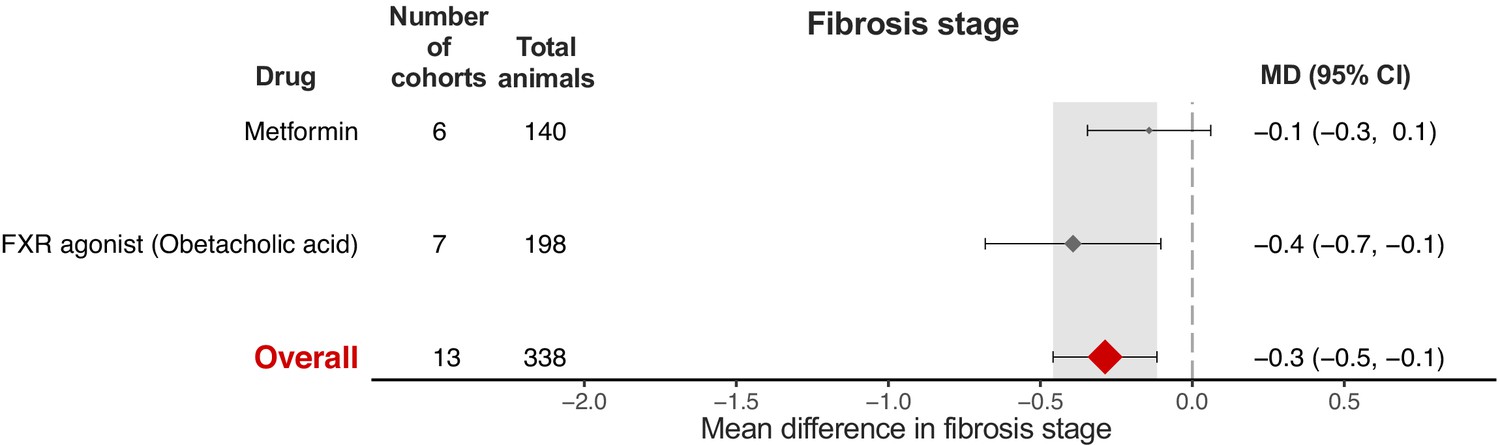
Meta-analysis of fibrosis stage in rodent studies of NAFLD by individual drug.
Forest plot with subgrouping by individual drug. Individual studies have been hidden and only subgroup summaries are illustrated. Total animals is the sum of control and interventional animals for each subgroup. CI, confidence interval; FXR, Farnesoid X receptor; MD, mean difference.
Figure 9 with 1 supplement

Funnel plots illustrating study distribution bias from meta-analyses of histological features.
(A) Funnel plot illustrating study distribution (publication) bias in 145 original studies (solid grey circles) with 54 added studies (from trim-and-fill) for meta-analysis of steatosis grade. The statistical significance associated with each study is illustrated with the coloured background. Egger’s test p-value indicates the likelihood that the original studies came from a symmetrical distribution. (B) Funnel plot for lobular inflammation meta-analysis with 103 original studies and 42 added studies. (C) Funnel plot for fibrosis stage meta-analysis with 34 original studies and 14 added studies. (D) Funnel plot for NAS meta-analysis with 106 original studies and 43 added studies.
Figure 9—figure supplement 1
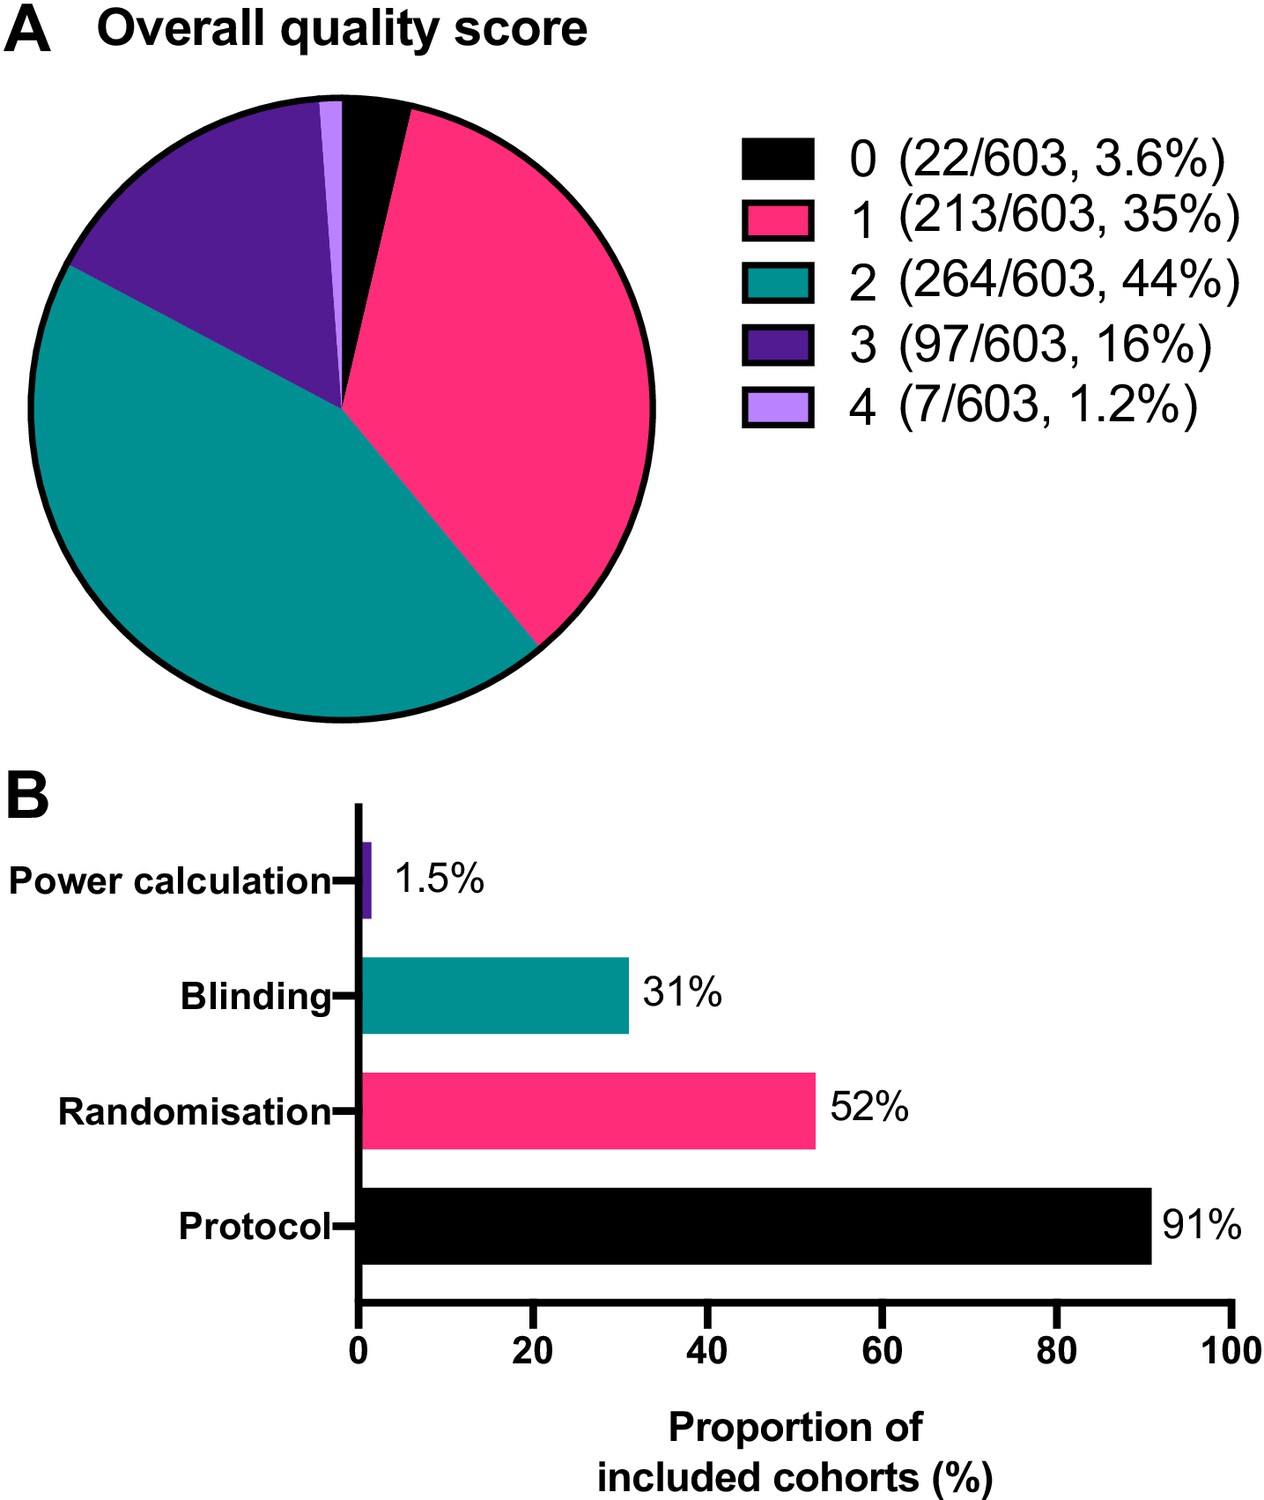
Quality assessment of included cohorts.
(A) Distribution of overall quality scores from a four-point scale, composed of the use of a power calculation, use of blinding, randomisation, and referring to a predefined protocol, with 1-point awarded for presence of each factor. (B) Proportion of cohorts achieving each factor is shown in B.
Figure 10
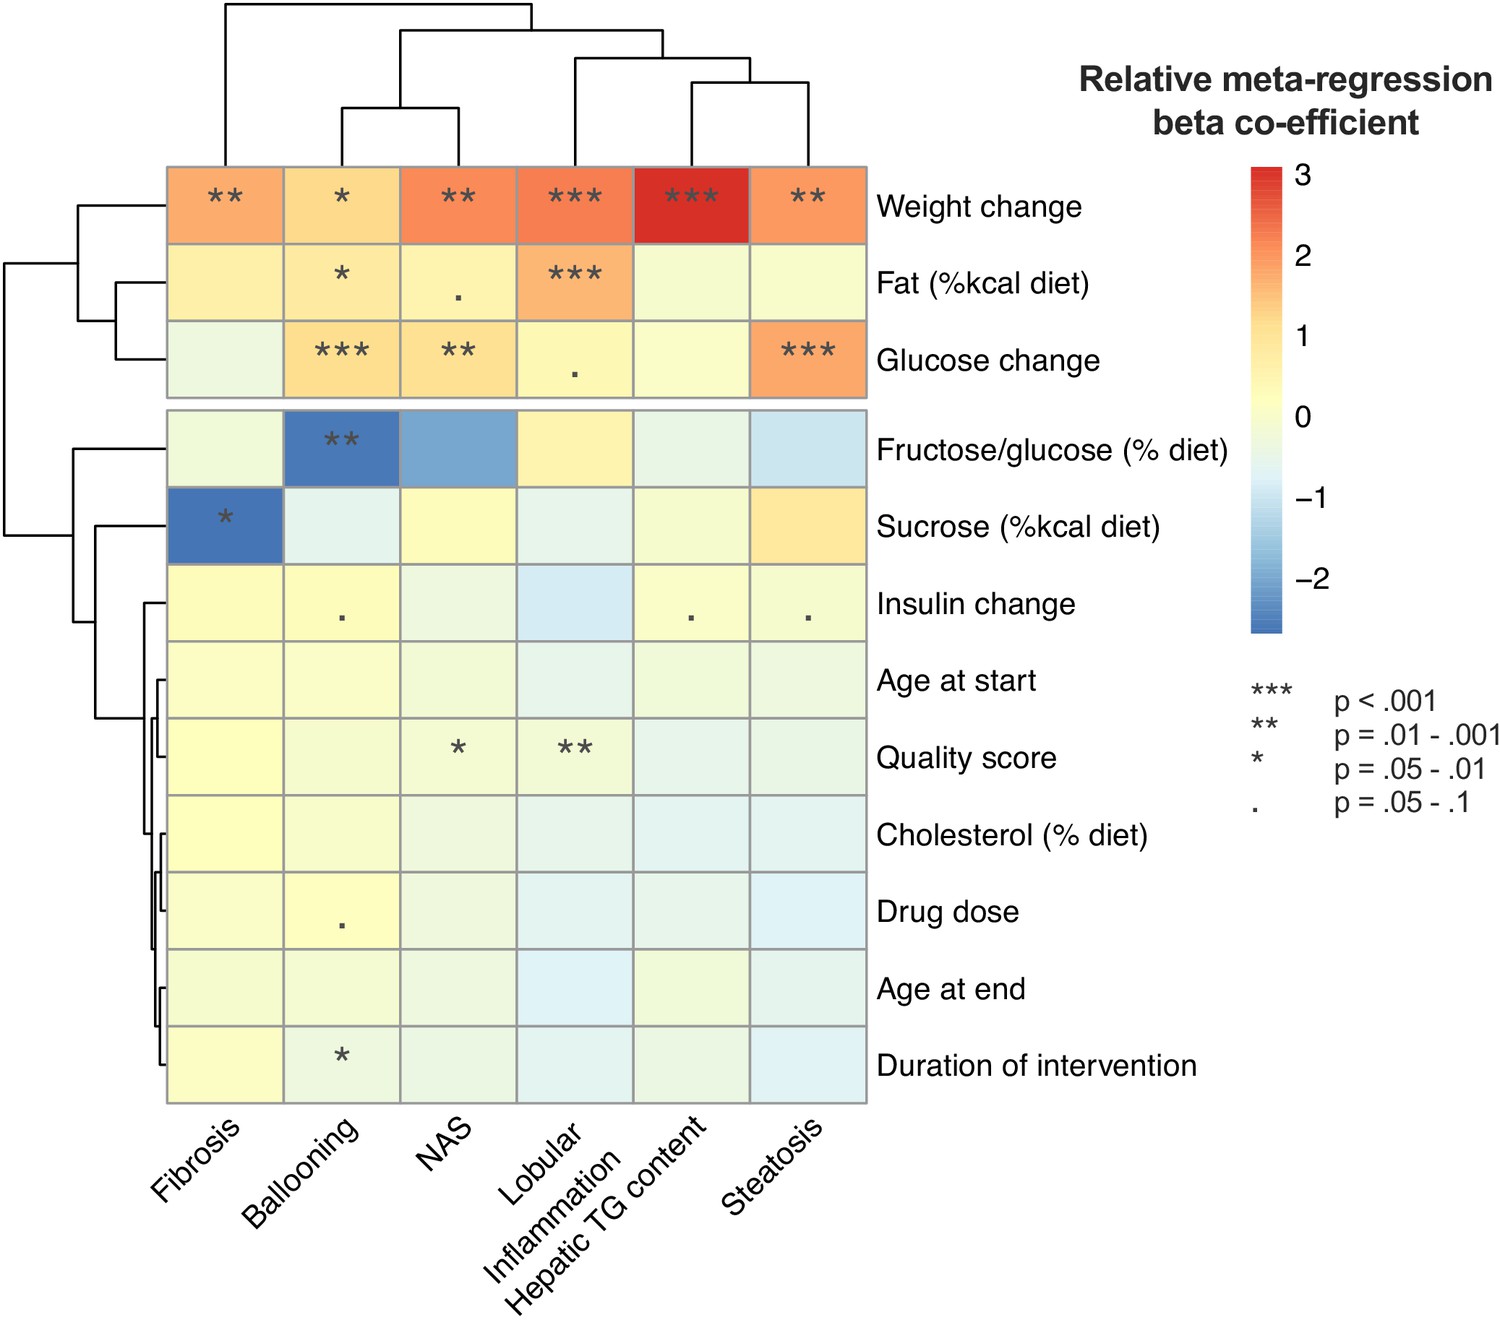
Summary of univariable meta-regression results across all outcomes.
Author response image 1
Tables
Table 1
Summary of findings across all outcomes and multivariable meta-regression analyses.
Six separate meta-analyses were performed with subgrouping by classes of drug. Drug classes associated with outcome showed a significant reduction in the severity of NAFLD for that outcome, defined by the upper limit of their 95% confidence interval (CI). Differential efficacy refers to drug classes where their 95% CI did not overlap with that of the overall estimate. Multivariable meta-regression was performed using two models, where there was sufficient data: model one did not include drug class, model two included drug. For each analysis and model, the top variables are those identified to be substantially account for heterogeneity using multiple-variable inference. K refers to the number of cohorts included in each analysis. P-val* for each model refers to the overall model p-value (test of moderators) obtained after running multiple permutation tests, where p<0.1 should be considered indicative of an effect. ARB, angiotensin receptor blocker; DPP4-i, Dipeptidyl peptidase-4 inhibitor; EPA, eicosapentaenoic acid; FXR, Farnesoid X receptor; GLP-1, glucagon-like peptide-1; PPAR, peroxisome proliferator-activated receptor; PUFA; omega-3 polyunsaturated fatty acid; SCD1-i, stearoyl–CoA desaturase-1 inhibitor; SGLT2-i, sodium-glucose co-transporter-2 inhibitor; TUDCA, tauroursodeoxycholic acid.
| Meta-analysis with subgroup by drug class | Multi-variable meta-regression – model 1 | Multi-variable meta-regression – model 2 | ||||
|---|---|---|---|---|---|---|
| Outcome | Drug classes associated with outcome | Differential efficacy | Top predictors | Final model | Top predictors | Final model |
| Hepatic TG | 22/28 (79%): SCD1-i, PUFA-mix, Fibrates, Bifidobacterium sp., DPP4-i, Curcumin, EPA, Silymarin, TUDCA, Polyphenol, GLP1 agonist, ARB, FXR agonist, SGLT2-i, PPARα-δ agonist, Cholesterol Absorption Inhibitor, Berberine, Statin, Biguanide, Lactobacillus sp., Vitamin E | Greater reduction: Fibrates, PUFA-mix Smaller reduction: Thiazolidinediones, Vitamin E | Weight, Insulin, Fat (%kcal), Model, Age at start, Background, Glucose, Sex, Duration, Quality score (k = 333) | R2 = 48.9%, P-val*=0.22 K = 67 | Insulin, Fat (%kcal), Weight, Glucose, Age at start, Sex, Drug (k = 222) | R2 = 100%, P-val*=0.26 K = 42 |
| Steatosis | 9/22, (41%): Fibrates, GLP-1 agonist, DPP4-i, Probiotic (mix), Curcumin, Thiazolidinediones, Lactobacillus sp., Statin, ARB | Greater reduction: Fibrates | Glucose, Fat (%kcal), Sex (k = 94) | R2 = 91.8%, P-val*=0.03 K = 19 | Fat (%kcal), Sex, Weight (k = 62) | R2 = 60.3%, P-val*=0.098 K = 27 |
| Lobular inflammation | 9/16 (56%): Fibrates, Probiotic (mix), Statin, ARB, FXR agonist, DPP4-i, Biguanide, Thiazolidinediones, Vitamin D | - | Glucose, Fat (%kcal) (k = 81) | R2 = 49.8%, P-val*=0.43 K = 19 | - | - |
| Ballooning | 8/14 (57%): Fibrates, Biguanide, Thiazolidinediones, Vitamin D, DPP4-i, ARB, FXR agonist, Probiotic (mix) | Greater reduction: Fibrates Smaller reduction: Probiotic (mix) | Glucose (k = 56) | R2 = 8.1%, P-val*=0.38 K = 26 | - | - |
| NAFLD Activity Score | 10/14 (71%):Fibrates, DPP4-i, GLP1 agonist, Probiotic (mix), Vitamin D, Silymarin, Biguanide, Thiazolidinediones, FXR agonist, ARB | Greater reduction: Fibrates | Glucose, Fat (%kcal), Age at start, Weight (k = 89) | R2 = 78.0%, P-val*=0.03 K = 19 | Fat (%kcal), Weight, Background, Age at start, Sex (k = 58) | R2 = 63.1%, P-val*=0.001 K = 30 |
| Fibrosis | 2/5 (40%): FXR agonist, Statin | - | Model, Weight, Glucose, Fat (%kcal), Duration, Age at start (k = 58) | R2 = 100%, P-val*=0.67 K = 16 | - | - |
Key resources table
| Reagent type (species) or resource | Designation | Source or reference | Identifiers | Additional information |
|---|---|---|---|---|
| Software, algorithm | R [base], dmetar (RRID:SCR_019054), metaphor (RRID:SCR_003450), meta (RRID:SCR_019055) | R | R 4.0.2 | |
| Software, algorithm | GraphPad Prism (RRID:SCR_002798) | GraphPad Prism | GraphPad Prism v8 |
Additional files
-
Source code 1
Code used in analyses.
Run in R 4.0.2 with data from Figure 1—source data 1.
- https://cdn.elifesciences.org/articles/56573/elife-56573-code1-v2.txt.zip
-
Supplementary file 1
Narrative summary of evidence in humans for drug classes included in this meta-analysis.
Descriptions of the principle liver-related findings from randomised controlled trials (RCT) both adults and children with NAFLD with references to completed, published studies or protocols for ongoing trials. A dichotomous assessment of whether the drug is associated with weight loss in humans has been added. ACC, Acetyl-CoA carboxylase; ACE, angiotensin-2 converting enzyme; ALT, alanine aminotransferase; ARB, angiotensin receptor blocker; CCR, chemokine receptor; DHA, Docosahexaenoic acid; DPP4, Dipeptidyl peptidase-4; EPA, eicosapentaenoic acid; FXR, Farnesoid X receptor; GLP-1, Glucagon-like peptide-1; LXR, Liver X receptor; MRI, magnetic resonance imaging; NAC, N-acetylcysteine; NAS, NAFLD Activity Score; NASH, non-alcoholic steatohepatitis; PDE, Phosphodiesterase; PDFF, proton-density fat fraction; PPAR, Peroxisome proliferator-activated receptor; PUFA; omega-3 polyunsaturated fatty acid; RAAS, renin-angiotensin-aldosterone system; SCD1, Stearoyl–CoA desaturase-1; SGLT2, Sodium-glucose co-transporter-2; TUDCA, Tauroursodeoxycholic acid; and UDCA, Ursodeoxycholic acid.
- https://cdn.elifesciences.org/articles/56573/elife-56573-supp1-v2.docx
-
Supplementary file 2
Systematic review protocol.
Prospectively registered on SyRF in August 2017.
- https://cdn.elifesciences.org/articles/56573/elife-56573-supp2-v2.pdf
-
Transparent reporting form
- https://cdn.elifesciences.org/articles/56573/elife-56573-transrepform-v2.docx
Download links
A two-part list of links to download the article, or parts of the article, in various formats.
Downloads (link to download the article as PDF)
Open citations (links to open the citations from this article in various online reference manager services)
Cite this article (links to download the citations from this article in formats compatible with various reference manager tools)
Weight loss, insulin resistance, and study design confound results in a meta-analysis of animal models of fatty liver
eLife 9:e56573.
https://doi.org/10.7554/eLife.56573


