Systemic hypoxia inhibits T cell response by limiting mitobiogenesis via matrix substrate-level phosphorylation arrest
- The Lautenberg center for Immunology and Cancer Research, The Institute for Medical Research Israel-Canada, The Hebrew University Medical School, Israel
- The Ruth and Bruce Rappaport, Faculty of Medicine, Technion - Israel Institute of Technology, Israel
- Faculty of Medicine, Hebrew University of Jerusalem; The Allergy and Immunology Unit, Shaare Zedek Medical Center, Israel
Figures
Figure 1 with 1 supplement
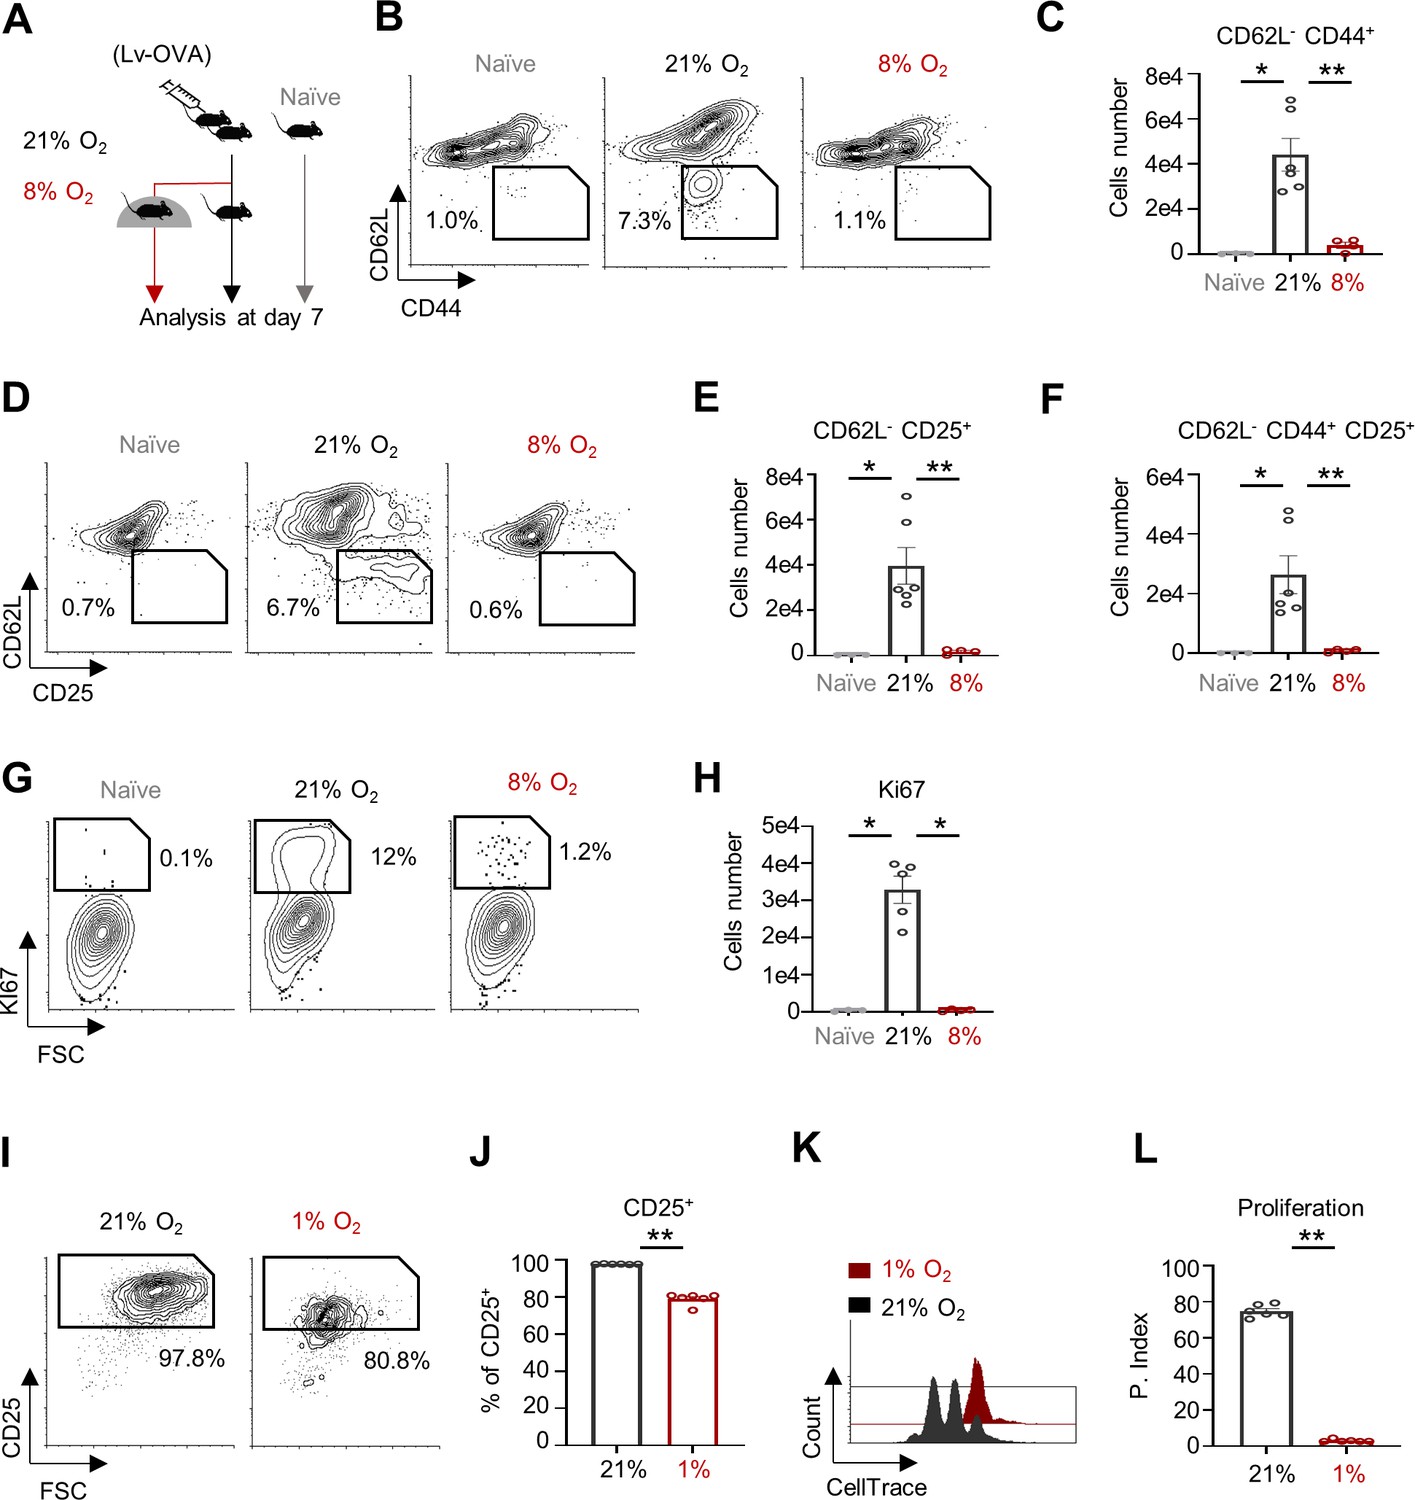
Systemic chronic oxygen restriction inhibits CD8+ T cell activation and response.
(A) Schematic of the experiment presented in panels B-H. C57BL6 mice were primed intradermally in the ear pinna with 5 × 10⁶ transduction units (TU) of Lv-OVA or left untreated. Twenty-four hours following the viral challenge, mice were transferred to chambers for additional 6 days and kept under either 8% or 21% oxygen pressure. Extracted cells from the deep cervical lymph nodes were then analyzed by flow cytometry as follows: TCR Vα2+, CD8+ T cells from naïve mice (left/gray) or Lv-OVA challenged mice that were kept under either atmospheric oxygen pressure (21% O2) (middle/black) or 8% oxygen pressure (right/red). (naïve n = 3 biological replicates, activated n = 6 in each group). (B) Representative flow cytometry plots of CD44 vs. CD62L, numbers indicate the frequencies of CD44+ CD62L- cells. (C) Bar graph quantification of TCR Vα2+, CD8+, CD44+, CD62L- cells (P value * 0.0238, ** 0.0095). (D) Same as in B, focusing on CD25 vs. CD62L. (E) Same as in C focusing on TCR Vα2+, CD8+, CD62L- CD25+ cells. (P value * 0.0238, ** 0.0095). (F) Same as in C, focusing on TCR Vα2+, CD8+, CD62L- CD25+, CD44+ cells. (P value * 0.0238, ** 0.0095). (G) Representative flow cytometry plots of Ki67 vs. FSC gated on TCR Vα2+, CD8+, CD25+ T cells. (H) Bar graph quantification of TCR Vα2+, CD8+, CD25+, Ki67+ cells. (P value * 0.0357, * 0.0159). (I-L) CellTrace-labeled splenocytes were activated with anti-CD3/28 for 72 hr under either 1% or 21% of oxygen. (n = 5 biological replicates). (I) Representative flow cytometry plots of FSC vs. CD25 gated on CD8+ T cells. Numbers indicate the frequencies of CD25+ cells. (J) Bar graph summarizes results in I. (P value * 0.0022). (K) Representative Flow cytometry overlay histogram of CellTrace intensity gated on CD8+ T cells. (L) Bar graph summarizes results in K as Proliferation Index (P. Index). (P value * 0.0022). Statistical method, non-parametric Mann–Whitney test, mean ± s.e.m.
Figure 1—figure supplement 1
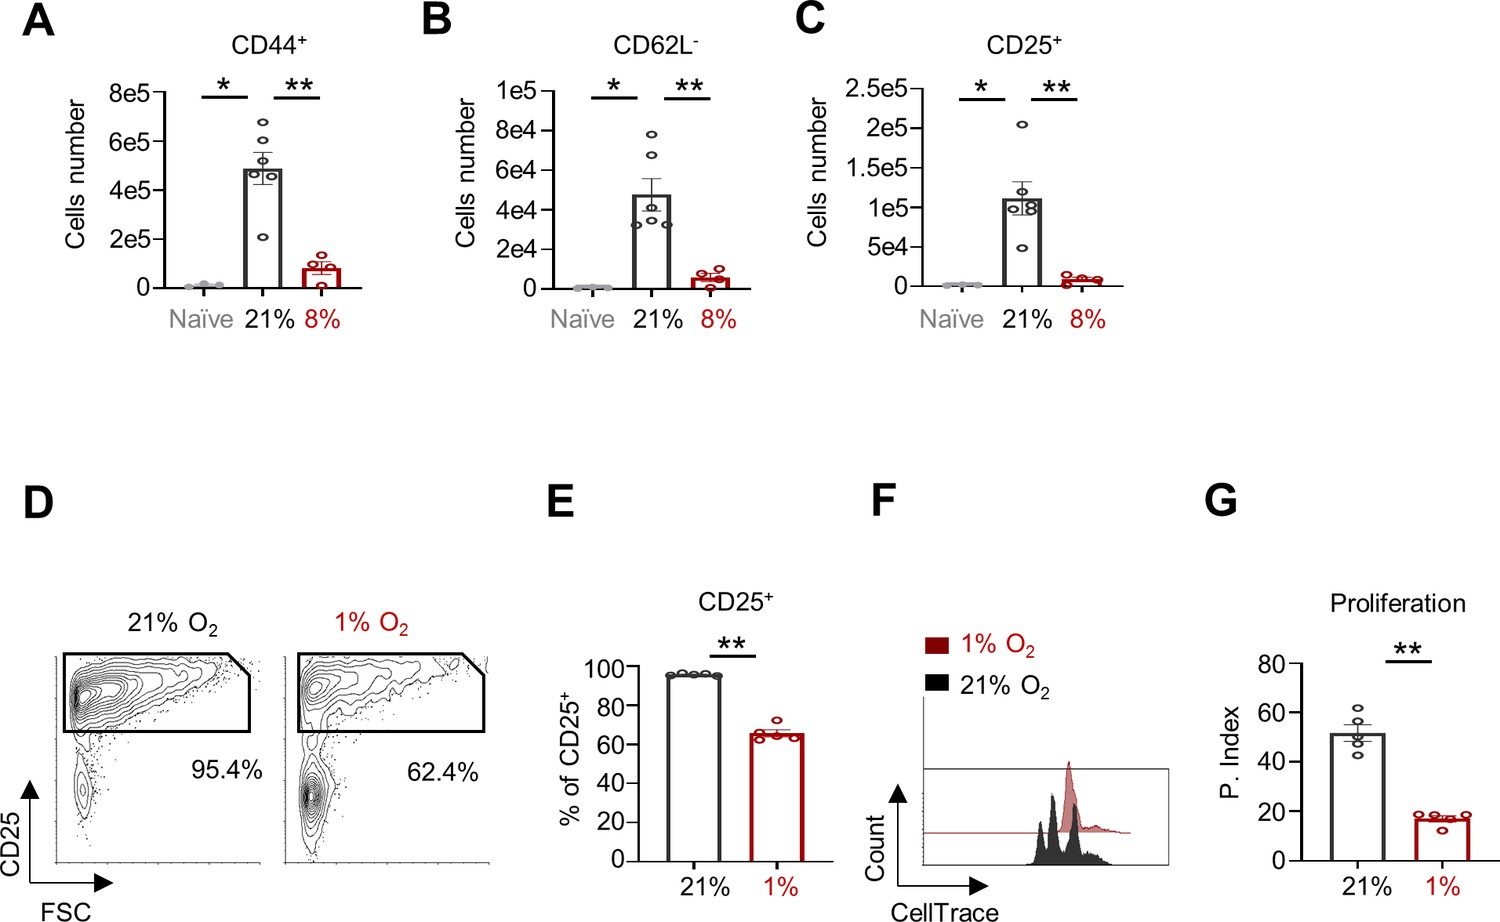
Systemic chronic oxygen restriction inhibits CD8+ T cell activation and response.
(A–C) C57BL6 mice were primed intradermally in the ear pinna with 5 × 10⁶ TU of Lv-OVA or left untreated. Twenty-four hours following the viral challenge, mice were transferred to chambers and maintained under 8% or 21% oxygen pressure. Cells from the deep cervical lymph nodes were then extracted and analyzed by flow cytometric analysis. (naïve group n = 3, activated n = 6 in each group) (A) Bar graph of the numbers of TCR Vα2+, CD8+ and CD44+ cells from naïve mice (gray) or Lv-OVA challenged mice that were kept under 21% oxygen (black) or 8% oxygen (red). (P value * 0.0238, ** 0.0095) (B) Bar graph of the numbers of TCR Vα2+, CD8+ and CD62L- cells from naïve mice (gray) or Lv-OVA challenged mice that were kept under 21% oxygen (black) or 8% oxygen (red). (P value * 0.0238, ** 0.0095) (C) Bar graph of the numbers of TCR Vα2+, CD8+ and CD25+ cells from naïve mice (gray) or Lv-OVA challenged mice that were kept under 21% oxygen (black) or 8% oxygen (red). (P value * 0.0238, ** 0.0095) (D-G) CellTrace-labeled PBMCs from human donors were activated with anti-CD3/28 for 72 hr under either 1% or 21% of oxygen pressure. (D) Representative flow cytometry plots of FSC vs. CD25 gated on CD8+ T cells. Numbers indicate the frequencies of CD25+ cells. (E) Bar graph summarizing the results in D. (P value ** 0.0079) (F) Representative Flow cytometry overlay histogram of CellTrace intensity gated on CD8+ T cells. (G) Bar graph summarizing the results in F as Proliferation Index (P. Index). (P value ** 0.0079). Statistical method, non-parametric Mann-Whitney test, mean ± s.e.m.
Figure 2 with 2 supplements

Following mitochondrial remodeling, activated CD8+ T cell become tolerant to inhibition of OXPHOS.
(A) Schematic of experiment presented in panels B-E. CellTrace-labeled splenocytes were activated with anti-CD3/28 and transferred to chambers containing 1% O2 for 5 (middle/red), or 18 hr (right/pink). Cells were then transferred to atmospheric oxygen pressure. Control cells were left in atmospheric oxygen pressure (21% O2), (left/gray). Seventy-two hours post activation, cells were analyzed by flow cytometry. (n = 5 biological replicates). (B) Representative flow cytometry plots of FSC vs. CD25 gated on CD8+ T cells. Numbers indicate the frequencies of CD25+ cells. (C) Bar graph summarizes results in B. (P value ** 0.0043, ** 0.0043). (D) Representative flow cytometry overlay histogram of CellTrace intensity gated on CD8+ T cells. (E) Bar graph summarizes results in D as Proliferation Index. (P value ** 0.0043, * 0.0173). (F) Schematic of experiment presented in panels G-J. CellTrace-labeled splenocytes were stimulated using anti-CD3/28 and treated with 60 nM oligomycin at the indicated time points post activation. Seventy-two hours post activation cells were analyzed by flow cytometry. (n = 5 biological replicates). (G) Representative flow cytometry plots of FSC vs. CD25 gated on CD8+ T cells of control cells (untreated with oligomycin) or cells that were treated with oligomycin at the indicated time points after activation. Numbers indicate the frequencies of CD25+ cells. (H) Bar graph summarizes results in G. (P value ** 0.0079 ** 0.0079 ** 0.0079 ** 0.0079). (I) Representative flow cytometry overlay histogram of CellTrace intensity gated on CD8+ T cells from either control cells (front) or cells that were treated with oligomycin at the indicated time after activation. (J) Bar graph summarizes results in I as Proliferation Index. (P value ** 0.0079 ** 0.0079 ** 0.0079 * 0.0317). (K) Flow cytometry histogram overlay plot of Dendra2 fluorescence intensity gated on the CD8+ T cell population of naïve cells or cells that were stimulated using anti-CD3/CD28, for 9, 12, 16 or 24 hr from spleens of mito-Dendra2 mice. (L) Bar graph summarizes results in K. (n = 5 biological replicates). (P value * 0.0286). (M) Mouse splenocytes were stimulated using anti-CD3/CD28 for 9 (pink), 12 (red) hours or left untreated (Naïve- gray). CD8+ T cells were then isolated and assayed, by seahorse XF24, for Oxygen Consumption Rate (OCR) following consecutive injections of oligomycin, FCCP, and rotenone plus antimycin (R+A). (n = 5 biological replicates in each group). (N) Bar graph summarizes the spare respiratory capacity (SRC- maximal OCR after FCCP treatment) of the experiment present in M. (P value * 0.0197) Statistical method, non-parametric Mann–Whitney test, mean ± s.e.m.
Figure 2—figure supplement 1
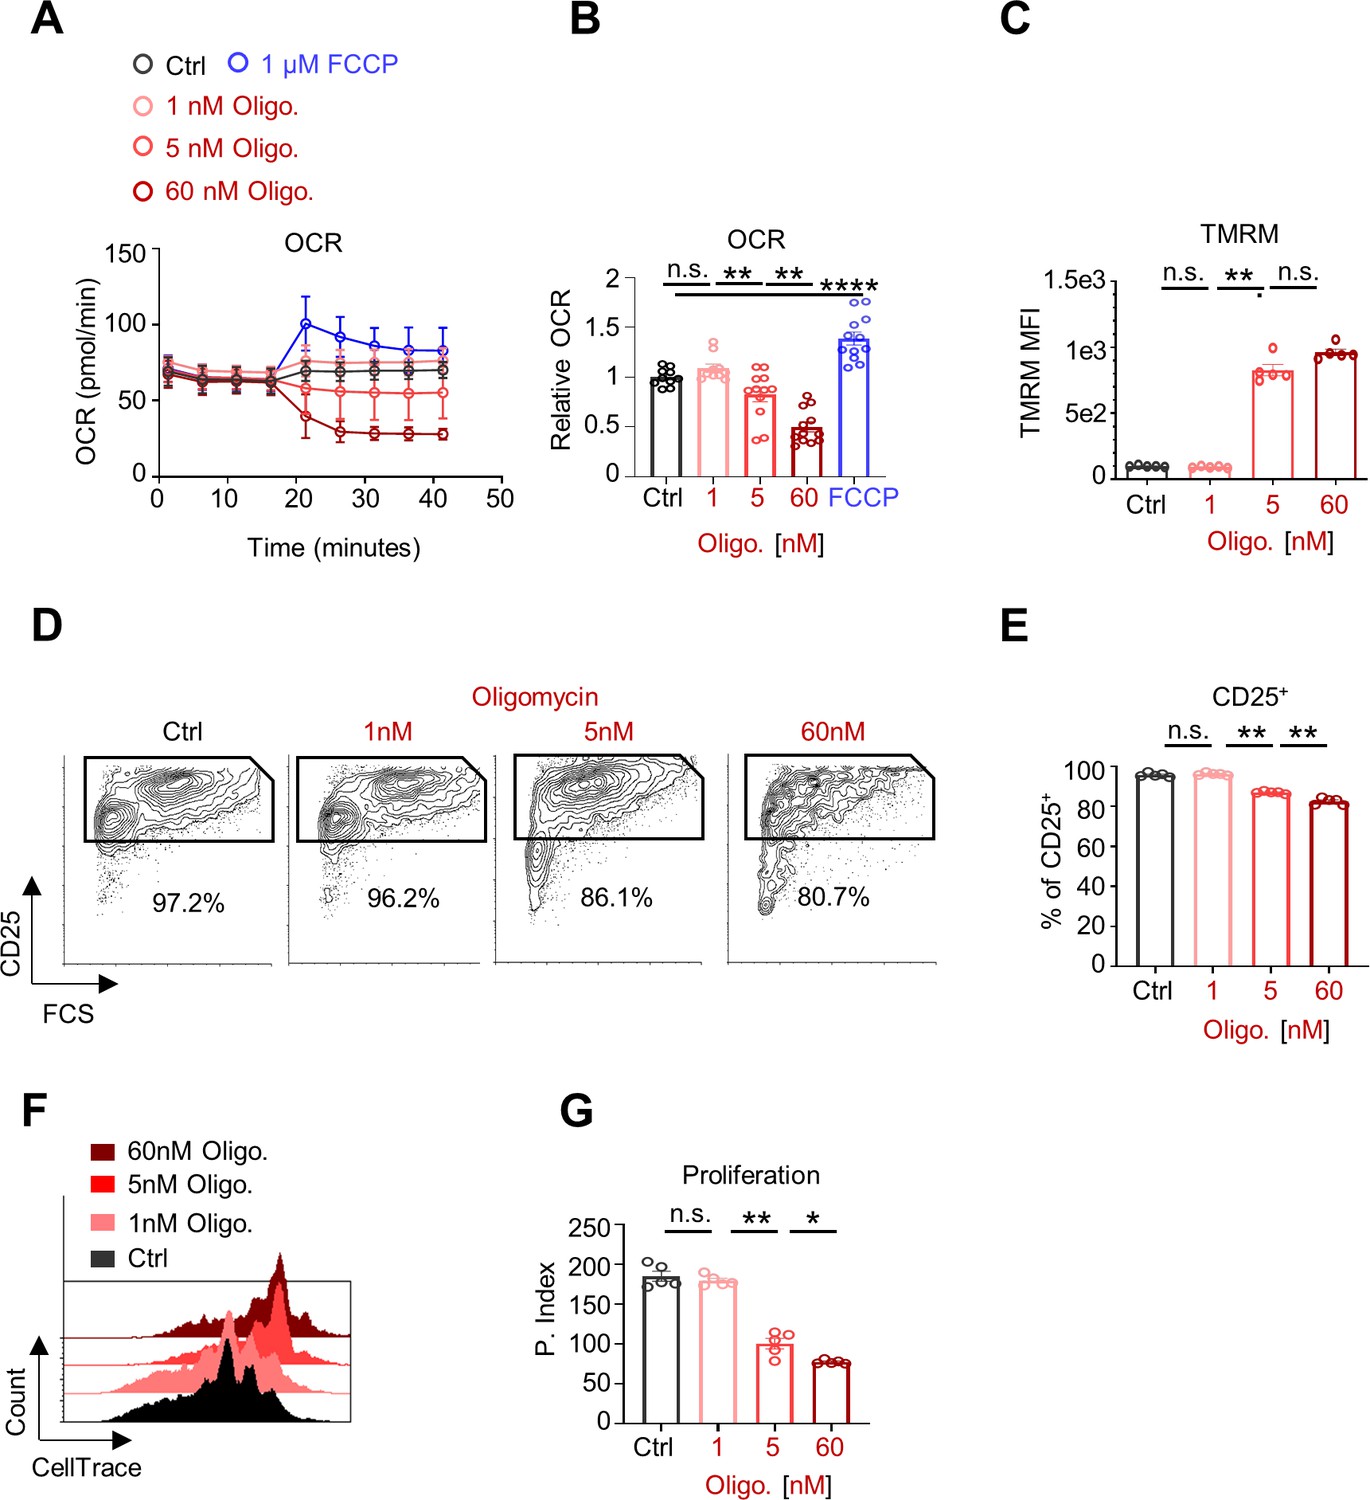
Oligomycin inhibits CD8+ T cell respiration, activation, and proliferation.
(A) Oxygen Consumption Rate (OCR) of isolated naïve CD8+ T cells treated with the indicated oligomycin, FCCP concentrations or left untreated. (n = 5 biological replicates). (B) Bar graph summarizing the results in A as a ratio between OCR pre and post treatment (Relative OCR). (P value ** 0.0072, **0.0018, ****>0.0001) (C) Bar graph summarizing TMRM fluorescence intensity, measured by flow cytometry, of naïve CD8+ T cells that were either treated with the indicated oligomycin concentrations or left untreated. (P value ** 0.0072) (D-G) CellTrace-labeled PBMCs from human donors were activated with anti-CD3/28 for 72 hr in the present or absent of indicated concentrations of oligomycin. (D) Representative Flow cytometry plots of FSC vs. CD25 gated on CD8+ T cells from untreated cells or oligomycin treated cells. Numbers indicate the frequencies of CD25+ cells. (n = 5 biological replicates) (E) Bar graph summarizing the results in (D). (P value ** 0.0072, ** 0.0072). (F) Representative Flow cytometry overlay histogram of CellTrace intensity gated on CD8+ T cells from untreated cells (Ctrl) or Oligomycin treated as indicated. (G) Bar graph summarizing the results in F as Proliferation Index. (P value ** 0.0072, * 0.0159) Statistical method, non-parametric Mann-Whitney test, mean ± s.e.m.
Figure 2—figure supplement 2
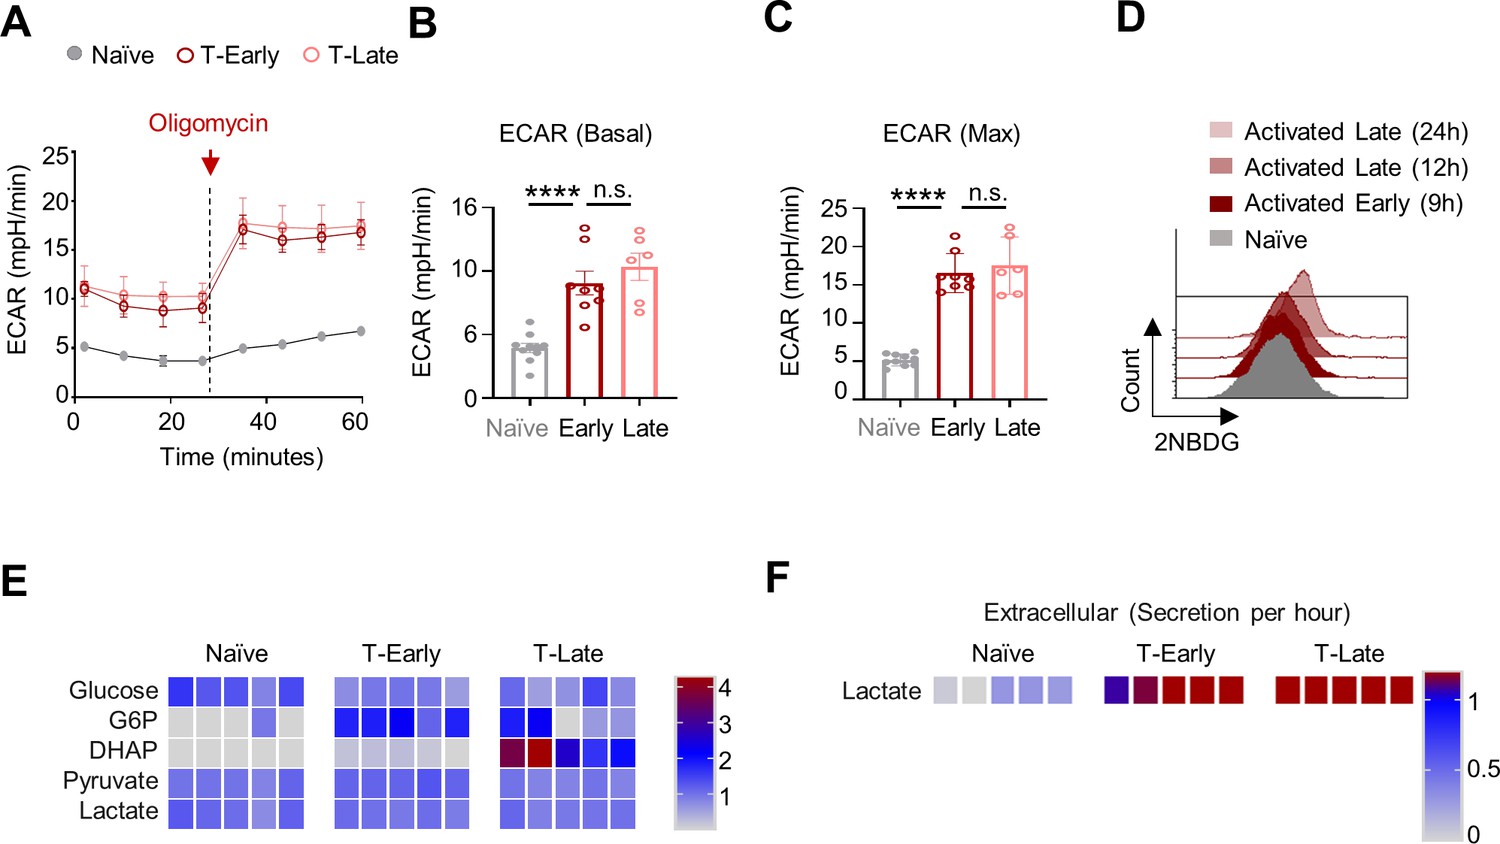
Acquisition of respiratory restriction tolerance is not correlated with increased glycolytic activity.
(A) Extra Cellular Acidification Rate (ECAR), measured by seahorse, of Naïve CD8+ T cells (gray), T-Early (red) and T-Late (pink) under basal conditions (BASAL) or oligomycin treatment (Max). Dashed line indicates the time of oligomycin injection. (B) Bar graph summarizing basal ECAR illustrated in A. (n > 5 measurements, P value ****<0.0001) (C) Bar graph summarizing maximal ECAR (after oligomycin treatment) in A. (n > 5 measurements, P value ****<0.0001) (D) Histogram overlay of 2NBDG fluorescence intensity gated on naïve (gray) or activated CD8+ T cells for 9 (dark red-brown), 12 (dark pink), or 24 (light pink) hours. Cells were incubated with 2NBDG for 30 min before flow cytometry analysis. (E-F) Naïve, or 5 hr (T-Early), 24 hr (T-Late) activated (anti-CD3/CD28) CD8+ T cells were incubated for 5 hr and analyzed by LC-MS (n = 5 biological replicates) (E) Heatmap representing the relative amounts of key glycolysis-related metabolites (as indicated) in naïve, T-Early or T-Late. (F) Heatmap representing lactate in the media of naïve, T-Early o T-Late. Statistical method, non-parametric Mann-Whitney test, mean ± s.e.m.
Figure 3 with 1 supplement
Respiratory restriction has only marginal effect on cytoplasmic function during early activation.
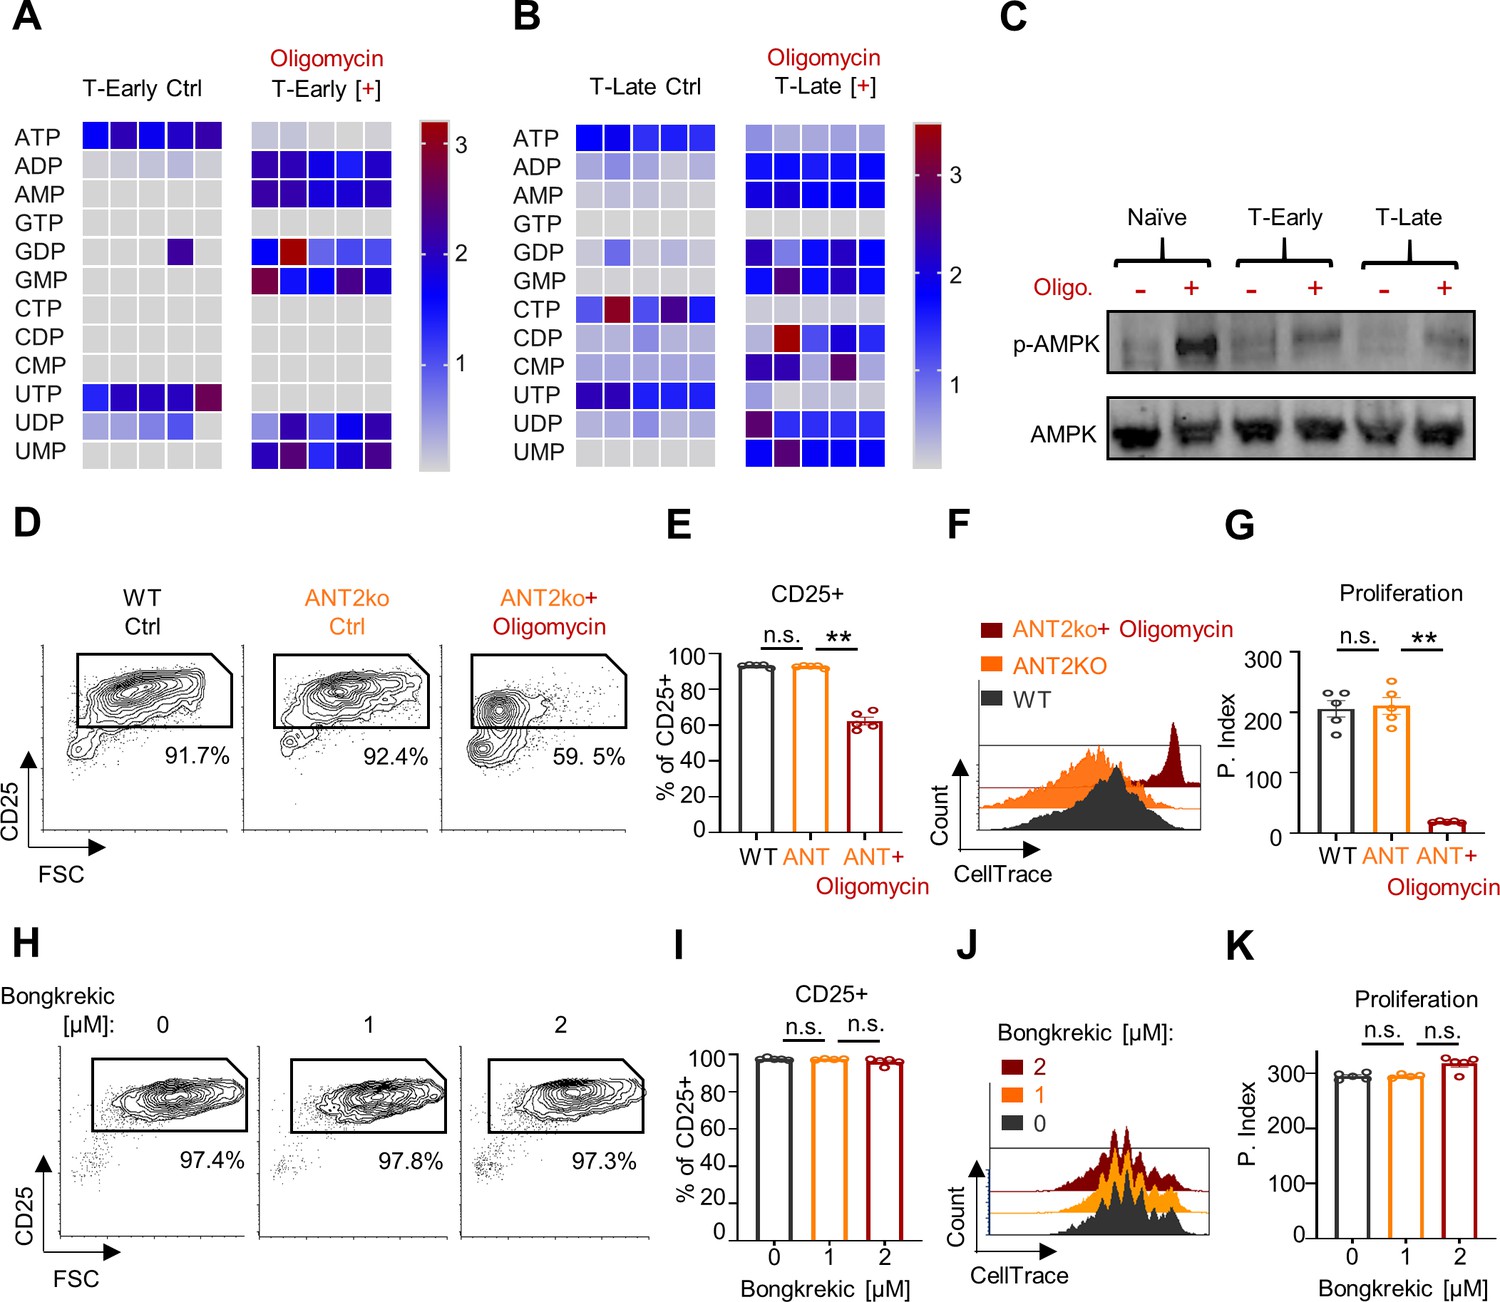
(A) Heatmap showing relative amounts of key energy-related metabolites (as indicated in the figure) extracted from CD8+ T cells activated for 5 hr using anti-CD3/28 (T-Early) oligomycin treated or untreated (Ctrl). (B) Same as in A, extracted from CD8+ T cells activated for 24 hr using anti-CD3/28 (T-Late). (C) Splenocytes were stimulated using anti-CD3/28 for 9 hr (T-Early), 12 hr (T-Late) or left untreated (Naïve- gray). Cells were then treated with 300 nM oligomycin or left untreated for 1 hr. Protein extract from isolated CD8+ T cells from all samples were then subjected for immunoblot analysis using anti p-AMPKα or anti AMPKα. (n = 3 experiments). (D-G) CellTrace-labeled splenocytes from WT or LCK-cre/Slc25a5floxp (ANT2ko) mice were stimulated using anti-CD3/CD28, with or without 60 nM oligomycin. Seventy-two hours post activation cells were analyzed by flow cytometry (n = 5 biological replicates). (D) Representative Flow cytometry plots of FSC vs. CD25 gated on CD8+ T cells from wild-type mice (WT- left) or ANT2ko mice untreated or treated with 60 nM oligomycin (middle and right panels respectively). Numbers indicate the frequencies of CD25+ cells. (E) Bar graph summarizes results in D. (P value ** 0.0079). (F) Representative Flow cytometry overlay histogram of CellTrace intensity gated on CD8+ T cells from either WT cells (front) or ANTko cells that were untreated (middle) or treated with oligomycin (back). (G) Bar graph summarizing the results in F as proliferation index. (P value ** 0.0079). (H-K) CellTrace-labeled splenocytes from WT mice were stimulated using anti-CD3/CD28, in the presence of the indicated concentrations of the pan-ANT inhibitor, bongkrekic acid. Seventy-two hours post activation cells were analyzed by flow cytometry analysis. (n = 5 biological replicates). (H) Representative Flow cytometry plots of FSC vs. CD25 gated on CD8+ T cells from WT splenocytes untreated or treated with the indicated concentrations of bongkrekic acid. Numbers indicate the frequencies of CD25+ cells. (I) Bar graph summarizing the results in H. (J) Representative Flow cytometry overlay histogram of CellTrace intensity gated on CD8+ T cells that were either untreated or treated with the indicated concentrations of bongkrekic acid. (K) Bar graph summarizing the results in J as proliferation index. Statistical method, non-parametric Mann–Whitney test, mean ± s.e.m.
Figure 3—figure supplement 1
Inhibition of ANT2 leads to increased mitochondrial membrane polarization in CD8+ T cells.
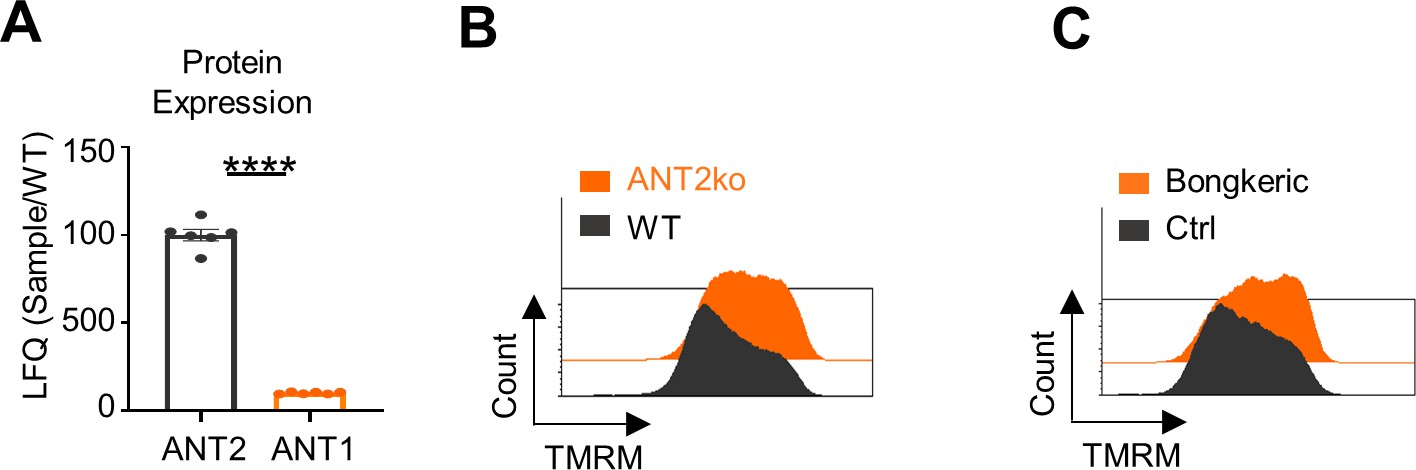
(A) Label-free quantification (LFQ) of ANT1 relatively to the LFQ of ANT2 in naïve CD8+ T cells measured by MS analysis.(n = 5 mice grouped into six replicates, P value ****<0.0001). (B) Flow cytometry overlay histogram of TMRM intensity in CD8+ T cells from wt or LCK-cre/ANT2floxp (ANT2ko) mice (n = 3 biological replicates). (C) Flow cytometry overlay histogram of TMRM intensity in CD8+ T cells from WT mice that were either untreated or treated with 1 µM Bongkrekic acid for 3 hr (n = 5 biological replicates). Statistical method, non-parametric Mann-Whitney test, mean ± s.e.m.
Figure 4 with 1 supplement
Respiratory restriction leads to energetic crisis within the matrix compartment in early activated CD8+ T cell.
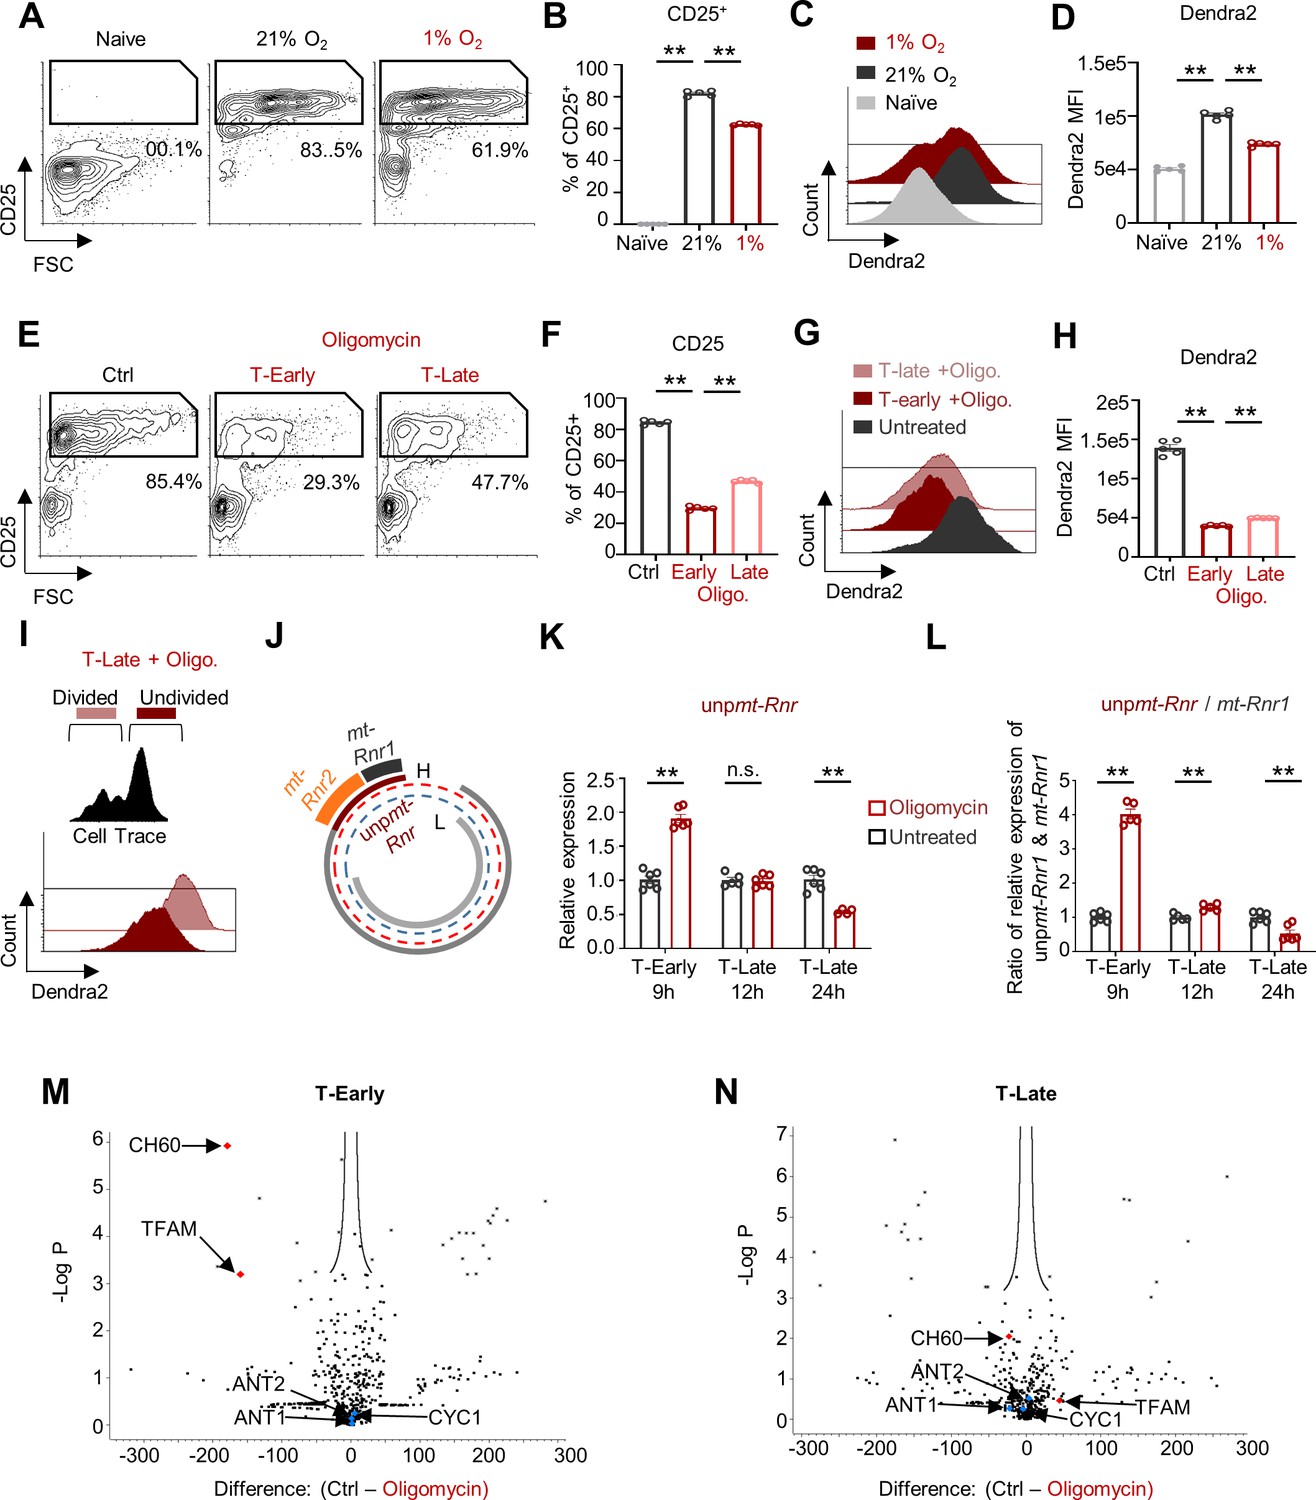
(A-D) Splenocytes from mito-Dendra2 mice were activated with anti-CD3/28 for 5 hr and then transferred to a chamber containing 1% O2 or left in atmospheric oxygen pressure (21% O2). Twenty-four hours post activation cells were analyzed by flow cytometry. (A) Representative flow cytometry plots of FSC vs. CD25 gated on CD8+ T cells. Numbers indicate the frequencies of CD25+ cells. (B) Bar graph summarizing the results in A. (P value ** 0.0079 ** 0.0079). (C) Representative Flow cytometry histogram overlay plot of Dendra2 fluorescence intensity gated on the CD8+ T cells from Naïve (front), activated in 21% O2 (middle), or activated in 1% O2 (back) cells. (D) Bar graph summarizing the results in C, Dendra2 mean fluorescence intensity (MFI). (P value ** 0.0079 ** 0.0079). (E-H) Splenocytes from mito-Dendra2 mice were activated with anti-CD3/28 and treated with 60 nM oligomycin at 9 hr (T-Early) or 12 hr (T-Late) following activation. Twenty-four hours post activation cells were analyzed by flow cytometry. (E) Representative flow cytometry plots of FSC vs. CD25 gated on CD8+ T cells. Numbers indicate the frequencies of CD25+ cells. (F) Bar graph summarizing the results in E. (P value ** 0.0079 ** 0.0079). (G) Representative Flow cytometry histogram overlay plot of Dendra2 fluorescence intensity gated on the CD8+ T cells from either oligomycin untreated (front), oligomycin treated T-Early (middle) or oligomycin treated T-Late (back). (P value ** 0.0079 ** 0.0079). (H) Bar graph summarizing the results in G, Dendra2 mean fluorescence intensity (MFI). (P value ** 0.0079 ** 0.0079). (I) CellTrace-labeled splenocytes from mito-Dendra2 mice were activated with anti-CD3/28 and treated with 60 nM oligomycin 12 hr (T-Late) after activation. Seventy-four hours post activation cells were analyzed by flow cytometry. Figure shows Representative Flow cytometry histogram overlay plot of Dendra2 fluorescence intensity gated on the undivided (highest CellTrace intensity- front) and divided (low CellTrace intensity) CD8+ T cell populations. (J) Schematic of typical mitochondrial transcription, describing the transcription of ribosomal polycistronic mitochondrial RNA (unpmt-Rnr, dark red line) from the mitochondrial DNA heavy strand (H, red dotted line), and its processing to mt-Rnr1 (bold black line) and mt-Rnr2 (bold orange line). (K-L) Splenocytes were stimulated using anti CD3/CD28 for 9, 12 and 24 hr. Cells were then treated with oligomycin for one hour or left untreated. Total RNA was extracted from isolated CD8+ T cells and assayed using qRT-PCR. Primers were designed to amplify either the unprocessed mt-Rnr transcript (unpmt-Rnr) or its two processed products, mt-Rnr1 and mt-Rnr2. (K) Relative expression of the unpmt-Rnr. (P value ** 0.0022 ** 0.0095). (L) Ratio between the relative expression of unpmt-Rnr and mt-Rnr1. (n = 6 biological replicates). (P value ** 0.0043 ** 0.0079 ** 0.0087). (M-N) Splenocytes were stimulated using anti-CD3/CD28 for 9 or 12 hr. One hour prior to CD8+ T cells isolation, cells were treated with oligomycin or left untreated. Protein extracts from isolated CD8+ T cells were then subjected to immunoprecipitation (IP) using anti-ubiquitin antibody. IP extracts were analyzed by MS focusing on mitochondrial proteins and mitochondrial leader peptides. (n = 3 biological replicates). (M) Volcano plot of precipitated proteins detected by the MS analysis in oligomycin treated and untreated samples (9 hr, T-Early). (N) Volcano plot of precipitated proteins detected by the MS analysis in oligomycin treated and untreated samples (12 hr, T-Late). Statistical method, (A-L) non-parametric Mann–Whitney test, mean ± s.e.m, (M-N) False Discovery Rate (FDR) P value < 0.05.
Figure 4—figure supplement 1

Respiratory restriction induces an energetic crisis within the matrix compartment in early activated CD8+ T Cell.
A) Splenocytes were stimulated using anti CD3/CD28 for 9, 12 and 24 hr. Cells were then treated with oligomycin for one hour or left untreated. Isolated CD8+ T cells were then analyzed using qRT-PCR for unprocessed mt-Rnr transcript (unpmt-Rnr) and its two processed products, mt-Rnr1 and mt-Rnr2. Figure shows ratio between the relative expression of unpmt-Rnr and mt-Rnr1. (n = 6 biological replicates, P value ** 0.0022 ** 0.0043 ** 0.0095). (B) Schematic describing the way matrix ATP deficiency leads to accumulation of ubiquitinated mitochondrial matrix-localized proteins and pre-proteins. (C-D) Splenocytes were stimulated using anti CD3/CD28 for 9 or 12 hr (T-Early and T-Late respectively). One hour prior to CD8+ T cells isolation, cells were treated with oligomycin or left untreated. Protein extracts from isolated CD8+ T cells were then subjected to immunoprecipitation using anti-ubiquitin antibody. Sample analysis was performed by MS focusing on leader peptides. (C) Table shows sequences of leader peptides and their corresponding proteins identified in T-Early and T-Late in respect to untreated samples. (D) Comparison of the presence of leader peptides identified in T-Early and T-Late. Statistical method, non-parametric Mann-Whitney test, mean ± s.e.m.
Figure 5 with 1 supplement
FCCP treatment rescues respiratory-restricted CD8+ T cells by stimulating matrix-localized substrate-level phosphorylation, elevating ATP, and reducing AMP/GMP concentrations.
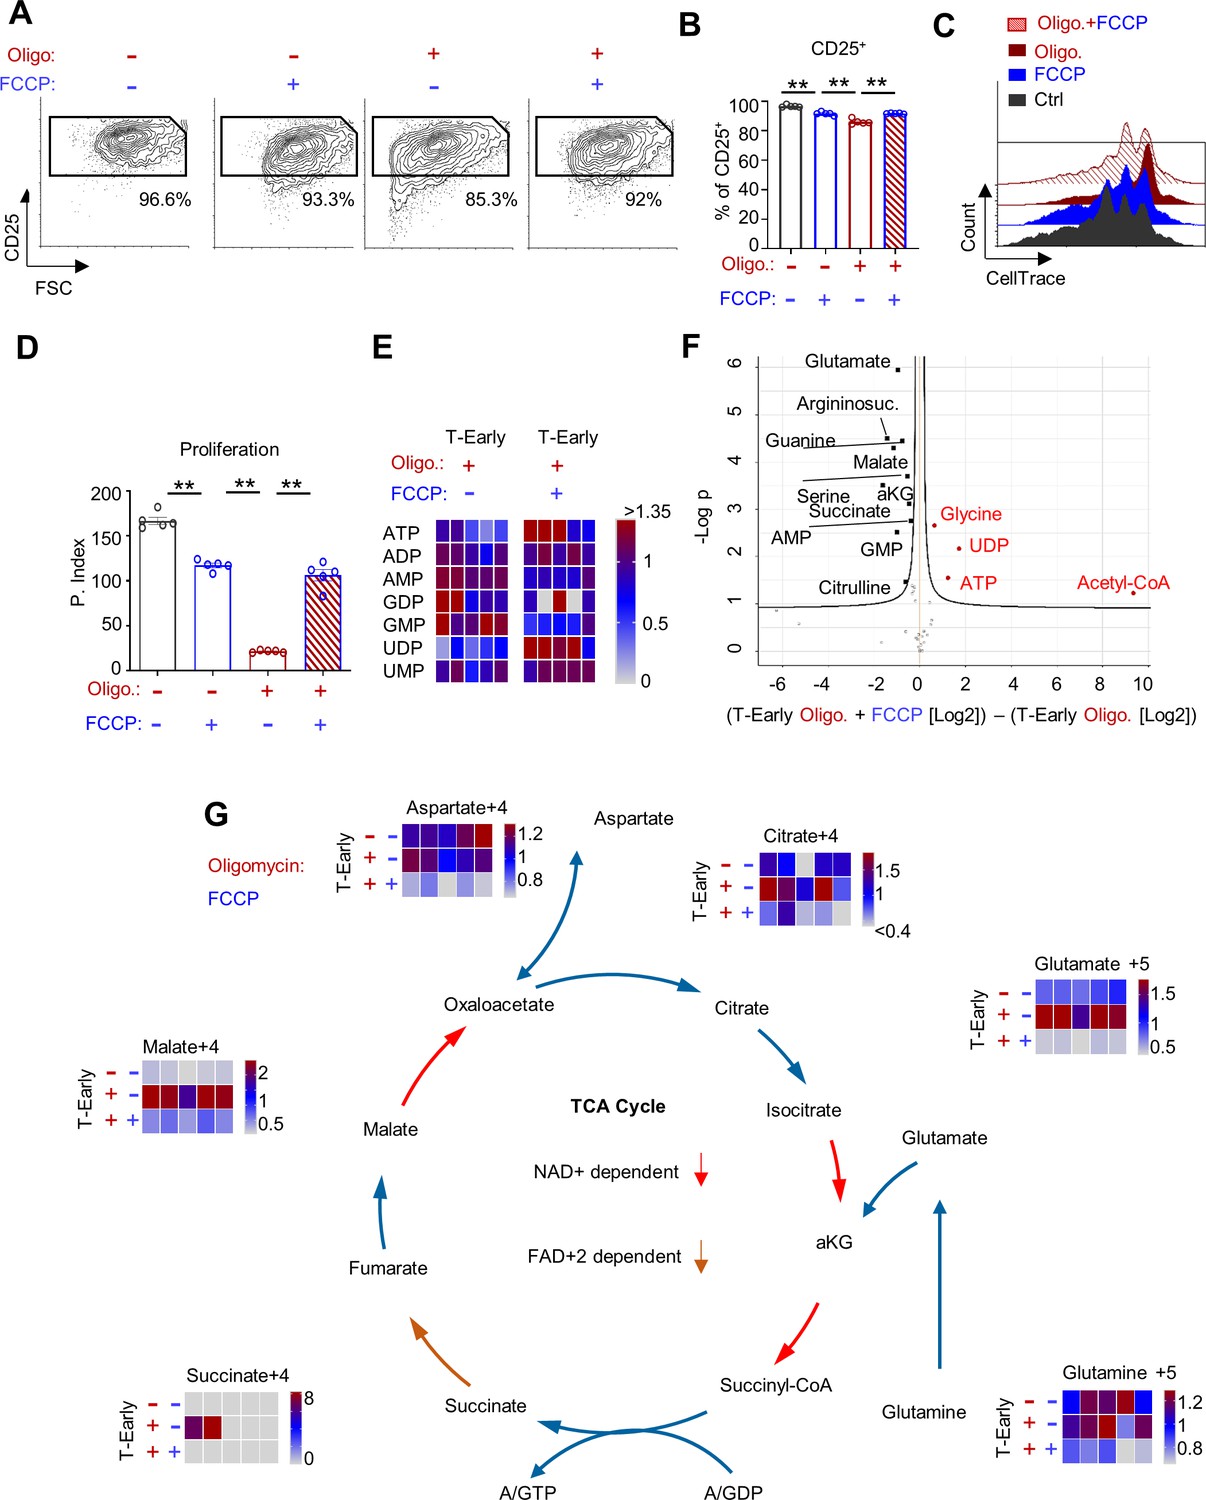
(A-D) CellTrace-labeled splenocytes were stimulated using anti-CD3/28. Nine hours post activation cells were left untreated or treated with 1 μM FCCP, 60 nM oligomycin or with a combination of FCCP and oligomycin. Seventy-two hours post activation cells were analyzed by flow cytometry. (n = 5 biological replicates). (A) Representative flow cytometry plots of FSC vs. CD25 gated on CD8+ T cells from untreated cells (left), FCCP treated (second from left), Oligomycin treated (third from left), or Oligomycin and FCCP treated (left). Numbers indicate the frequencies of CD25+ cells. (B) Bar graph summarizing the results in B. (P value ** 0.0079 ** 0.0079 ** 0.0079). (C) Representative flow cytometry overlay histogram of CellTrace intensity gated on CD8+ T cells from untreated cells (black), FCCP treated (blue), oligomycin treated (dark red-brown), or oligomycin and FCCP treated (red stripes). (D) Bar graph summarizing the results in DC as proliferation index. (P value ** 0.0079 ** 0.0079 ** 0.0079). (E-G) CD8+ T cells were activated with anti-CD3/CD28. Five hours post activation (T-Early), cells were treated for 3 hr with media containing 13C-glutamine only, 13C-glutamine with oligomycin, or 13C-glutamine with oligomycin plus FCCP. Cell extracts were then subjected for metabolome analysis. (n = 7 biological replicates). (E) Heatmap showing relative amounts of key energy-related metabolites (as indicated in the figure) measured in T-Early cells that were treated with oligomycin or oligomycin plus FCCP. (F) Volcano plot of all analyzed metabolites measured in T-Early cells treated with oligomycin or oligomycin plus FCCP. (G) 13C-glutamine LC-MS tracing analysis of CD8+ T cells that either were untreated or treated with oligomycin, or oligomycin plus FCCP. Heatmaps summarizing intracellular isotopomers of; Citrate, Glutamate, Glutamine, Succinate, Malate and Aspartate. Statistical method, (A-E) non-parametric Mann–Whitney test, mean ± s.e.m, (F) False Discovery Rate (FDR) P value < 0.05.
Figure 5—figure supplement 1
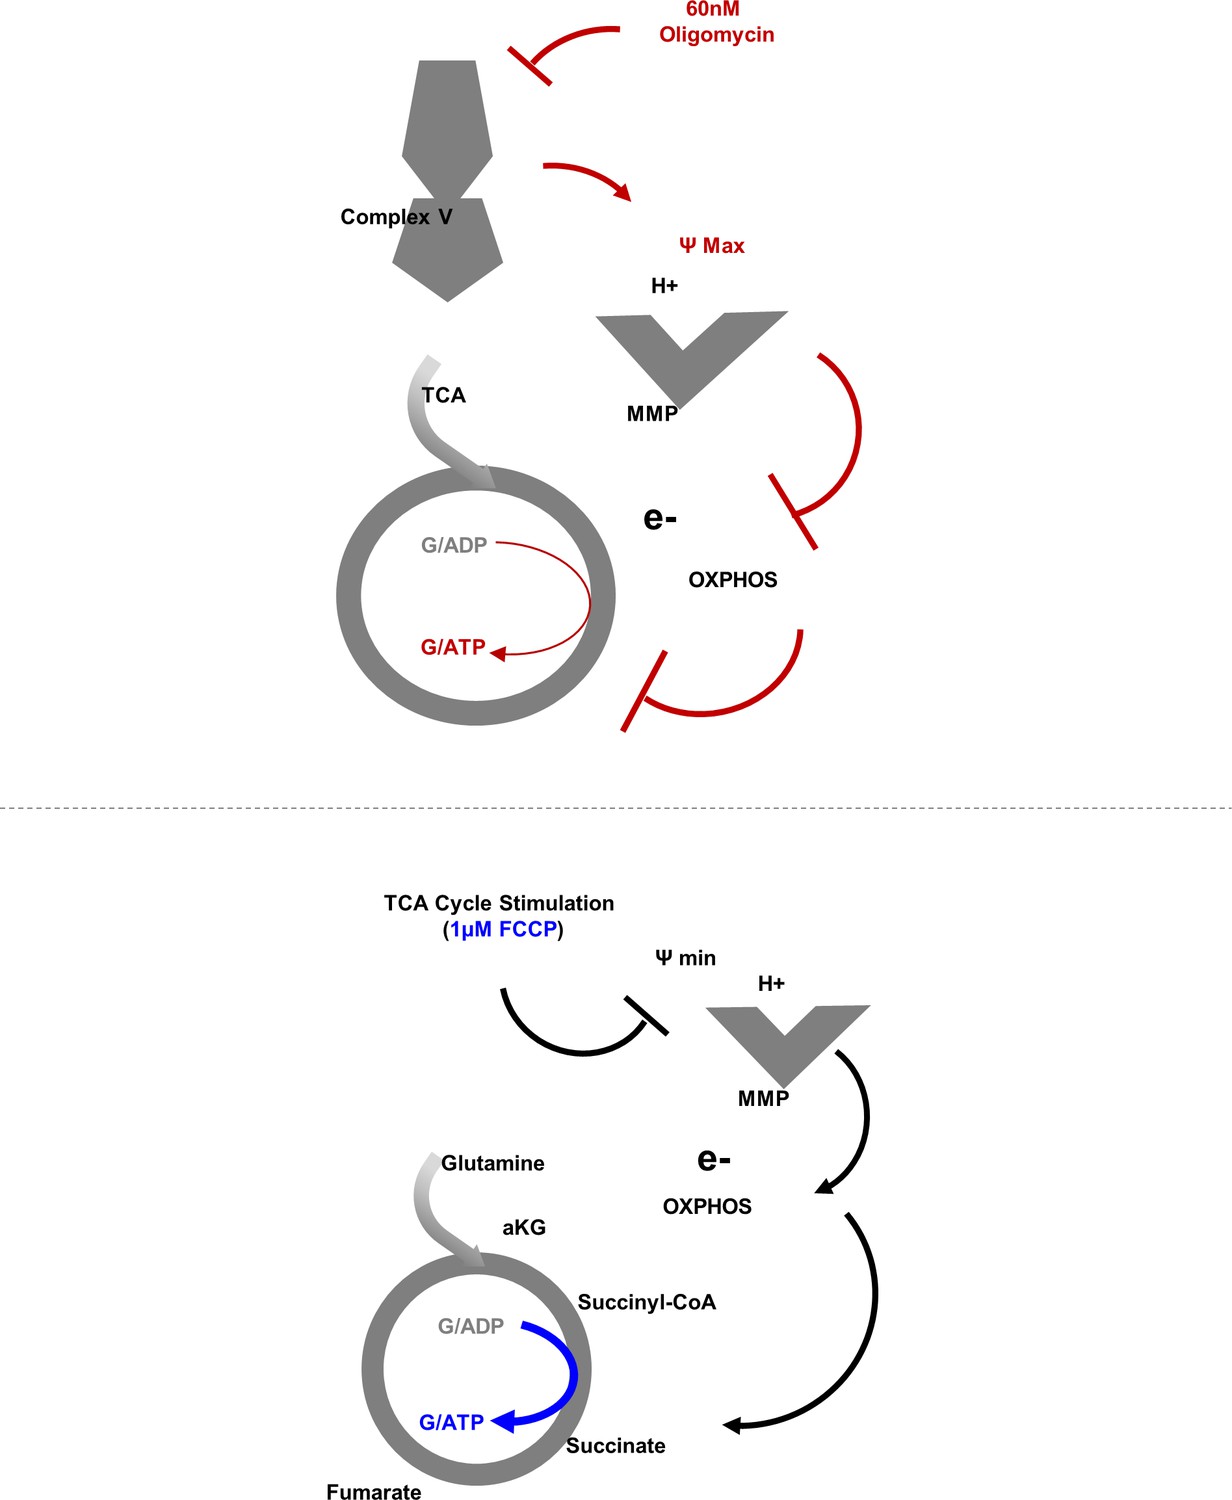
Schematic of the suggested model; respiratory restriction through inhibition of complex V by oligomycin leads to increase in mitochondrial membrane potential and decreased electron flow.
(Top) Decreased electron flow leads to inhibition of TCA cycle and substrate-level phosphorylation since that these processes are coupled. (Bottom) Schematic of the suggested model for rescuing respiration restricted primed CD8+ T cells. FCCP treatment decreases mitochondrial membrane potential which allows both electrons and the TCA cycle to reflow, restores GTP/ATP production in the matrix by the substrate-level phosphorylation.
Figure 6 with 1 supplement
Short oxygen exposure rescues CD8+ T cells activated under hypoxia in vivo.
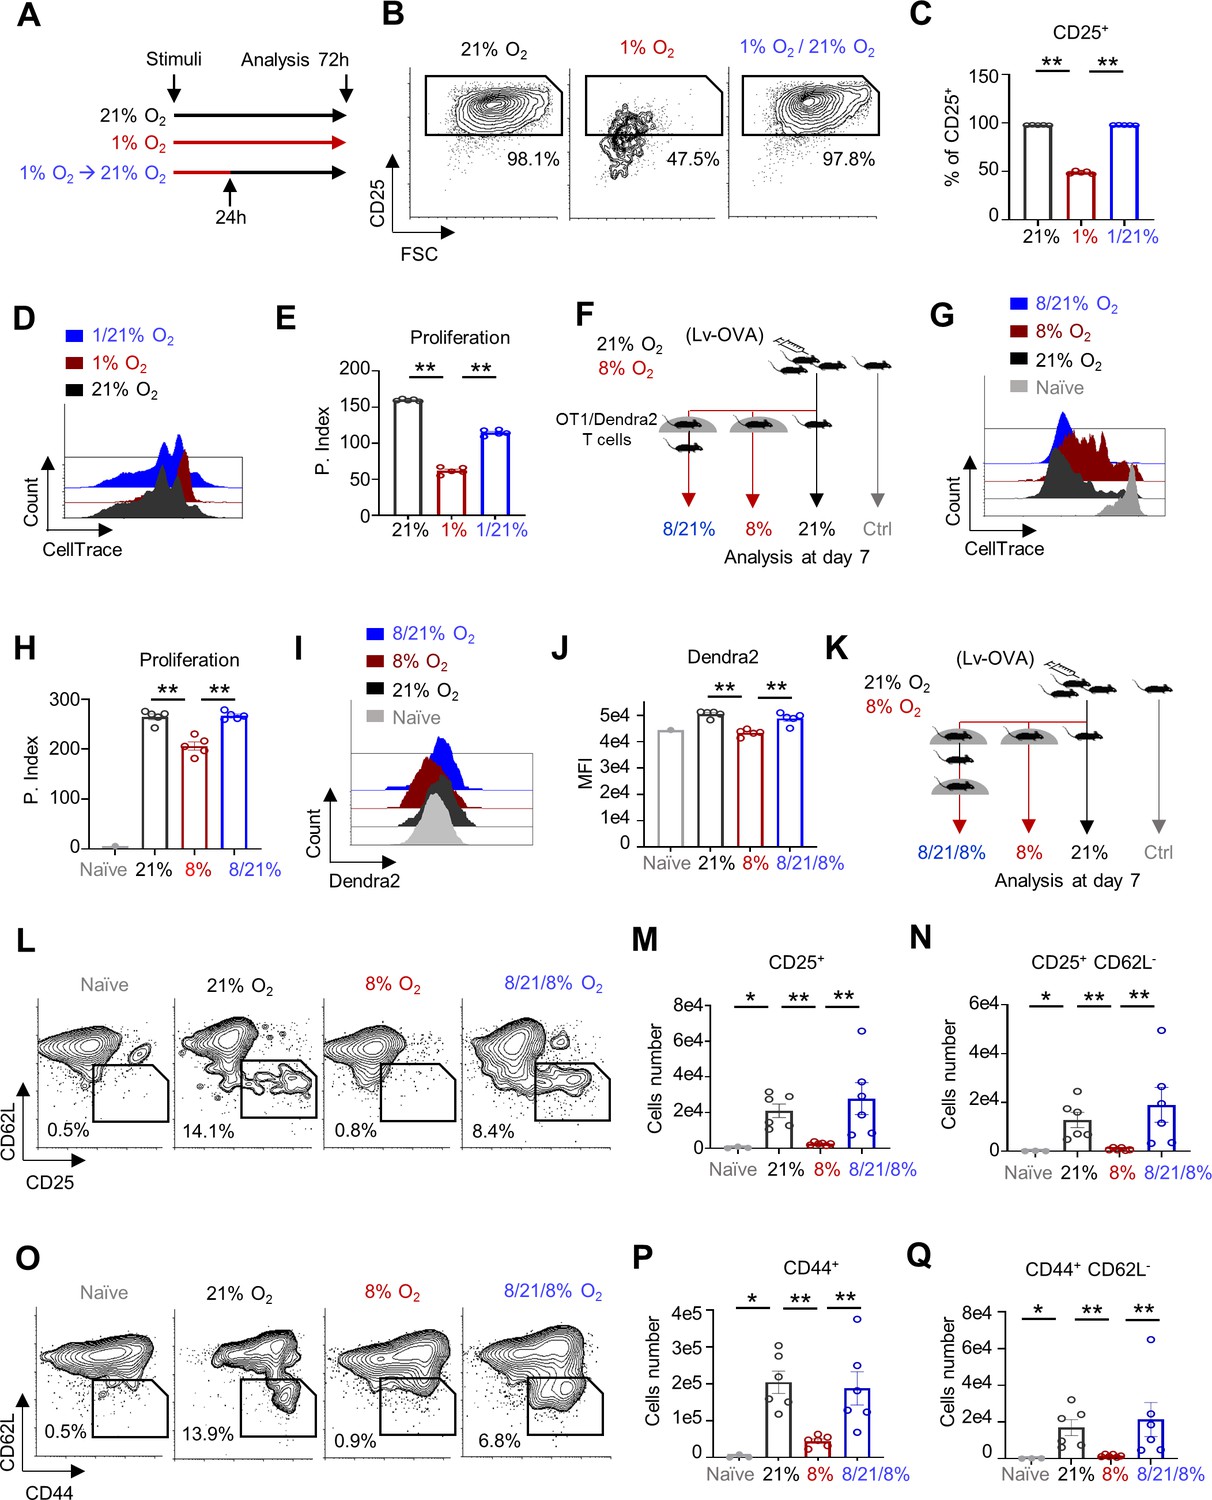
(A) Schematic describing the experiment in B-E. CellTrace-labeled mouse splenocytes were activated with anti-CD3/28 under 1% or atmospheric oxygen pressure (21% O2). Twenty-four hours post activation, a group of cells from the 1% O2 chamber were transferred to 21% O2 (1/21%). The different cell groups were collected at 72 hr post activation and analyzed by flow cytometry. (n = 5 biological replicates). (B) Representative flow cytometry plots of FSC vs. CD25 gated on CD8+ T cells. Numbers indicate the frequencies of CD25+ cells. (C) Bar graph summarizing the results in B. (P value ** 0.0079 ** 0.0079). (D) Representative flow cytometry overlay histogram of CellTrace intensity gated on CD8+ T cells from cells that either were grown in 21% O2 (front) or 1% O2 (middle), or from cells that were grown in 1% O2 and transferred to 21% O2 (back). (E) Bar graph summarizing the results in D as proliferation index. (P value ** 0.0079 ** 0.0079). (F) Schematic of experiment presented in panels G-J. C57BL6 mice were primed intradermally in the ear pinna with 5 × 10⁶ TU of Lv-OVA or left uninfected. Three days after the viral challenge, mice were adoptively transferred i.p. with 4 × 10⁶ CellTrace-labeled splenocytes from OT1/mito-Dendra2 double transgenic mice. Mice were then divided into four groups; (1) Lv-OVA infected mice grown in 21% O2 (21%) for another 3 days. (2) Lv-OVA infected mice grown in 8% O2 for another 3 days (8%). (3) Lv-OVA infected mice grown in 8% O2 for 24 hr and then transferred to 21% O2 for another 48 hr (8/21%). (4) Lv-OVA uninfected mice grown in 21% O2 (Ctrl). Cells from the deep cervical lymph nodes were then analyzed by flow cytometry analysis. (n = 5 mice for groups 1–3 and n = 3 mice for the control group). (G) Representative flow cytometry overlay histogram of CellTrace intensity gated on TCR Vα2+, CD8+, and Dendra+ triple positive cells from each of the four groups. (H) Bar graph summarizing the results in G, as Proliferation Index. (P value ** 0.0079 ** 0.0079). (I) Representative flow cytometry histogram overlay plot of Dendra2 fluorescence intensity gated on the TCR Vα2+, CD8+, and Dendra2+ triple positive cells from each of the four groups. (J) Bar graph summarizing the results in I, Dendra2 mean fluorescence intensity (MFI). (P value ** 0.0079 ** 0.0079). (K) Schematic of experiment presented in panels (L-Q). C57BL6 mice were primed intradermally in the ear pinna with 5 × 10⁶ TU of Lv-OVA or left uninfected. Twenty-four hours after the viral challenge mice were divided into four groups; (1) Lv-OVA infected mice grown in 21% O2 (21%). (2) Lv-OVA infected mice grown in 8% O2 (8%). (3) Lv-OVA infected mice grown in 8% O2 for 48 hr, transferred to 21% O2 for 24 hr and then transferred back to 8% O2 for an additional 48 hr (8/21/8%). (4) Lv-OVA uninfected mice grown in 21% O2 (Ctrl). Seven days from the beginning of the experiment, cells from the deep cervical lymph nodes were analyzed by flow cytometry. (L) Representative flow cytometry plots of CD25 vs. CD62L gated on TCR Vα2+, CD8+ T cells from each of the four groups. Numbers indicate the frequencies of CD25+ CD62L- cells. (M) Bar graph summarizing the number of TCR Vα2+, CD8+, and CD25+ cells in each of the groups. (P value * 0.0238 **0.0022 ** 0.0022). (N) Bar graph summarizing the number of TCR Vα2+, CD8+, CD25+ and CD62L- cells in each of the groups. (P value *0.0238 ** 0.0022 ** 0.0022). (O) Same as in L focusing on the CD44+ and CD62L- cells. (P) Bar graph summarizing the number of TCR Vα2+, CD8+, and CD44+ cells in each of the groups. (P value * 0.0238 ** 0.0022 ** 0.0022). (Q) Same as in P, focusing on the TCR Vα2+, CD8+, CD44+ and CD62L- cells. (P value *0.0238 ** 0.0022 ** 0.0022). Statistical method, non-parametric Mann–Whitney test, mean ± s.e.m.
Figure 6—figure supplement 1
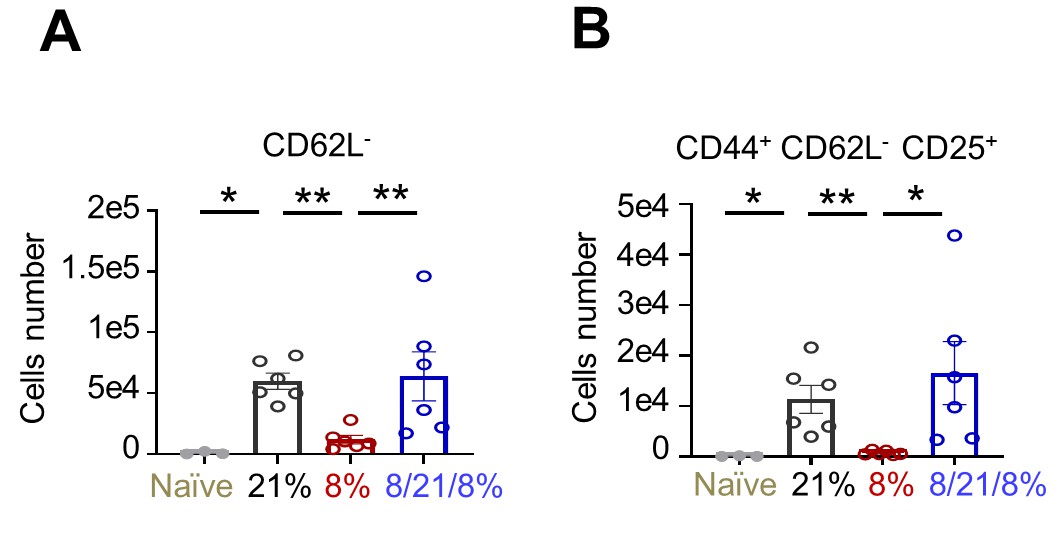
Short oxygen exposure rescues CD8+ T cells activated under hypoxia in vivo.
C57BL6 mice were primed intradermally in the ear pinna with 5 × 10⁶ TU of Lv-OVA or left uninfected. Twenty-four hours after the viral challenge, mice were divided into four groups: (1) Lv-OVA infected mice grown in 21% O2 (21%). (2) Lv-OVA infected mice grown in 8% O2 (8%). (3) Lv-OVA infected mice grown in 8% O2 for 48 hr, transferred to 21% O2 for 24 hr and then transferred back 21% O2 for another 48 hr (8/21/8%). (4) Lv-OVA uninfected mice grown in 21% O2 (Ctrl). Seven days from the beginning of the experiment, cells from the deep cervical lymph nodes were analyzed by flow cytometric analysis. (Naïve n = 3 biological replicates, activated n = 6 biological replicates per group) (A) Bar graph summarizes the number of TCR Vα2+, CD8+ and CD62L- cells in each of the groups. (P value * 0.0238 ** 0.0022 ** 0.0087) (B) Bar graph summarizes the number of TCR Vα2+, CD8+, CD44+, CD25+ and CD62L- cells in each of the groups. (P value * 0.0238 ** 0.0022 * 0.0299). Statistical method, non-parametric Mann-Whitney test, mean ± s.e.m.
Tables
Key resources table
| Reagent type (species) or resource | Designation | Source or reference | Identifiers | Additional information |
|---|---|---|---|---|
| Antibody | Anti-mouse-CD8α (Rat Monoclonal) clone 53–6.7 | Biolegend | Cat# 10071 Cat# 10072 Cat# 10072 | FACS 1:500 |
| Antibody | Anti-mouse-CD44 (Rat Monoclonal) clone IM7 | Biolegend | Cat# 10452 | FACS 1:1000 |
| Antibody | Anti-mouse-CD69 (Armenian Hamster Monoclonal) clone H1.2F3 | Biolegend | Cat# 10451 | FACS 1:500 |
| Antibody | Anti-mouse-CD25 (Rat Monoclonal) clone 3C7 | Biolegend | Cat# 10190 | FACS 1:500 |
| Antibody | Anti-mouse-CD62L (Rat Monoclonal) clone MEL-14 | Biolegend | Cat# 10441 | FACS 1:500 |
| Antibody | Anti-mouse TCR Vα2 (Rat Monoclonal) clone B20.1 | Biolegend | Cat# 12780 | FACS 1:1000 |
| Antibody | Anti-mouse-Ki67 (Rat Monoclonal) clone 16A8 | Biolegend | Cat# 652423 | FACS 1:100 |
| Antibody | Purified anti mouse-C3ϵ (Armenian Hamster monoclonal) clone 145–2 C11 | Biolegend | Cat# 100340 | Activation 0.1 μg/ml |
| Antibody | Purified anti mouse-CD28 (Syrian Hamster monoclonal) clone 37.51 | Biolegend | Cat# 102116 | Activation 0.1 μg/ml |
| Antibody | Purified anti-human-CD3ϵ (Mouse monoclonal) clone OKT3 | Biolegend | Cat# 317326 | Activation 0.1 μg /ml |
| Antibody | Purified anti-human-CD28 (Mouse monoclonal) clone CD28.2 | Biolegend | Cat# 302934 | Activation 0.1 μg/ml |
| Antibody | Anti-human-CD8α (Mouse monoclonal) clone HIT8a | Biolegend | Cat# 30090 | FACS 1:400 |
| Antibody | Anti-human-CD25 (Mouse monoclonal) clone M-A251 | Biolegend | Cat# 35610 | FACS 1:500 |
| Antibody | Anti-mouse AMPKα (Rabbit monoclonal) | Cell Signalling | Cat# 2532 | WB 1:1000 |
| Antibody | Anti-mouse phospho-AMPKα (Rabbit monoclonal) | Cell Signalling | Cat#: 2531 | WB 1:1000 |
| Antibody | Donkey Anti-Rabbit IgG H and L (HRP) (Donkey polyclonal) | abcam | Cat# ab97085 | WB 1:10000 |
| Antibody | Anti-Ubiquitin (Mouse monoclonal) clone FK2 | Merck-Millipore | Cat# ST1200 | IP 2 μg |
| Chemical compound, drug | Oligomycin A | Cayman Chemicals | Cat# 11342 | 1 nM - 1 μM |
| Chemical compound, drug | Rotenone | Cayman Chemicals | Cat# 13995 | 1 μM |
| Chemical compound, drug | Antimycin A | Cayman Chemicals | Cat# 19433 | 1 μM |
| Chemical compound, drug | FCCP | Cayman Chemicals | Cat# 15218 | 1 μM |
| Chemical compound, drug | Bongkrekic Acid (ammonium salt) | Cayman Chemicals | Cat# 19079 | 1 μM - 2 μM |
| Chemical compound, drug | EZview Red Protein G Affinity Gel | Sigma-Aldrich | Cat# E3403 | |
| Chemical compound, drug | Protease Inhibitor Cocktail | Sigma-Aldrich Israel | P8340 | WB and IP 1:100 |
| Sequence-based reagent | Ubc F | This paper | PCR primers | GCCCAGTGTTACCACCAAGA |
| Sequence-based reagent | Ubc R | This paper | PCR primers | CCCATCACACCCAAGAACA |
| Sequence-based reagent | Rpl13 F | This paper | PCR primers | ATGACAAGAAAAAGCGGATG |
| Sequence-based reagent | Rpl13 R | This paper | PCR primers | CTTTCCTGCCTGTTTCCGTA |
| Sequence-based reagent | mt-Rnr F | This paper | PCR primers | CATACTGGAAAGTGTGCTTGGA |
| Sequence-based reagent | mt-Rnr R | This paper | PCR primers | GTGTAGGGCTAGGGCTAGGA |
| Sequence-based reagent | mt-Rnr1 F | This paper | PCR primers | ACCGCGGTCATACGATTAAC |
| Sequence-based reagent | mt-Rnr1 R | This paper | PCR primers | CCCAGTTTGG GTCTTAGCTG |
| Sequence-based reagent | mt-Rnr2 F | This paper | PCR primers | GGGATAACAGCGCAATCCTA |
| Sequence-based reagent | mt-Rnr2 R | This paper | PCR primers | GATTGCTCCGGTCTGAACTC |
| Commercial assay, kit | MitoProbe TMRM Assay Kit for Flow Cytometry | Thermo Fischer: | Cat# M20036 | FACS 50 nM |
| Commercial assay, kit | ProteaseMAX Surfactant | Promega Corp | Cat# V2071 | |
| Commercial assay, kit | CellTrace Violet Cell Proliferation Kit, for flow cytometry | Thermo Fischer: Molecular Probes | Cat# C34571 | FACS 1:100 |
| Commercial assay, kit | EasySep Mouse CD8+T Cell Isolation Kit | STEMCELL Technologies | Cat# 19853A | |
| Commercial assay, kit | Direct-zol RNA MiniPrep Plus | Zymo Research | Cat# R2071 | |
| Commercial assay, kit | ProtoScript First Strand cDNA Synthesis Kit | New England BioLabs, Inc | Cat# E6300L | |
| Commercial assay, kit | Power SYBR Green PCR Master Mix | Applied Biosystems | Cat# 4367660 | |
| Strain, strain background Mus musculus | C57BL/6J | Jackson Laboratory | Stock No: 000664 | Wild type |
| Strain, strain background Mus musculus | Slc25a5tm1.1Nte/J | Jackson Laboratory | Stock No: 029482 | ANT2flox/lox |
| Strain, strain background Mus musculus | C57BL/6-Tg(TcraTcrb)1100Mjb/J | Jackson Laboratory | Stock No: 003831 | OT1 |
| Strain, strain background Mus musculus | B6.Cg-Tg(Lck-cre)1CwiN9 (Lck-Cre) | Taconic | Model # 4197 | Lck-Cre |
| Strain, strain background Mus musculus | Gt(ROSA)26Sortm1.1(CAG-Mito-Dendra2) Dcc | Dr. Tsvee Lapidot from the Weizmann Institute of Science | mito-Dendra2 | |
| Recombinant DNA reagent | Lv-OVA-GFP | Dr. Avihai Hovav from the Hebrew University of Jerusalem | Ovalbumin and GFP expressing lentiviral plasmid | |
| Recombinant DNA reagent | pCMV-VSV-G | a gift from Bob Weinberghttps://www.addgene.org/8454/ | Addgene Plasmid #8454 | VSV-G envelope expressing plasmid |
| Recombinant DNA reagent | psPAX2 | a gift from Didier Trono https://www.addgene.org/12260/ | Addgene Plasmid #12260 | Lentiviral packaging plasmid |
| Software, algorithm | Kaluza software | Beckman Coulter | FACS acquisition software | |
| Software, algorithm | FACS Express 6 | De Novo Software | FACS analysis software | |
| Software, algorithm | Seahorse Wave | Agilent | OCR and EACAR analysis | |
| Software, algorithm | Perseus | Metabolic and proteomic analysis | ||
| Software, algorithm | Prism 8 | GraphPad | Graphs and Heatmaps, statistical analysis | |
| Software, algorithm | Thermo Xcalibur | Thermo Fisher Scientific | Metabolomics LC-MS data acquisition | |
| Software, algorithm | TraceFinder 4.1 | Thermo Fisher Scientific | Metabolomics LC-MS data analysis |
Additional files
-
Supplementary file 1
Matrix protein annotated by GO with either ATP or GTP domains.
- https://cdn.elifesciences.org/articles/56612/elife-56612-supp1-v3.docx
-
Transparent reporting form
- https://cdn.elifesciences.org/articles/56612/elife-56612-transrepform-v3.docx
Download links
A two-part list of links to download the article, or parts of the article, in various formats.
Downloads (link to download the article as PDF)
Open citations (links to open the citations from this article in various online reference manager services)
Cite this article (links to download the citations from this article in formats compatible with various reference manager tools)
Systemic hypoxia inhibits T cell response by limiting mitobiogenesis via matrix substrate-level phosphorylation arrest
eLife 9:e56612.
https://doi.org/10.7554/eLife.56612


