ODELAM, rapid sequence-independent detection of drug resistance in isolates of Mycobacterium tuberculosis
- Center for Global Infectious Disease Research, Seattle Children's Research Institute, United States
- Department of Microbiology, University of Washington, United States
- Division of Infectious Disease, Department of Medicine, Vanderbilt University Medical Center, United States
- Department of Pediatrics, University of Washington, United States
Figures
Figure 1
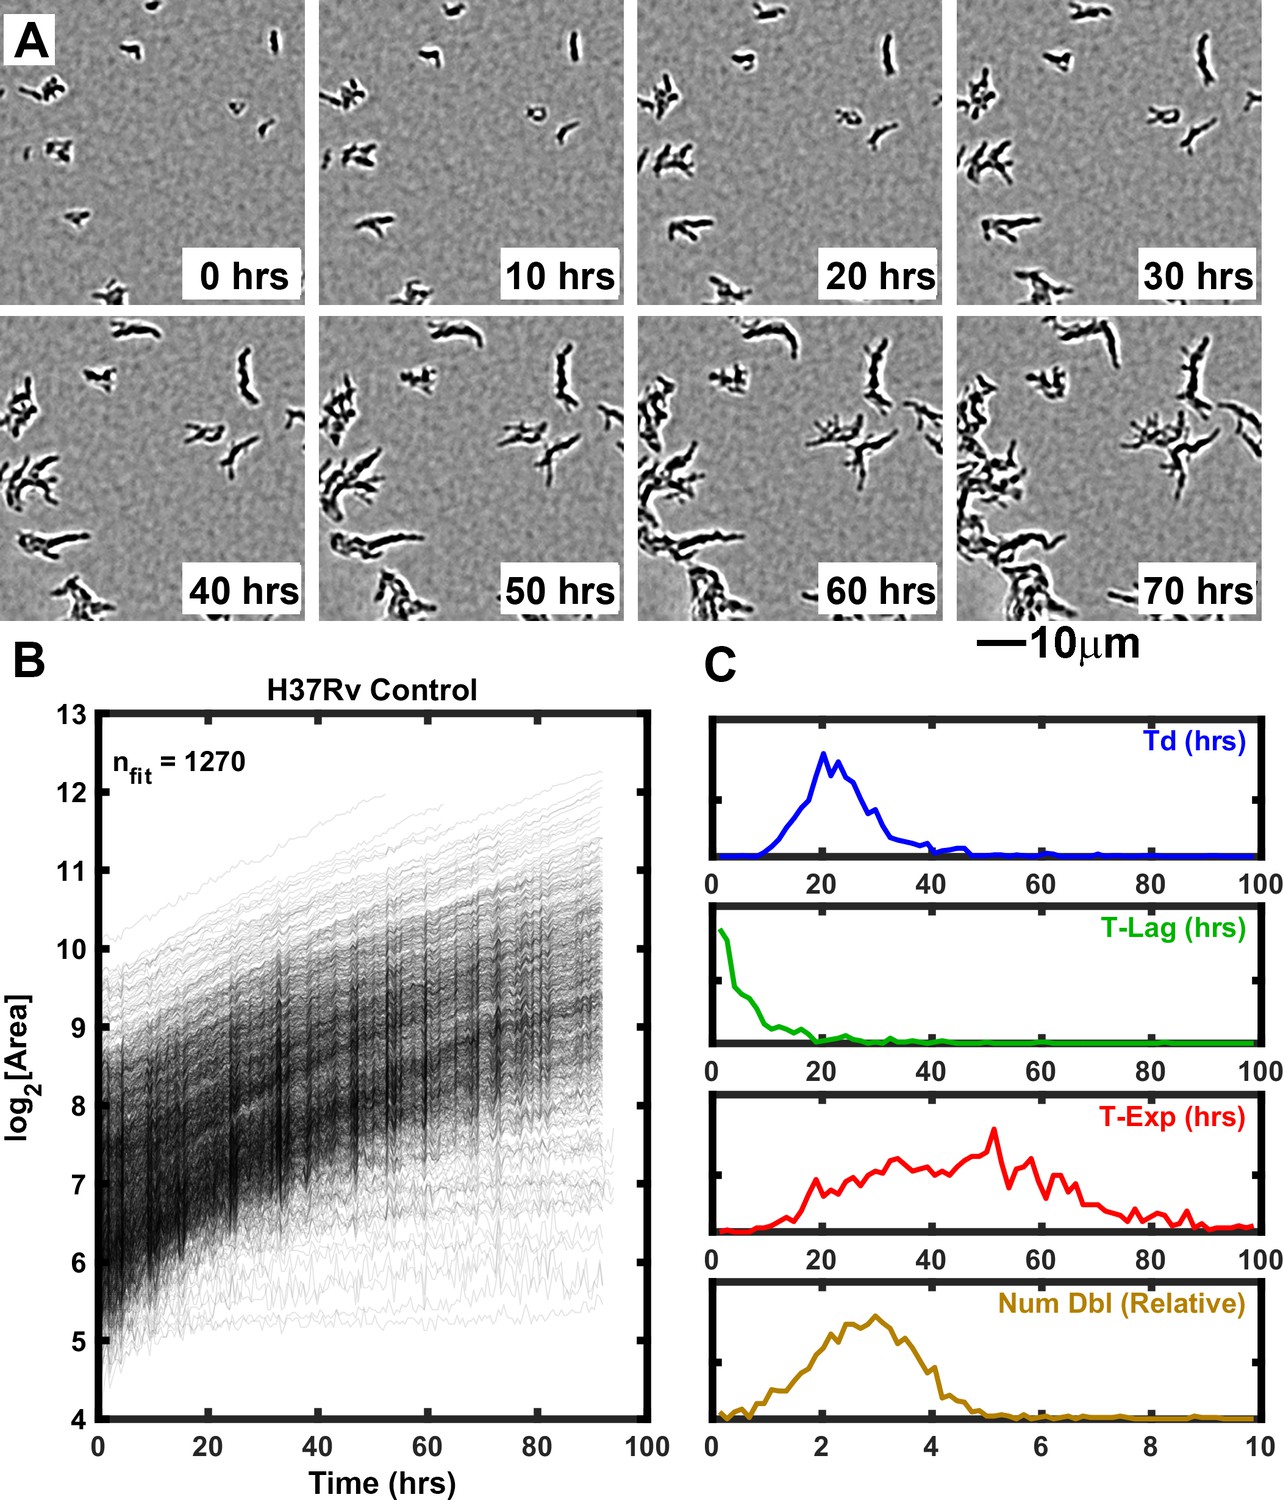
Growth of Mtb strain H37Rv into microcolonies over time observed with ODELAM.
(A) Selected time-lapse snapshots of Mtb colonies growing on a solid medium. Mtb CFUs are shown growing on a 60 μm x 60 μm region of 7H9-GO agar over 96 hrs time course. (B) Growth curves for a total of 1276 colonies were recorded from a 1.2 mm x 0.9 mm region over 96 hrs and plotted. (C) Population histograms of the all extracted growth parameters (Doubling Time, Lag Time, Exponential Time and Number of doublings).
Figure 2
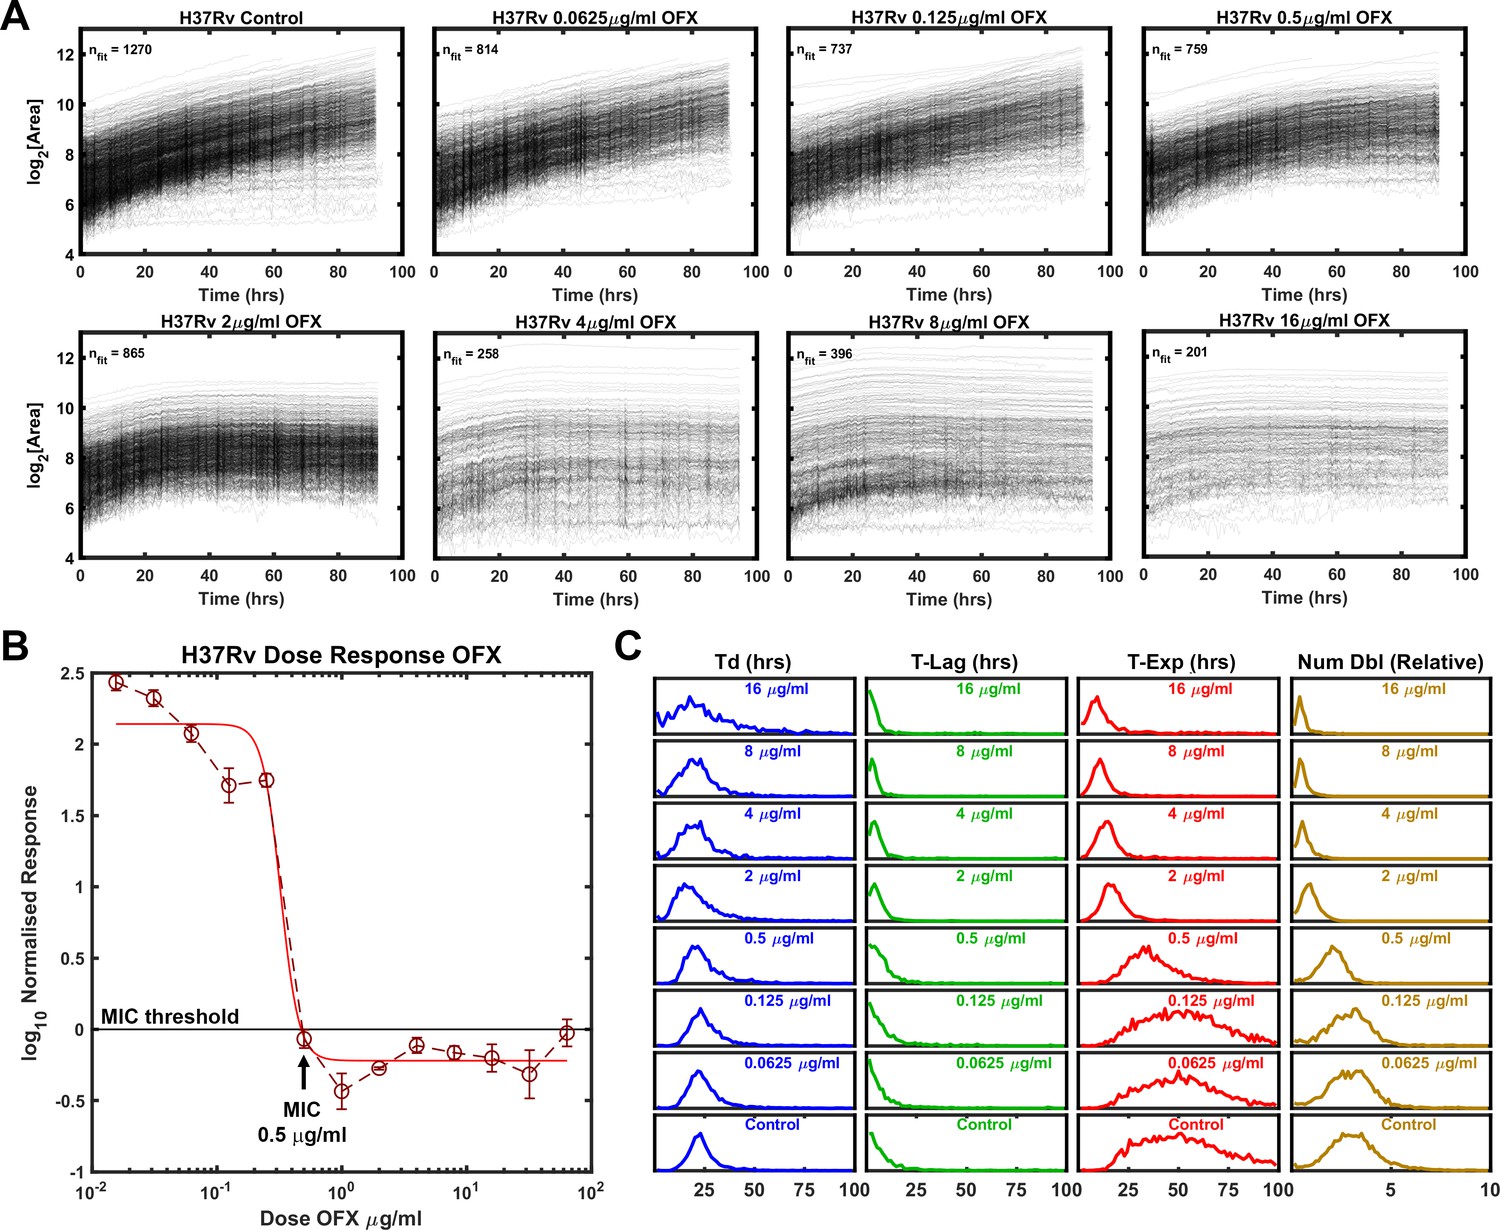
Growth of Mtb strain H37Rv during exposure to ofloxacin.
(A) Growth curves of H37Rv under increasing OFX drug concentrations measured by ODELAM. The flattening of the curves corresponds to the MIC of about 0.5 µg/ml OFX and corresponds to the batch culture dose response (B). (C) Population histograms of the growth parameters showing that the time in exponential growth (T-Exp) is reduced as OFX concentration increases, which in turn leads to a reduced number of doublings.
Figure 3
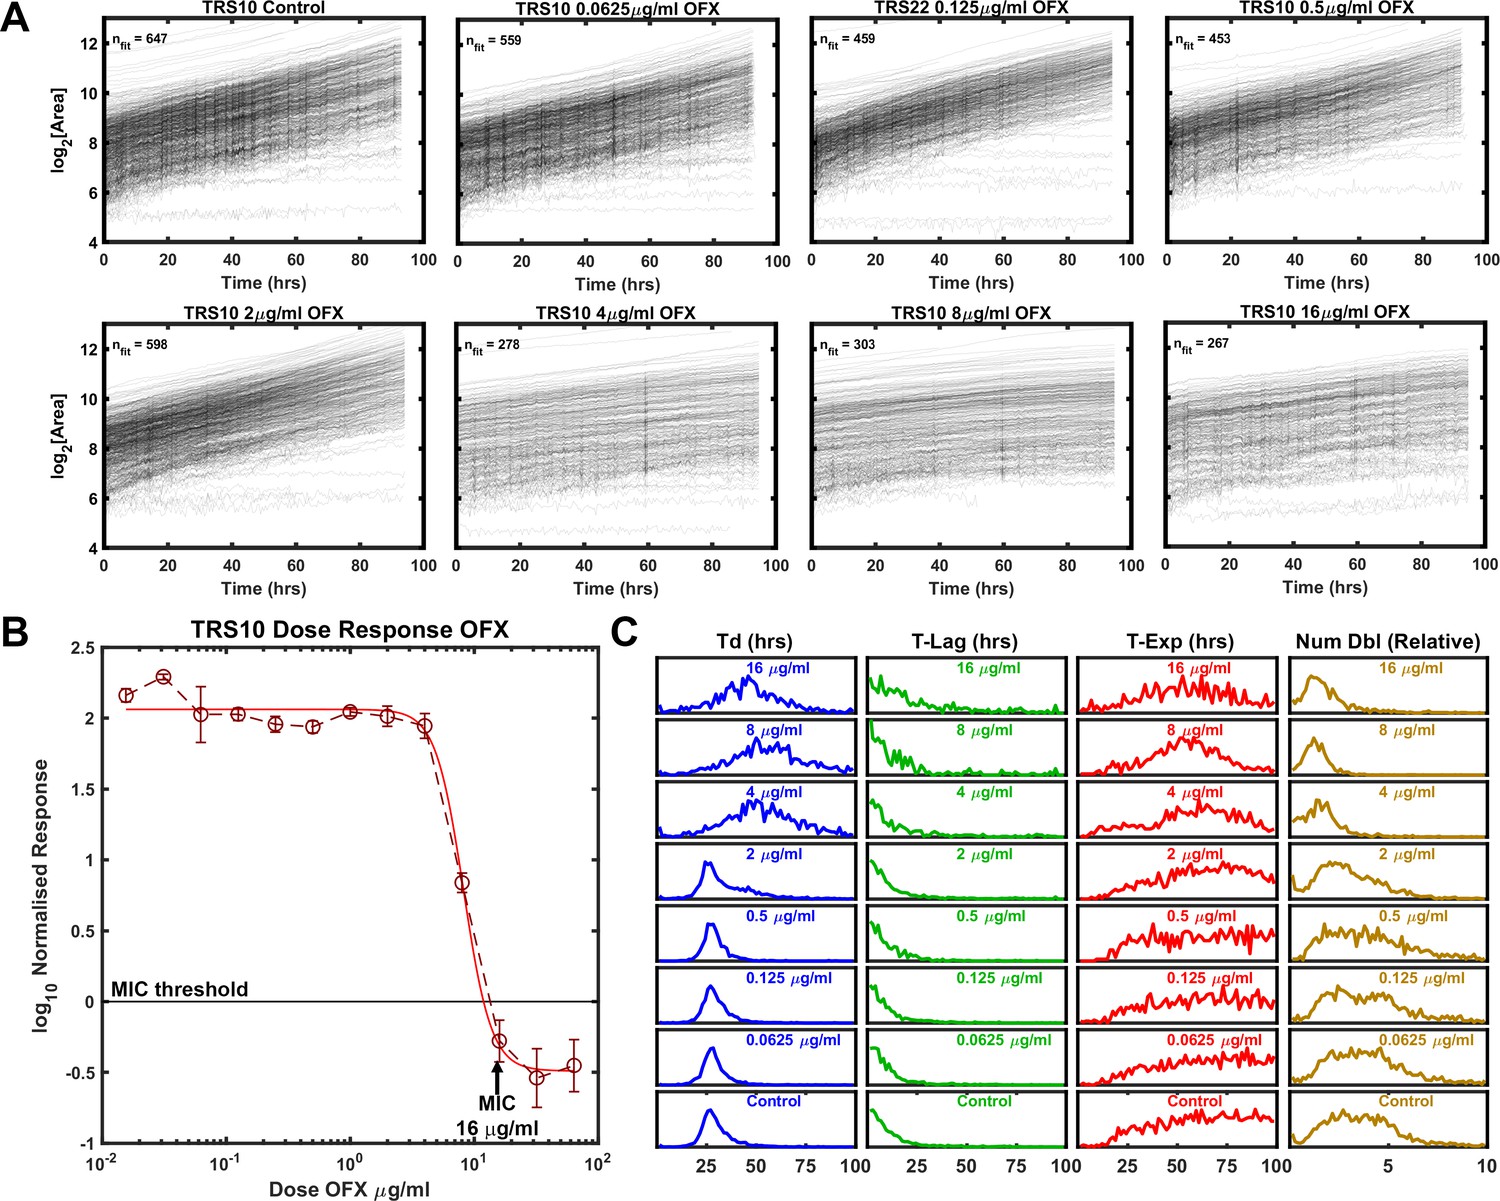
Growth of Mtb strain TRS10 during exposure to ofloxacin.
(A) Growth of clinical isolate TRS10 appears to slow under increasing OFX pressure. (B) Batch culture dose response curve for TRS10, indicating an MIC of 16 µg/ml OFX. (C) ODELAM histograms with increasing OFX concentration, showing that up to the MIC, doubling time appears to increase while the time in exponential phase is less affected.
Figure 4

Effect Size of OFX on growth parameters.
(A) Effect size as measured by the Kolmogorov-Smirnov statistic vs OFX concentrations for H37Rv. Note, the number of doublings observed tracks with the time growing exponentially (T-Exp). (B) Effect size as measured by the Kolmogorov-Smirnov statistic vs OFX concentrations for TRS10. Note, doubling time (Td) tracks with number of doublings (B).
Figure 5
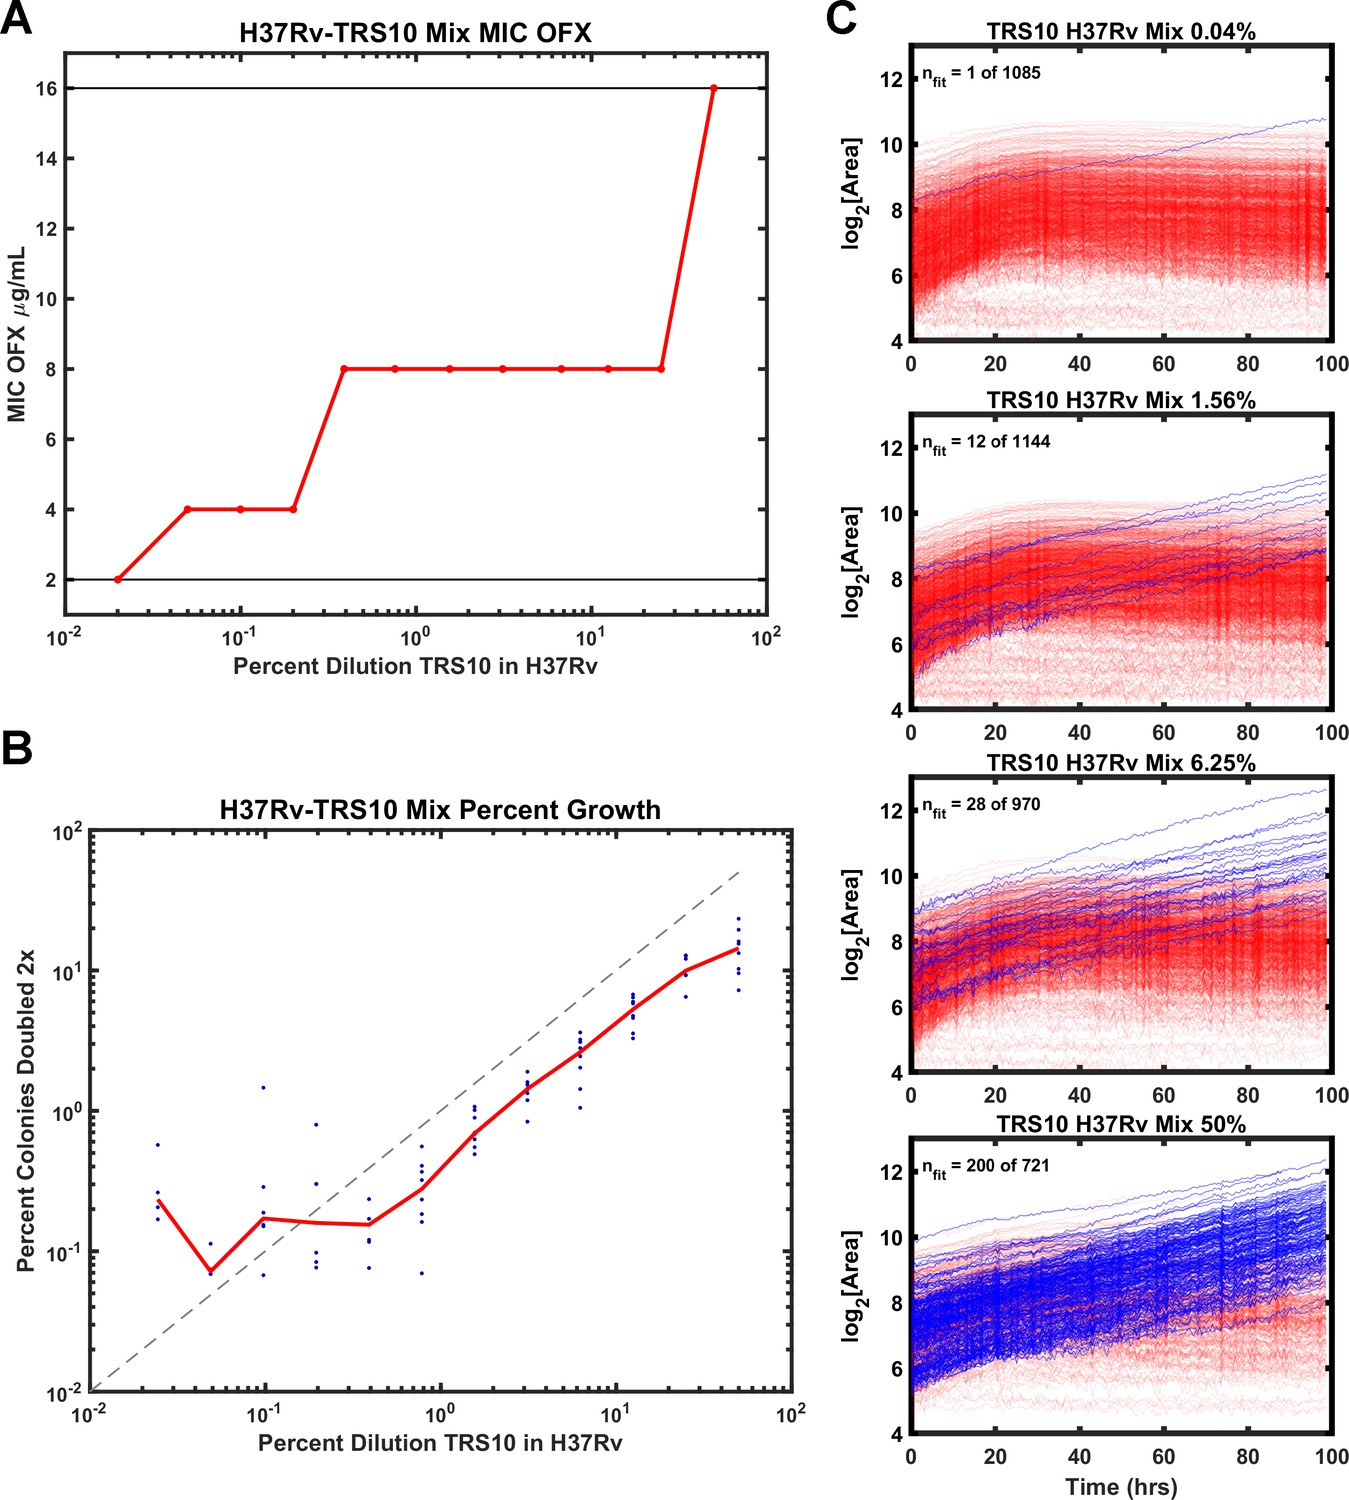
Comparison of ODELAM and MIC assay in detecting heteroresistance.
(A) Dilution of TRS10 into H37Rv and the corresponding MICs obtained from a bulk culture assay. (B) Comparison of the percentage of TRS10 in H37Rv generated by dilution against the percentage of CFUs observed to grow more than 2× by ODELAM. The blue dots are replicate measurements from a given dilution and the red line is the mean of each replicate. (C) ODELAM growth curves for TRS10/H37Rv mixtures. Blue traces are resistant and red traces are sensitive to OFX.
Figure 6

ODELAM analysis of Mtb strain ADB42 reveals heteroresistance to OFX.
(A) Batch culture-based dose response curve of ADB42 showing an OFX MIC of about 16 µg/ml. (B) At 2 µg/ml OFX, tails in the doubling time, T-Exp, and number of doublings indicate that a second population may be present.
Figure 7
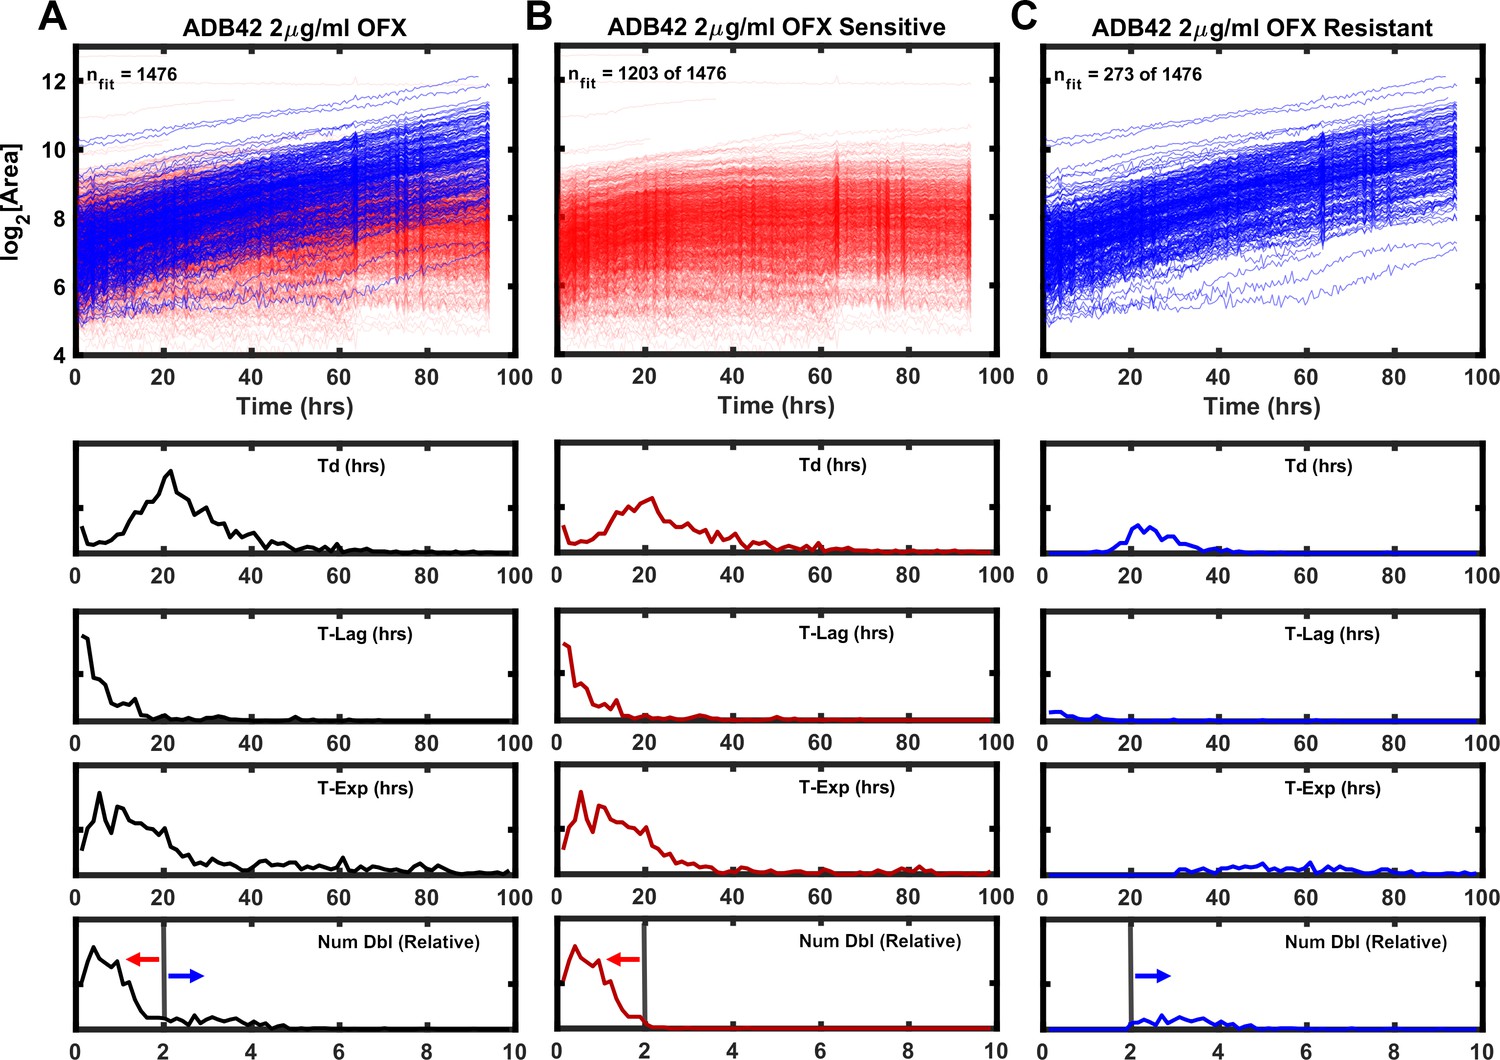
Growth kinetics generated by ODELAM for heteroresistant cultured clinical isolate ADB42.
TOP (A) Growth curves of ADB42 growing at 2 µg/ml OFX. Of the 1476 CFUs in the heteroresistant culture, sensitive and resistant components were segregated by selecting those that doubled fewer than 2× (1203 CFUs; red traces) or more than 2× (273 CFUs; blue traces) (B and C) Traces of sensitive and resistant components presented separately for clarity. BOTTOM: Histograms of growth parameters derived from traces shown in A with sensitive and resistant components demarcated by the gray vertical lines.
Figure 8
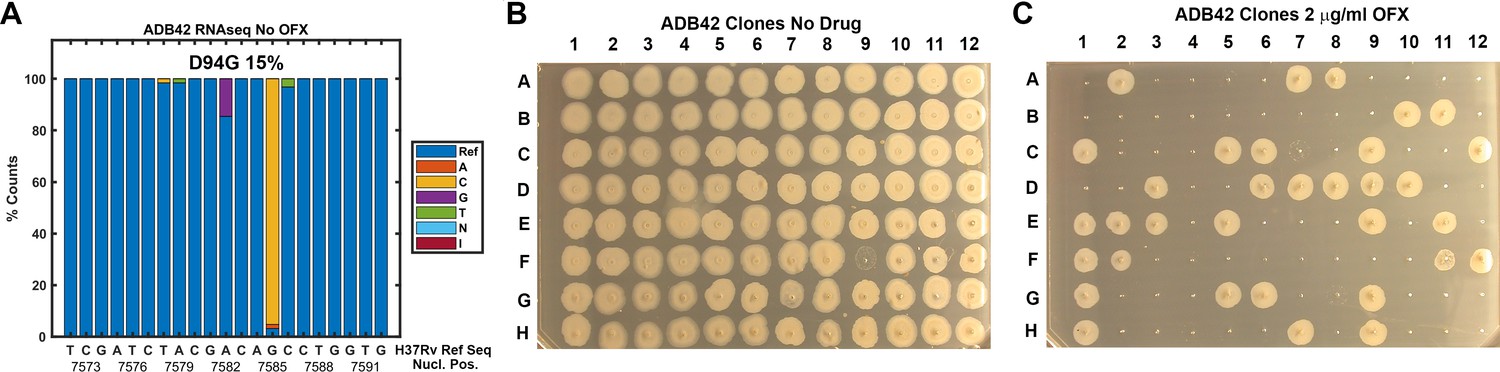
Assessment of ADB42 heteroresistance by spot assay.
(A) Prevalence of the DNA gyrase II (Rv0006) D94G mutation before and after exposure to 32 μg/ml OFX for 24 hrs as detected by DNA sequencing. (B and C) Clones isolated from ADB42 grown on 7H10 media and 7H10 media with 2 μg/ml OFX for five days, before spotting on media lacking OFX (B) or containing OFX (C). 33 of 96 clones were observed to grow in the presence of OFX, indicating resistance to OFX.
Figure 9
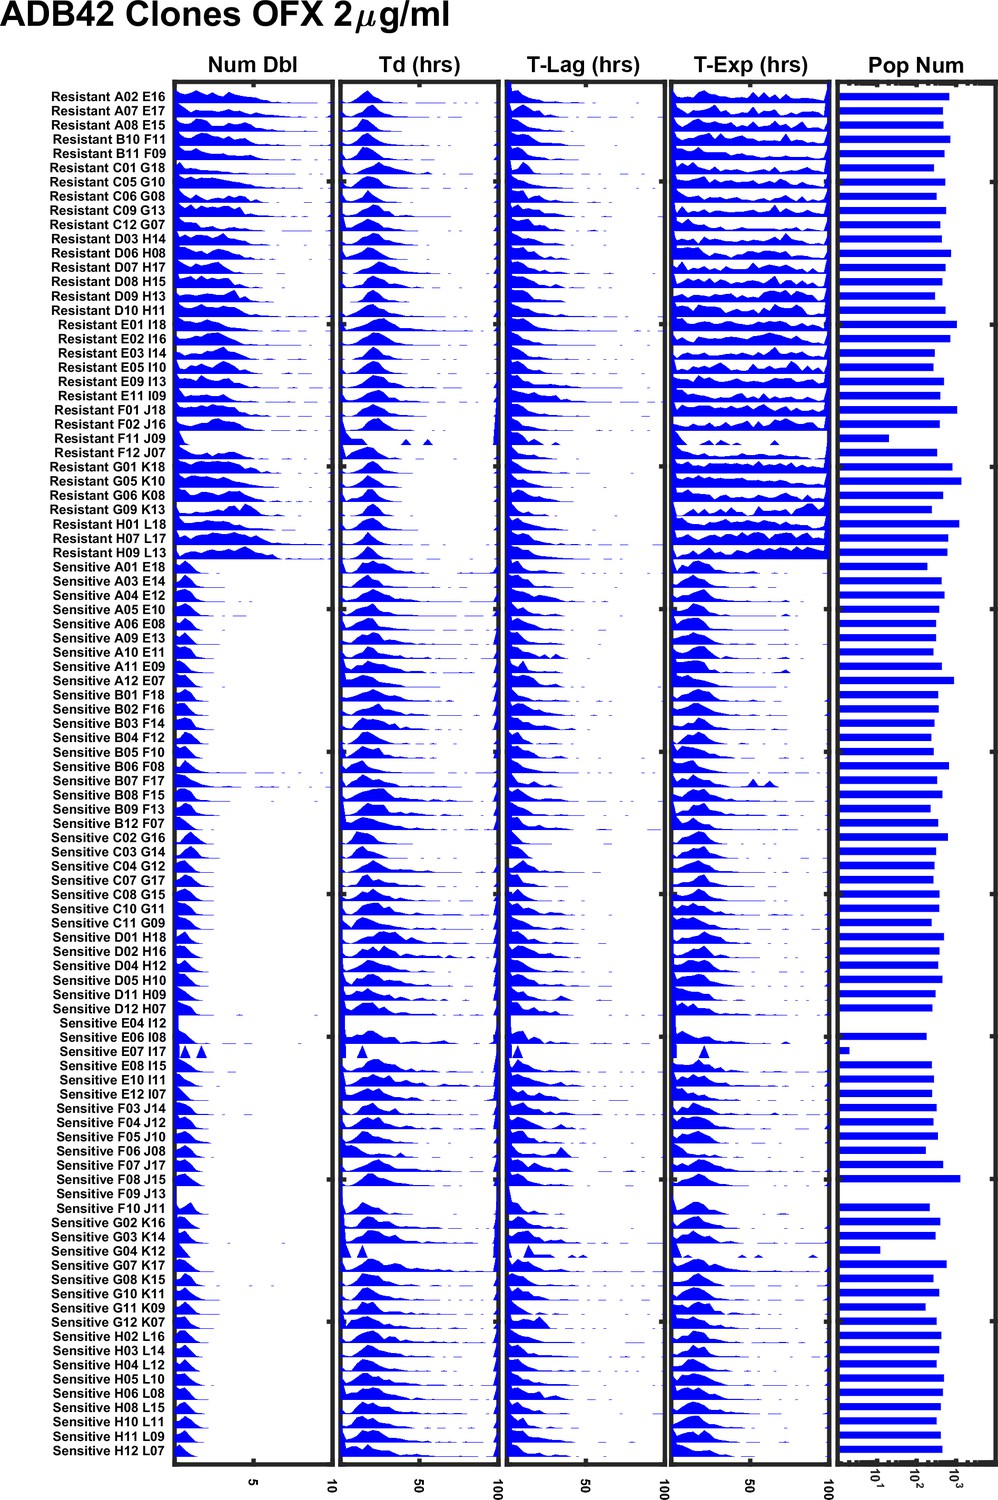
ODELAM experiment summary of 96 individual clones of ADB42 grown on 2 μg/ml OFX.
Sensitive and resistant clones of ADB42 segregate according to their number of doublings (Num Dbl) and time in exponential phase (T-Exp). Sub-populations in the ADB42 clones were not observed.
Figure 10
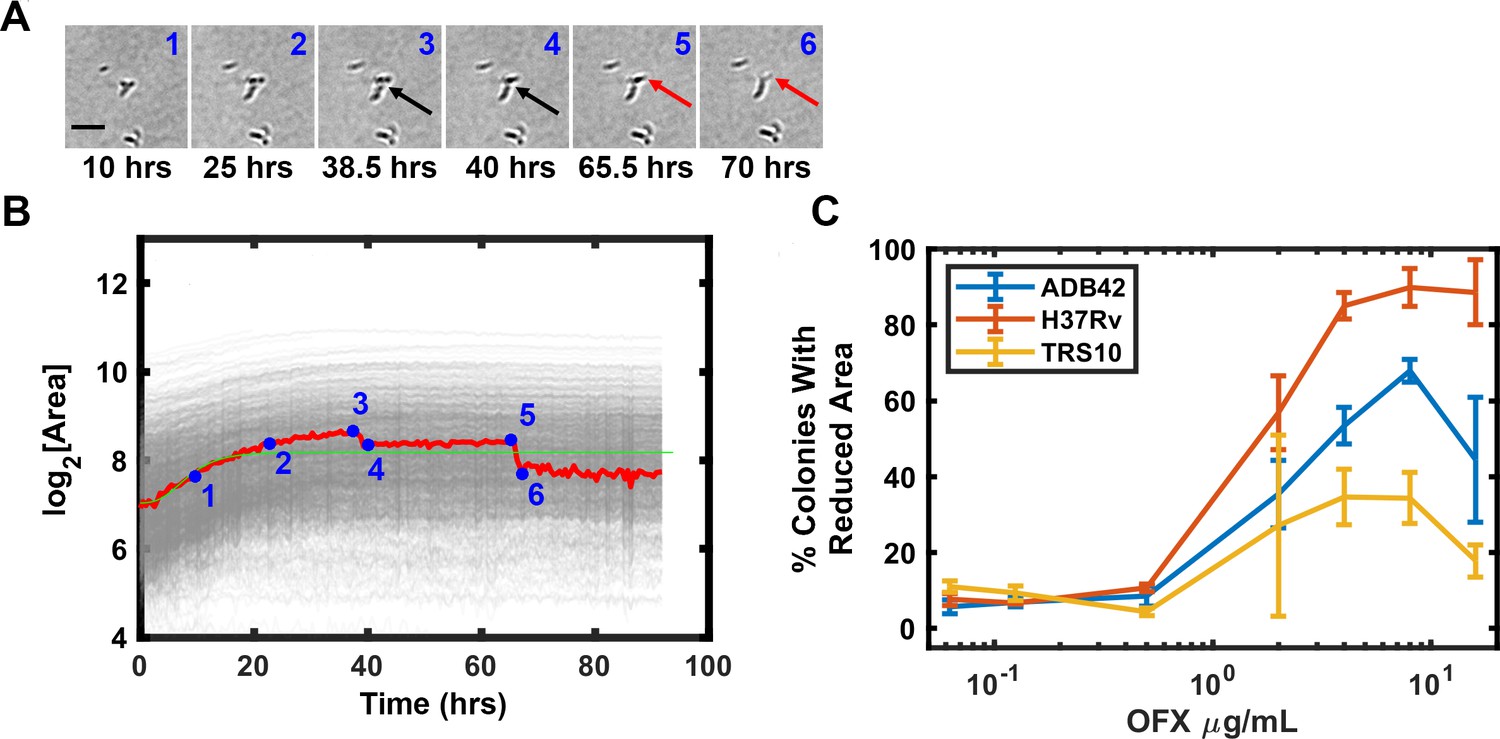
OFX induced lysis of Mtb bacilli.
Some CFUs were observed to lose area after exposure to OFX, which is attributable cell lysis indicated by arrows (A). Tracking of images in A and plotting CFUs area over time detects lysis events as a reduction in CFU area (B). The percentage of colonies that lost area is plotted for each strain against drug concentration (C).
Figure 11
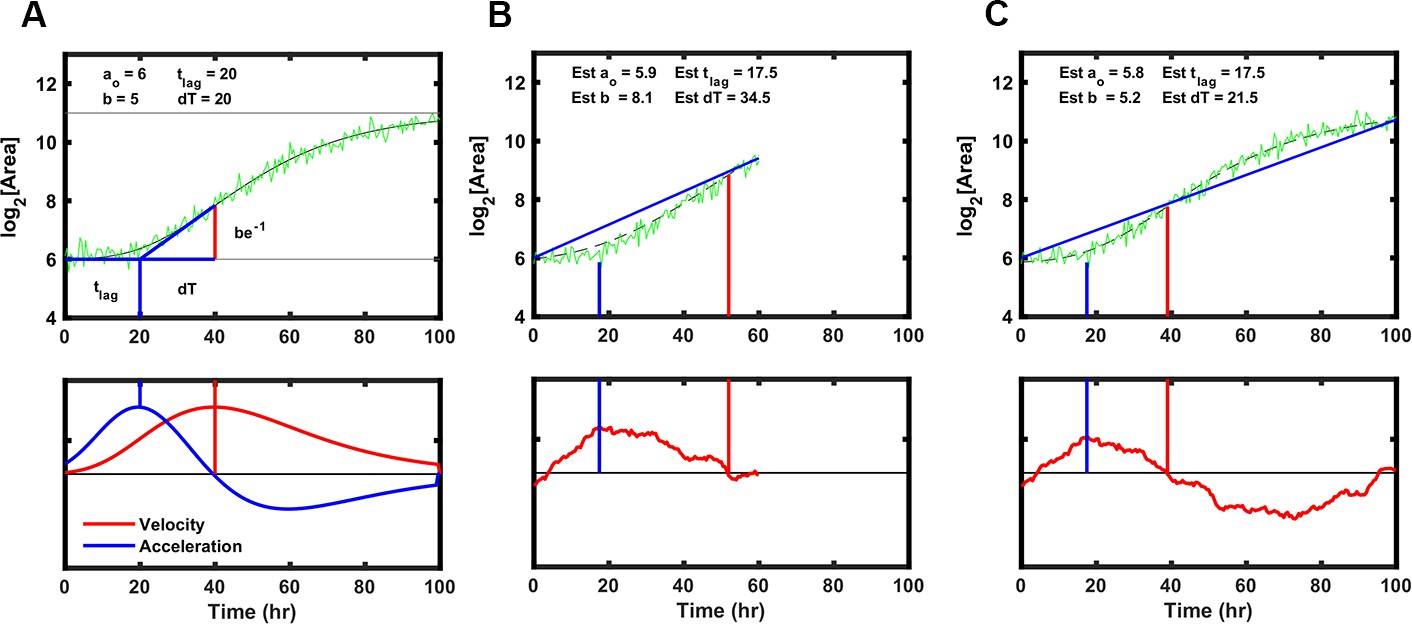
Strategy to fit Gompertz function parameters on a simulated growth curve with noise added.
(A) Illustration of the parameters used to fit the Gompertz function as described in Materials and methods. Note the value dT, the time between T-Lag and the maximum growth velocity, is used for estimating the growth curve but T-Exp is reported. T-Exp is the time between the maximum and minimum acceleration or twice the value dT. (B) Initial estimates of each parameter were generated from a line connecting the first and last data points in a truncated simulated growth curve, which represents the time of experimental data acquisition. Bottom panel shows the differences between the line generated and the simulation. The initial estimate for T-Lag is determined by the maximum difference between the line generated and the simulation (blue vertical lines). T-Exp (or 2× dT) is determined where the absolute difference between the line and the simulated data is minimized (red vertical line). (C) Same as B with longer simulation time, showing initial estimates are similar.
Figure 12
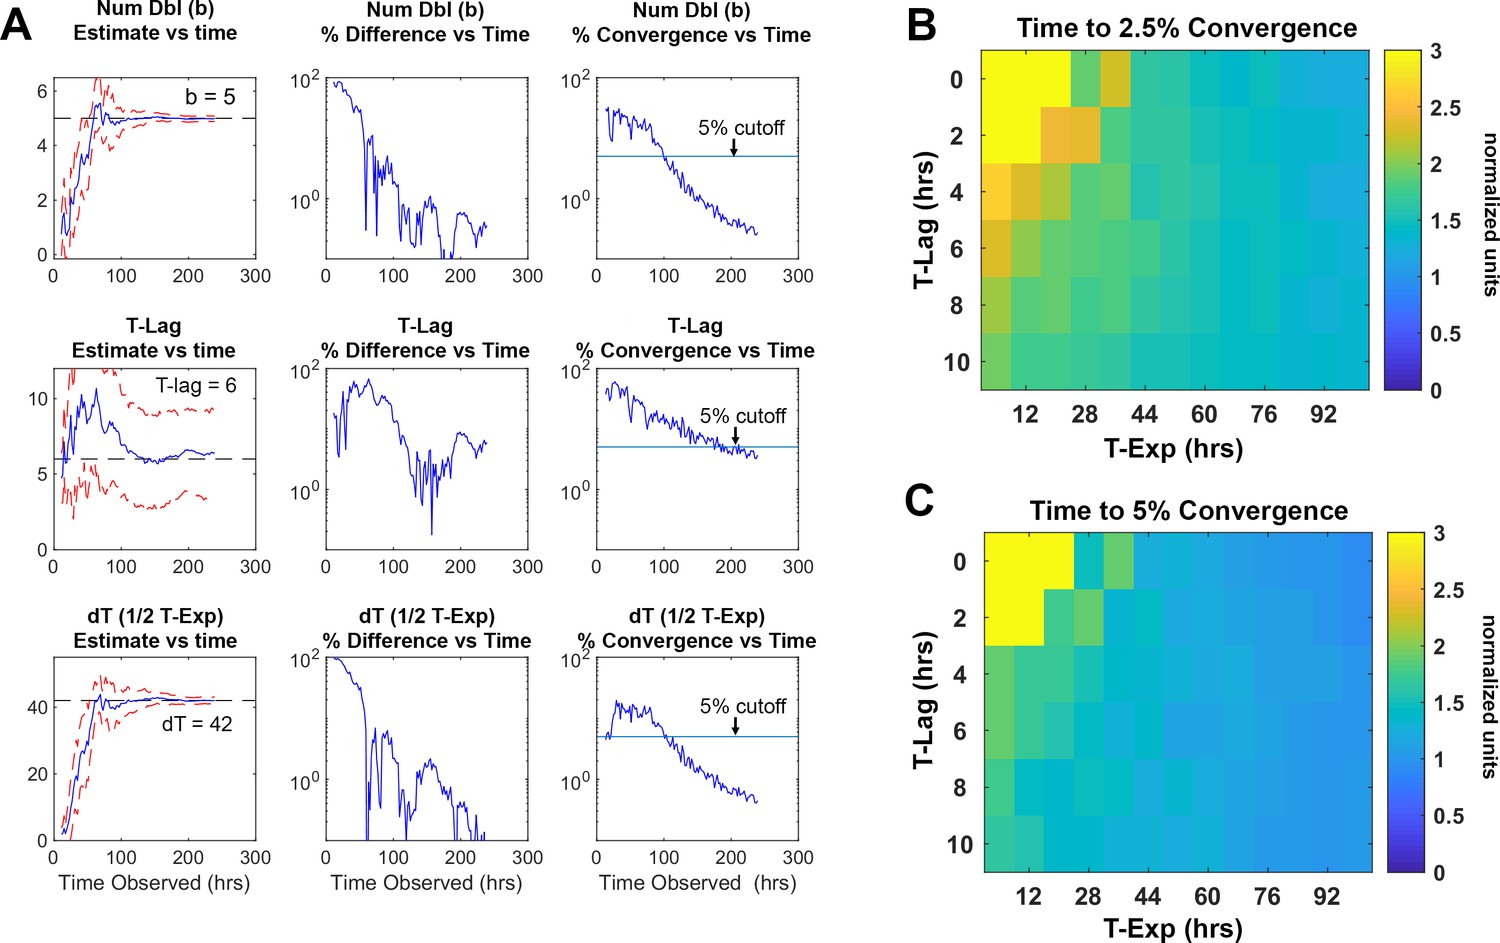
Time required for reliably determining the kinetic parameters in silico.
(A) Column 1, the difference between the true parameter, in this case Num Dbl = 5, T-Lag = 6, and dT = 42, and the estimated parameter are plotted as more of the growth curve is observed over time. As more timepoints of the growth curve are included or “observed” in the fit algorithm, the estimated parameters approach their true values. The red dashed lines are 1 standard deviation of 25 growth curves each with random noise added. Column 2, the percent difference between the true value and the estimated value are unstable and do not decrease consistently as more time points are included in the estimation. Column 3, percent convergence given by the difference between two consecutive time point estimations and divided by the true parameter value and decreases steadily over time. The blue line represents a convergence threshold of 5% between consecutive estimations and this threshold is met when all parameters fall below the convergence threshold. (B–C) Heat maps showing the ratio of time needed for the parameter to converge to a given precision, divided by the total time for the growth curve to begin to plateau . The ratio is given explicitly as . The heatmaps indicate that for given lag times and time in exponential phase the parameters converge after the growth curve begins to plateau. This means that for a drug that causes growth cessation at 20 hours, a measurement of roughly 1.5× that, or 30 hrs of observation, is required for the parameter to converge to less 5% precision.
Tables
Table 1
Summary growth statistics of isolates.
| Condition tested | CFUs total | Num of rep | Med td (hrs) | IQR td (hrs) | Med T-Lag time (hrs) | IQR T-Lag time (hrs) | Med T-Exp (hrs) | IQR T-Exp (hrs) | Med Num Dbl | IQR Num Dbl |
|---|---|---|---|---|---|---|---|---|---|---|
| Control-H37Rv | 5413 | 8 | 22.9 | 7.8 | 0.0 | 3.7 | 52.5 | 33.8 | 3.1 | 1.6 |
| 0.0625 μg/ml-H37Rv | 3380 | 4 | 23.4 | 9.6 | 0.0 | 2.8 | 51.8 | 28.1 | 3.0 | 1.5 |
| 0.125 µg/ml-H37Rv | 2946 | 4 | 24.3 | 10.0 | 0.0 | 2.9 | 53.0 | 29.5 | 3.0 | 1.4 |
| 0.5 µg/ml-H37Rv | 2231 | 4 | 22.6 | 10.7 | 0.9 | 6.2 | 35.2 | 16.2 | 2.0 | 0.9 |
| 2 µg/ml-H37Rv | 5354 | 8 | 19.2 | 13.7 | 3.9 | 6.1 | 17.3 | 8.2 | 0.9 | 0.6 |
| 4 µg/ml-H37Rv | 1412 | 4 | 21.1 | 12.5 | 3.9 | 5.2 | 14.7 | 7.7 | 0.6 | 0.4 |
| 8 µg/ml-H37Rv | 1728 | 4 | 20.8 | 12.1 | 2.8 | 4.0 | 11.5 | 6.5 | 0.5 | 0.3 |
| 16 μg/ml-H37Rv | 894 | 4 | 22.9 | 24.4 | 1.5 | 4.4 | 11.2 | 12.4 | 0.5 | 0.3 |
| Control-TRS10 | 3449 | 8 | 28.4 | 8.5 | 2.8 | 9.3 | 79.7 | 54.2 | 3.5 | 2.5 |
| 0.0625 µg/ml-TRS10 | 2181 | 4 | 28.2 | 6.9 | 1.9 | 8.1 | 81.7 | 55.6 | 3.8 | 2.6 |
| 0.125 µg/ml-TRS10 | 2014 | 4 | 28.5 | 7.6 | 0.0 | 5.4 | 80.3 | 61.2 | 3.7 | 2.8 |
| 0.5 µg/ml-TRS10 | 1167 | 4 | 28.3 | 6.3 | 0.0 | 6.0 | 81.8 | 62.5 | 3.8 | 3.1 |
| 2 µg/ml-TRS10 | 2982 | 8 | 30.6 | 17.9 | 2.3 | 9.2 | 73.7 | 42.6 | 2.8 | 2.2 |
| 4 µg/ml-TRS10 | 1190 | 4 | 53.1 | 26.0 | 0.0 | 7.4 | 65.7 | 38.7 | 1.5 | 1.1 |
| 8 µg/ml-TRS10 | 1063 | 4 | 57.8 | 28.4 | 0.0 | 2.1 | 56.7 | 27.4 | 1.3 | 0.7 |
| 16 µg/ml-TRS10 | 966 | 4 | 46.0 | 21.8 | 0.0 | 13.8 | 61.8 | 44.8 | 1.6 | 1.3 |
| Control-ADB42 | 5599 | 8 | 24.4 | 7.8 | 1.1 | 8.2 | 64.3 | 42.9 | 3.4 | 2.0 |
| 0.0625 µg/ml-ADB42 | 3762 | 4 | 24.7 | 7.2 | 0.0 | 5.2 | 63.8 | 35.7 | 3.4 | 1.8 |
| 0.125 µg/ml-ADB42 | 3980 | 4 | 25.3 | 7.4 | 0.0 | 4.8 | 63.8 | 35.1 | 3.4 | 1.7 |
| 0.5 µg/ml-ADB42 | 3121 | 4 | 25.0 | 9.7 | 0.0 | 6.2 | 40.6 | 31.7 | 2.0 | 1.4 |
| 2 µg/ml-ADB42 | 4995 | 8 | 26.9 | 18.0 | 1.9 | 8.0 | 29.5 | 43.3 | 1.1 | 1.7 |
| 4 µg/ml-ADB42 | 1440 | 4 | 36.7 | 27.7 | 5.0 | 13.9 | 38.8 | 51.6 | 0.9 | 1.9 |
| 8 µg/ml-ADB42 | 1287 | 4 | 54.7 | 56.2 | 4.1 | 13.2 | 40.0 | 39.2 | 0.6 | 0.9 |
| 16 µg/ml-ADB42 | 910 | 4 | 17.5 | 34.8 | 31.5 | 32.6 | 46.6 | 36.4 | 0.6 | 1.0 |
Table 2
Ratios of resistant cells as calculated by application of the binomial distribution and experimental observations.
| Total number of sample reads (number of trials) | Number of D94G SNPs detected (number of success) p=r | Ratio of resistant cells to sensitive cells (probability of trial success) | 95% Confidence interval [Low]-[High] |
|---|---|---|---|
| 62 | 9 | 0.09–0.24 | [2, 9 - 9, 21] |
| Total number of colonies picked (number of trials) | Number of resistant colonies (number of success) p=r | ||
| 96 | 33 | 0.28–0.44 | [17,33 - 33,61] |
| One or two cells contribute to colony p=1-(1 r)2 | 0.14–0.26 | [17,33 - 33,61] | |
| Total number of colonies tracked | Number that fit resistance criterion | Ratio of resistant cells to sensitive cells | |
| 963 | 237 | 0.2461 | |
| 473 | 114 | 0.2410 | |
| 1476 | 273 | 0.1850 | |
| 1043 | 244 | 0.2339 | |
| 359 | 101 | 0.2557 | |
| 561 | 157 | 0.2799 | |
| 573 | 146 | 0.2548 | |
| 459 | 123 | 0.2680 | |
| Mean resistance ratio | 0.2456 |
Table 3
Sequence data gyrA SNPs in OFX sensitive and resistant clones.
| QRDR | QRDR | |||
|---|---|---|---|---|
| Position in the gyrase protein | 21 | 94 | 95 | 247 |
| H37Rv | E | D | S | G |
| TRS10 | Q | G | T | S |
| ADB42 OFX Sensitive | Q | D | T | G |
| ADB42 OFX Resistant | Q | G | T | G |
Key resources table
| Reagent type (species) or resource | Designation | Source or reference | Identifiers | Additional information |
|---|---|---|---|---|
| Strain, strain background (Mycobacterium tuberculosis) | H37Rv | ATCC | ATCC −27294 | |
| Strain, strain background (Mycobacterium tuberculosis) | TRS10 | PMID:24687490 | 10 | |
| Strain, strain background (Mycobacterium tuberculosis) | ADB42 | PMID:24687490 | 42 | |
| Sequence-based reagent | Primer a for QRDR amplification | IDT | gyrA_1Fw | CCTGCGTTCGATTGCAAACG |
| Sequence-based reagent | Primer b for QRDR amplification | IDT | gyrA_1Rv | CGTGGTTGACCTGATACGG |
| Commercial assay or kit | RiboZero rRNA removal (bacterial) | Illumina Inc | (discontinued) | |
| Commercial assay or kit | AMPure XP | Agencourt Bioscience Corporation | Beckman Coulter A63881 | |
| Commercial assay or kit | NEBNext Ultra RNA Library Prep Kit for Illumina | New England Biolabs | E7530S | |
| Commercial assay or kit | NEBNext Multiplex Oligos for Illumina | New England Biolabs | Dual Index Primers Set 1 E7335S | |
| Commercial assay or kit | Kapa qPCR quantification kit | Roche | KK4824 | |
| Commercial assay or kit | Illumina NextSeq 500 High Output v2 Kit | Illumina Inc | ||
| Commercial assay or kit | MagJet Genomic DNA kit | Thermo Fisher Scientific | K2722 | |
| Commercial assay or kit | Lysing Matrix B | MP Biomedicals | ||
| Chemical compound, drug | Ofloxacin | Sigma | O8757-1G | |
| Software, algorithm | DuffNGS | PMID:21317536 | https://sourceforge.net/projects/duffyrnaseq/ | |
| Software, algorithm | Bowtie 2 | PMID:22388286 | ||
| Software, algorithm | MicroManager v1.4 | PMID:25606571 | https://micro-manager.org/ | |
| Software, algorithm | MATLAB | Mathworks | www.mathworks. com | |
| Software, algorithm | ODELAY-ODELAM | This manuscript | https://github.com/AitchisonLab/ |
Additional files
Download links
A two-part list of links to download the article, or parts of the article, in various formats.
Downloads (link to download the article as PDF)
Open citations (links to open the citations from this article in various online reference manager services)
Cite this article (links to download the citations from this article in formats compatible with various reference manager tools)
ODELAM, rapid sequence-independent detection of drug resistance in isolates of Mycobacterium tuberculosis
eLife 9:e56613.
https://doi.org/10.7554/eLife.56613


