Corticothalamic gating of population auditory thalamocortical transmission in mouse
- Department of Molecular and Integrative Physiology, University of Illinois, United States
- Beckman Institute for Advanced Science and Technology, University of Illinois, United States
- Department of Neuroscience, School of Medicine and Public Health, University of Wisconsin-Madison, United States
- Department of Anesthesiology, School of Medicine and Public Health, University of Wisconsin-Madison, United States
- Neuroscience Program, University of Illinois, United States
- College of Medicine, University of Illinois, United States
Figures
Figure 1
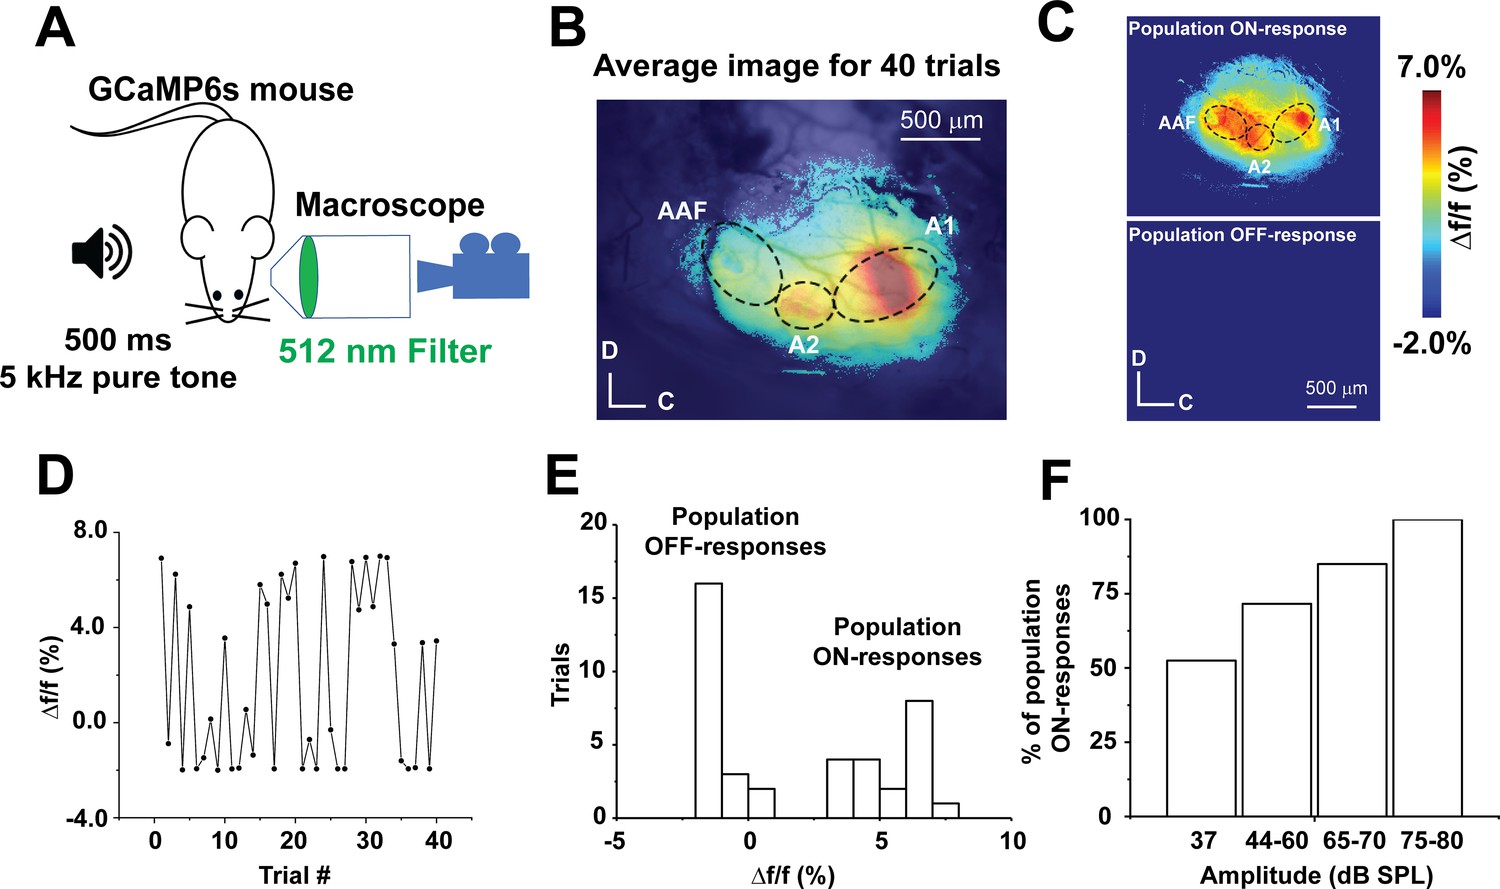
Stochastic auditory cortical population responses to repeated sound presentations in vivo.
(A) A cartoon image showing the experimental design of transcranial calcium imaging of the left AC of GCaMP6s mouse during a 500 ms pure tone (5 kHz) exposure to the right ear. (B) Pseudocolor image representing the average map of AC activation indicated by Δf/f of sound-evoked calcium signals following 40 trials of 5 kHz-37 dB SPL pure tone stimulation. (C) Two pseudocolor images representing an individual trial for population ON cortical response (top) versus population OFF cortical response (bottom). (D) A line graph of Δf/f of the sound-evoked Ca signals of A1 across 40 trials of playing 5 kHz, 37 dB SPL over time. (E) A histogram of the Δf/f of sound-evoked calcium signals following 40 trials of 5 kHz-37 dB SPL stimulation (bin size = 1%). (F) A bar graph showing the percentage of population ON cortical responses across different sound levels at 5 kHz pure tone; A1: Primary auditory cortex, A2: Secondary auditory cortex, AAF: Anterior auditory field, C: Caudal, D: Dorsal.
-
Figure 1—source code 1
The MATLAB code used to produce Figure 1B and C.
- https://cdn.elifesciences.org/articles/56645/elife-56645-fig1-code1-v2.zip
-
Figure 1—source data 1
Data values of Figure 1D-F.
- https://cdn.elifesciences.org/articles/56645/elife-56645-fig1-data1-v2.xlsx
Figure 2 with 6 supplements
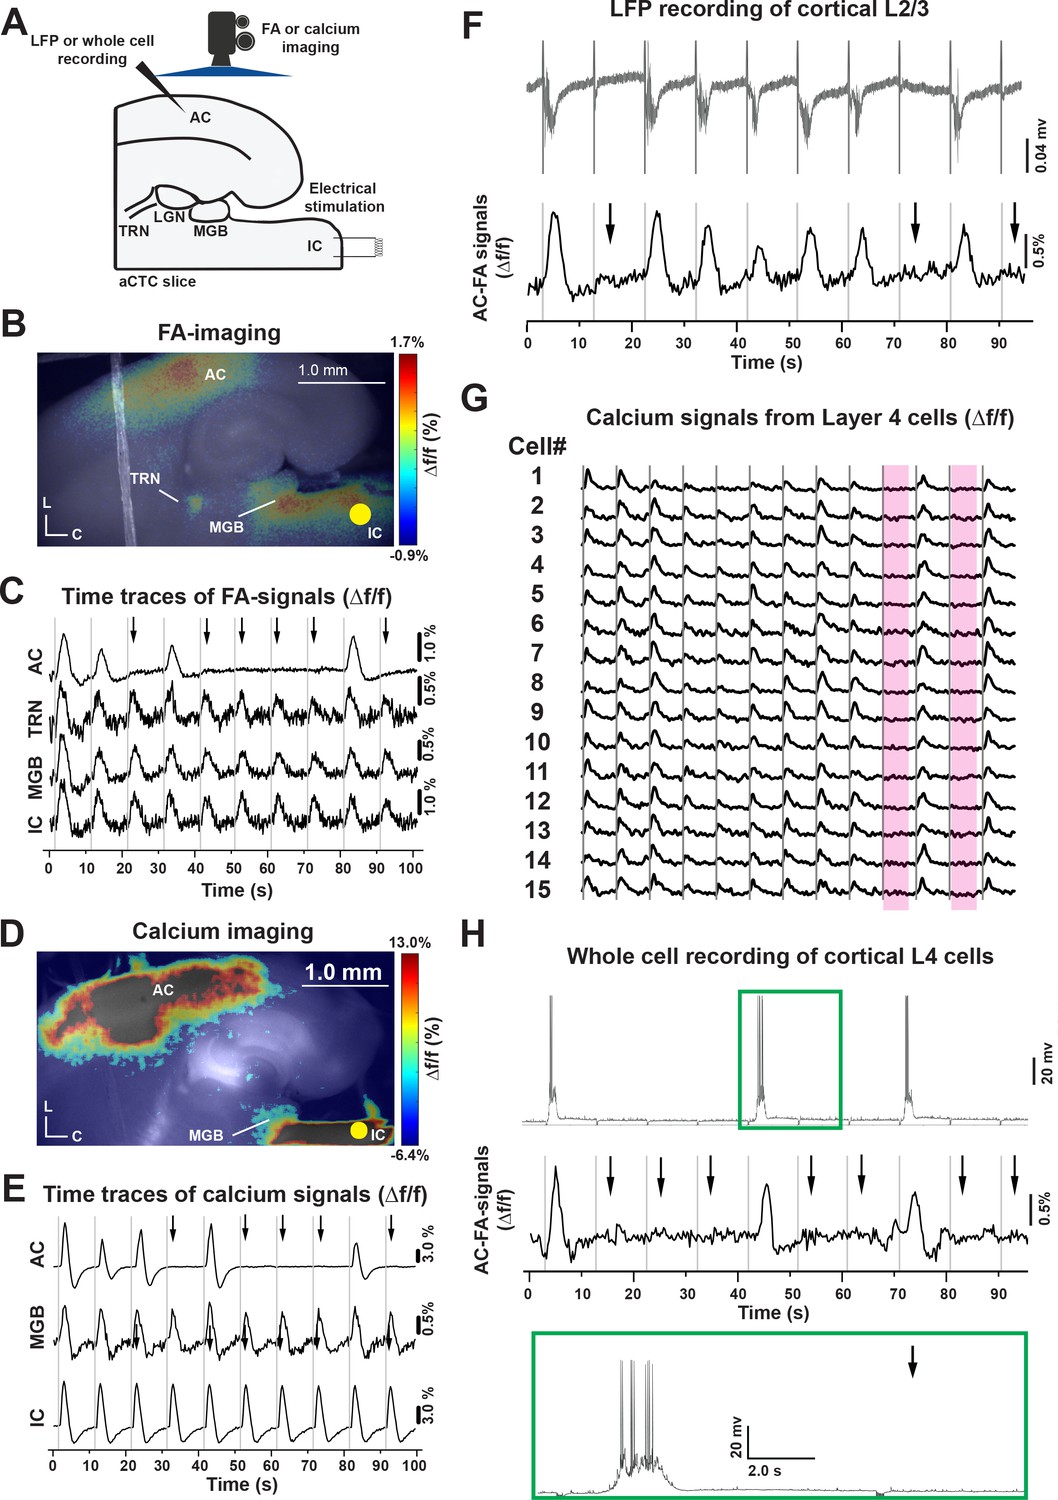
Stochastic auditory cortical responses to repeated electrical stimuli in vitro.
(A) A cartoon image showing the experimental design of simultaneous FA or calcium imaging and IC stimulation of the aCTC slice, which were also associated with LFP or whole-cell recording from cortical 3/4 layers in other experimental setups. (B and D) Pseudocolor images showing the neuronal activation indicated by evoked FA or calcium signals, respectively, in the IC, MGB, TRN, and AC following IC stimulation (nine animals). (C and E) The time series of Δf/f of evoked FA or calcium signals, respectively, in the IC, MGB, TRN, and AC following IC stimulation. (F) The time series of the L3/4 LFP signals (top panel) and Δf/f of the evoked cortical FA signals (bottom panel) following IC stimulation. (G) The time series of evoked calcium signals of a small population of layer 4 cells following IC stimulation, the two rose ribbons indicate the absence of neuronal activation following the IC stimulation during trial # 9 and 11. (H) The time series of layer four whole-cell recording (top panel) and the Δf/f of the evoked cortical FA signals (bottom panel) following IC stimulation, green box: The magnification of the post-stimulus activity of layer 4 cells showing evoked UP state associated with action potentials; Black arrows refer to the occurrence of population OFF cortical responses indicated by the absence of cortical FA or calcium signals as well as post-stimulus cortical LFP signals, gray vertical lines indicate the onset of IC stimulation, Yellow circle indicates the position of the electrical stimulation of the IC; aCTC: auditory colliculo-thalamocortical mouse brain slice, C: Caudal, L: Lateral.
-
Figure 2—source code 1
The main MATLAB code used to produce Figure 2B and D.
- https://cdn.elifesciences.org/articles/56645/elife-56645-fig2-code1-v2.zip
-
Figure 2—source code 2
The supplementary MATLAB code used to produce Figure 2B and D.
- https://cdn.elifesciences.org/articles/56645/elife-56645-fig2-code2-v2.zip
-
Figure 2—source data 1
Time traces of FA signals in Figure 2C.
- https://cdn.elifesciences.org/articles/56645/elife-56645-fig2-data1-v2.xlsx
-
Figure 2—source data 2
Time traces of calcium signals in Figure 2E.
- https://cdn.elifesciences.org/articles/56645/elife-56645-fig2-data2-v2.xlsx
-
Figure 2—source data 3
Time trace of FA signals in Figure 2F.
- https://cdn.elifesciences.org/articles/56645/elife-56645-fig2-data3-v2.xlsx
-
Figure 2—source data 4
Time traces of calcium signals in Figure 2G.
- https://cdn.elifesciences.org/articles/56645/elife-56645-fig2-data4-v2.xlsx
-
Figure 2—source data 5
Time traces of FA signals in Figure 2H.
- https://cdn.elifesciences.org/articles/56645/elife-56645-fig2-data5-v2.xlsx
Figure 2—figure supplement 1
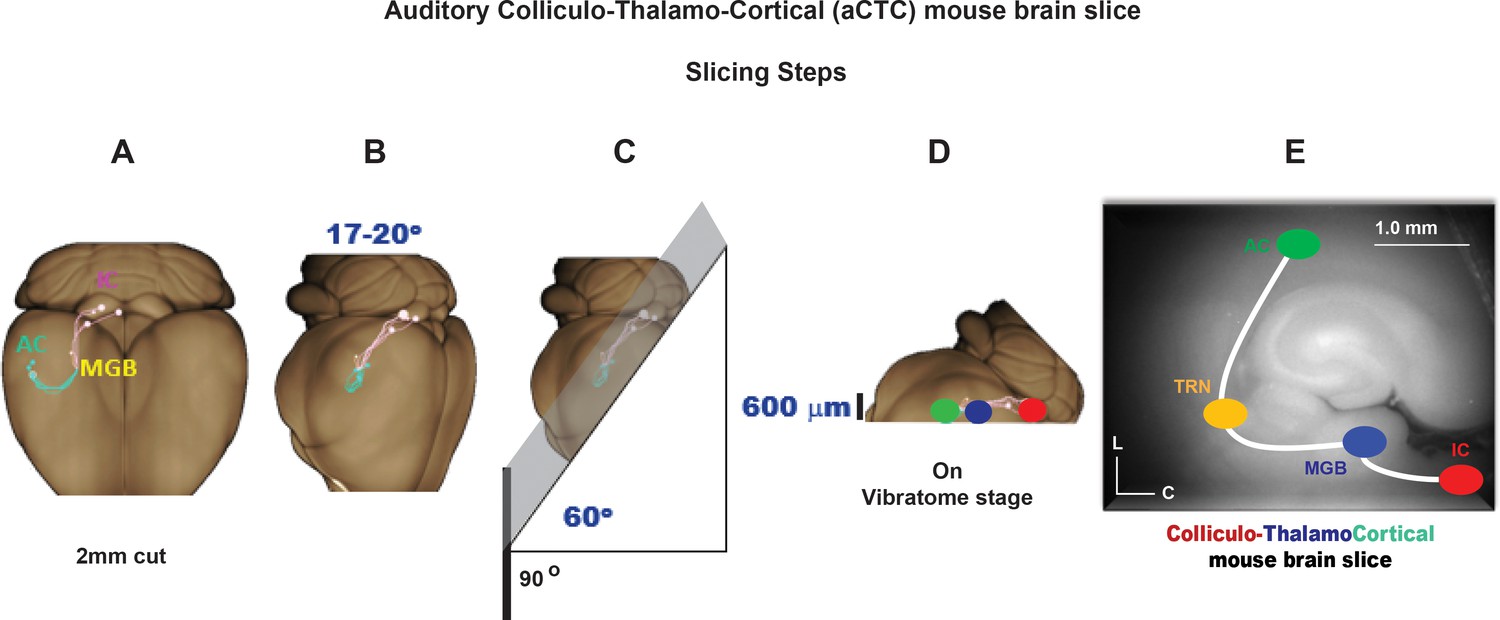
Slicing steps of aCTC mouse brain slice.
(A) The anterior 2 mm of the brain was cut to make the first platform. (B) The brain was lifted on its frontal aspect on the cut surface made by step A, then rotated at a 17–20o angle relative to the brain’s midline. (C) From the dorsal view, the brain was then cut at 60o angle relative to the base and perpendicular on the horizontal line to make the second platform. (D) The brain was lifted on the cut surface made by step C on the vibratome stage and cut as 600 µm slices. (E) The final look of aCTC slice should have IC, MGB, TRN, and AC in one plane.
Figure 2—figure supplement 2
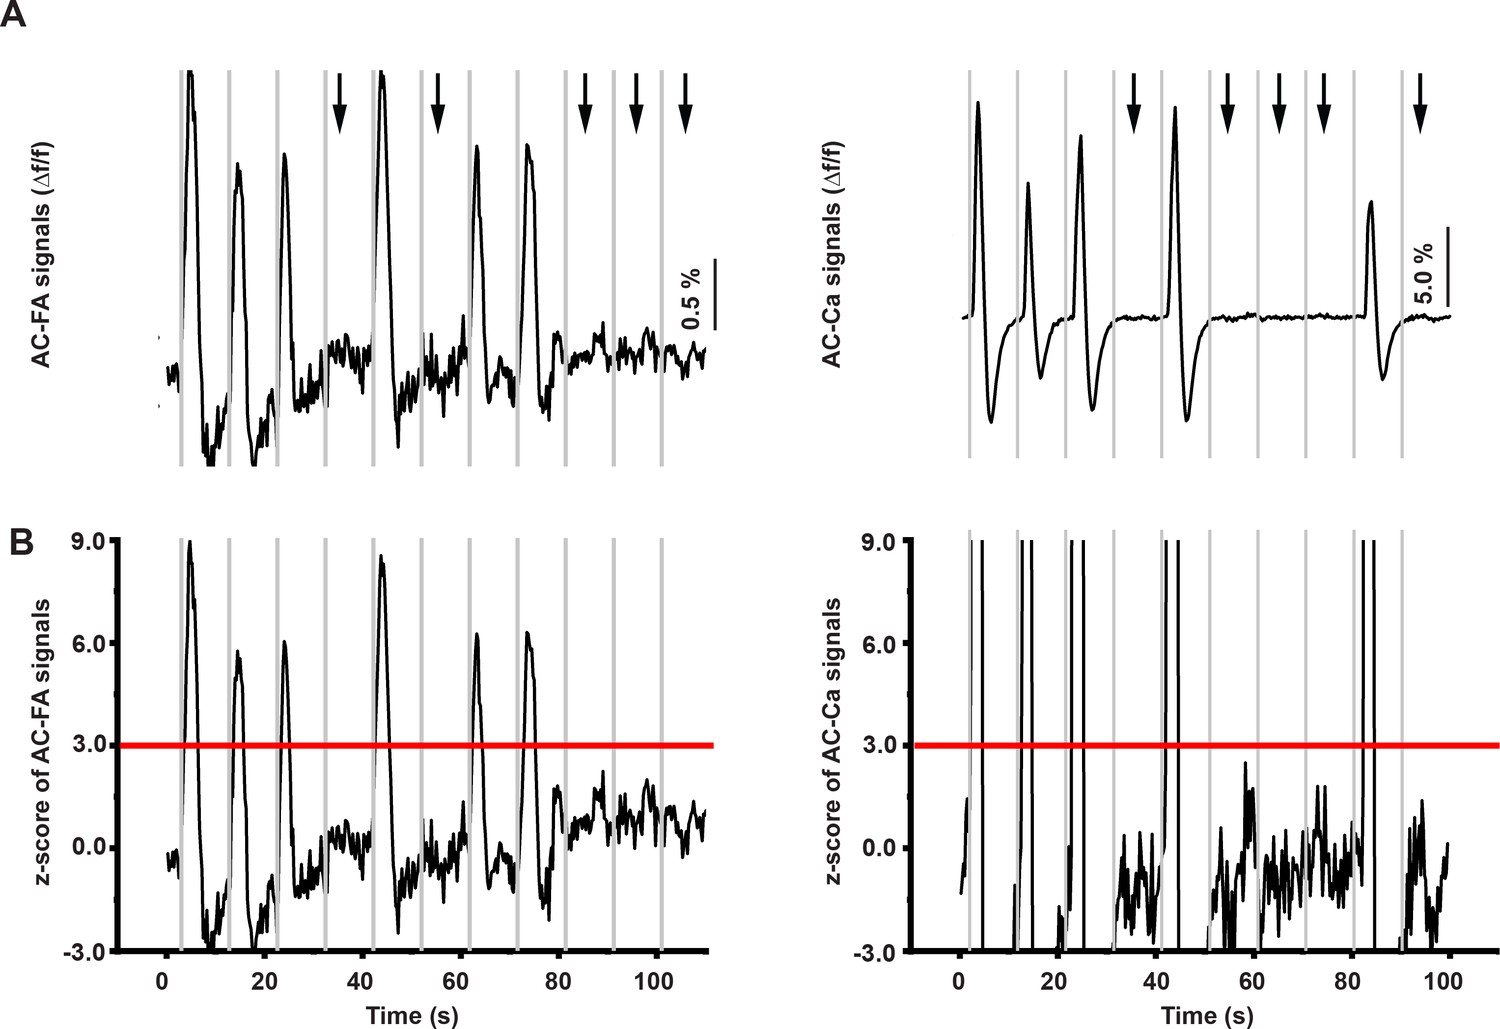
Determination of population ON cortical responses.
(A) The time series of cortical FA (left) and calcium signals (right). (B) A calculated z-score of the time series of cortical FA (left) and calcium signals (right). Black arrows refer to the occurrence of population OFF cortical responses indicated by the absence of cortical FA or calcium signals, gray vertical lines indicate the onset of IC stimulation, horizontal red line indicate the cutoff z-score at 3.
-
Figure 2—figure supplement 2—source data 1
Time traces of FA and calcium signals in Figure 2—figure supplement 2A.
- https://cdn.elifesciences.org/articles/56645/elife-56645-fig2-figsupp2-data1-v2.xlsx
Figure 2—figure supplement 3
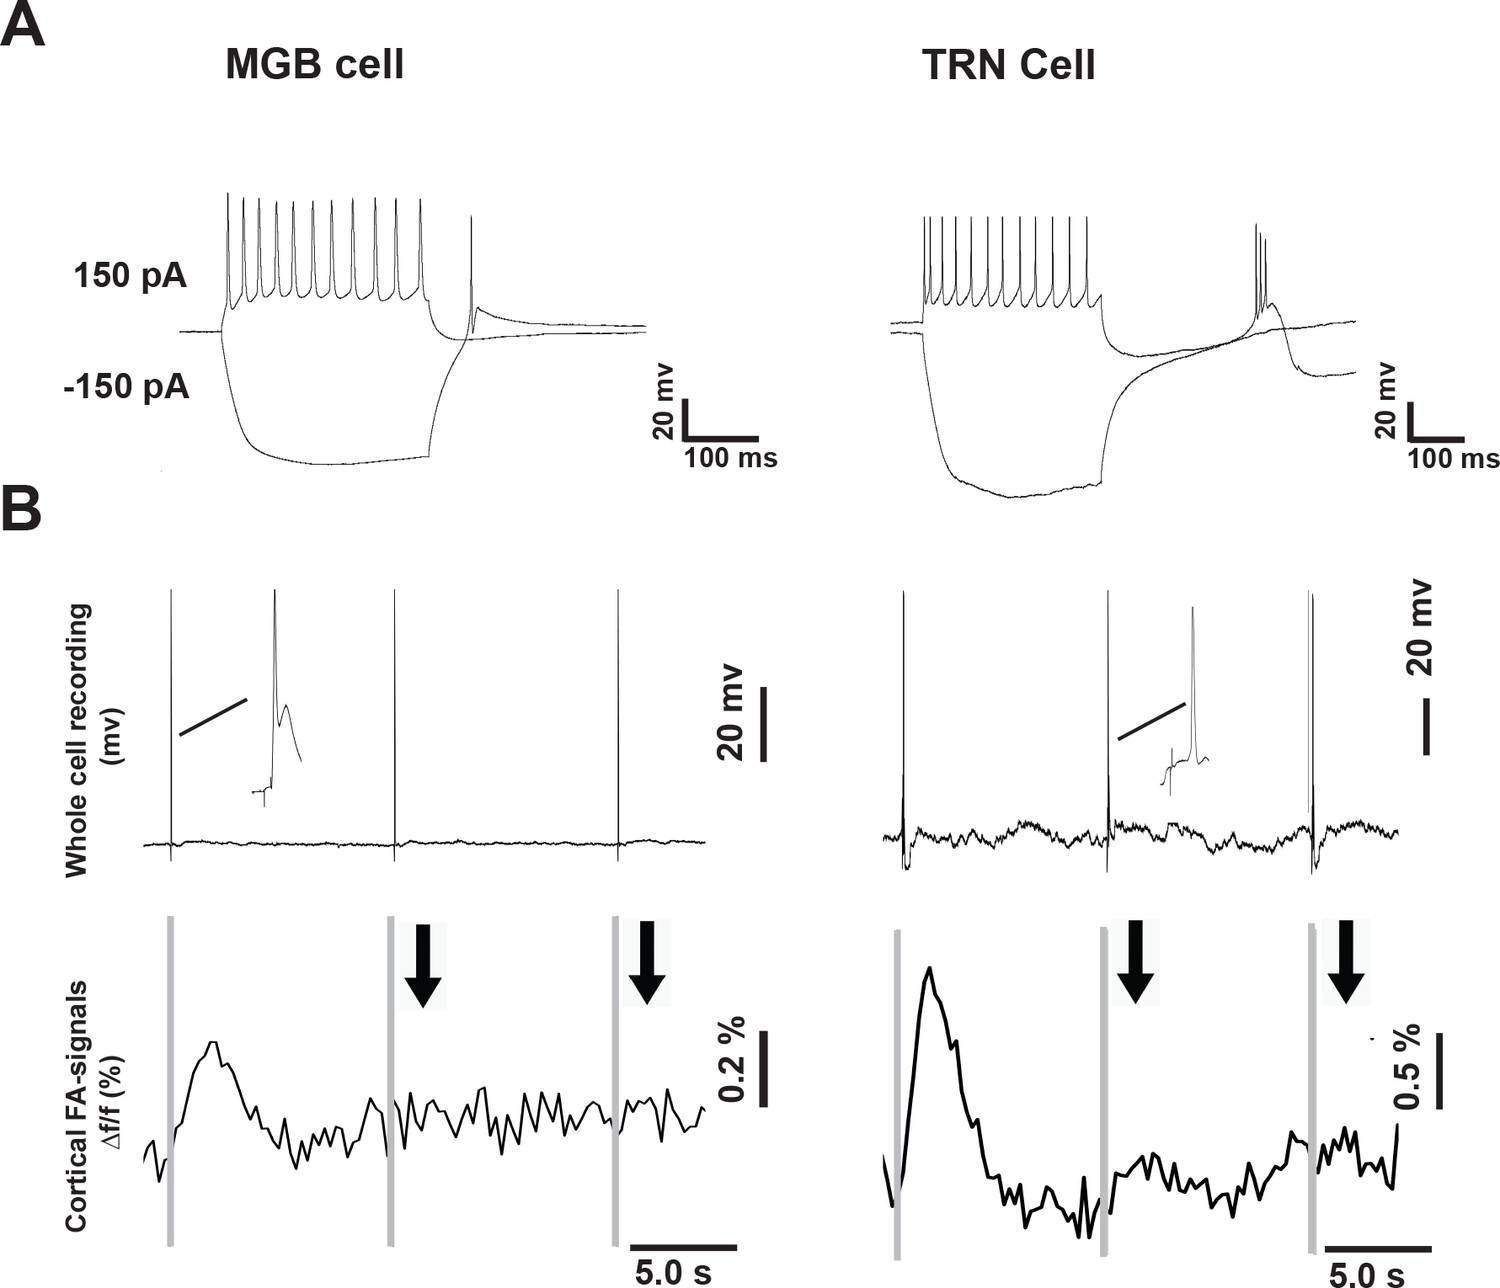
Whole-cell recording from MGB and TRN cells following the IC stimulation.
(A) Whole cell recording following the injection of depolarizing and hyperpolarizing current into the MGB and TRN cells. (B) The whole-cell recording (top) of MGB and TRN cells showing that both cells fire during population ON and population OFF- cortical responses as indicated by the cortical FA signals (bottom). Black arrows: indicate the occurrence of the OFF-cortical responses indicated by the absence of the FA signal, gray vertical lines indicate the onset of IC stimulation. The inset refers to the magnification of the post-stimulus activity of MGB and TRN cells, respectively, showing the evoked action potentials.
Figure 2—figure supplement 4
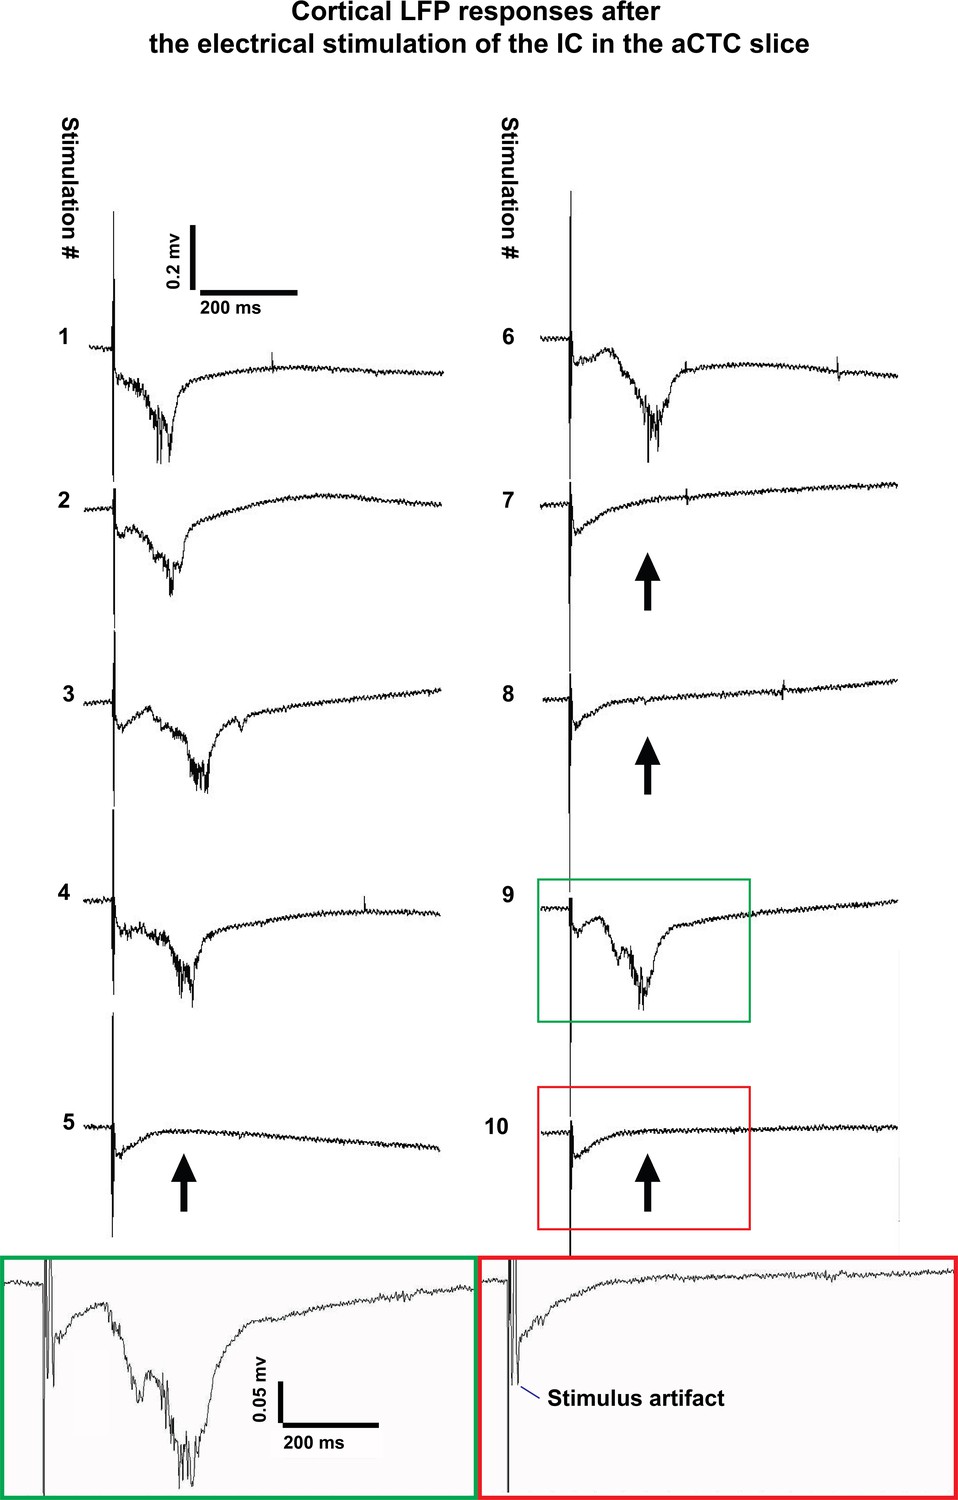
The occurrence of all-or-none cortical responses were not restricted to a particular experimental method.
LFP signals recorded from cortical L3/4 after 10 trials of IC stimulation in a different laboratory environment using isoflurane anesthesia and no transcardiac perfusion. Binary cortical responses (population ON vs. OFF) are still seen; Black arrows indicate the occurrence of the population OFF cortical response indicated by the absence of the evoked post stimulus LFP. Green and red boxes show magnified post-stimulus activity during population ON and population OFF cortical responses, respectively.
Figure 2—figure supplement 5
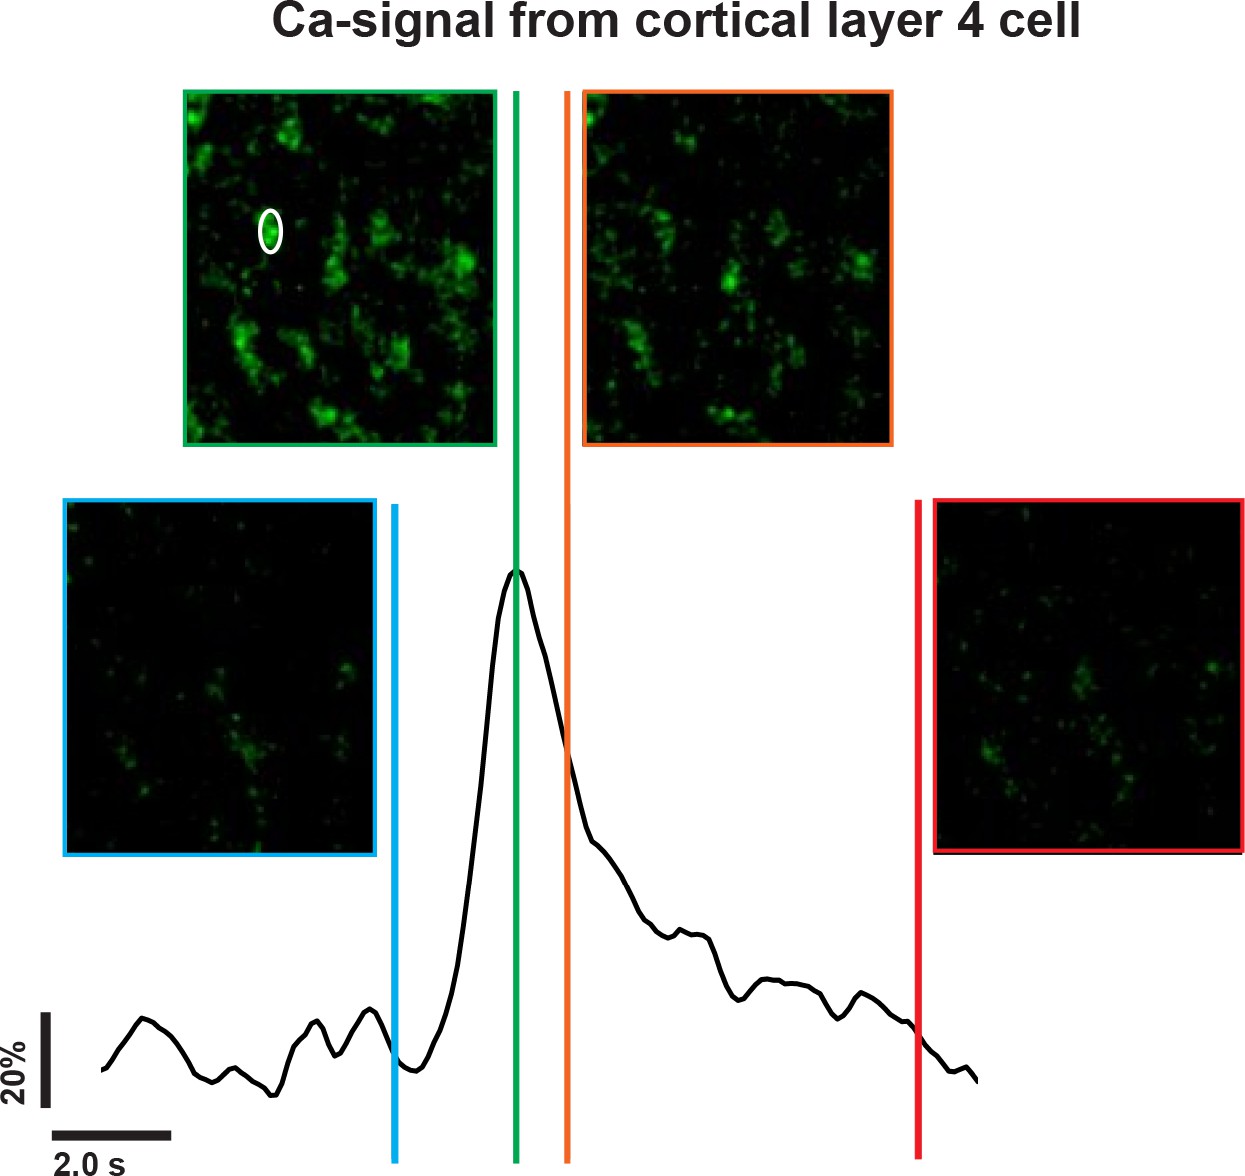
Calcium imaging from cortical layer 4 cells.
A time trace of the evoked calcium signal in one of the cortical layer 4 cells (White circle) following IC stimulation, which is correlated with the frames taken before the stimulation onset (blue line), at the peak of the calcium signal (green line), at the decay phase of the calcium signal (orange line), and at the post stimulus baseline (red line).
Figure 2—figure supplement 6
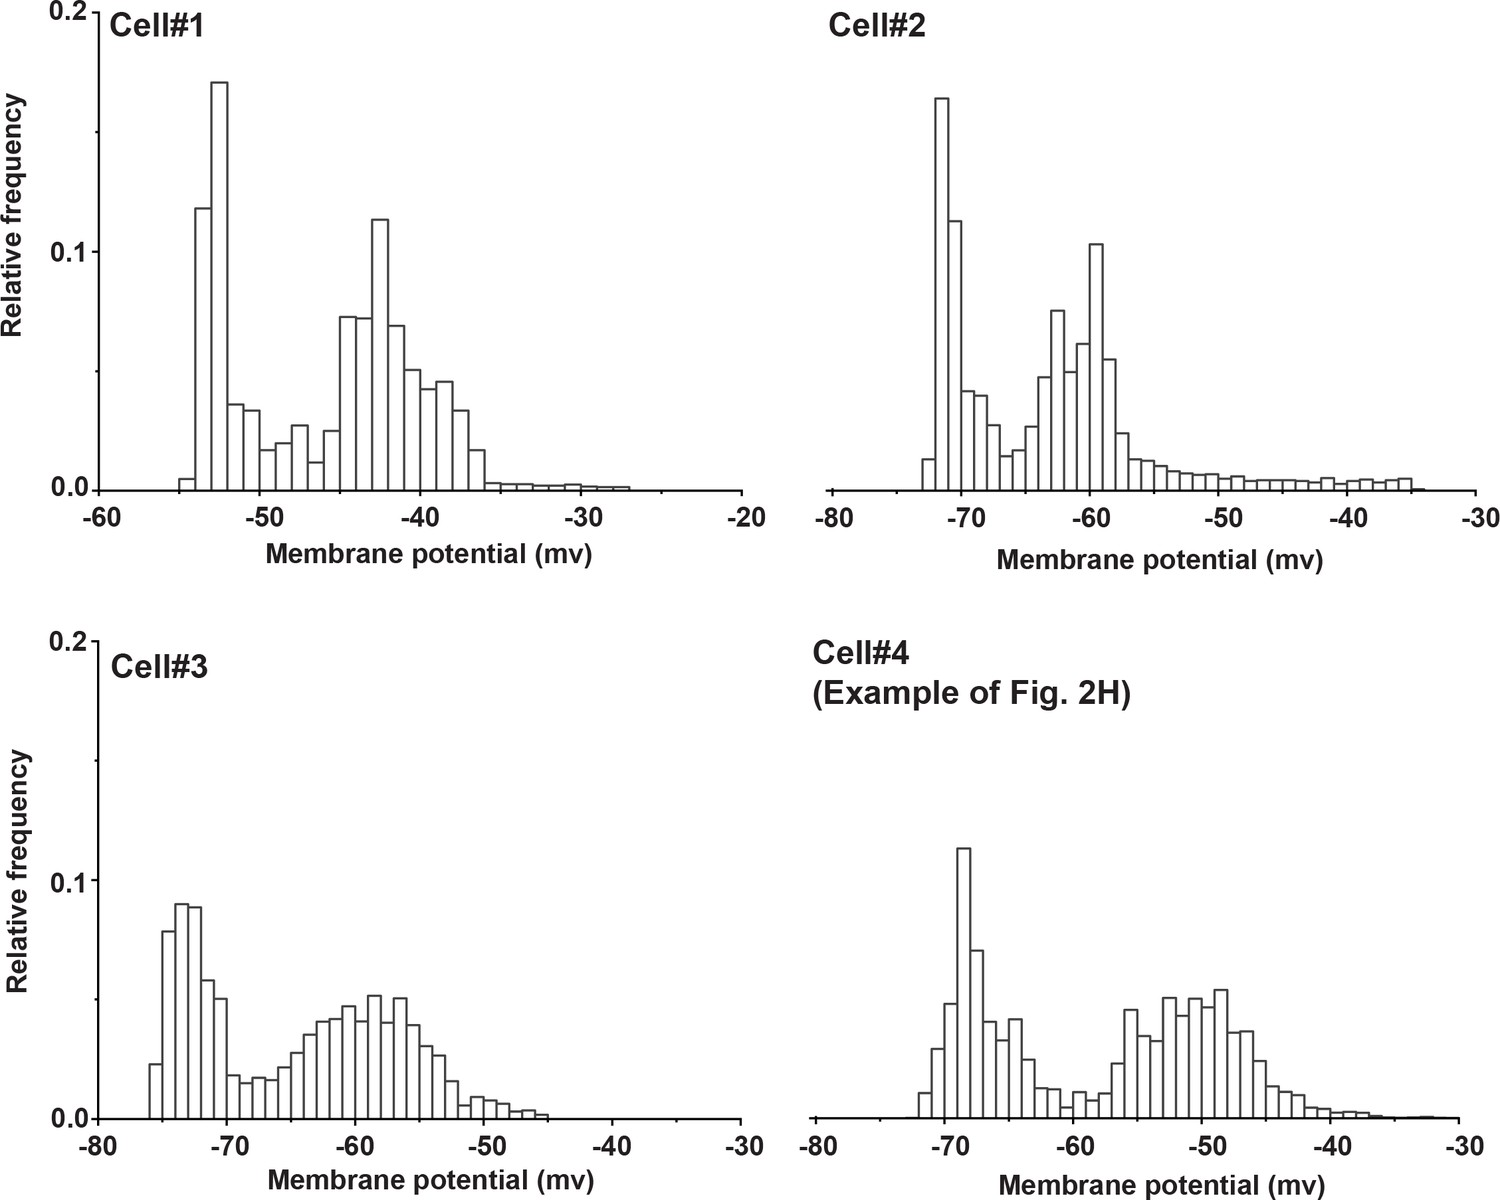
Bimodal distributions of voltages observed in cortical layer 4 cells after IC stimulation.
Probability density histograms showing the distribution of post stimulus membrane potentials of four cortical layer 4 cells following IC stimulation in the aCTC slice. Voltages were sampled at 0.5 ms. Spikes and stimulus artifacts were manually removed (bin size = 1 mV).
-
Figure 2—figure supplement 6—source data 1
Data values of Figure 2—figure supplement 6.
- https://cdn.elifesciences.org/articles/56645/elife-56645-fig2-figsupp6-data1-v2.xlsx
Figure 3

The effect of stimulation location and amplitude on the occurrence of OFF-cortical responses.
(A) Pseudocolor images of the evoked FA signals in aCTC slice after electrical stimulation of the IC, the MGB, or the subcortical white matter, respectively. (B) The time series of Δf/f of the evoked FA signals in AC, MGB, and IC following electrical stimulation of IC, MGB, or the subcortical white matter, respectively. (C) The time series of Δf/f of the evoked FA signals in AC, MGB, and IC following the stimulation of the IC with different stimulating current amplitudes. (D and E) Bar graphs showing the percentage of population ON cortical responses at different loci of stimulation and across different stimulating current amplitudes at the IC, respectively. (F) Line graphs showing the relationship between stimulating current amplitude and Δf/f of FA signals from IC (top), MGB (middle), and AC (bottom), respectively; Black arrows refer to the missing cortical responses (‘population OFF’ responses) indicated by the absence of cortical FA, vertical gray lines indicate the onset of IC stimulation, and yellow circles indicate the position of the electrical stimulation; sWM: subcortical white matter.
-
Figure 3—source code 1
The main MATLAB code used to produce Figure 3A.
- https://cdn.elifesciences.org/articles/56645/elife-56645-fig3-code1-v2.zip
-
Figure 3—source code 2
The supplementary MATLAB code used to produce Figure 3A.
- https://cdn.elifesciences.org/articles/56645/elife-56645-fig3-code2-v2.zip
-
Figure 3—source data 1
Time traces of FA signals in Figure 3B.
- https://cdn.elifesciences.org/articles/56645/elife-56645-fig3-data1-v2.xlsx
-
Figure 3—source data 2
Data values of Figure 3D.
- https://cdn.elifesciences.org/articles/56645/elife-56645-fig3-data2-v2.xlsx
-
Figure 3—source data 3
Time traces of FA signals in Figure 3C.
- https://cdn.elifesciences.org/articles/56645/elife-56645-fig3-data3-v2.xlsx
-
Figure 3—source data 4
Data values of Figure 3E.
- https://cdn.elifesciences.org/articles/56645/elife-56645-fig3-data4-v2.xlsx
-
Figure 3—source data 5
Data values of Figure 3F.
- https://cdn.elifesciences.org/articles/56645/elife-56645-fig3-data5-v2.xlsx
Figure 4 with 1 supplement
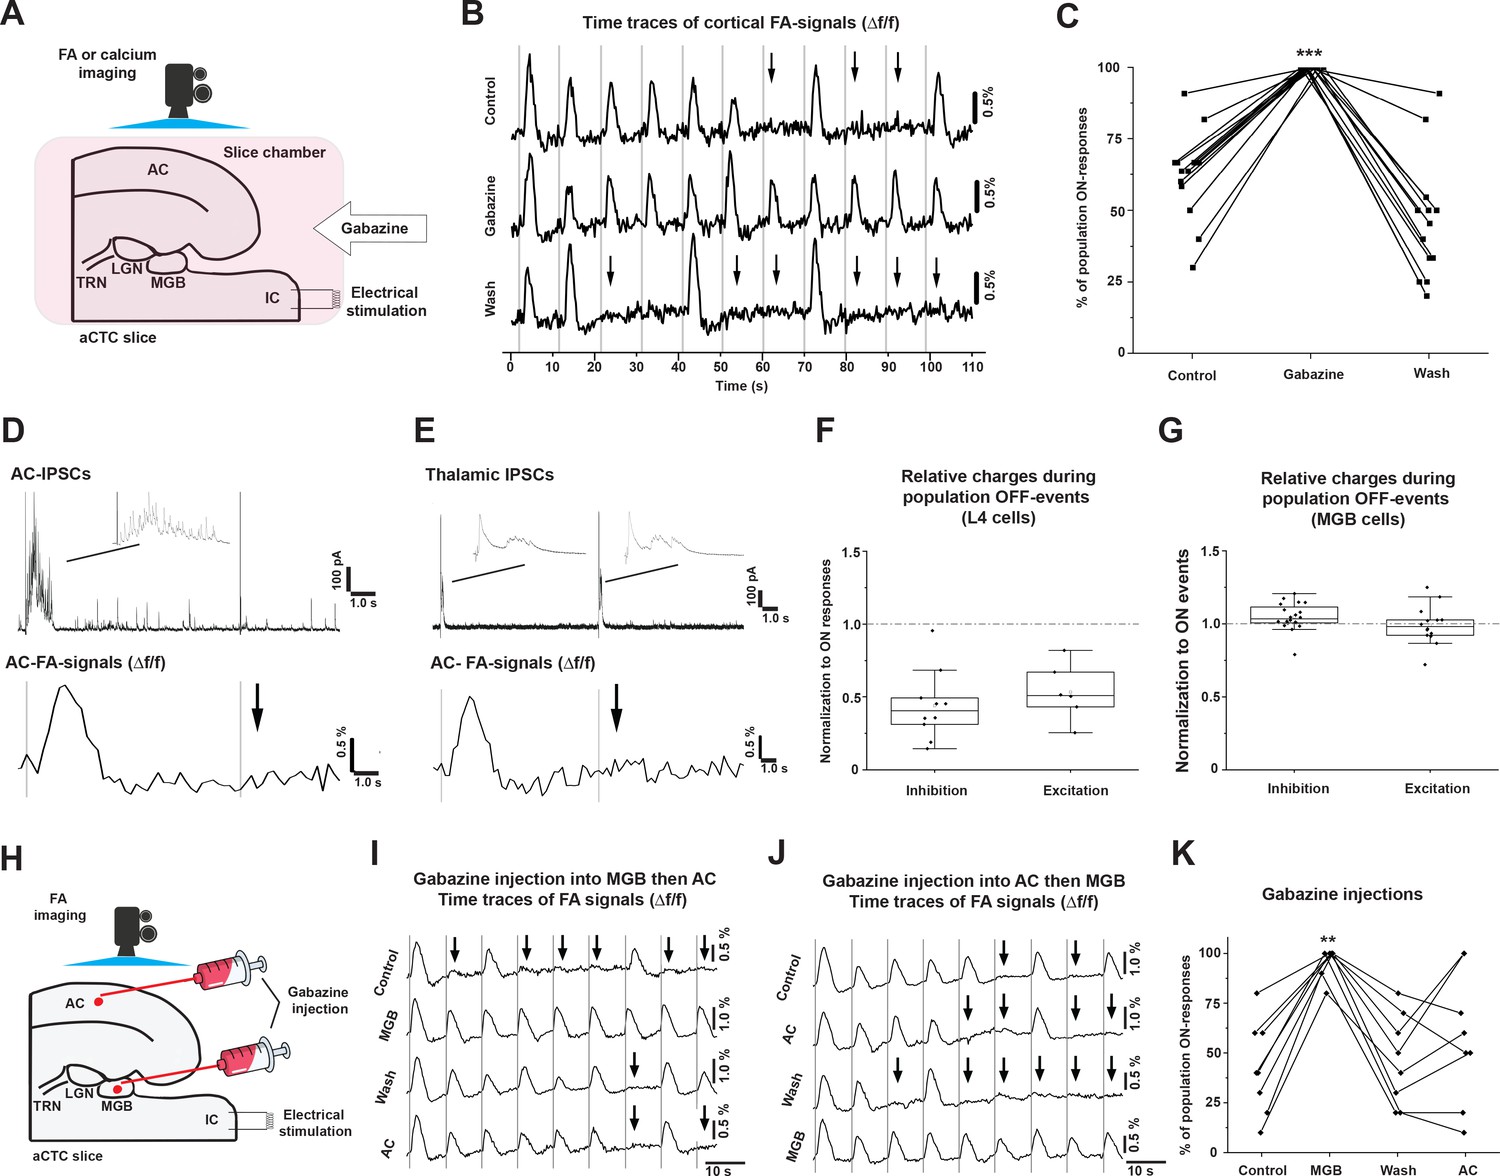
The population OFF cortical responses are driven by MGB inhibition.
(A) A cartoon image showing the experimental design of simultaneous FA imaging and IC stimulation as well as gabazine perfusion. (B) The time series of Δf/f of the evoked cortical FA signals with ACSF (control, top trace), with gabazine (middle trace), or wash by ACSF (bottom trace). (C) A plot of the results showing that the percentage of population ON cortical responses was significantly higher than that of control and wash. (D) Evoked post-stimulus IPSCs recorded from layer 4 cells (top panel), and the Δf/f of the evoked cortical FA responses (bottom panel) following the IC stimulation. (E) Evoked post-stimulus IPSCs recorded from MGB cells (top panel), and the Δf/f of the evoked cortical FA responses (bottom panel) following the IC stimulation. (F and G) Scatterplots of the area under the curve (AUC) of the evoked post-stimulus IPSCs and EPSCs recorded from AC or MGB, respectively, during population OFF cortical responses and normalized against those recorded during population ON cortical events. (H) A cartoon image showing the experimental design of simultaneous FA imaging, IC stimulation, and selective gabazine injection into MGB or AC using a picospritzer. (I and J) The time series of Δf/f of the evoked cortical FA signals during a counterbalanced gabazine injection starting into MGB then AC or AC then MGB, respectively. (K) A plot of the results showing that the percentage of population ON cortical responses were significantly higher after the injection of gabazine into MGB; Black arrows refer to the occurrence of population OFF cortical responses indicated by the absence of the cortical FA signals; Vertical gray lines indicate the onset of IC stimulation; IPSCs: Inhibitory postsynaptic currents, and EPSCs: Excitatory postsynaptic currents.
-
Figure 4—source data 1
Time traces of FA signals in Figure 4B.
- https://cdn.elifesciences.org/articles/56645/elife-56645-fig4-data1-v2.xlsx
-
Figure 4—source data 2
Data values of Figure 4C.
- https://cdn.elifesciences.org/articles/56645/elife-56645-fig4-data2-v2.xlsx
-
Figure 4—source data 3
Data values of Figure 4F.
- https://cdn.elifesciences.org/articles/56645/elife-56645-fig4-data3-v2.xlsx
-
Figure 4—source data 4
Data vaues of Figure 4G.
- https://cdn.elifesciences.org/articles/56645/elife-56645-fig4-data4-v2.xlsx
-
Figure 4—source data 5
Time traces of FA signals in Figure 4I.
- https://cdn.elifesciences.org/articles/56645/elife-56645-fig4-data5-v2.xlsx
-
Figure 4—source data 6
Time traces of FA signals in Figure 4J.
- https://cdn.elifesciences.org/articles/56645/elife-56645-fig4-data6-v2.xlsx
-
Figure 4—source data 7
Data values of Figure 4K.
- https://cdn.elifesciences.org/articles/56645/elife-56645-fig4-data7-v2.xlsx
Figure 4—figure supplement 1
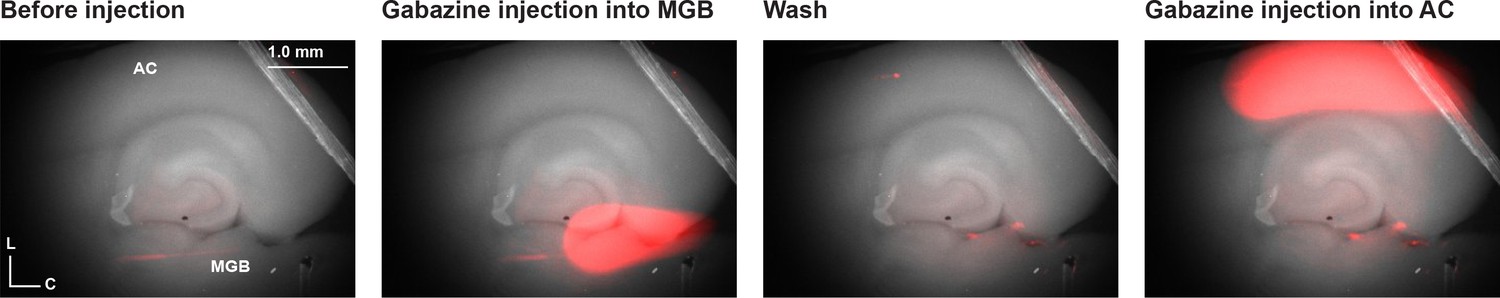
The injection of gabazine into MGB and AC.
Series of images of the aCTC slice before injection, during the injection of gabazine into the MGB indicated by Alexa Fluor-594, after washing, and during the injection of gabazine into the AC indicated by Alexa Fluor-594 within the pipette.
Figure 5 with 1 supplement
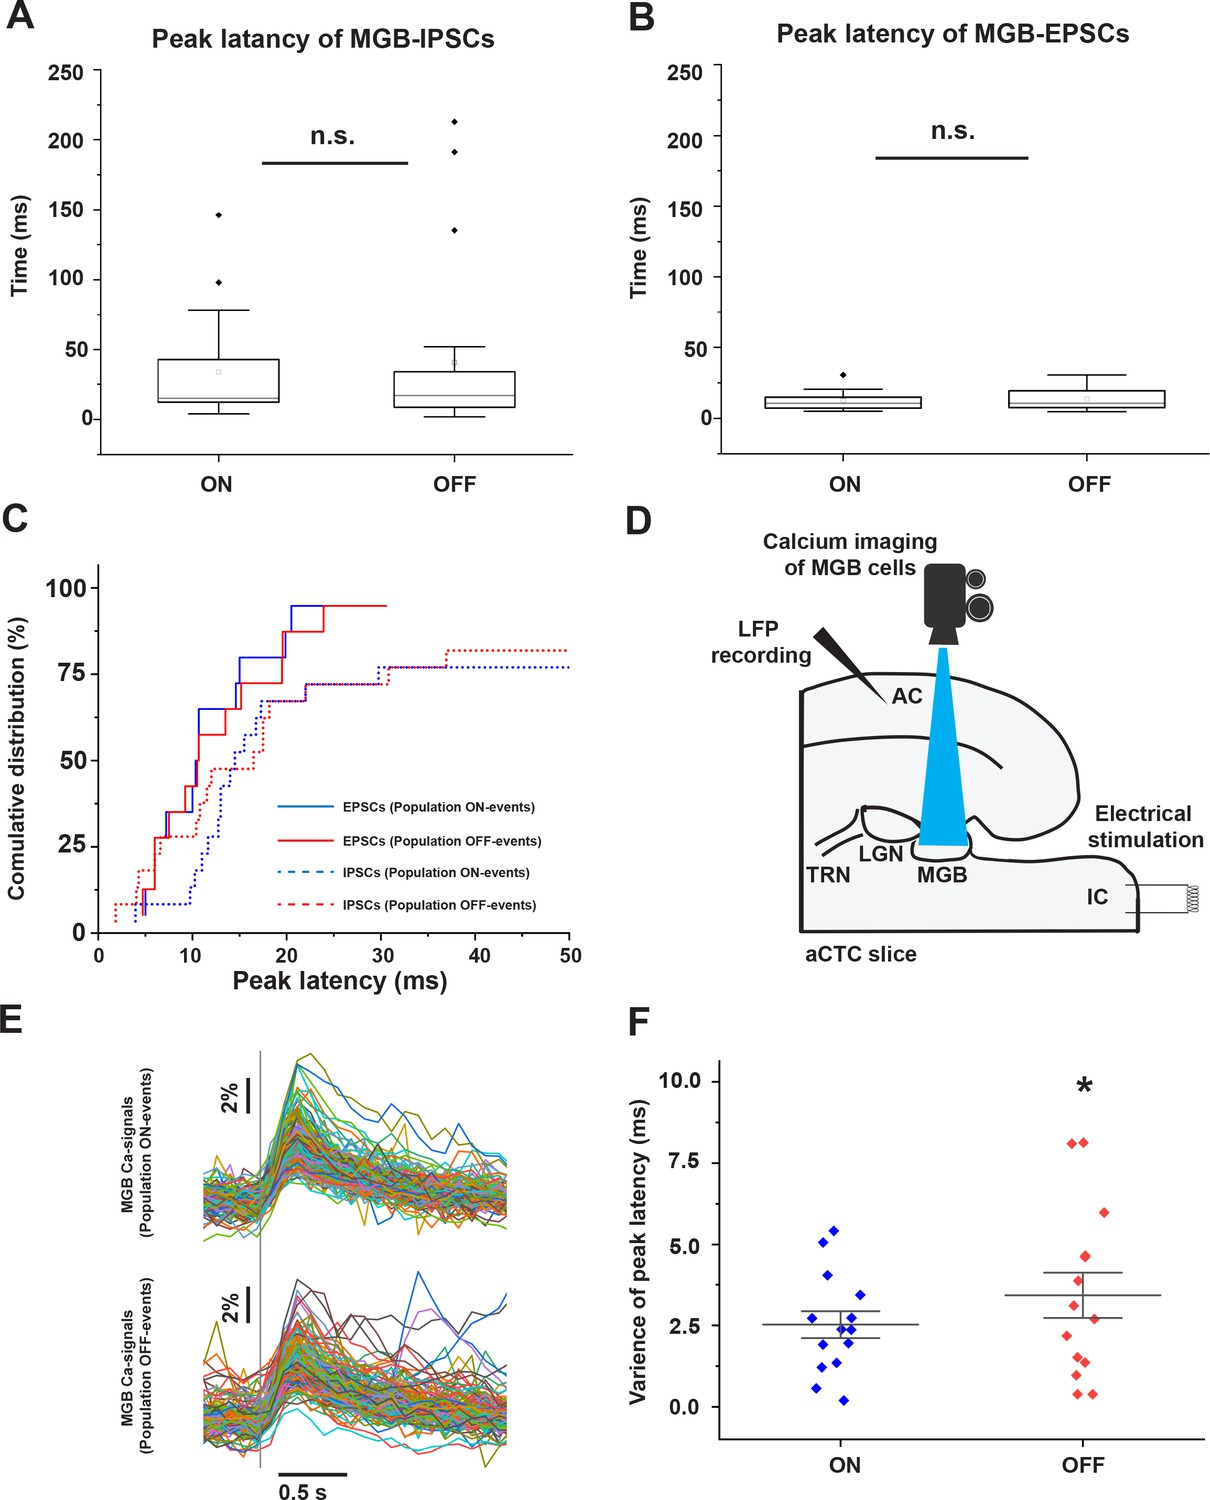
Desynchronized MGB cellular activity is associated with population OFF-cortical responses.
(A and B) Plots of peak latencies of IPSCs (A) and EPSCs (B) measured in the MGB after IC stimulation. No difference was seen in the mean latency during population ON vs. OFF responses. (C) Cumulative distribution functions of the peak latencies of IPSCs (dotted line) and EPSCs (solid line) during population ON (blue line) or population OFF-cortical responses (red line) showing that ~50% of MGB cells received earlier IPSCs during population OFF cortical responses (red dotted line). (D) A cartoon image showing the experimental design of simultaneous calcium imaging of MGB, LFP recording form the cortex, and the IC stimulation. (E) The sweeps of the evoked calcium signals of all activated cells during population ON (top) vs. population OFF (bottom) cortical responses indicated by the post-stimulus cortical LFP signals recorded from L3/4. (F) A scatterplot showing a higher variance of the peak latencies of MGB cells activated during population OFF cortical response compared to those activated during population ON cortical responses. Vertical gray line indicates the onset of IC stimulation.
-
Figure 5—source data 1
Data values of Figure 5A-C.
- https://cdn.elifesciences.org/articles/56645/elife-56645-fig5-data1-v2.xlsx
-
Figure 5—source data 2
Time traces of calcium signals in Figure 5E.
- https://cdn.elifesciences.org/articles/56645/elife-56645-fig5-data2-v2.xlsx
-
Figure 5—source data 3
Data values of Figure 5F.
- https://cdn.elifesciences.org/articles/56645/elife-56645-fig5-data3-v2.xlsx
Figure 5—figure supplement 1
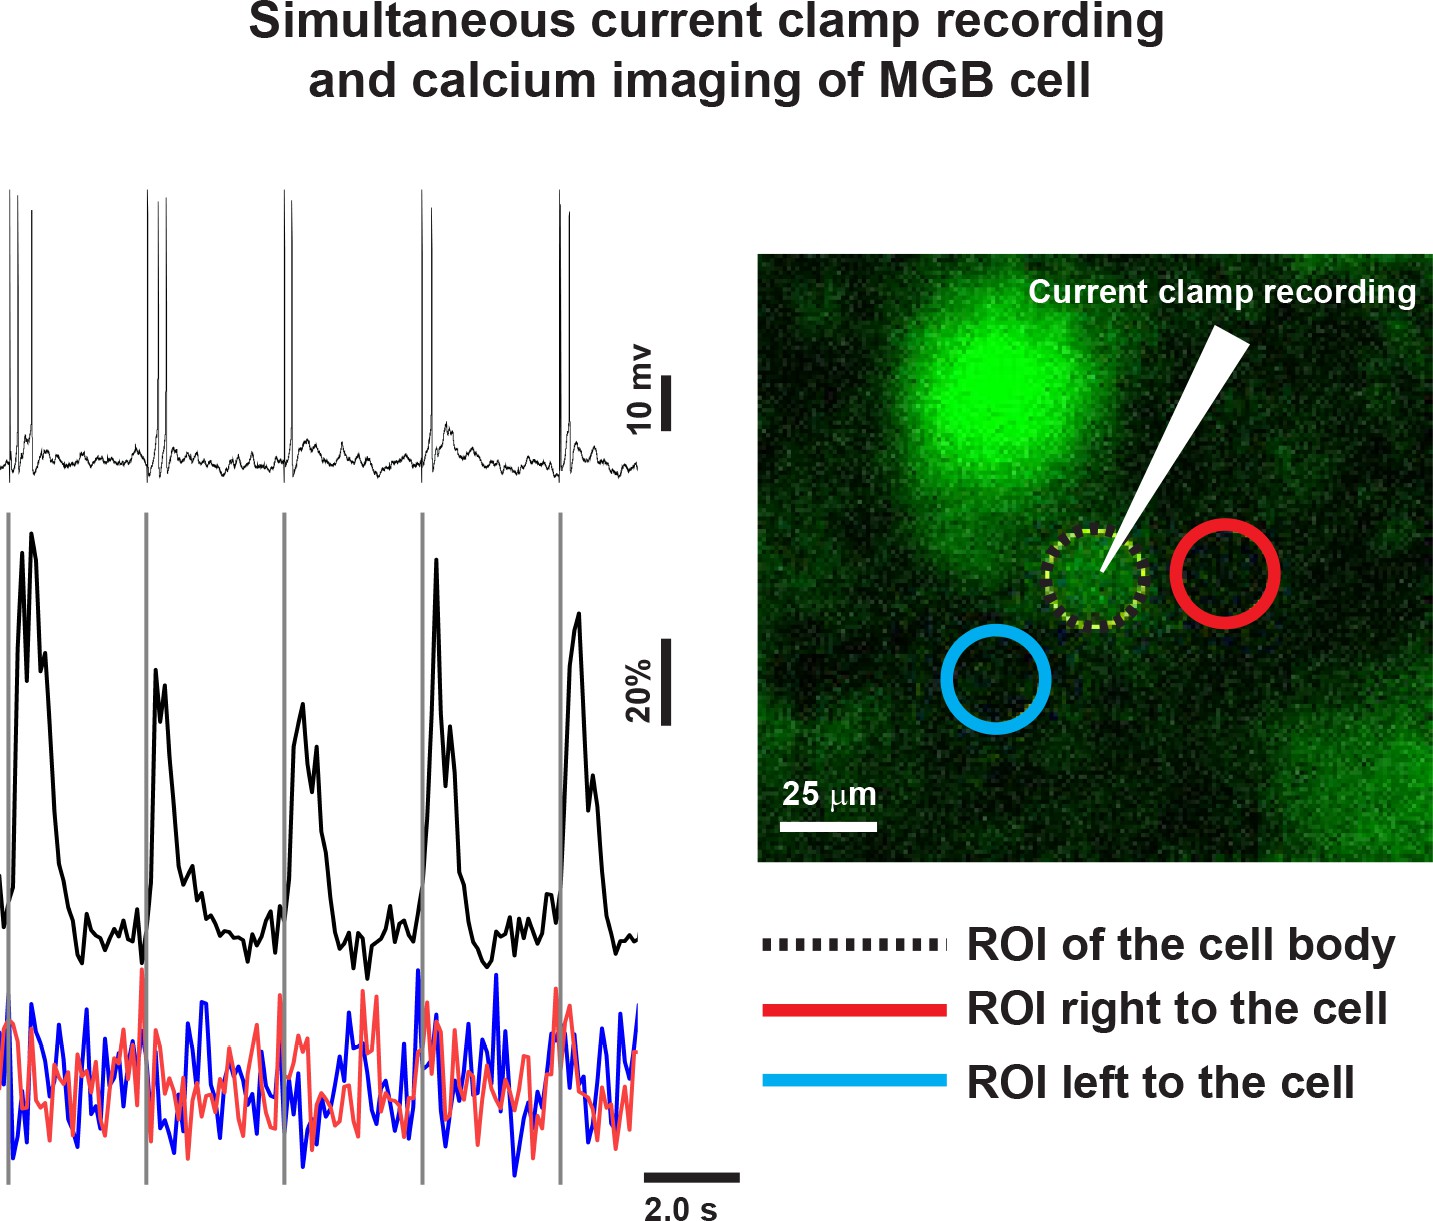
Calcium imaging from MGB cells.
Top Left: A time series of the whole-cell recording of the MGB cell (right image) containing CAL-520 dye; Bottom left: The correlated time series of the calcium signals obtained from the cell (black line and dotted black/white circle [right image]) and two regions adjacent to the cell (red and blue lines and circles [right image]).
Figure 6 with 2 supplements
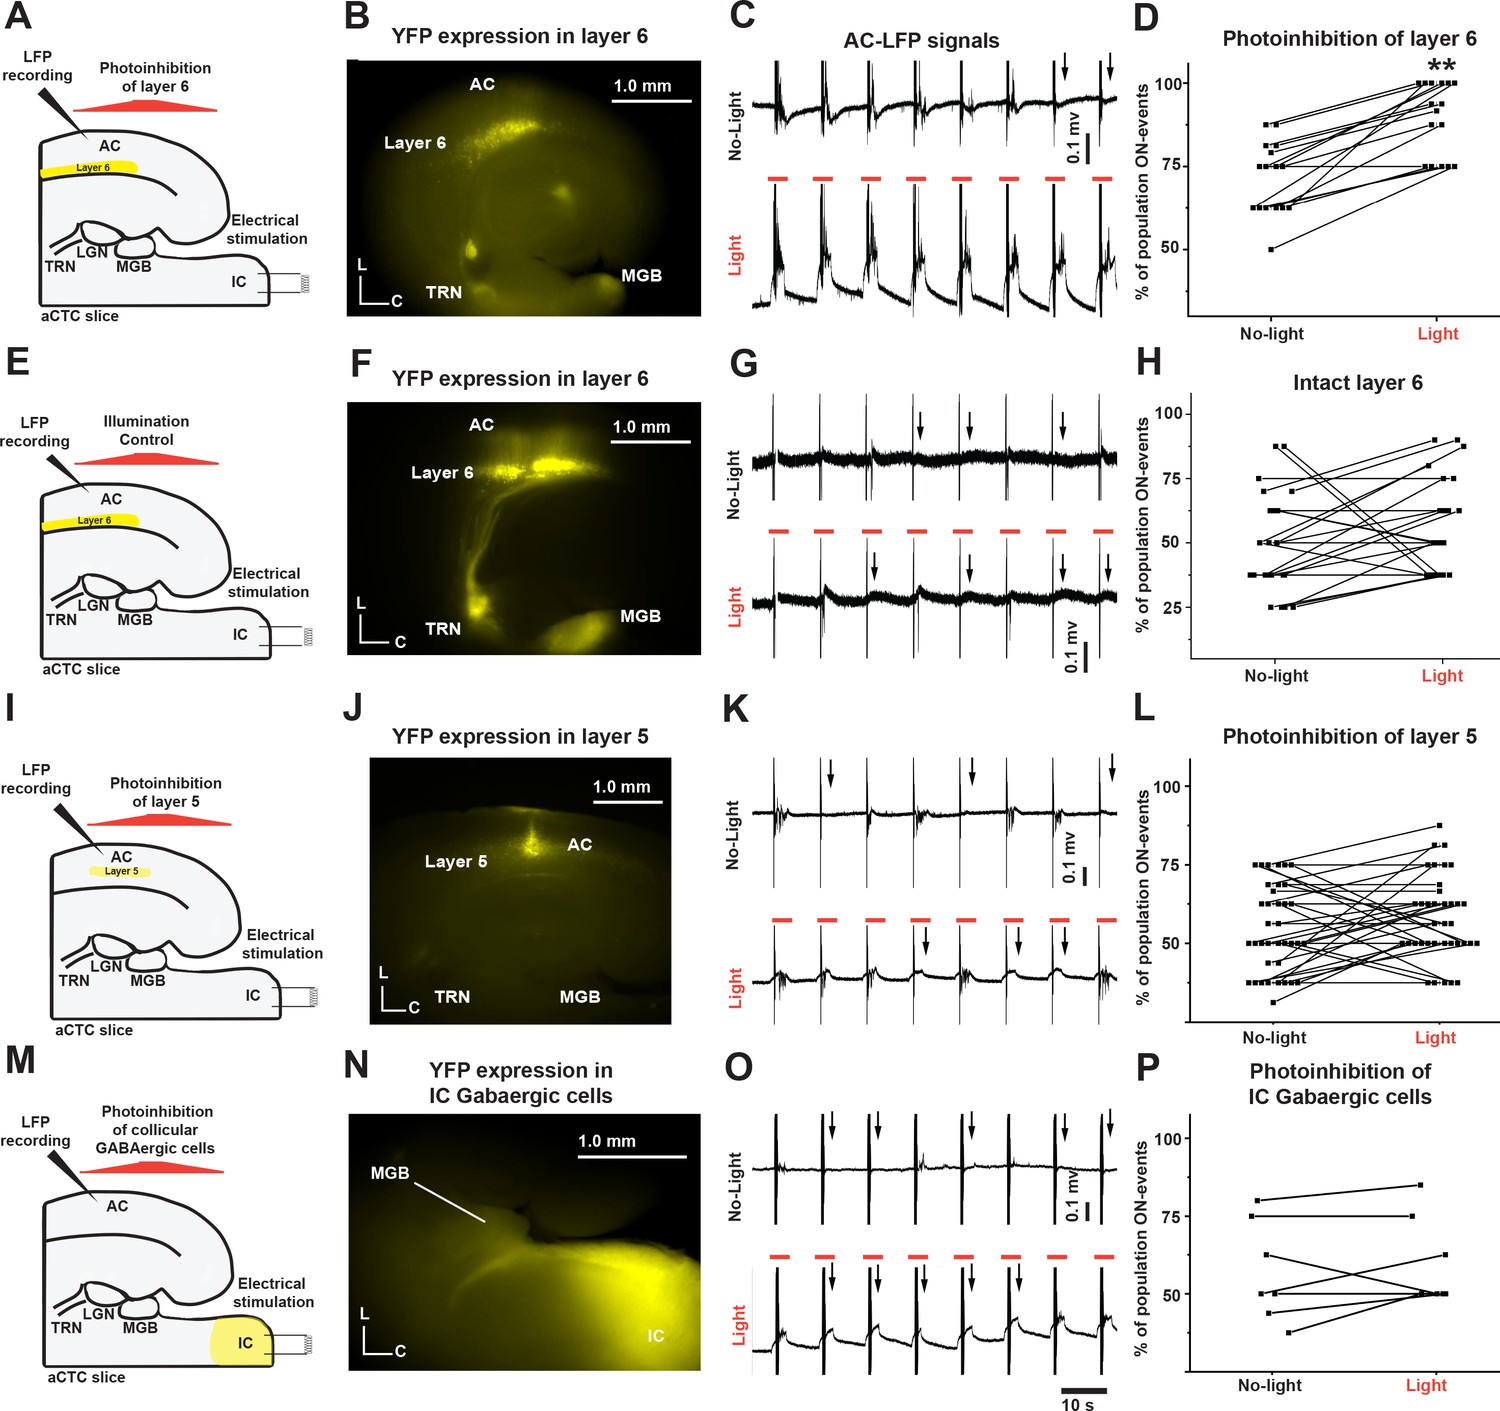
The population OFF cortical responses were driven by the feedback inhibition of MGB by corticothalamic layer six via TRN.
(A and E) Cartoon images showing the experimental design of simultaneous IC stimulation, LFP recording, and photoinhibition for aCTC slice with and without eNpHR3.0 receptors, respectively. (B and F) Images of aCTC slice of NTSR1-Cre mouse showing the expression of eNpHR3.0 receptors as indicated by YFP tag and YFP only, respectively, in NTSR1-positive corticothalamic layer 6 cells as well as their projections to TRN and MGB. (C, G, K and O) The time series of the post-stimulus cortical LFP signals from L3/4 following IC stimulation without (top panel) and with 565 nm light (bottom panel). (D) A scatterplot of percent population ON responses pre- and post-light application showing that the percentage of population ON cortical events was higher during the photoinhibition of corticothalamic layer 6 cells. (H) A scatterplot of percent population ON responses pre- and post-light application showing that the illumination of the aCTC slice expressing no inhibitory opsin with 565 nm light could not retrieve the population ON cortical responses. (I) A cartoon image showing the experimental design of simultaneous IC stimulation, LFP recording, and photoinhibition of layer 5 cells (J) Image of aCTC slice of RBP4-Cre mouse showing the expression of eNpHR3.0 receptors as indicated by YFP tag in RBP4-positive layer 5 cells. (L) A scatterplot of percent population ON responses pre- and post-light application showing that the photoinhibition of layer 5 cells could not retrieve the population ON cortical responses. (M) A cartoon image showing the experimental design of simultaneous IC stimulation, LFP recording, and photoinhibition of IC GABAergic cells (N) Image of aCTC slice from GAD2-Cre mouse showing the Cre-dependent expression of halorhodopsin indicated by YFP tag in GABAergic cells of the IC as well as their projections to MGB. (P) A scatterplot of the percentage of cortical population ON responses showing no change after the photoinhibition of IC GABAergic cells by light; Black arrows refer to the occurrence of population OFF cortical responses indicated by the absence of post-stimulus cortical LFP signals from L3/4; Vertical gray lines indicate the onset of IC stimulation; Orange lines indicate the time period of illumination (3 s).
-
Figure 6—source data 1
Data values of Figure 6D.
- https://cdn.elifesciences.org/articles/56645/elife-56645-fig6-data1-v2.xlsx
-
Figure 6—source data 2
Data values of Figure 6H.
- https://cdn.elifesciences.org/articles/56645/elife-56645-fig6-data2-v2.xlsx
-
Figure 6—source data 3
Data values of Figure 6L.
- https://cdn.elifesciences.org/articles/56645/elife-56645-fig6-data3-v2.xlsx
-
Figure 6—source data 4
Data values of Figure 6P.
- https://cdn.elifesciences.org/articles/56645/elife-56645-fig6-data4-v2.xlsx
Figure 6—figure supplement 1
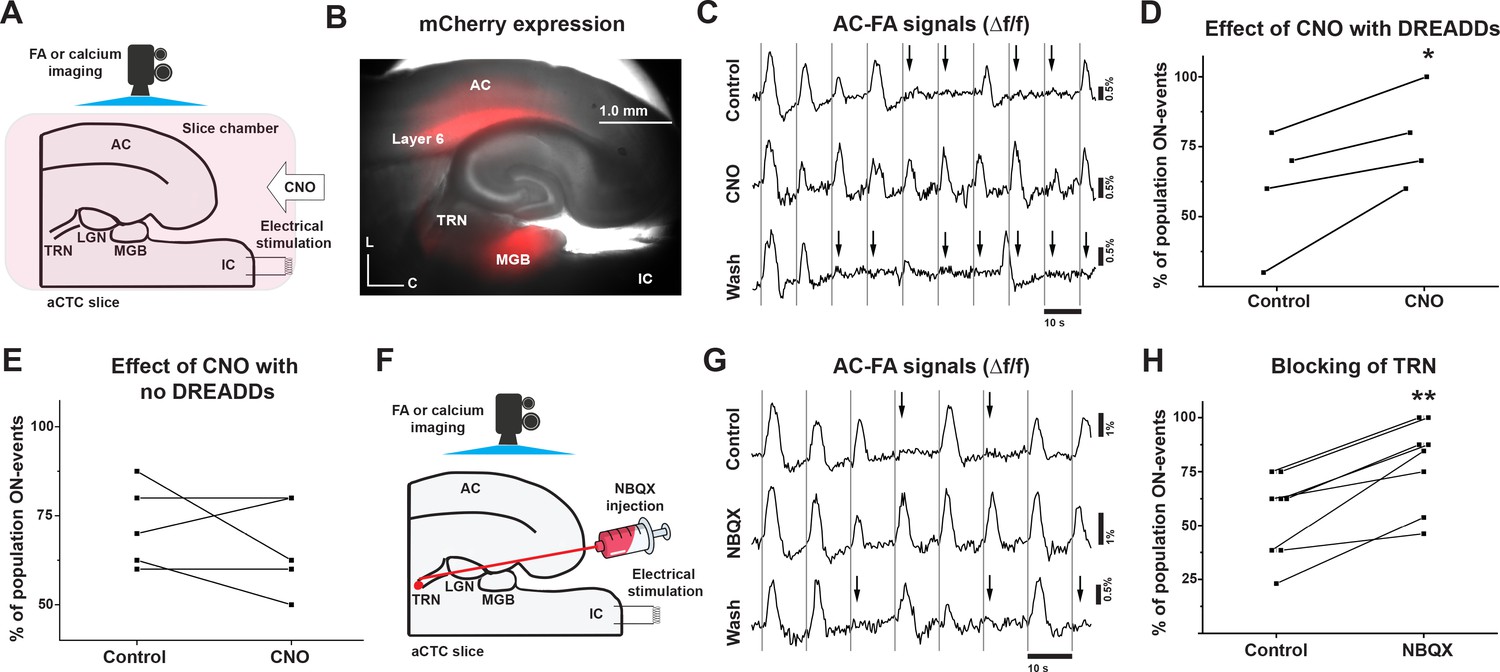
Chemical inhibition of corticothalamic layer 6 cells and TRN blocking retrieved the missing cortical responses.
(A) A cartoon image showing the experimental design of simultaneous FA imaging and IC stimulation as well as CNO perfusion. (B) Image of aCTC slice of NTSR1-Cre mouse showing the expression of hM4Di receptors as indicated by m-Cherry tag in NTSR1-positive corticothalamic layer 6 cells as well as their projections to TRN and MGB. (C) The time series of Δf/f of the evoked cortical FA signals during the perfusion of ACSF (top trace) and CNO (middle trace) then wash (bottom trace). (D) A scatterplot of the probability of population ON cortical events showed that the probability of a population ON response was higher during the chemical inhibition of corticothalamic layer 6 cells by CNO compared to the control. (E) A scatterplot of the percentage of population ON cortical events showing that the perfusion of CNO to the aCTC slice expressing no hM4Di receptors could not retrieve the ON-cortical responses. (F) A cartoon image showing the experimental design of simultaneous IC stimulation, FA imaging and NBQX injection into TRN by picospritzing. (G) The time series of Δf/f of the evoked cortical FA signals during ACSF (top trace) and NBQX (middle trace) injections into TRN as well as wash (bottom trace). (H) A scatterplot showing that the percentage of population ON cortical events was higher by blocking TRN activity by NBQX compared to the control; Black arrows refer to the occurrence of population OFF cortical responses indicated by the absence of the post-stimulus cortical FA signals; Vertical gray lines indicate the onset of IC stimulation; CNO: Clozapine-n-oxide.
-
Figure 6—figure supplement 1—source data 1
Time traces of FA signals in Figure 6—figure supplement 1C.
- https://cdn.elifesciences.org/articles/56645/elife-56645-fig6-figsupp1-data1-v2.xlsx
-
Figure 6—figure supplement 1—source data 2
Data values of Figure 6—figure supplement 1D.
- https://cdn.elifesciences.org/articles/56645/elife-56645-fig6-figsupp1-data2-v2.xlsx
-
Figure 6—figure supplement 1—source data 3
Data values of Figure 6—figure supplement 1E.
- https://cdn.elifesciences.org/articles/56645/elife-56645-fig6-figsupp1-data3-v2.xlsx
-
Figure 6—figure supplement 1—source data 4
Time traces of FA signals in Figure 6—figure supplement 1G.
- https://cdn.elifesciences.org/articles/56645/elife-56645-fig6-figsupp1-data4-v2.xlsx
-
Figure 6—figure supplement 1—source data 5
Data values of Figure 6—figure supplement 1H.
- https://cdn.elifesciences.org/articles/56645/elife-56645-fig6-figsupp1-data5-v2.xlsx
Figure 6—figure supplement 2
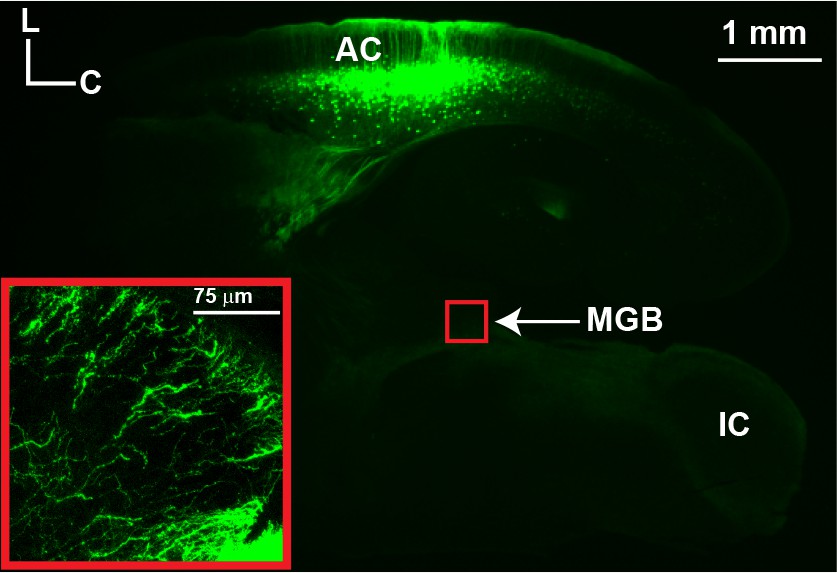
The projections from layer 5 cells to the MGB in the aCTC slice.
An image of the aCTC slice with 2x objective showing the expression of EGFP in cortical layer 5 cell bodies and their apical dendrites as well as their subcortical axons in the RBP4-Cre mouse. Inset: A magnified image (20x objective) showing the innervation of the MGB by layer five axons in the aCTC slice.
Additional files
Download links
A two-part list of links to download the article, or parts of the article, in various formats.
Downloads (link to download the article as PDF)
Open citations (links to open the citations from this article in various online reference manager services)
Cite this article (links to download the citations from this article in formats compatible with various reference manager tools)
Corticothalamic gating of population auditory thalamocortical transmission in mouse
eLife 10:e56645.
https://doi.org/10.7554/eLife.56645


