Nutrient status shapes selfish mitochondrial genome dynamics across different levels of selection
- Department of Biological Sciences, Vanderbilt University, United States
- Department of Cell and Developmental Biology, Vanderbilt University School of Medicine, United States
- Diabetes Research and Training Center, Vanderbilt University School of Medicine, United States
Figures
Figure 1 with 1 supplement
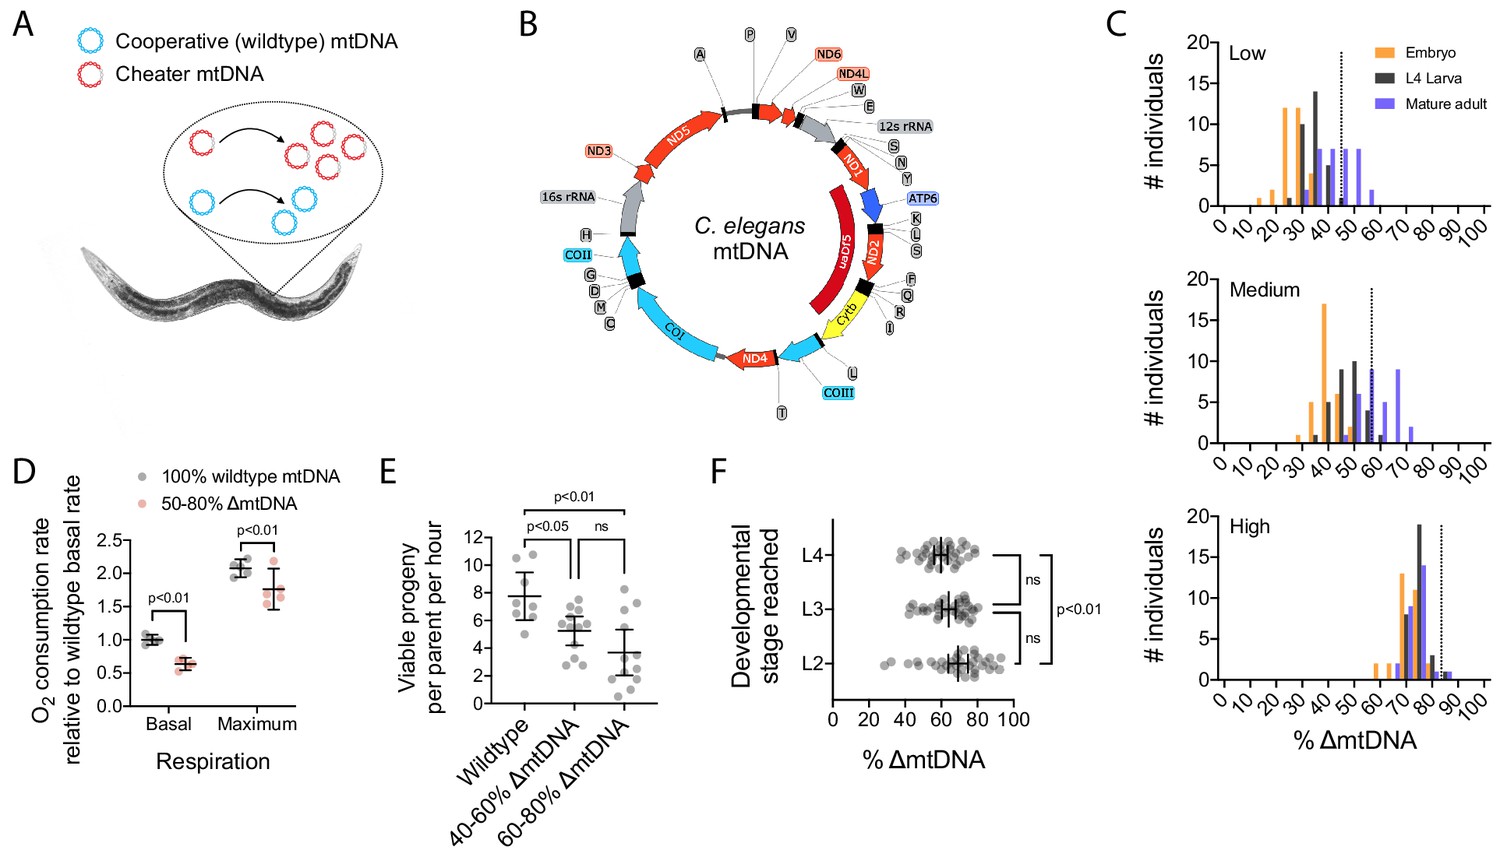
The uaDf5 mutant variant (∆mtDNA) proliferates despite undermining host fitness, indicative of a cheater undergoing multilevel selection.
(A) Selfish mtDNA behaves as a biological cheater, outcompeting the cooperative wildtype mtDNA within hosts. (B) C. elegans mtDNA map showing uaDf5 deletion (dark red) in ∆mtDNA and color-coded genes: respiratory complex I (light red), complex III (yellow), complex IV (light blue), complex V (dark blue), ribosomal RNA (gray), tRNA (black), non-coding regions (thin line). (C) ∆mtDNA frequency across developmental stages of single broods from low (top, N = 94), intermediate (middle, N = 93), or high (bottom, N = 88) parental ∆mtDNA frequency (dotted lines). Mature adults were lysed at day 2 of adulthood, the same age at which the parents were lysed. (D) Basal and maximum aerobic respiration in age-synchronized L4 animals. Two-way ANOVA with Sidak’s multiple comparisons test. (E) Peak fecundity (viable progeny per hour per parent at day 2 of adulthood) binned according to the low end of the ∆mtDNA frequency distribution (below the population mean of 60%, N = 12) or the high end (above 60%, N = 12), with wildtype controls (N = 8). Brown-Forsythe and Welch ANOVA with Dunnett’s T3 multiple comparisons test. (F) Larval stage reached within 48 hr starting from age-synchronized embryos, plotted as a function of ∆mtDNA frequency. N = 35 nematodes per larval stage. Brown-Forsythe and Welch ANOVA with Dunnett’s T3 multiple comparisons test. All experiments featured in this figure used nematodes that were maintained on a diet of live OP50 E. coli at 20 °C.
Figure 1—figure supplement 1
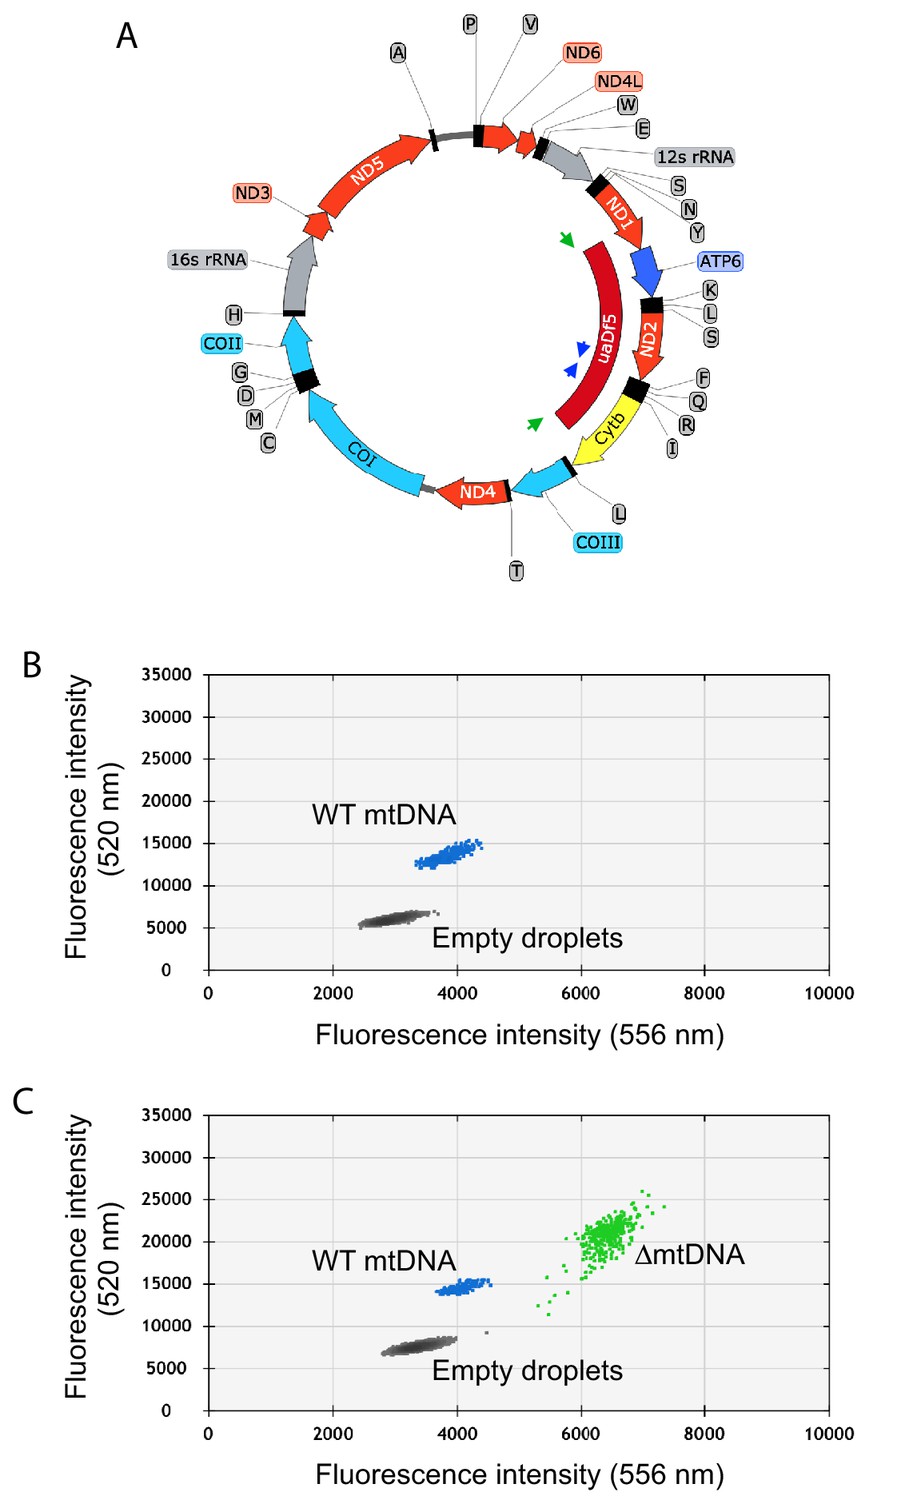
Quantification of mtDNA copy number and ∆mtDNA frequency by droplet digital PCR.
(A) Map of mtDNA showing the uaDf5 deletion (∆mtDNA) and the strategy for oligonucleotide primer design for the multiplex quantification of ∆mtDNA and wildtype mtDNA simultaneously within the same reaction. Due to the deletion size, primers flanking the uaDf5 deletion (green arrows) amplify a PCR product off of the ∆mtDNA but not wildtype mtDNA template (see panel B). Likewise, primers complementary to a sequence within the region spanning the uaDf5 deletion (blue arrows) amplify a PCR product off of the wildtype mtDNA but not ∆mtDNA template. (B–C) Sample droplet digital PCR data plots showing mtDNA copy number in lysates from homoplasmic wildtype (B) and heteroplasmic (C) nematodes. Mutant frequency is determined from ∆mtDNA copy number over total copy number.
Figure 2 with 1 supplement
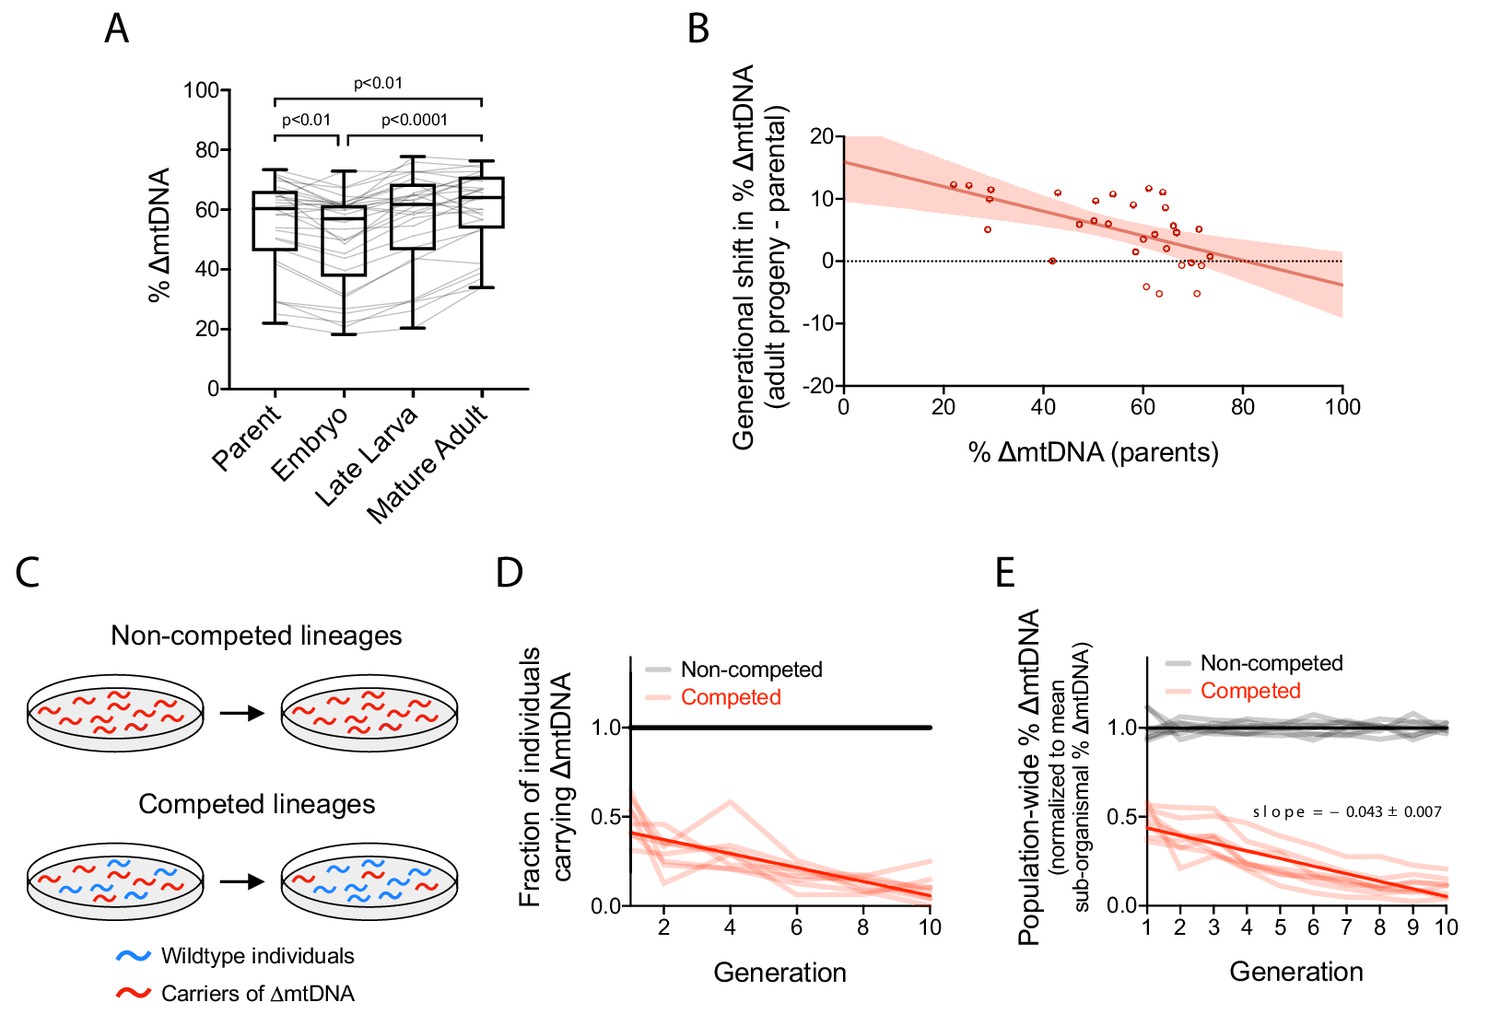
Quantification of intergenerational changes in ∆mtDNA frequency due to selection at sub-organismal and organismal levels.
(A) ∆mtDNA frequency across parent-progeny lineages, maintained in isolation to minimize the effect of organismal selection. Each light gray line represents a single lineage consisting of a parent lysed individually followed by 3 of its progeny pooled and lysed together at each of 3 developmental time-points. Mature adults were lysed at day 2 of adulthood, the same age at which the parents were lysed, to ensure that parents and their adult progeny were age-matched. Box and whisker plots depict mean ∆mtDNA frequency and each quartile. Friedman test with Dunn’s multiple comparisons test. N = 30 lineages. (B) Shift in ∆mtDNA frequency per generation, obtained by subtracting ∆mtDNA frequency of mature adult progeny in panel (A) from ∆mtDNA frequency of the respective parent, plotted as a function of parental ∆mtDNA frequency. Red shaded region: 95% C.I. (C) Competition experiment designed to quantify organismal selection against ∆mtDNA. (D) Fraction of ∆mtDNA-carrying heteroplasmic individuals across 10 generations and eight replicate competed (red) versus non-competed (gray) lineages. Competed lineages consisted of heteroplasmic and homoplasmic wildtype individuals on the same food plates. Non-competed lineages consisted of heteroplasmic individuals only. Solid lines represent best-fit regressions across all replicate lineages. (E) Population-wide ∆mtDNA frequency across the organismal competition experiment. To isolate the change in ∆mtDNA frequency that occurs strictly due to organismal selection, we controlled for the confounding influence of sub-organismal ∆mtDNA dynamics by normalizing the total ∆mtDNA frequency of each lineage to the mean frequency of the non-competed lines at each generation. Because the non-competed lines consist entirely of heteroplasmic individuals, ∆mtDNA frequency across the non-competed lines is equal to mean sub-organismal ∆mtDNA frequency. The overall slope of the non-competing lines is therefore set to zero and the non-zero slope across the competing lines is due to the presence of wildtype animals (see panel C), allowing us to measure the effect of organismal selection by itself. Solid lines represent best-fit regressions across all replicate lineages. All experiments featured in this figure used nematodes that were maintained on a diet of live OP50 E. coli at 20 °C. Error bars: 95% C.I.
-
Figure 2—source data 1
Summary statistics for frequency-dependent change in ∆mtDNA frequency at sub-organismal level and organismal selection against ∆mtDNA.
- https://cdn.elifesciences.org/articles/56686/elife-56686-fig2-data1-v1.xlsx
Figure 2—figure supplement 1
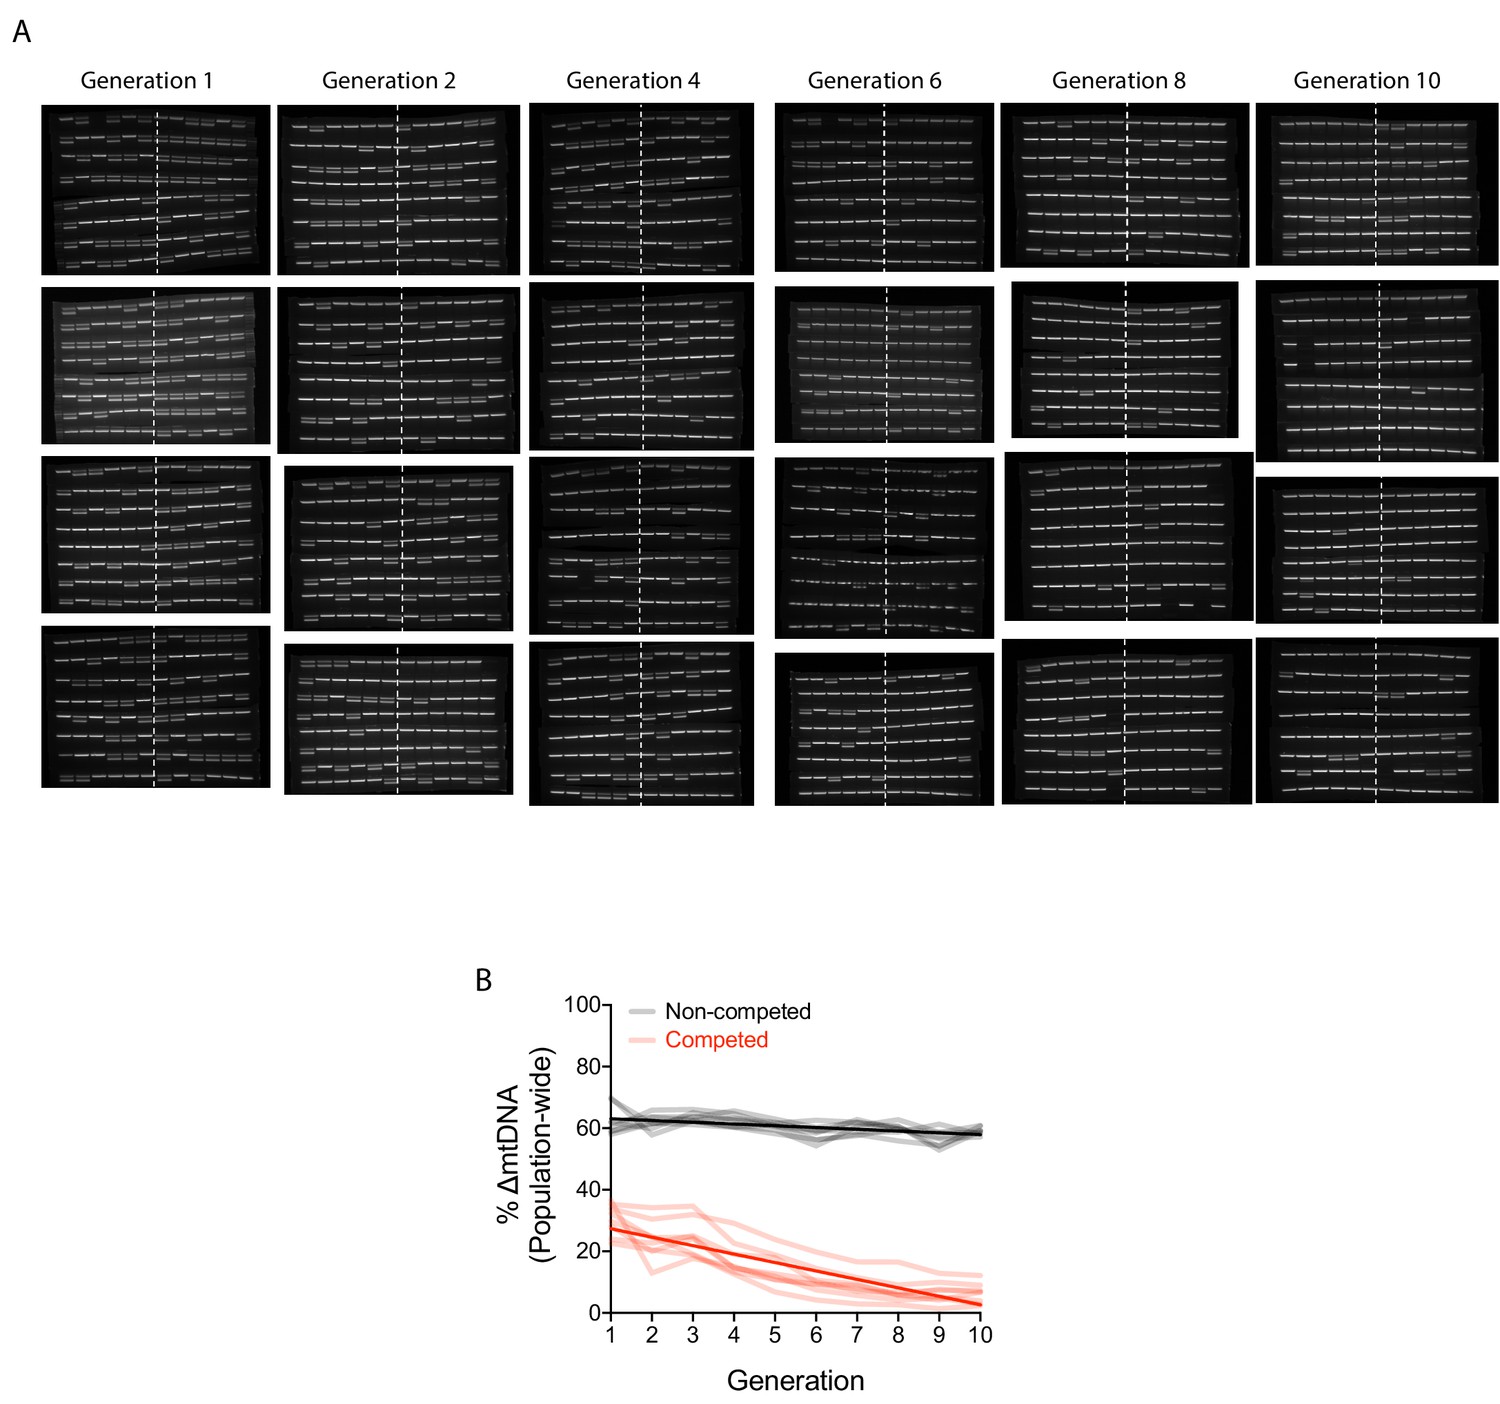
Change in ∆mtDNA frequency in competition experiments is due to organismal selection.
(A) PCR gel images reflecting individual adult nematodes sampled from the competition lines in the organism-level selection experiment. Approximately 48 adults were individually lysed from the first generation and every second generation thereafter. A single PCR band reflects Bristol strain nematodes (homoplasmic for wildtype mtDNA), whereas double bands reflect heteroplasmic animals carrying the ∆mtDNA allele. The numbers to the sides of the gel images label the replicate lineages. (B) Quantification of ∆mtDNA frequency across eight replicate competed (red) and non-competed (black) lineages. Same experiment as shown in Figure 2A but with y-axis expressing raw ∆mtDNA frequency measurements. Dark lines reflect best-fit regression across all replicate lineages. Nematodes were maintained on a diet of live OP50 E. coli at 20 °C.
Figure 3 with 1 supplement
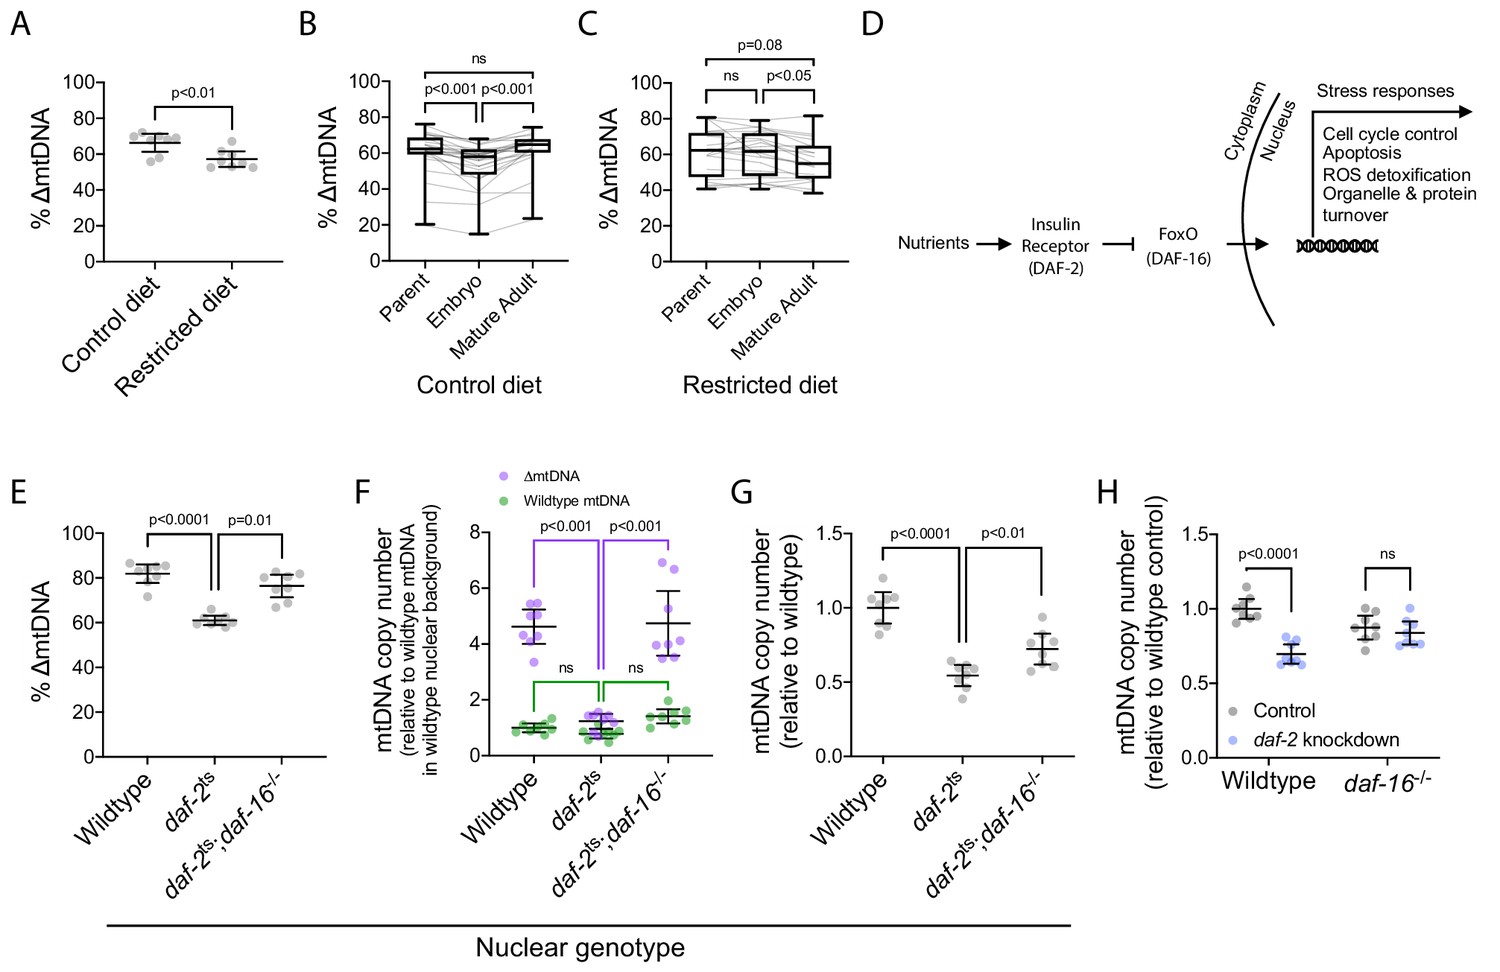
∆mtDNA exploits nutrient supply and insulin signaling to proliferate at the sub-organismal level.
(A) ∆mtDNA frequency on restricted versus control diet. Nematodes were maintained at 20 °C on a diet of UV-killed OP50 E. coli. Mann-Whitney test. N = 8 pooled lysates of 5 age-synchronized day-4 adults each. (B–C) ∆mtDNA frequency across parent-progeny lineages raised on control (B) or restricted (C) diet. Each light gray line represents a single lineage consisting of a parent lysed individually followed by 3 of its progeny pooled and lysed together at each of 2 developmental time-points. Nematodes were maintained at 20 °C on a diet of UV-killed OP50 E. coli. Mature adults were lysed at day 2 of adulthood, the same age at which the parents were lysed, to ensure that parents and their adult progeny were age-matched. Box and whisker plots depict mean ∆mtDNA frequency and each quartile. Friedman test with Dunn’s multiple comparisons test. N = 24 lineages (control diet); N = 20 lineages (restricted diet). (D) FoxO-dependent insulin signaling cascade with C. elegans homologs in parentheses. (E) ∆mtDNA frequency among wildtype, daf-2(e1370) mutant, and daf-2(e1370);daf-16(mu86) double-mutant host genotypes, on a plentiful diet consisting of live OP50 E. coli. Kruskal-Wallis ANOVA with Dunn’s multiple comparisons test. N = 8 pooled lysates of 5 age-synchronized day-4 adults each. (F) mtDNA copy number of individuals in (E), normalized to wildtype mtDNA from wildtype nuclear background. Green and purple represent wildtype and ∆mtDNA copy number, respectively. Two-way ANOVA with Sidak’s multiple comparisons test. N = 8 pooled lysates of 5 age-synchronized day-4 adults each. (G) mtDNA copy number in homoplasmic adults of wildtype, daf-2(e1370) mutant, and daf-2(e1370);daf-16(mu86) double-mutant host genotypes, on a plentiful diet consisting of live OP50 E. coli. One-way ANOVA with Dunnett’s multiple comparisons test. N = 8 pooled lysates of 5 age-synchronized day-4 adults each. (H) mtDNA copy number in homoplasmic adults lacking ∆mtDNA of either wildtype or null daf-16(mu86) host genotype, on either daf-2 RNAi knockdown or empty-vector control conditions. Two-way ANOVA with Sidak’s multiple comparisons test. N = 8 lysates containing five pooled age-synchronized day-4 adults each. Experiments depicted in panels (E) through (H) used nematodes that were maintained at 16 °C during larval development and transferred at the L4 stage to 25 °C for adult maturation, corresponding to the permissive and restrictive temperatures for the daf-2(e1370) allele, respectively. Error bars: 95% C.I.
Figure 3—figure supplement 1
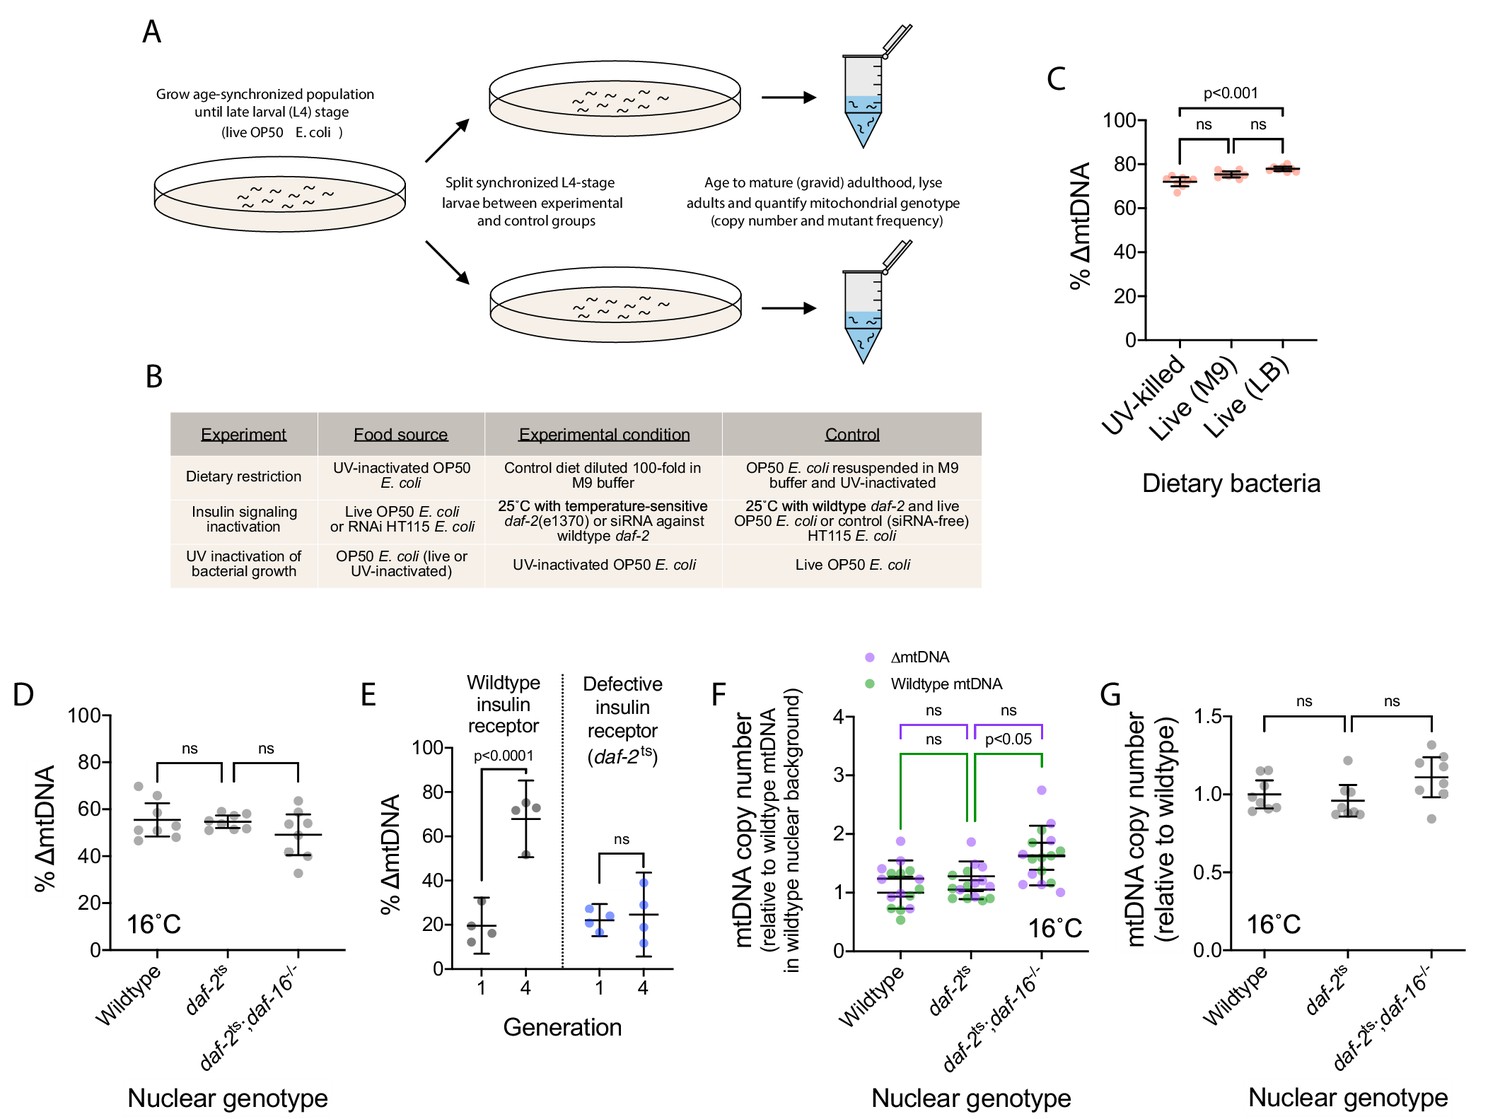
Diet and insulin signaling regulate mtDNA copy number and ∆mtDNA frequency.
(A) Schematic of experimental workflow for assaying the impact of dietary and pharmacological perturbations on ∆mtDNA frequency. (B) Experimental conditions under which changes in ∆mtDNA frequency were assayed. (C) The frequency of ∆mtDNA in age-synchronized, pooled adults (10 adults per sample) maintained at 20 °C on one of three food plates: UV-killed OP50 E. coli, live OP50 suspended in M9 buffer, and live OP50 suspended in LB medium. One-way ANOVA with Dunnett’s multiple comparisons test. (D) ∆mtDNA frequency among wildtype, daf-2(e1370) mutant, and daf-2(e1370);daf-16(mu86) double-mutant genotypes. One-way ANOVA with Dunnett’s multiple comparisons test. N = 8 pooled lysates of 5 age-synchronized adults each. (E) ∆mtDNA frequency in generation 1 versus generation 4, between wildtype and the temperature-sensitive allele daf-2(e1370). At each generation, embryos were transferred to the permissive temperature of 16 °C and maintained at this temperature during larval development to prevent developmental arrest; followed by transfer of L4-stage larvae to 25 °C, the restrictive temperature of the daf-2(e1370) allele, for progression to adulthood and the production of progeny for the subsequent generation. Two-way ANOVA with Sidak’s multiple comparisons test. N = 4 lysates containing five pooled age-synchronized adults each. (F) mtDNA copy number of individuals in (D), normalized to wildtype mtDNA from wildtype nuclear background. Green and purple represent wildtype and ∆mtDNA copy number, respectively. Two-way ANOVA with Sidak’s multiple comparisons test; p-values reflect comparisons of total mtDNA copy number. N = 8 pooled lysates of 5 age-synchronized adults each. (G) mtDNA copy number in homoplasmic adults of wildtype, daf-2(e1370) mutant, and daf-2(e1370);daf-16(mu86) double-mutant genotypes, raised from L4 stage to mature adulthood at 16 °C, the permissive temperature for the temperature-sensitive daf-2(e1370) allele. One-way ANOVA with Dunnett’s multiple comparisons test. N = 8 pooled lysates of 5 age-synchronized adults each. All experiments featured in this figure used nematodes that were lysed at day 4 of adulthood. For panels (D) through (G), nematodes were maintained on a diet of live OP50 E. coli. For panels (D), (F), and (G), nematodes were maintained throughout their lives at 16 °C, the permissive temperature for the daf-2(e1370) allele, providing a temperature control for Figures 3E, F and G, respectively. Error bars represent 95% C.I.
Figure 4 with 1 supplement
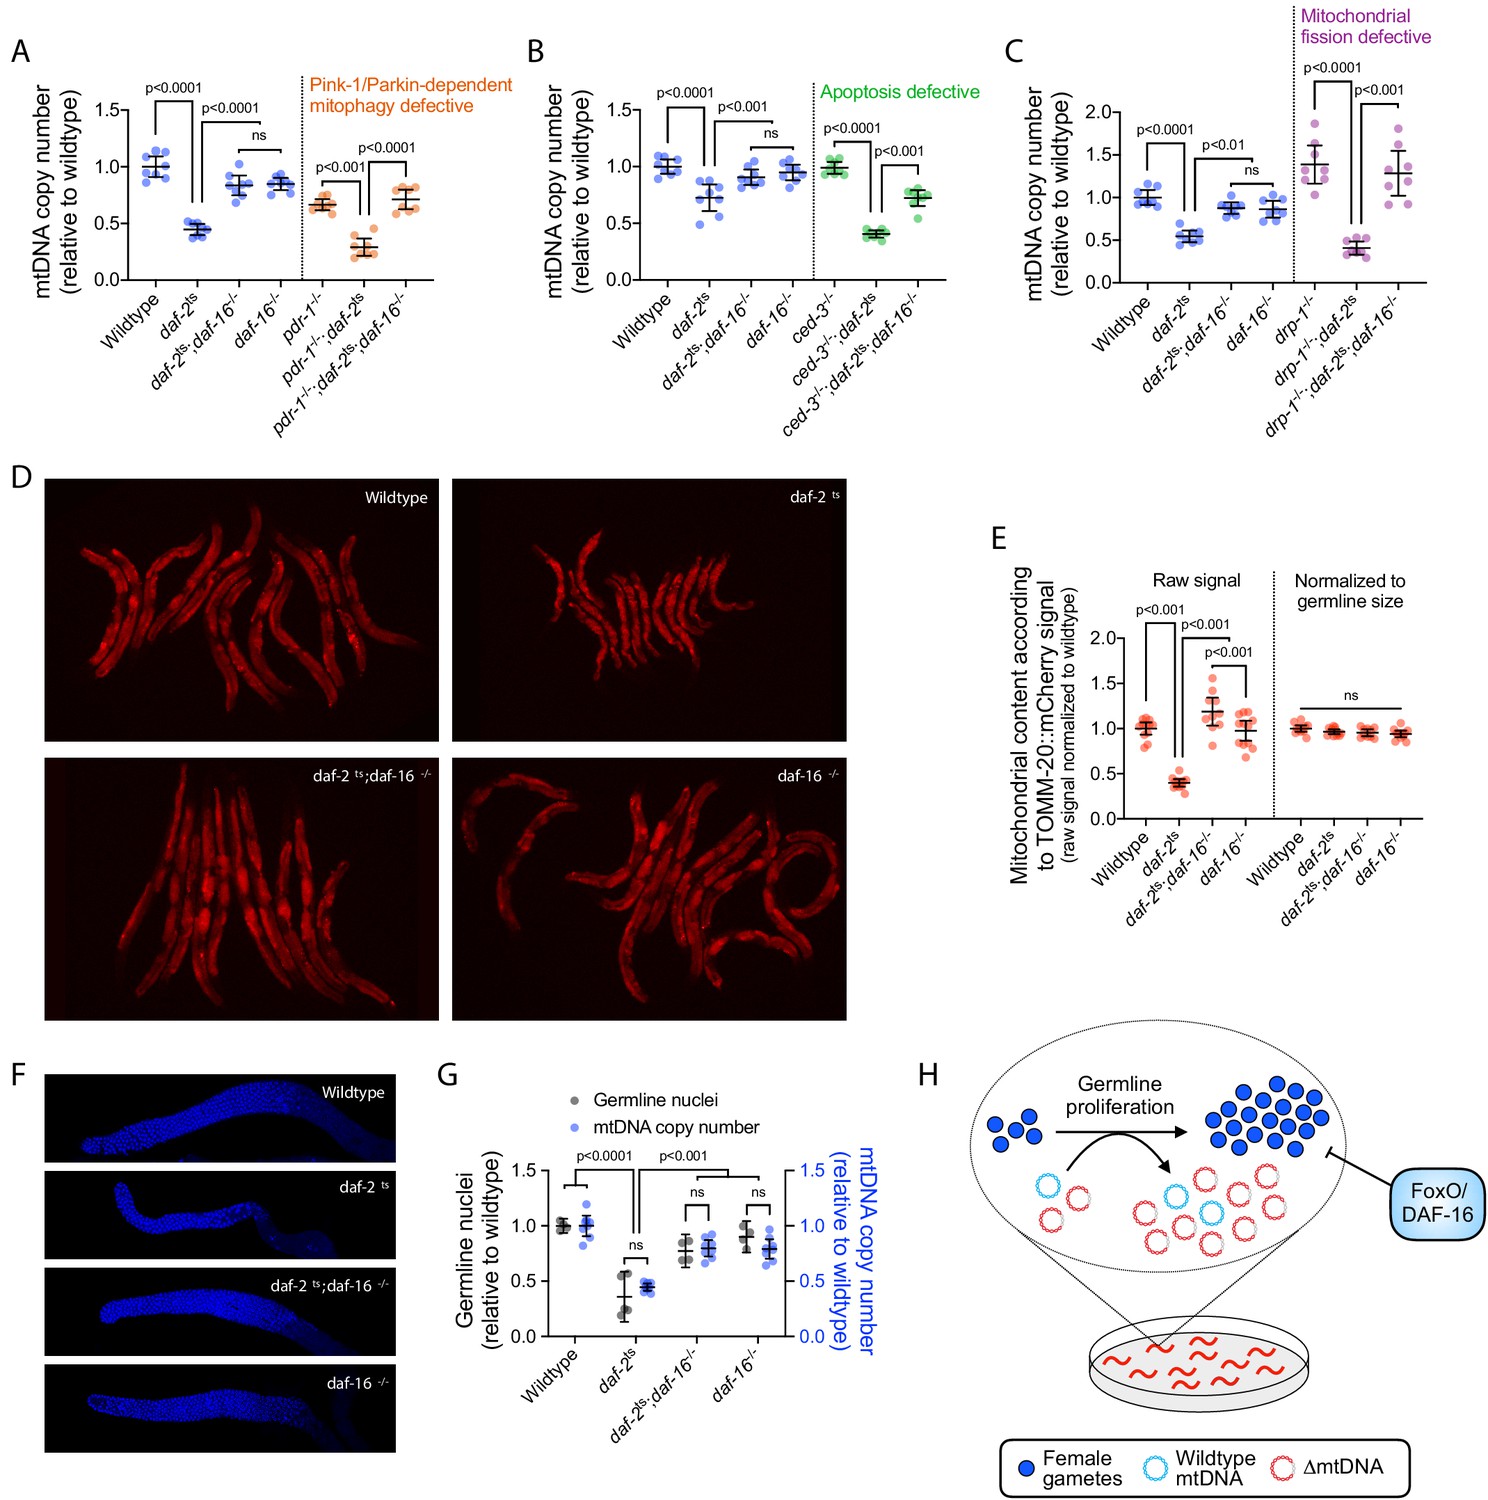
DAF-16 activation upon loss of insulin signaling suppresses mtDNA content via regulation of germline proliferation.
(A–C) mtDNA copy number in age-synchronized adults of wildtype, temperature-sensitive daf-2(e1370) mutant, null daf-16(mu86) mutant, or double-mutant genotype. Copy number is also shown in wildtype, daf-2(e1370), and daf-2(e1370);daf-16(mu86) double-mutant adults each paired with pdr-1(gk448) (A), ced-3(ok2734) (B), or drp-1(tm1108) (C), representing loss-of-function alleles of the Parkin homologue, the terminator caspase CED-3, or dynamin-related protein, respectively. Copy number in daf-16(mu86) single-mutants is also shown. One-way ANOVA with Sidak’s multiple comparisons test. N = 8 lysates containing five pooled age-synchronized day-4 adults each. (D–E) Images (D) and quantification (E) of germline mitochondria labeled with TOMM-20::mCherry across wildtype, daf-2(e1370), daf-16(mu86), or double-mutant genotype. Each data point in (E) represents one adult in (D). One-way ANOVA with Sidak’s multiple comparisons test. (F–G) Representative images (F) and quantification (G) of DAPI-stained nuclei with mtDNA copy number across wildtype, daf-2(e1370), daf-16(mu86), or double-mutant genotype. Each gray data point represents one adult female gonad. For mtDNA copy number, N = 8 pooled lysates of 5 age-synchronized adults each. Two-way ANOVA with Sidak’s multiple comparisons test. (H) Schematic showing that upon loss of insulin signaling, FoxO/DAF-16 limits ∆mtDNA proliferation by restricting germline development. All experiments featured in this figure used nematodes that were maintained on a diet of live OP50 E. coli at 16 °C during larval development and transferred at the L4 stage to 25 °C for adult maturation, corresponding to the permissive and restrictive temperatures for the daf-2(e1370) allele, respectively. For panels (D) through (G), imaging was conducted on day-2 adults to visualize germlines at peak fecundity (Hughes et al., 2007). Error bars: 95% C.I.
Figure 4—figure supplement 1
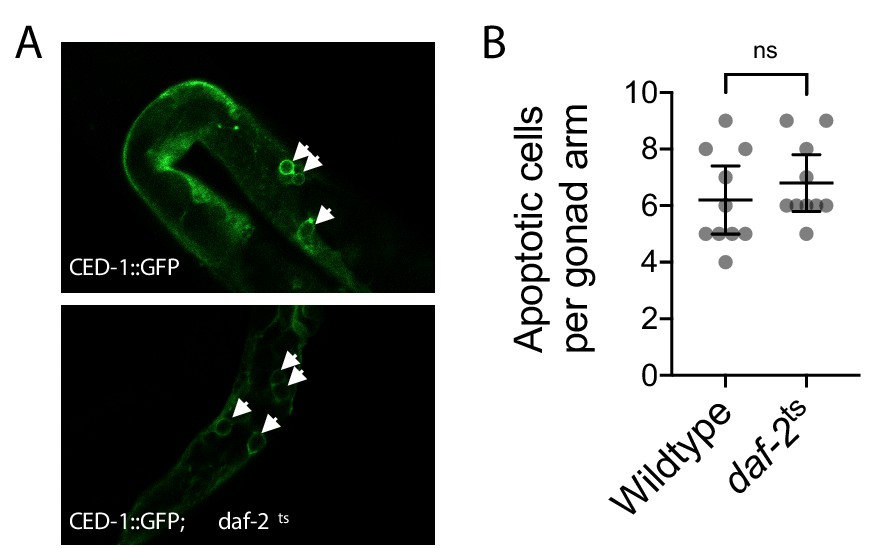
Germline apoptosis in wildtype and daf-2 mutant genotypes.
(A and B) Images (A) and quantification (B) of apoptosis as indicated by the engulfment of apoptotic cells by the reporter CED-1::GFP (white arrows in A), between age-synchronized adults of wildtype or temperature-sensitive daf-2(e1370) mutant genotype. Nematodes were maintained on a diet of live OP50 E. coli at 16 °C during larval development and transferred at the L4 stage to 25 °C for adult maturation, corresponding to the permissive and restrictive temperatures for the daf-2(e1370) allele, respectively, and were imaged at day 2 of adulthood. Mann-Whitney test. N = 10 age-synchronized adults. Error bars: 95% C.I.
Figure 5

The sub-organismal selection advantage of ∆mtDNA requires both nutrient abundance and DAF-16.
(A) Total mtDNA copy number in heteroplasmic individuals, wildtype versus null daf-16(mu86) host genotype, restricted versus control diet. N = 8 pooled lysates of 5 age-synchronized day-4 adults each. Two-way ANOVA with Bonferroni correction. (B) ∆mtDNA frequency of individuals in (A). Two-way ANOVA with Bonferroni correction. (C–D) Change in mtDNA copy number and ∆mtDNA frequency across development, with wildtype (C) versus null daf-16(mu86) (D) host genotype, on restricted versus control diet. Each data point represents the difference in copy number (horizontal axis) and ∆mtDNA frequency (vertical axis) between three pooled day-2 adults (age-matched to their respective parents) and three pooled embryos of the same brood. Mann-Whitney tests with Bonferroni correction. N = 22 wildtype, restricted diet; N = 24 wildtype, control diet; N = 24 daf-16(mu86), restricted diet; N = 24 daf-16(mu86), control diet. (E) Schematic showing that FoxO/DAF-16 is required in order for ∆mtDNA to take advantage of the increased mtDNA replication on an abundant diet. All experiments featured in this figure used nematodes maintained on a diet of UV-killed OP50 E. coli at 20 °C. Error bars: 95% C.I.
Figure 6 with 1 supplement
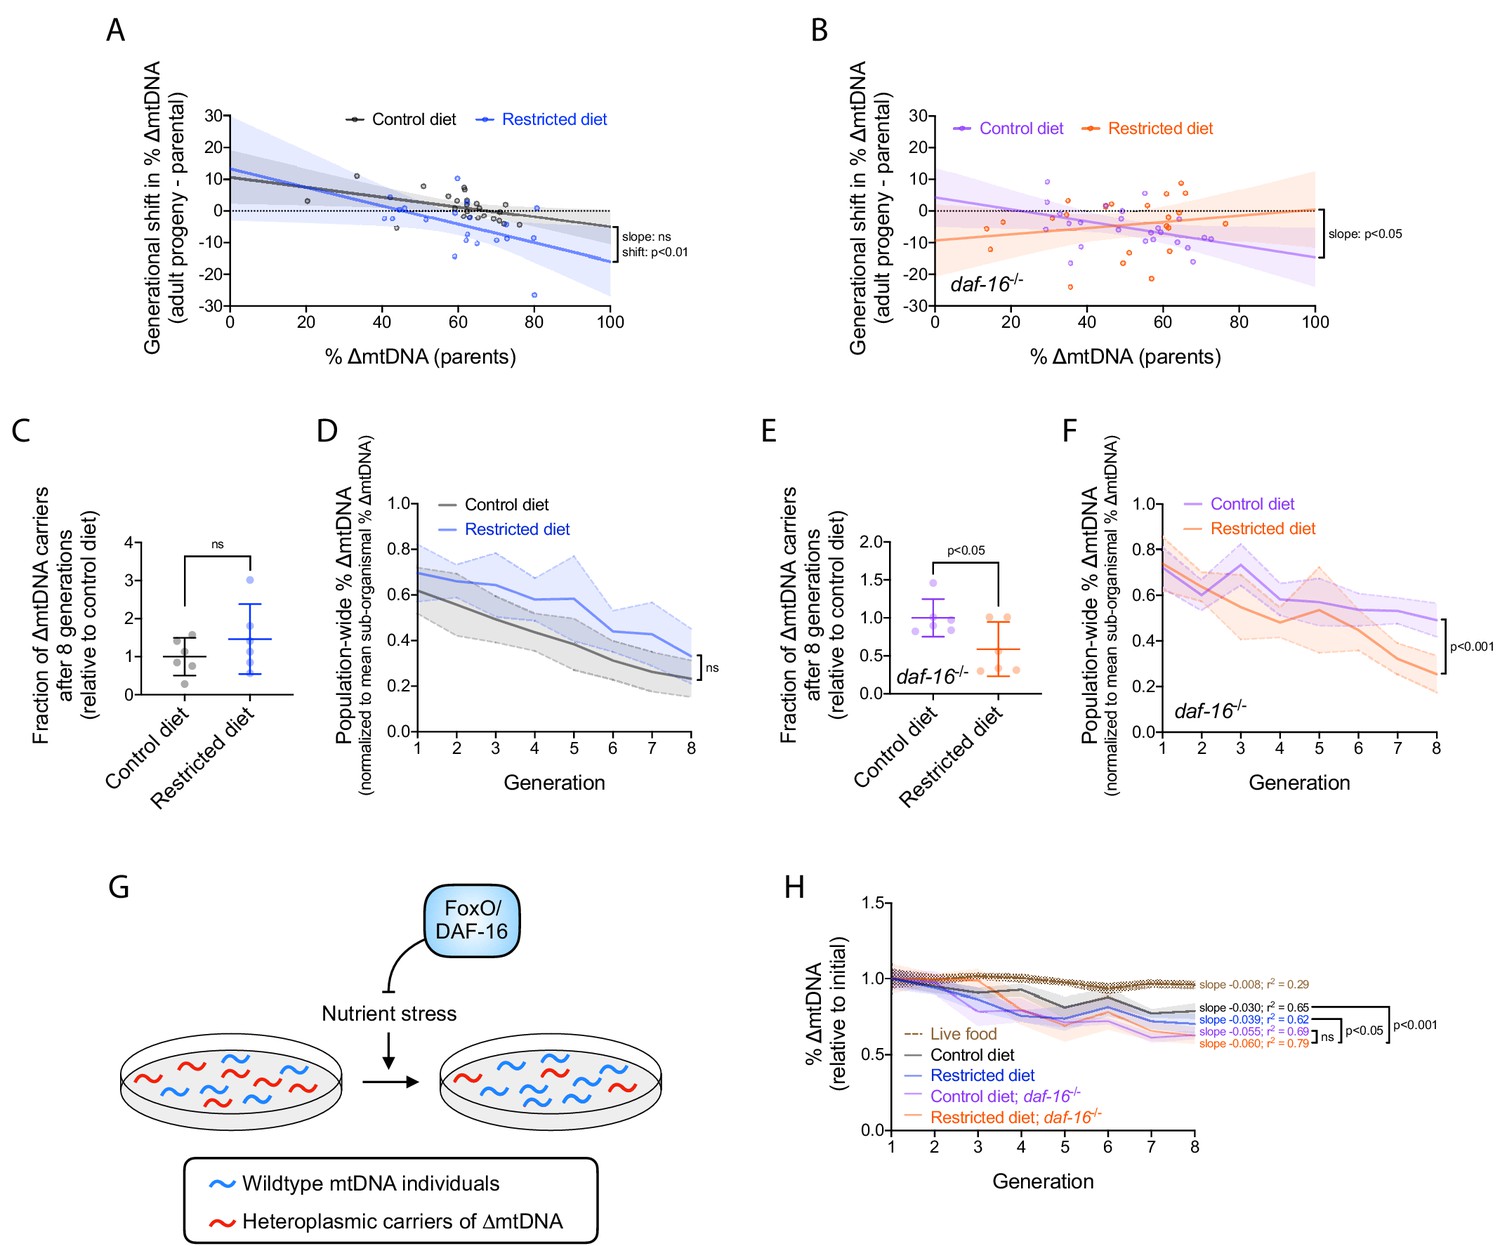
Nutrient status impacts multilevel selection dynamics of ∆mtDNA.
(A–B) Sub-organismal shift in ∆mtDNA frequency per generation, similar to Figure 2B, in wildtype (A) or null daf-16(mu86) (B) host genotype, on restricted or control diet. Adults were lysed at day 2 of adulthood, the same age at which the parents were lysed, to ensure that parents and their adult progeny were age-matched. Regressions compared using analysis of covariance. (C) Fraction of ∆mtDNA-carrying individuals at generation 8 of the competition experiment shown in (D) and Figure 6—figure supplement 1A, normalized to control-diet lines. Two-tailed Welch’s t-test. (D) Organismal selection against ∆mtDNA as measured by population-wide ∆mtDNA frequency relative to average sub-organismal (heteroplasmic) frequency, similar to Figure 2E, in competing lineages of wildtype nuclear background, maintained on restricted or control diet. To isolate the change in ∆mtDNA frequency that occurs strictly due to organismal selection, we controlled for the confounding influence of sub-organismal ∆mtDNA dynamics by normalizing overall ∆mtDNA across each population to that of the non-competed lines at each generation. Because all individuals within the non-competed lines contain ∆mtDNA, the frequency across a non-competing population is equal to the average sub-organismal ∆mtDNA. Hence, normalizing ∆mtDNA to the non-competing lines accounts for sub-organismal ∆mtDNA dynamics and reveals the decline in ∆mtDNA that occurs strictly due to selection at the level of organismal fitness. Solid lines reflect mean normalized ∆mtDNA frequency. Non-competed lines not shown for visual simplicity. Linear regression analysis. (E) Fraction of ∆mtDNA-carrying individuals with daf-16(mu86) nuclear background at generation 8 of the competition experiment shown in (F) and Figure 6—figure supplement 1B, normalized to control-diet lines. Two-tailed Welch’s t-test. (F) Organismal selection against ∆mtDNA as measured by population-wide ∆mtDNA frequency relative to average sub-organismal (heteroplasmic) frequency, similar to Figure 2E and (D), in competing lineages of daf-16(mu86) nuclear background, maintained on restricted or control diet. The ∆mtDNA frequency of each line, at each generation, was normalized to that of the non-competed lines in order to control for the confounding influence of sub-organismal ∆mtDNA dynamics, as was done in (D). Solid lines reflect mean normalized ∆mtDNA frequency. Non-competed lines not shown for visual simplicity. Linear regression analysis. (G) Schematic showing the influence of FoxO/DAF-16 on organismal selection against ∆mtDNA. Specifically, FoxO/DAF-16 protects ∆mtDNA from greater organismal selection during nutrient stress. (H) ∆mtDNA frequency, normalized to starting frequency, in non-competing lineages from the organismal competition experiment shown in (D) and (F). For comparison, dotted brown line represents data of non-competing data from the competition experiment on live OP50 E. coli (Figure 2—figure supplement 1B, gray lines). Linear regression analyses with Bonferroni correction for multiple comparisons. All experiments featured in this figure used nematodes maintained on a diet of UV-killed OP50 E. coli at 20 °C. Shaded regions show 95% C.I.
-
Figure 6—source data 1
Summary statistics for frequency-dependent change in ∆mtDNA frequency at sub-organismal level, by diet and host genotype.
- https://cdn.elifesciences.org/articles/56686/elife-56686-fig6-data1-v1.xlsx
-
Figure 6—source data 2
Summary statistics for frequency-dependent change in ∆mtDNA frequency at organismal level, by diet and host genotype.
- https://cdn.elifesciences.org/articles/56686/elife-56686-fig6-data2-v1.xlsx
Figure 6—figure supplement 1
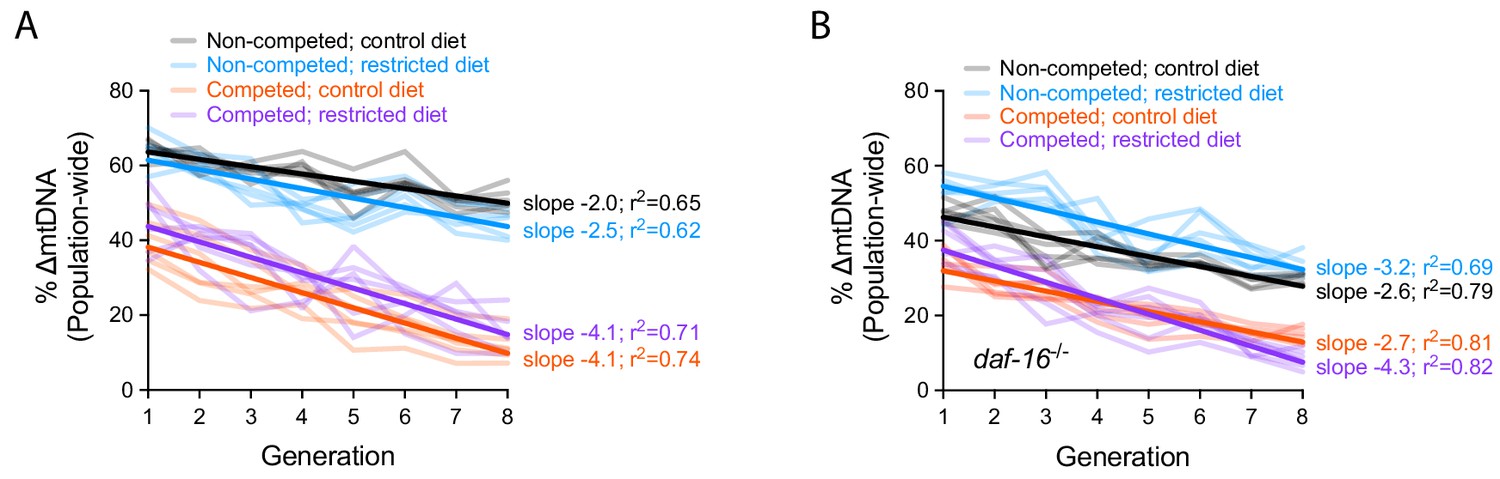
Quantification of ∆mtDNA frequency in competition experiments to measure organismal selection under altered dietary conditions and daf-16 genotype.
(A–B) Same data presented in Figure 6C–E but with y-axis representing raw ∆mtDNA frequency measurements. Dark lines reflect best-fit regression across all replicate lineages. Nematodes were maintained on diets of UV-killed OP50 E. coli at 20 °C.
Figure 7
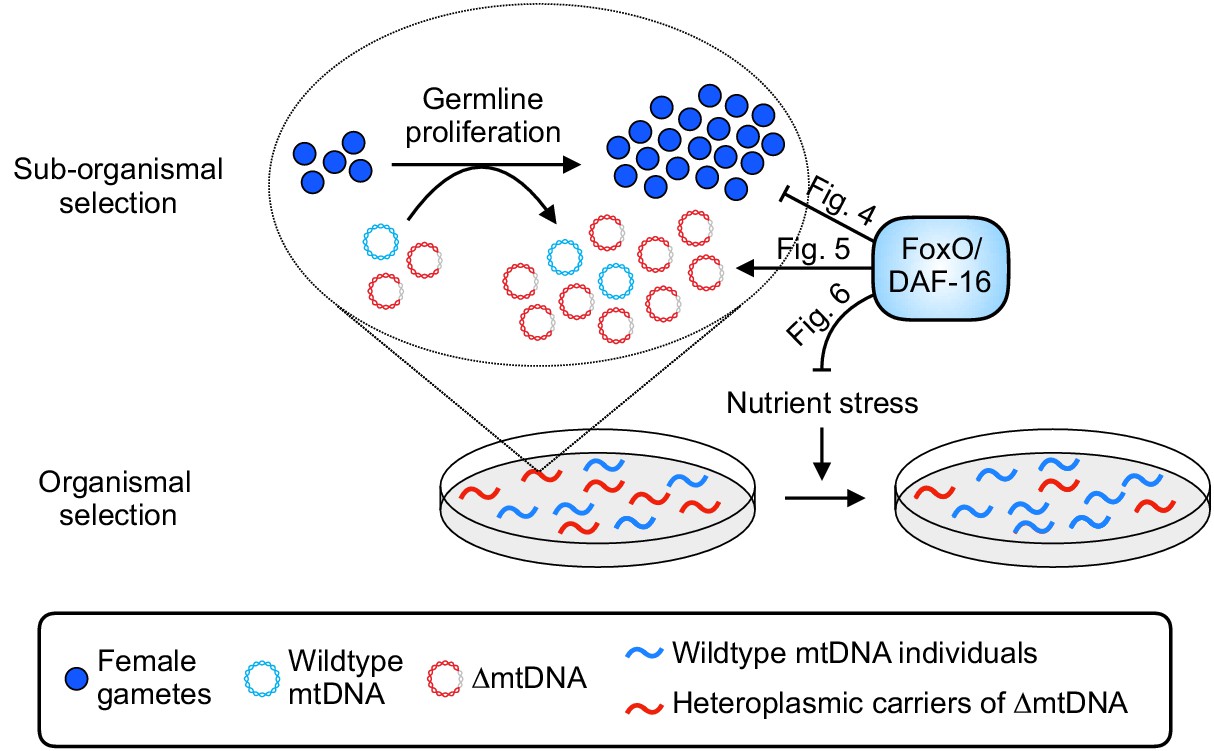
Summary of influence of diet and nutrient stress tolerance on multilevel selection dynamics of ∆mtDNA.
At the sub-organismal level, FoxO/DAF-16 influences ∆mtDNA dynamics via two separate functions. On one hand, loss of insulin signaling results in activation of FoxO/DAF-16, which inhibits germline development (Figure 4). On the other hand, ∆mtDNA preferentially propagates by taking advantage of dietary nutrients but only when FoxO/DAF-16 is present (Figure 5), indicating that nutrient supply and FoxO/DAF-16-dependent nutrient sensing are each necessary, but not sufficient individually, for ∆mtDNA proliferation. During conditions of food scarcity, FoxO/DAF-16 partially shields ∆mtDNA from organismal selection (Figure 6), suggesting that nutrient supply and FoxO/DAF-16 promote ∆mtDNA propagation across organismal and sub-organismal selection levels.
Tables
Key resources table
| Reagent type (species) or resource | Designation | Source or reference | Identifiers | Additional information |
|---|---|---|---|---|
| Gene (Caenorhabditis elegans) | daf-2 | WormBase | Y55D5A.5 | |
| Gene (Caenorhabditis elegans) | daf-16 | WormBase | R13H8.1 | |
| Gene (Caenorhabditis elegans) | pdr-1 | WormBase | K08E3.7 | |
| Gene (Caenorhabditis elegans) | ced-3 | WormBase | C48D1.2 | |
| Gene (Caenorhabditis elegans) | drp-1 | WormBase | T12E12.4 | |
| Genetic reagent (Caenorhabditis elegans) | him-8(e1489); ∆mtDNA(uaDf5)/+ | Caenorhabditis Genetics Center | RRID:WB-STRAIN:WBStrain00024106 | LB138 |
| Genetic reagent (Caenorhabditis elegans) | daf-2(e1370) | Caenorhabditis Genetics Center | RRID:WB-STRAIN:WBStrain00004309 | CB1370 |
| Genetic reagent (Caenorhabditis elegans) | daf-16(mu86) | Caenorhabditis Genetics Center | RRID:WB-STRAIN:WBStrain00004840 | CF1038 |
| Genetic reagent (Caenorhabditis elegans) | daf-2(e1370); daf-16(mu86); muEx268 [ges-1p::GFP:daf-16(cDNA) + odr-1::RFP] | Caenorhabditis Genetics Center | RRID:WB-STRAIN:WBStrain00004876 | CF1827 |
| Genetic reagent (Caenorhabditis elegans) | pdr-1(gk448) | International C. elegans Gene Knockout Consortium | RRID:WB-STRAIN:WBStrain00036256 | VC1024 |
| Genetic reagent (Caenorhabditis elegans) | ced-3(ok2734) | International C. elegans Gene Knockout Consortium | RRID:WB-STRAIN:WBStrain00032755 | RB2071 |
| Genetic reagent (Caenorhabditis elegans) | drp-1(tm1108) | Shohei Mitani | RRID:WB-STRAIN:WBStrain00005196 | CU6372 |
| Genetic reagent (Caenorhabditis elegans) | bcIs39 V [lim-7p::ced-1::GFP + lin-15(+)] | Barbara Conradt | RRID:WB-STRAIN:WBStrain00026469 | MD701 |
| Genetic reagent (Caenorhabditis elegans) | tomm-20::mCherry | Sasha de Henau | TBDL58 | |
| Genetic reagent (Caenorhabditis elegans) | ∆mtDNA(uaDf5)/+ in Bristol nuclear background | This study | See Materials and methods: Genetic crosses and genotyping | |
| Genetic reagent (Caenorhabditis elegans) | daf-2(e1370); ∆mtDNA(uaDf5)/+ | This study | See Materials and methods: Genetic crosses and genotyping | |
| Genetic reagent (Caenorhabditis elegans) | daf-2(e1370); daf-16(mu86); ∆mtDNA(uaDf5)/+ | This study | See Materials and methods: Genetic crosses and genotyping | |
| Genetic reagent (Caenorhabditis elegans) | daf-16(mu86); ∆mtDNA(uaDf5)/+ | This study | See Materials and methods: Genetic crosses and genotyping | |
| Genetic reagent (Caenorhabditis elegans) | daf-2(e1370); pdr-1(gk448) | This study | See Materials and methods: Genetic crosses and genotyping | |
| Genetic reagent (Caenorhabditis elegans) | daf-2(e1370); daf-16(mu86); pdr-1(gk448) | This study | See Materials and methods: Genetic crosses and genotyping | |
| Genetic reagent (Caenorhabditis elegans) | daf-2(e1370); ced-3(ok2734) | This study | See Materials and methods: Genetic crosses and genotyping | |
| Genetic reagent (Caenorhabditis elegans) | daf-2(e1370); daf-16(mu86); ced-3(ok2734) | This study | See Materials and methods: Genetic crosses and genotyping | |
| Genetic reagent (Caenorhabditis elegans) | daf-2(e1370); drp-1(tm1108) | This study | See Materials and methods: Genetic crosses and genotyping | |
| Genetic reagent (Caenorhabditis elegans) | daf-2(e1370); daf-16(mu86); drp-1(tm1108) | This study | See Materials and methods: Genetic crosses and genotyping | |
| Genetic reagent (Caenorhabditis elegans) | daf-2(e1370); tomm-20::mCherry | This study | See Materials and methods: Genetic crosses and genotyping | |
| Genetic reagent (Caenorhabditis elegans) | daf-2(e1370); daf-16(mu86); tomm-20::mCherry | This study | See Materials and methods: Genetic crosses and genotyping | |
| Genetic reagent (Caenorhabditis elegans) | daf-16(mu86); tomm-20::mCherry | This study | See Materials and methods: Genetic crosses and genotyping | |
| Genetic reagent (Caenorhabditis elegans) | daf-2(e1370); bcIs39 V [lim-7p::ced-1::GFP + lin-15(+)] | This study | See Materials and methods: Genetic crosses and genotyping | |
| Genetic reagent (Escherichia coli) | HT115 strain expressing Y55D5A_391.b (daf-2) ORF plasmid clone | Ahringer Group, Source BioScience | 3318_Cel_RNAi_complete | See Materials and methods: Knockdown of gene expression |
| Sequence-based reagent | PCR primers used in this study | This study | See Materials and methods: Genetic crosses and genotyping; Quantification of mtDNA copy number and ∆mtDNA frequency | |
| Peptide, recombinant protein | BlpI restriction endonuclease | New England Biolabs | Cat#R0585L | See Materials and methods: Genetic crosses and genotyping |
| Chemical compound, drug | Isopropyl-β-D-thiogalactopyranoside | Research Products International | Cat#I56000-1 | See Materials and methods: Genetic crosses and genotyping |
| Chemical compound, drug | 4’,6-diamidino-2-phenylindole (DAPI) | Thermo Fisher Scientific | Cat#D1306 | |
| Chemical compound, drug | Paraformaldehyde | Electron Microscopy Sciences | Cat#15710 | |
| Chemical compound, drug | Levamisole | Fisher Scientific | Cat#AC187870100 | |
| Commercial assay, kit | DreamTaq Green DNA Polymerase | Thermo Fisher Scientific | Cat#EP0713 | |
| Commercial assay, kit | Seahorse XFe96 FluxPak | Agilent | Cat#102601–100 | |
| Other | Eppendorf 96-well twin.tec PCR plates | Fisher Scientific | Cat#951020303 | |
| Other | QX200 ddPCR EvaGreen Supermix | Bio-Rad | Cat#1864034 | |
| Other | Automated Droplet Generation Oil for EvaGreen | Bio-Rad | Cat#1864112 | |
| Other | DG32 Automated Droplet Generator Cartridges | Bio-Rad | Cat#1864108 | |
| Other | Droplet Reader Oil for ddPCR | Bio-Rad | Cat#1863004 | |
| Software, algorithm | QuantaSoft | Bio-Rad | Cat#1864011 | |
| Software, algorithm | Zen | Carl Zeiss Microscopy GmbH | RRID:SCR_013672 | |
| Software, algorithm | Prism eight for macOS | GraphPad Software, Inc | RRID:SCR_002798 | Version 8.1.2 |
| Software, algorithm | ImageJ | Wayne Rasband, NIH | RRID:SCR_003070 | Version 1.49 |
Additional files
Download links
A two-part list of links to download the article, or parts of the article, in various formats.
Downloads (link to download the article as PDF)
Open citations (links to open the citations from this article in various online reference manager services)
Cite this article (links to download the citations from this article in formats compatible with various reference manager tools)
Nutrient status shapes selfish mitochondrial genome dynamics across different levels of selection
eLife 9:e56686.
https://doi.org/10.7554/eLife.56686


