Comprehensive exploration of the translocation, stability and substrate recognition requirements in VIM-2 lactamase
- Michael Smith Laboratories, University of British Columbia, Canada
- Department of Genome Sciences, University of Washington, United States
- Department of Bioengineering, University of Washington, United States
Figures
Figure 1 with 4 supplements
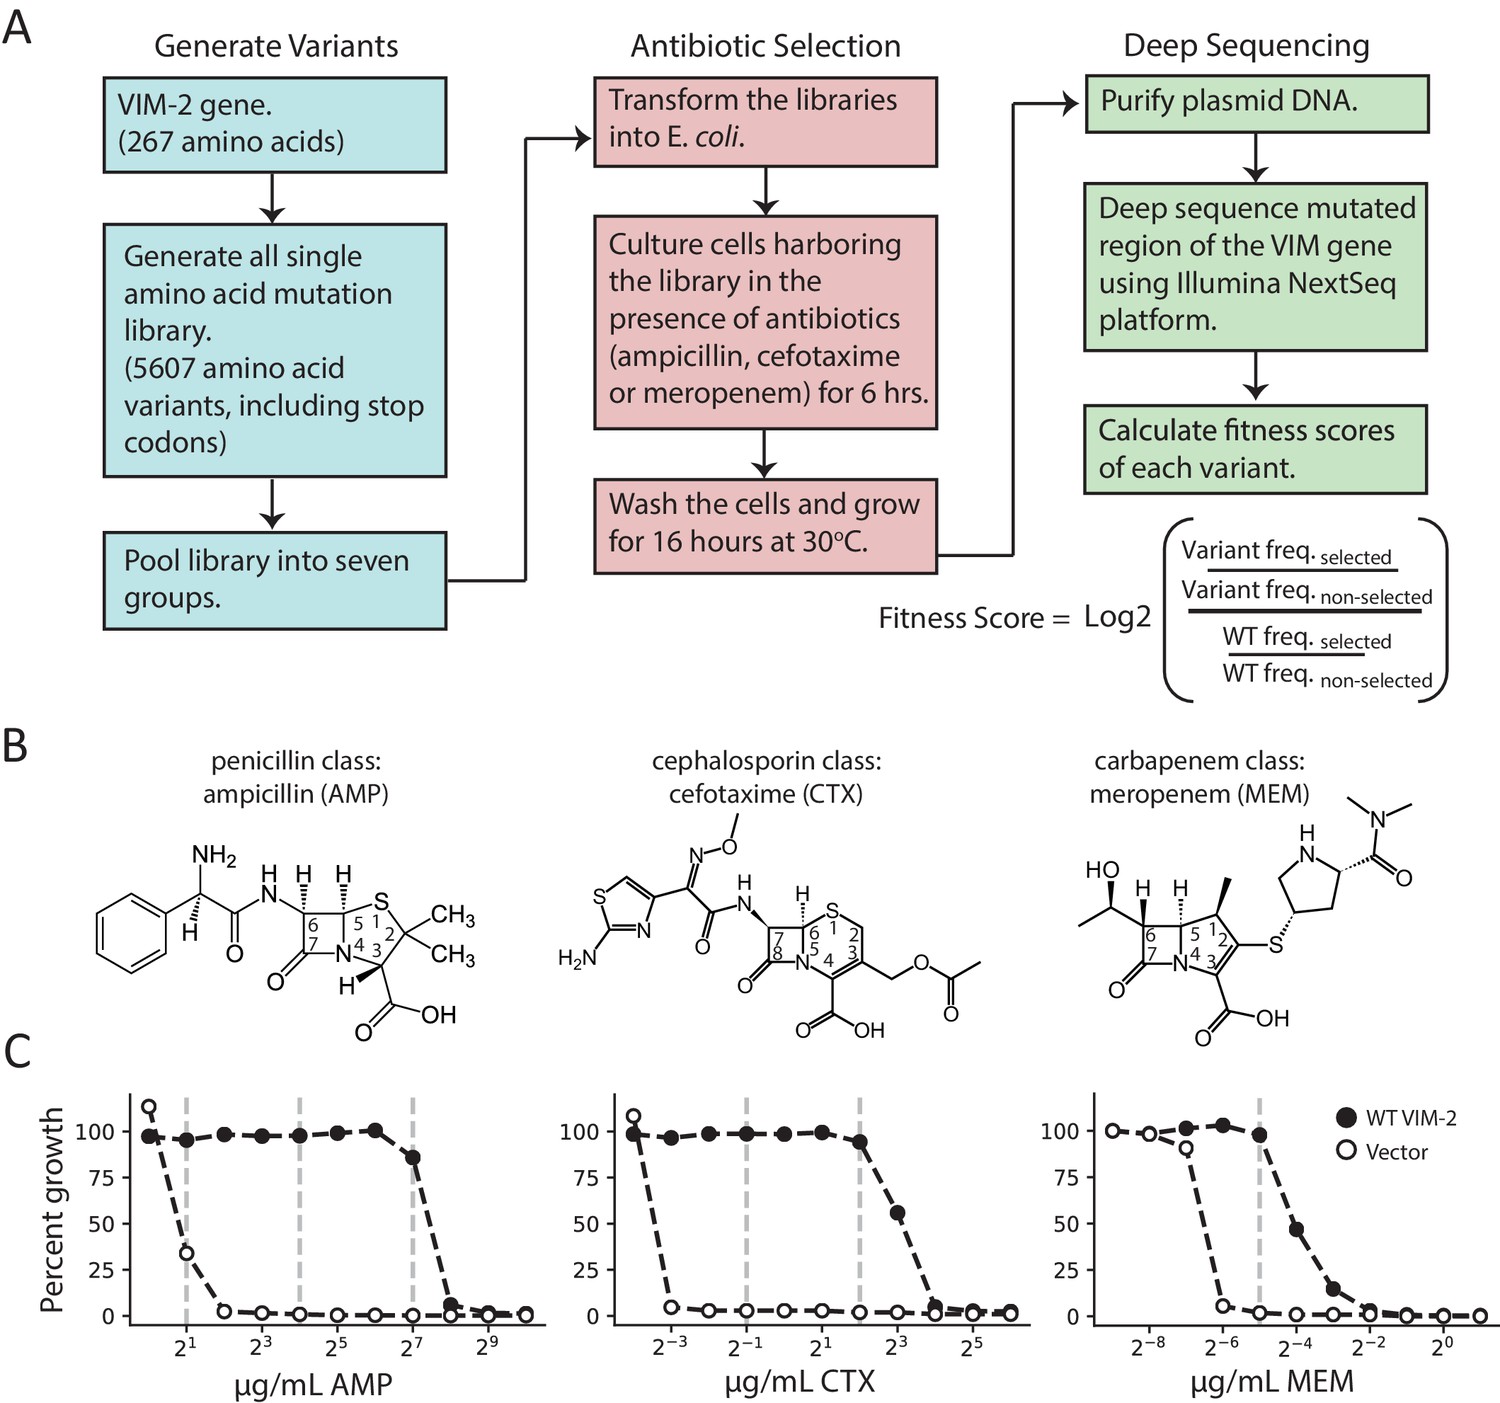
Deep mutational scanning (DMS) overview.
(A) The workflow for DMS. All single amino acid variants are first generated using RF cloning, subsequently transformed into E. coli and then subject to selection for antibiotic resistance conferred to E. coli. The effects of selection (fitness score) were evaluated by deep sequencing and comparing the enrichment of each variant with and without selection. (B) Chemical structures of the antibiotics used in this study. (C) The dose-response growth curve of E. coli transformed with wtVIM-2 or an empty vector control for each antibiotic. Percent growth is calculated as OD600 selected / OD600 non-selected×100 after 6 hr of selection at 37°C. The vertical dashed lines indicate antibiotic concentrations at which selections were performed in this study. The dose-response curves of E. coli transformed with each of the seven library groups are in Figure 1—figure supplement 1. The number of variants represented in the mutated library is in Table 2. Other aspects of the cloning and data processing are described in Figure 1—figure supplement 2 (PCR cloning method), Figure 1—figure supplement 3 (deep sequencing error rates) and Figure 1—figure supplement 4 (improving variant identification by an error filtering process).
Figure 1—figure supplement 1
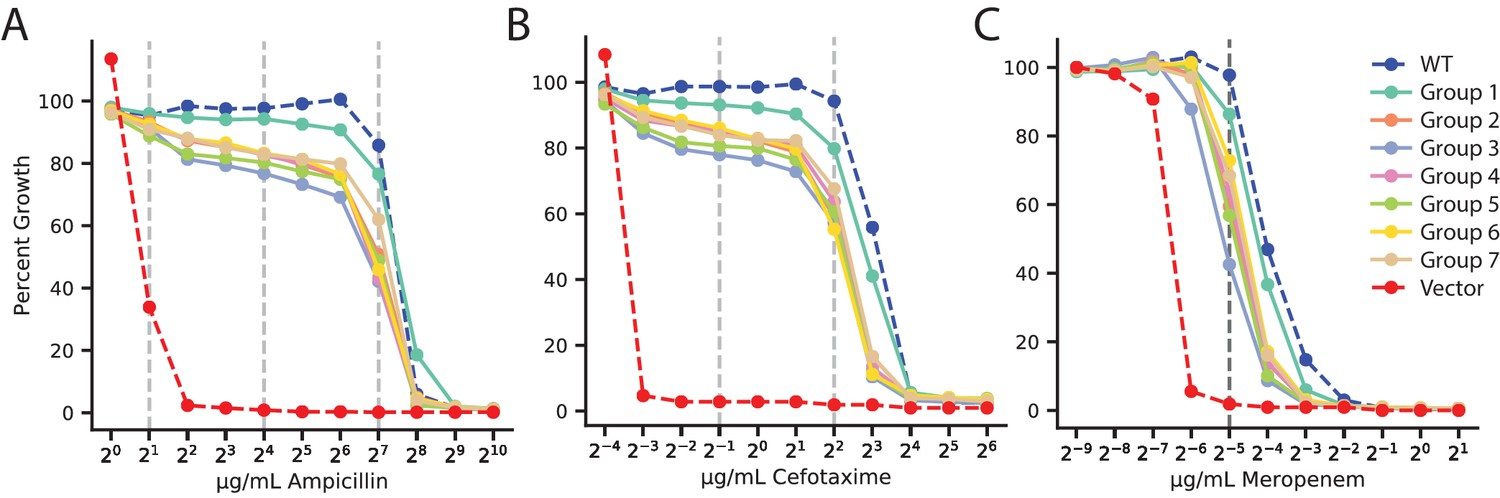
Antibiotic dose-response curves of VIM-2 libraries for all antibiotics.
(A) Ampicillin. (B) Cefotaxime. (C) Meropenem. Y-axis indicates percent growth of E. coli transformed with plasmid library groups relative to no selection. The range of antibiotics tested is 1.0–1024 µg/mL for AMP, 0.0625–64 µg/mL for CTX, and 0.002–2.0 µg/mL for MEM. The dashed vertical lines indicate concentrations that were used in DMS.
Figure 1—figure supplement 2
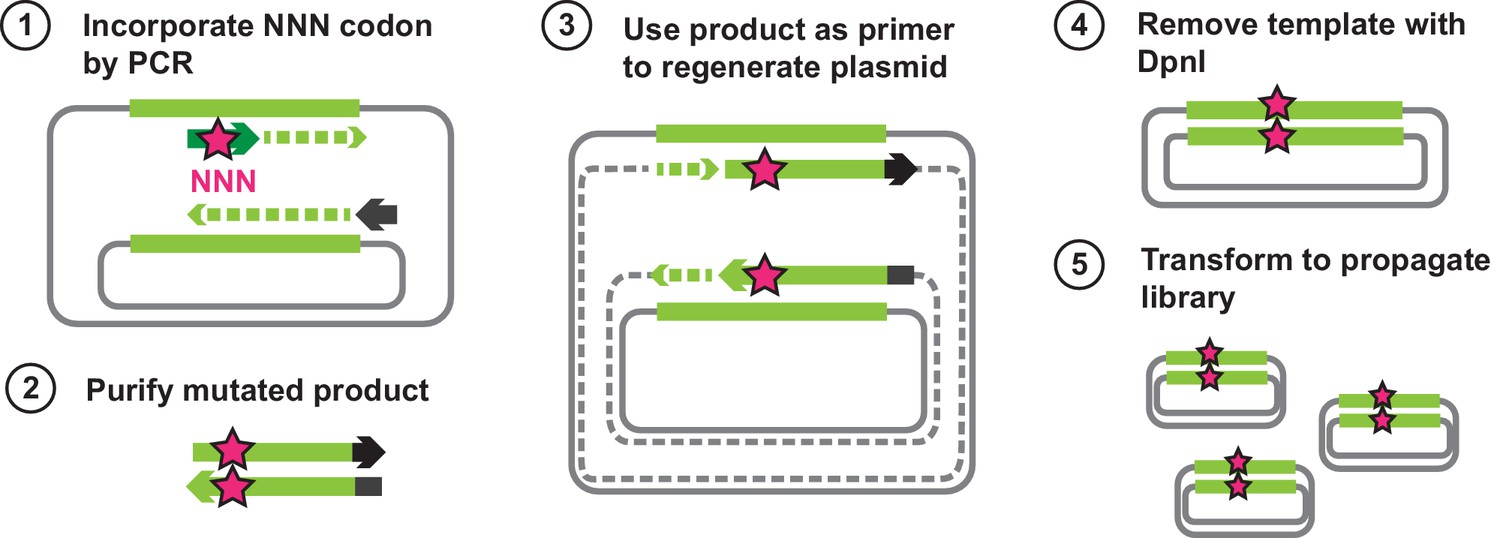
Outline of steps for generating all single amino acid variants of VIM-2.
The wtVIM-2 gene is encoded on a plasmid, and the first step is to extract the gene using a PCR. The forward primers carry an ‘NNN’ mutation that is in frame with a specific codon of the wtVIM-2 gene, and all products will have a randomly mutated codon at that position. The mutated products are purified and used as primers to extend the rest of the plasmid using the same wtVIM-2 plasmid as the template, giving rise to the mutant VIM-2 plasmid library; the plasmid has a nick in both strands at the 5’ end, but can anneal to each other to become circular. As a final clean up step, the second PCR products are digested with DpnI for 1 hr at 37°C to remove the wt template. The purified library is then transformed into E. coli for propagation and subsequently purified.
Figure 1—figure supplement 3
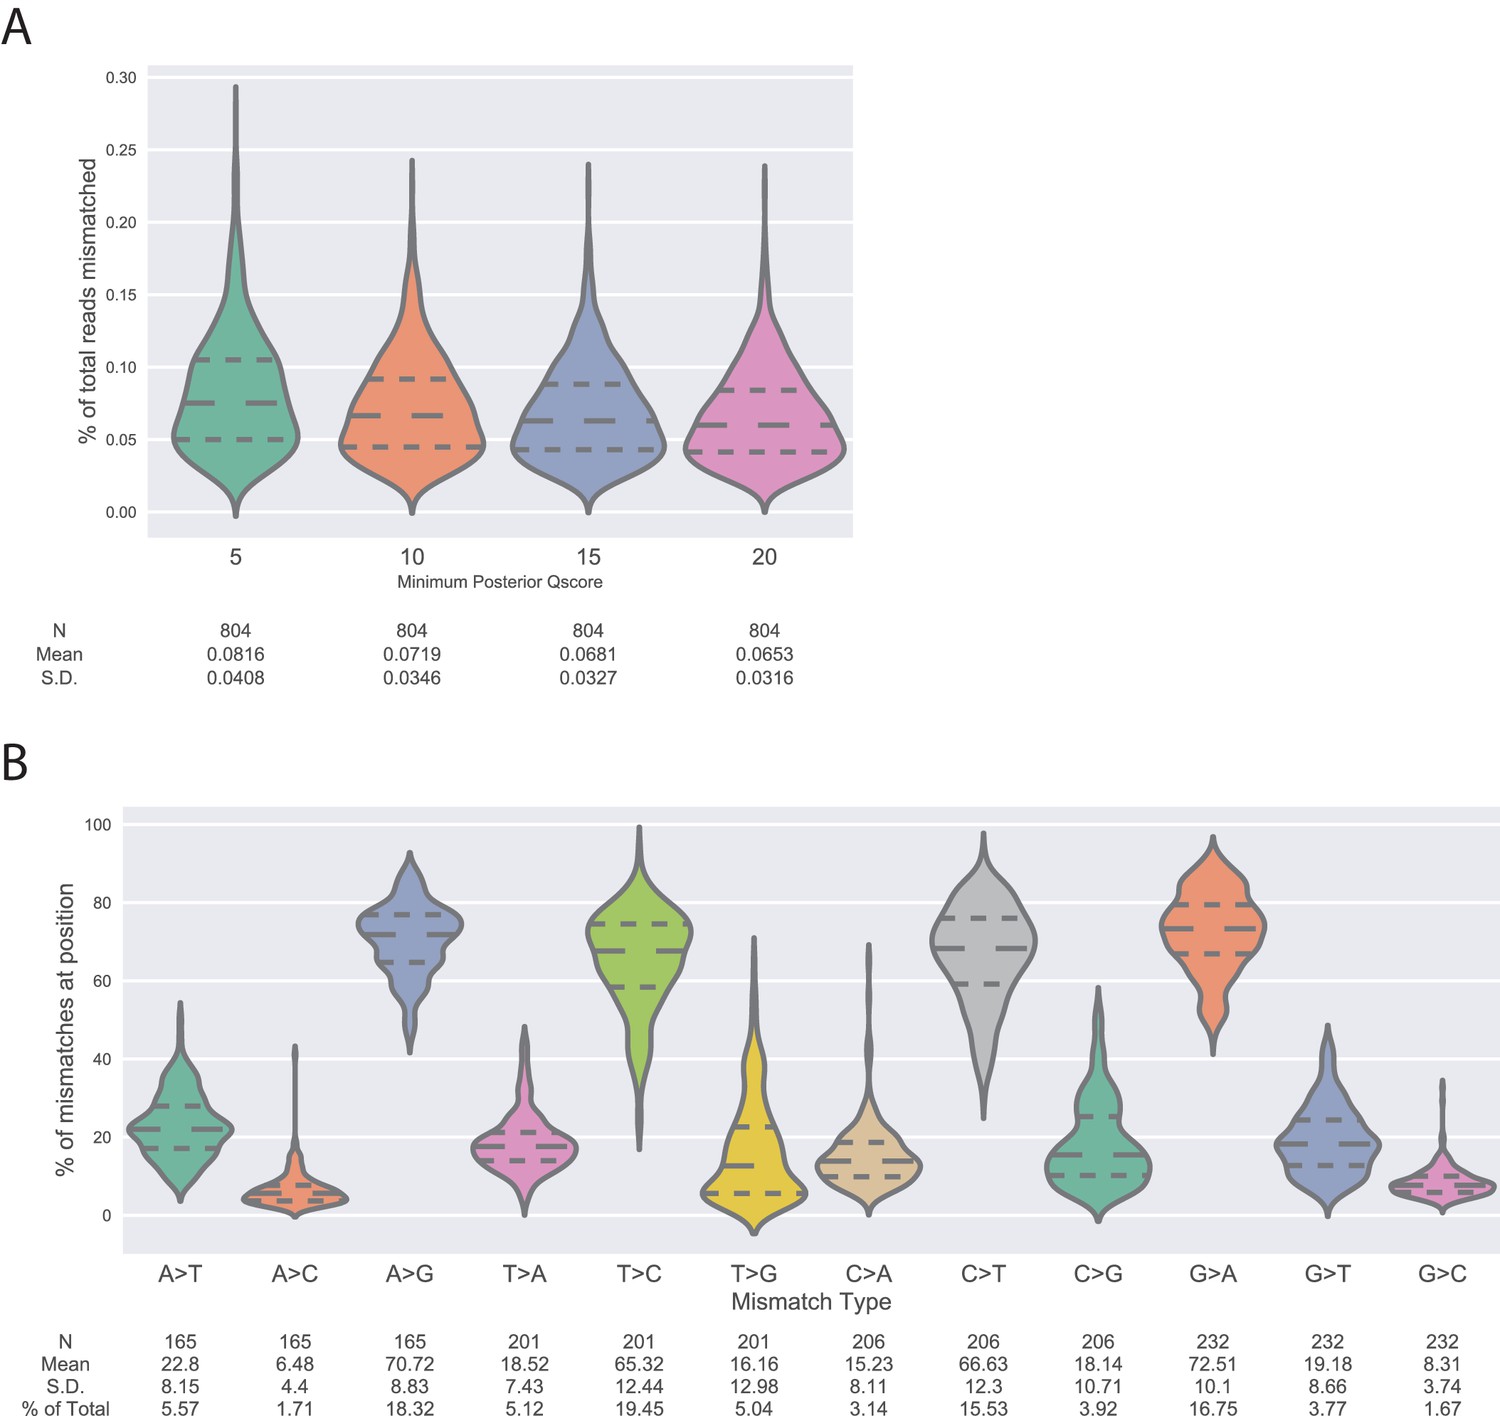
Measurement of deep sequencing error rates using sequencing data of wtVIM-2 DNA.
(A) Violin plots showing the distribution of positional error rates observed in wtVIM-2 reads that pass filtering by having less than 20 mismatches between the forward and reverse reads and a minimum posterior Quality (Phred) score (5, 10, 15 or 20) at every read position. The positional error rate is calculated for every nucleotide position (804 positions in the VIM-2 gene) as the number of mutations divided by the total number of reads. The number of observations, distribution mean and standard deviation are listed below the x-axis. (B) Violin plots showing the distribution of proportions of specific mutations occurring due to sequencing error in the wtVIM-2 reads given a certain starting nucleotide. The proportions are calculated by dividing the number of a specific mutation at each wtVIM-2 nucleotide position (A > G, A > T, A > C) by the total number of mutations observed at that position. The proportions mutations arising from the same starting nucleotide sum to 100%. The number of observations, distribution mean, standard deviation and percentage of all observed mutations are listed below the x-axis.
Figure 1—figure supplement 4
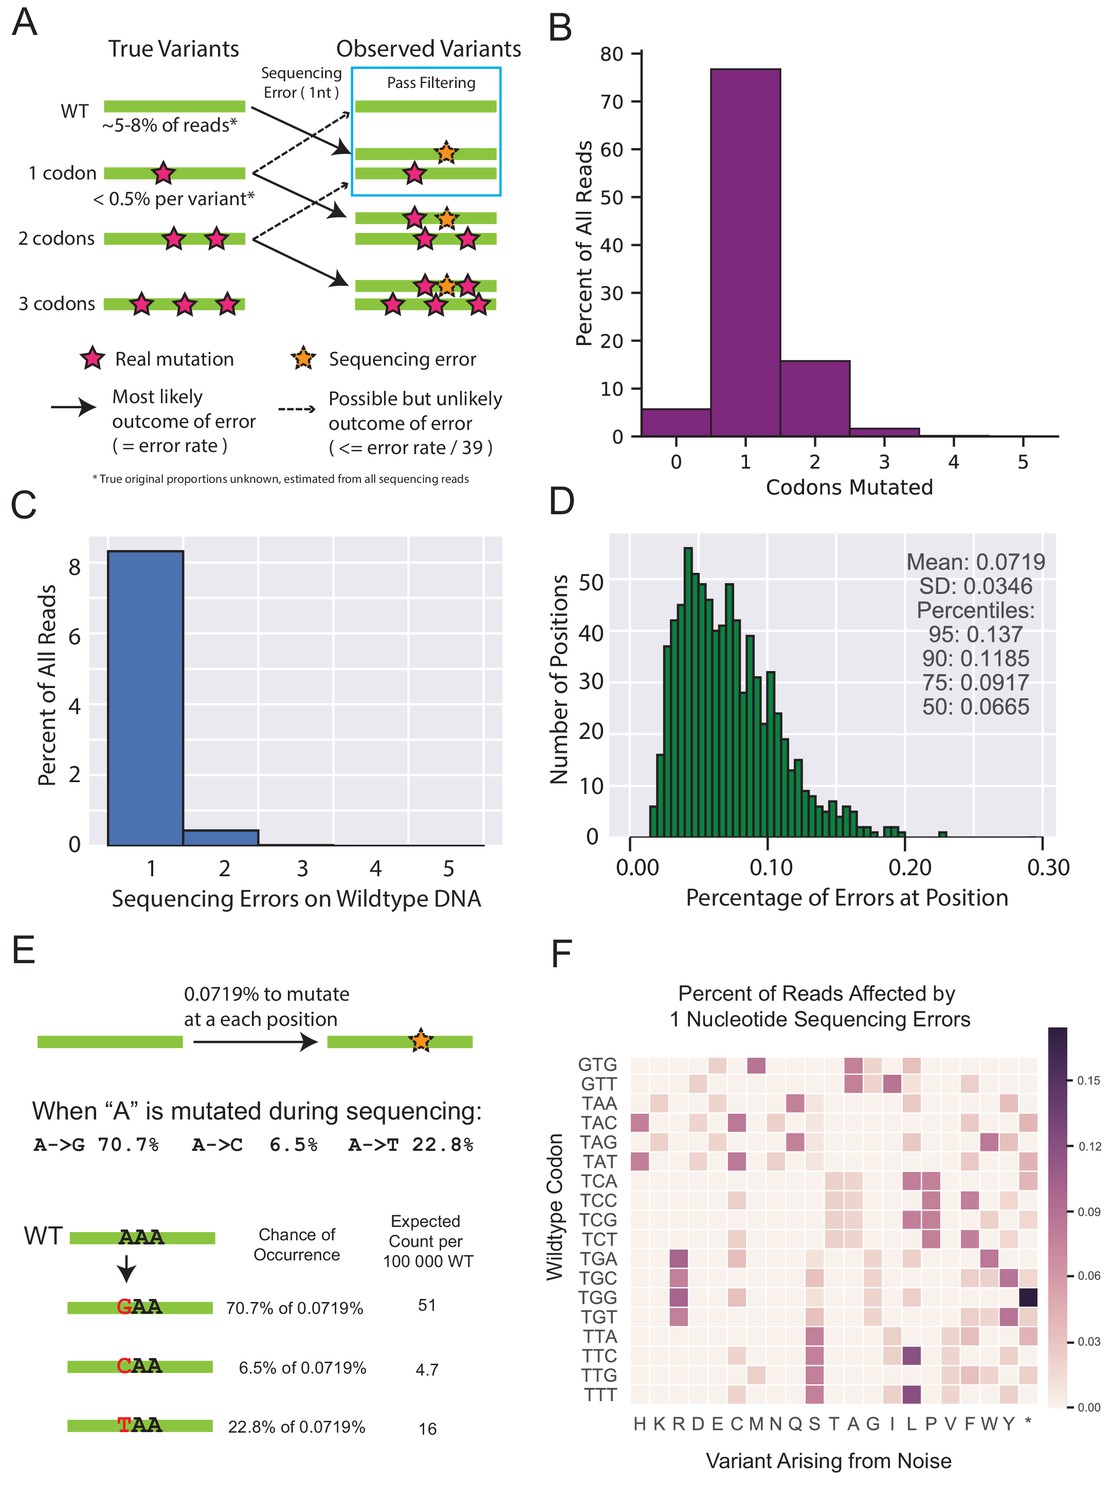
Rationale and support for estimating deep sequencing noise for filtering variants observed in non-selected libraries.
(A) The diagram depicts the main flow of variation when sequencing error is added on top of the existing variation. Sequences that are completely wt for every nucleotide occupy a sizeable portion of every library sequenced, and are also capable of being converted to any single amino acid variant through sequencing errors. Variants that already have a mutation are more likely to be mutated in a second codon and are likely to be filtered out. Additionally, single codon variants are already observed at fairly low frequencies, and are expected to contribute a negligible proportion of noise to any other variant. (B) A representative distribution of codon mutations in one of the selected libraries found after sequencing. In most cases at least 5% of the library is completely wt, indicated by those without any codon mutations. (C) A representative distribution of the proportion of reads that have a given number of sequencing errors observed when sequencing wtVIM-2 DNA. The reads with 0 sequencing errors are not shown to allow the smaller values to be resolved more clearly. (D) Distribution of sequence errors per position for every position in sequenced wtVIM-2 DNA after forward and reverse sequences have been merged and filtered by quality. This is the same distribution as the violin plot in Figure 1—figure supplement 3A with a minimum posterior quality score cutoff of 10. (E) An example calculation of expected noise arising from sequencing errors. (F) Visualization of the calculation shown in E) when applied across an entire all wt codons. The expected chance for each wt codon to become any of the other nine codons adjacent by a single nucleotide substitution is first calculated and then aggregated at the amino acid level. Only a subset of the codons are shown as an example.
Figure 2 with 2 supplements
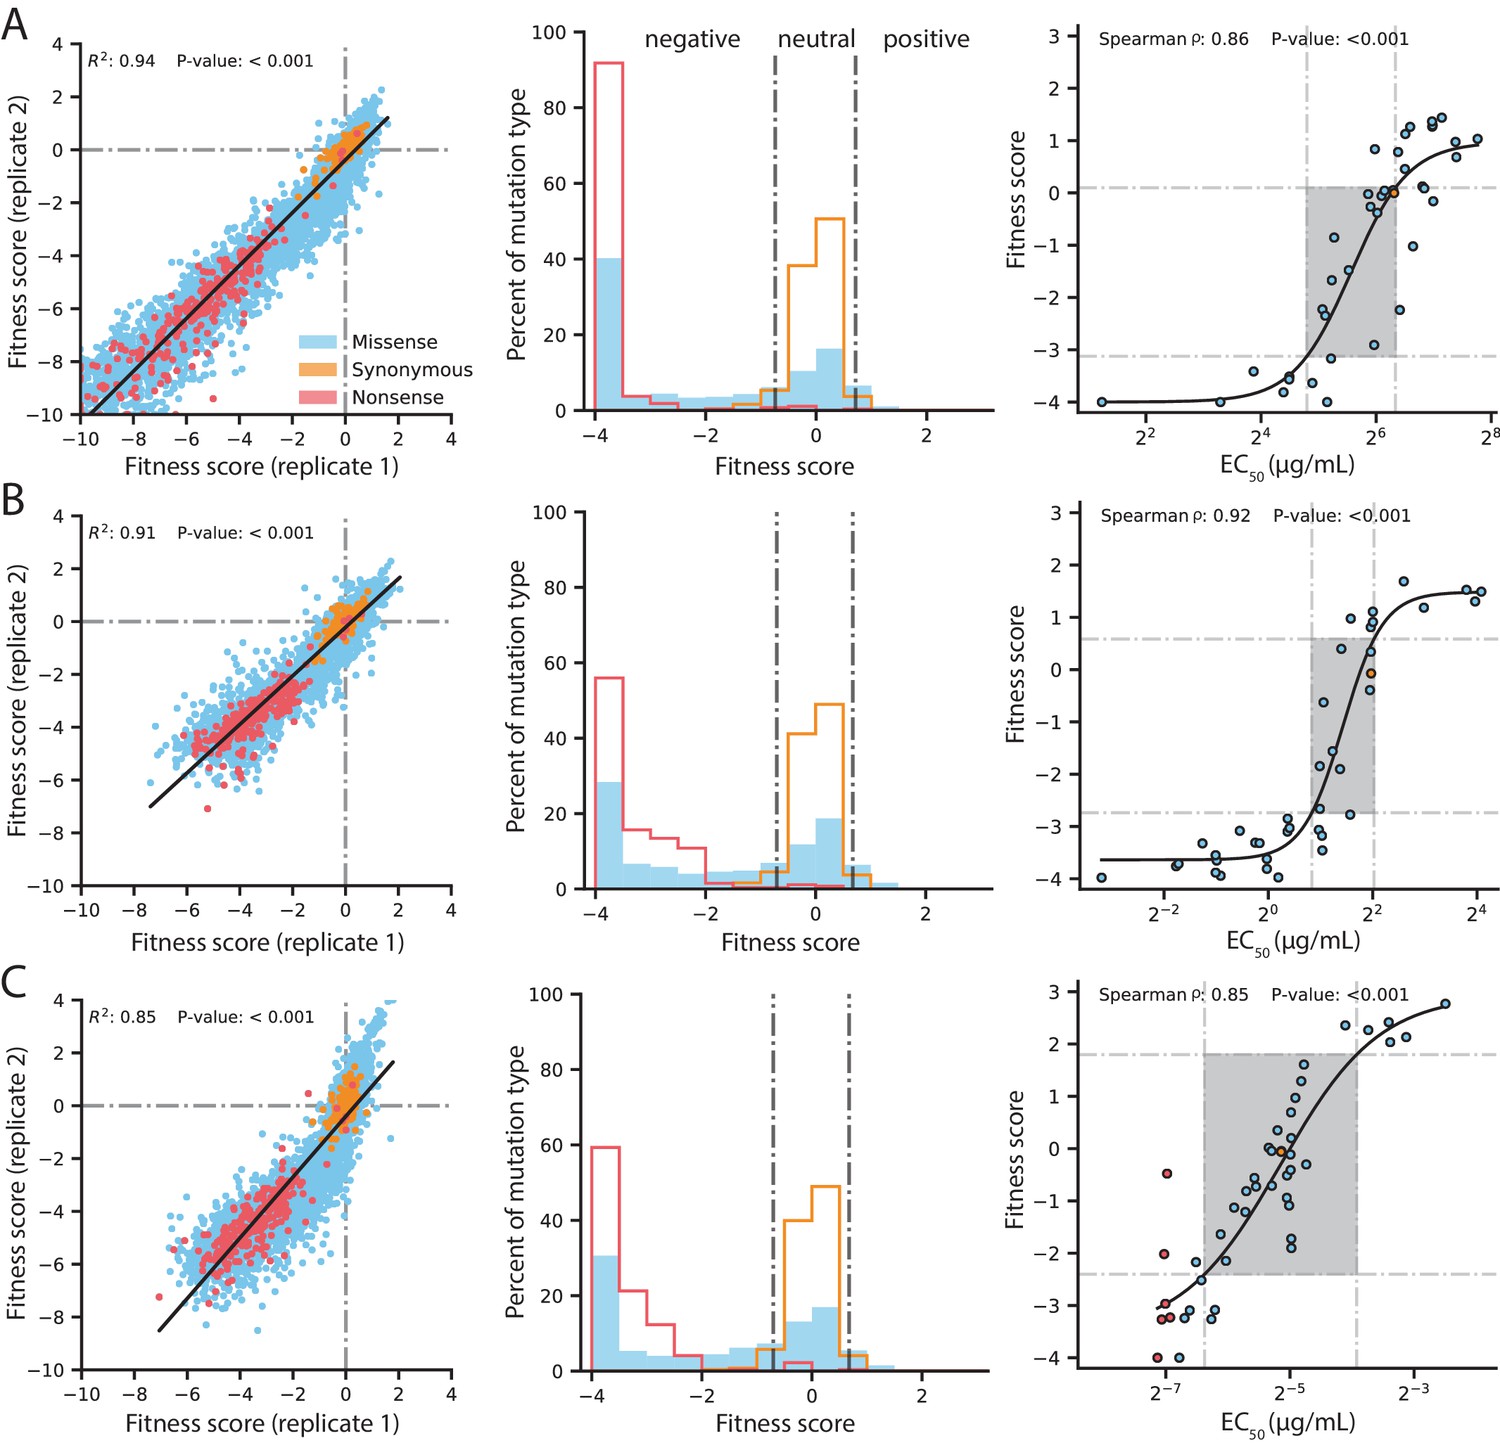
Quality control of DMS data and general mutational properties of VIM-2.
In the horizontal panels, data are shown for (A) 128 µg/mL AMP selection, (B) 4.0 µg/mL CTX selection and (C) 0.031 µg/mL MEM selection. The color legend in panel A) is shared by all panels. For each horizontal panel, the left plot shows correlation between fitness scores of all variants in the two replicates of DMS; replicate correlation of selection conditions not shown here are in Figure 2—figure supplement 1. The middle plot shows distribution of fitness effects for all variants separated into synonymous, missense and nonsense distributions, where the vertical grey lines indicate fitness score cut-offs used to classify fitness effects as positive, neutral or negative. The proportion of variants in each fitness effect category can be found in Figure 2—figure supplement 2. The right plot shows the relationship of DMS fitness scores with antibiotic resistance (EC50) of isolated variants measured in a dose-response curve; variants with resistance lower than the tested range could not be fitted for EC50, leading to EC50 values for 39 unique variants in AMP, 39 for CTX and 45 for MEM—some points are an average of the same codon or amino acid variant isolated multiple times. The filled rectangle in the background indicates the region of linear association between fitness scores and EC50. The text at the top of each plot indicates the Spearman rank-order correlation coefficient and the P-value of the correlation. Individual EC50 measurements can be found in Supplementary file 2B.
Figure 2—figure supplement 1
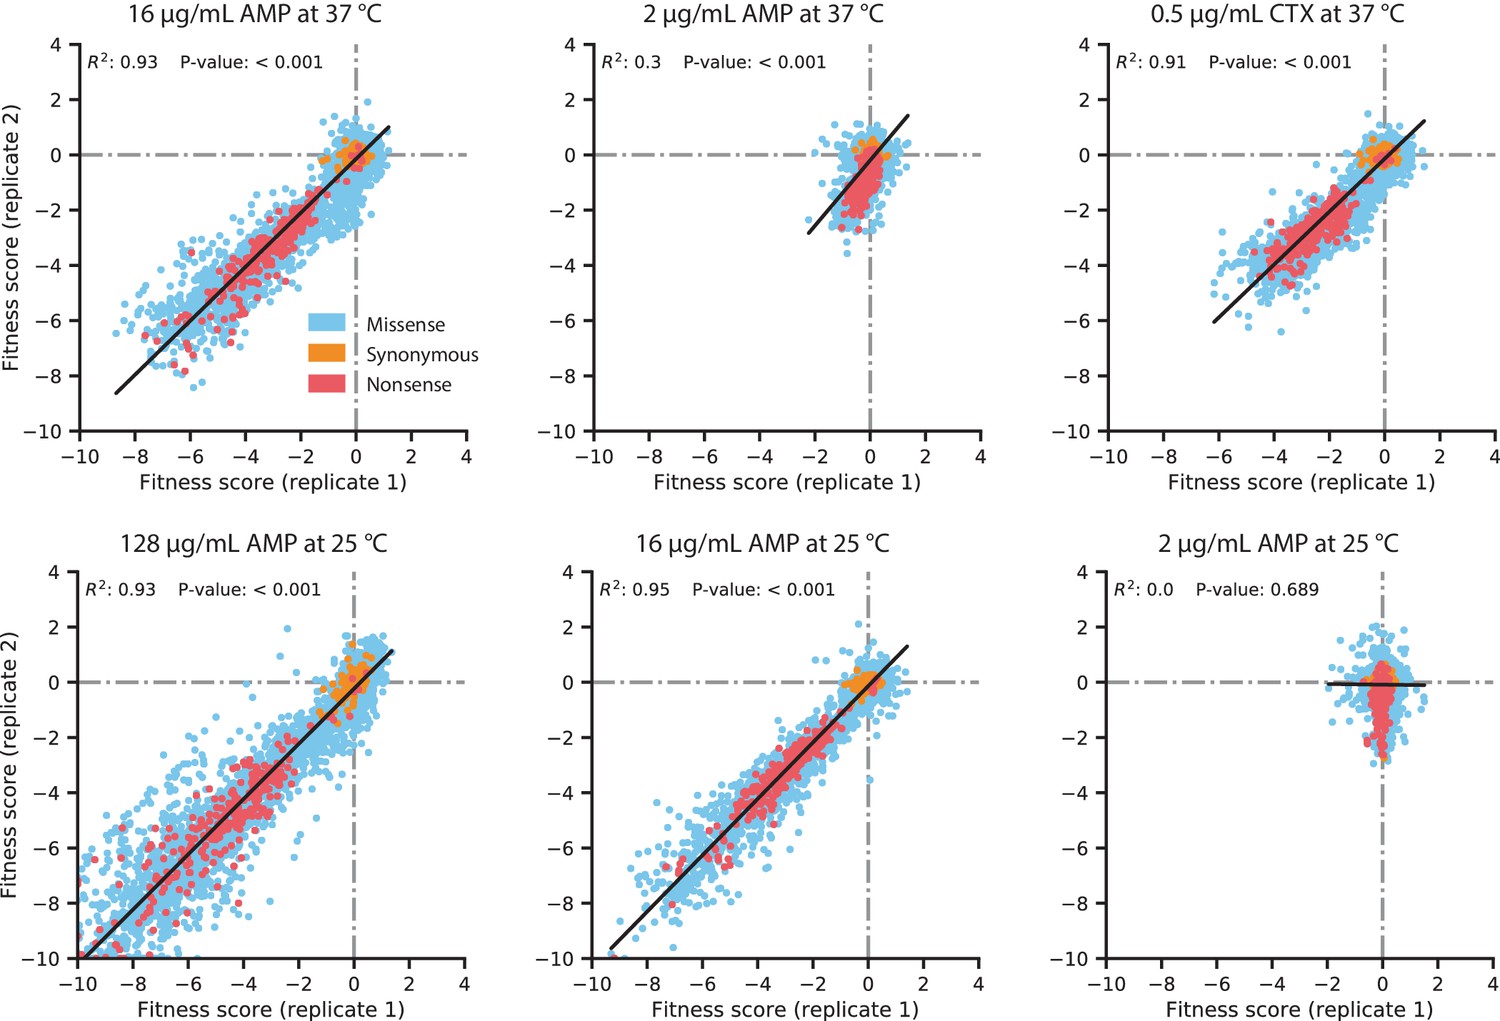
Replicate correlation of fitness scores in the DMS experiments.
The antibiotic concentration and growth temperature used for each experiment are labeled above each plot. Data points are colored by the type of amino acid mutation, as described in the legend in the top-left plot. The black line indicates the line of best fit for a linear regression between the replicates, with the R2 and P-value of the regression displayed near the top of each plot.
Figure 2—figure supplement 2
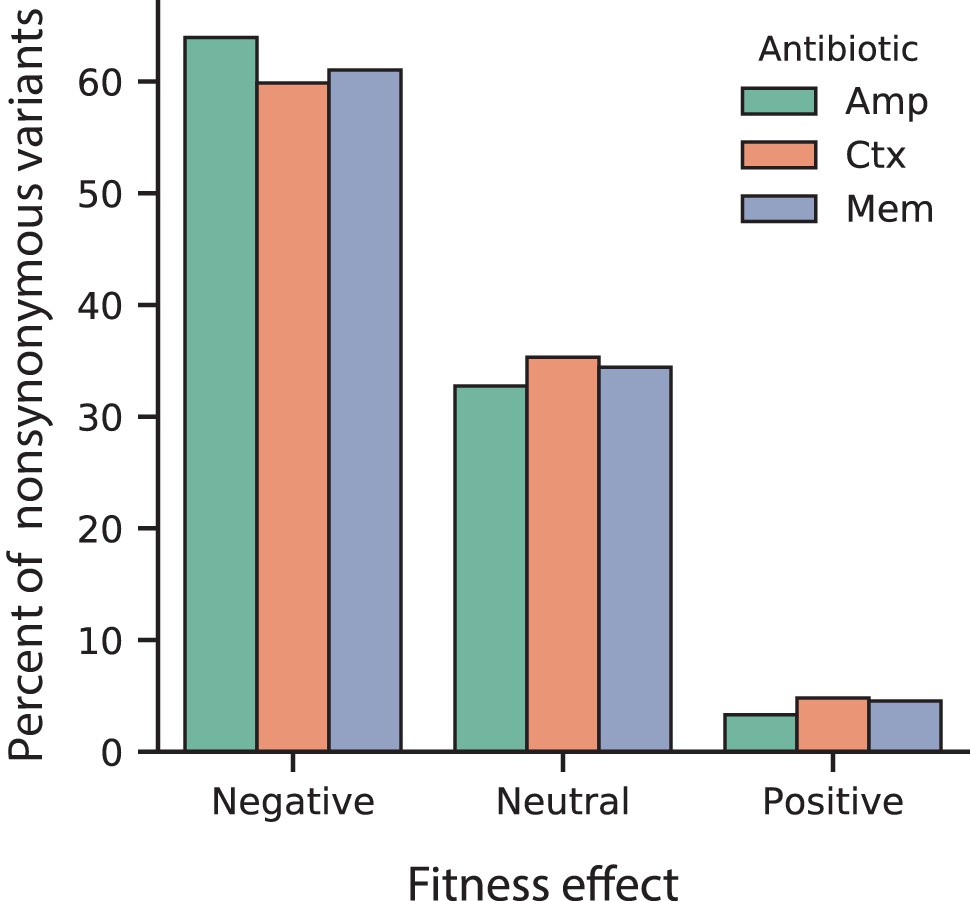
Proportion of fitness effects for VIM-2 nonsynonymous variants selected in AMP, CTX and MEM.
The proportion of variants with positive, neutral or negative fitness effects as classified for 128 µg/mL AMP, 4.0 µg/mL CTX and 0.031 µg/mL MEM.
Figure 3 with 3 supplements
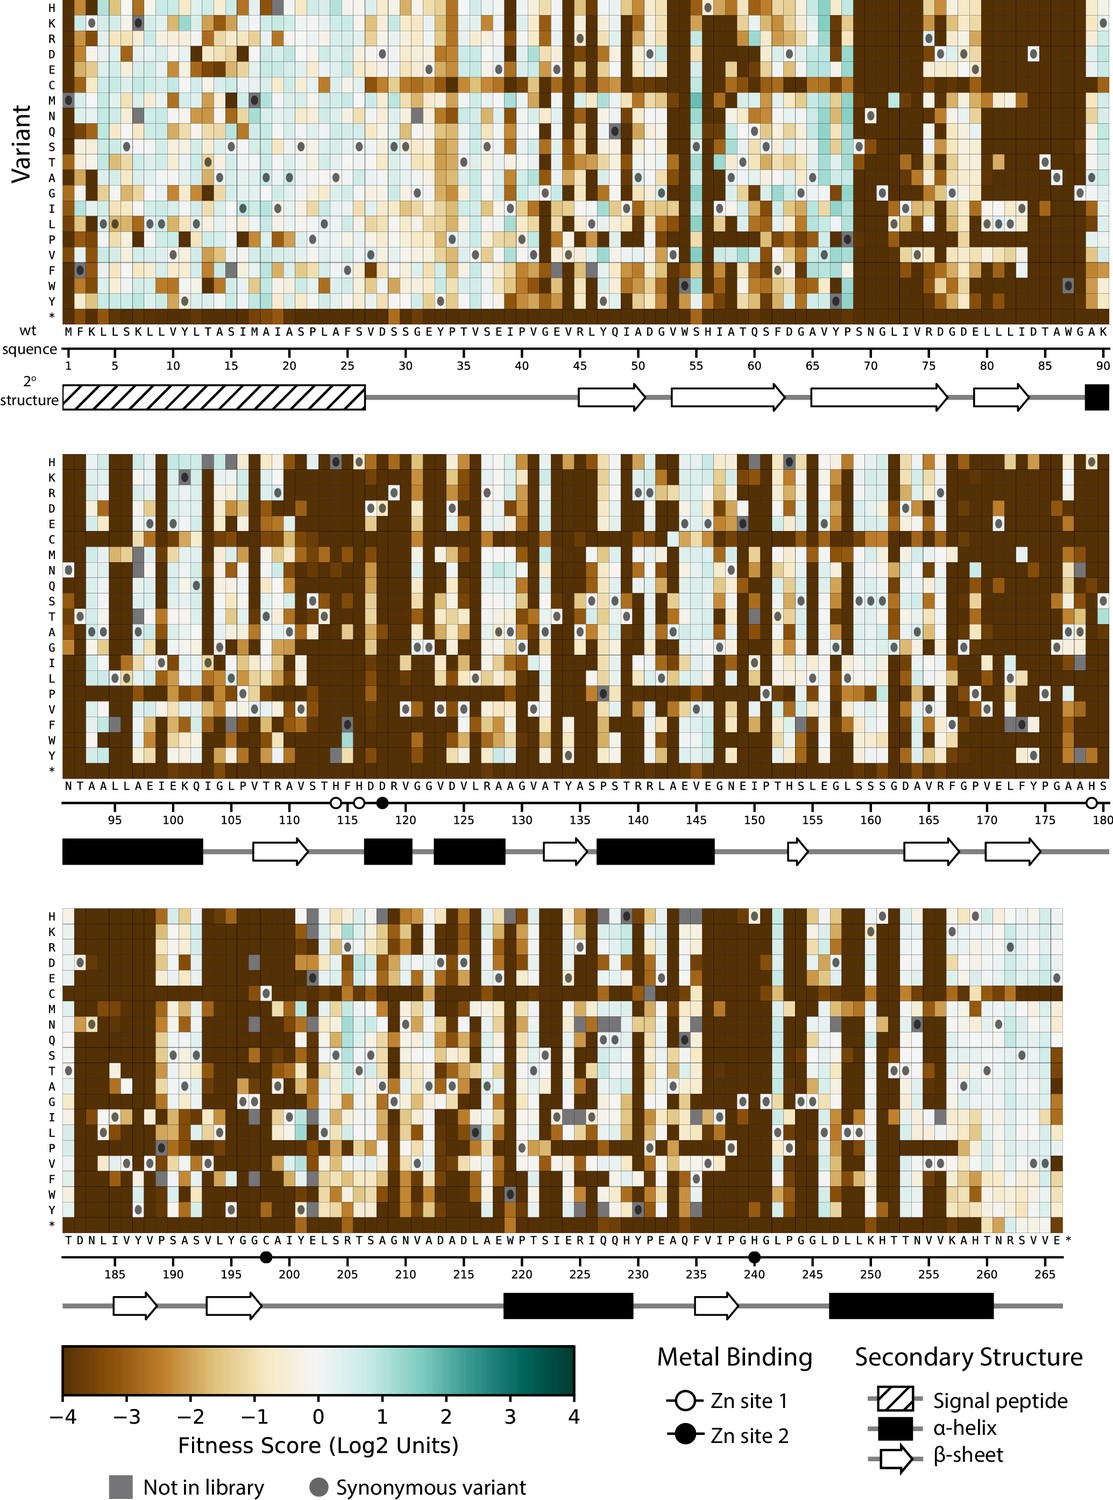
Fitness of all VIM-2 single amino acid variants under 128 µg/mL AMP selection.
Each cell in the heat map represents the fitness score of a single amino acid variant. Synonymous variants are indicated by dark grey circles and variants that are not present in the library are in grey. The x-axis under the heat map indicates the wt residue and position (the six active site metal binding residues are highlighted as circles), while the y-axis indicates the variant residue at that position. The secondary structure of the wtVIM-2 crystal structure (PDB: 4bz3) is displayed below the heat map. Corresponding heat maps for variants under selection with CTX and MEM can be found in Figure 3—figure supplement 1 and Figure 3—figure supplement 2, respectively. A comparison between the distributions of variants with each mutated amino acid can be found in Figure 3—figure supplement 3. All fitness data used in the heat maps can be found in Supplementary file 2A.
Figure 3—figure supplement 1

Fitness of all VIM-2 single amino acid variants under 4.0 µg/mL CTX selection.
Each cell in the heat map represents the fitness score of a single amino acid variant. Synonymous variants are indicated as dark grey circles and variants that are not present in the library are in grey. The x-axis under the heat map indicates the wt residue and position (the six active site metal binding residues are highlighted as circles), while the y-axis indicates the variant residue at that position. The secondary structure of the wtVIM-2 crystal structure (PDB: 4bz3) is displayed below the heat map.
Figure 3—figure supplement 2
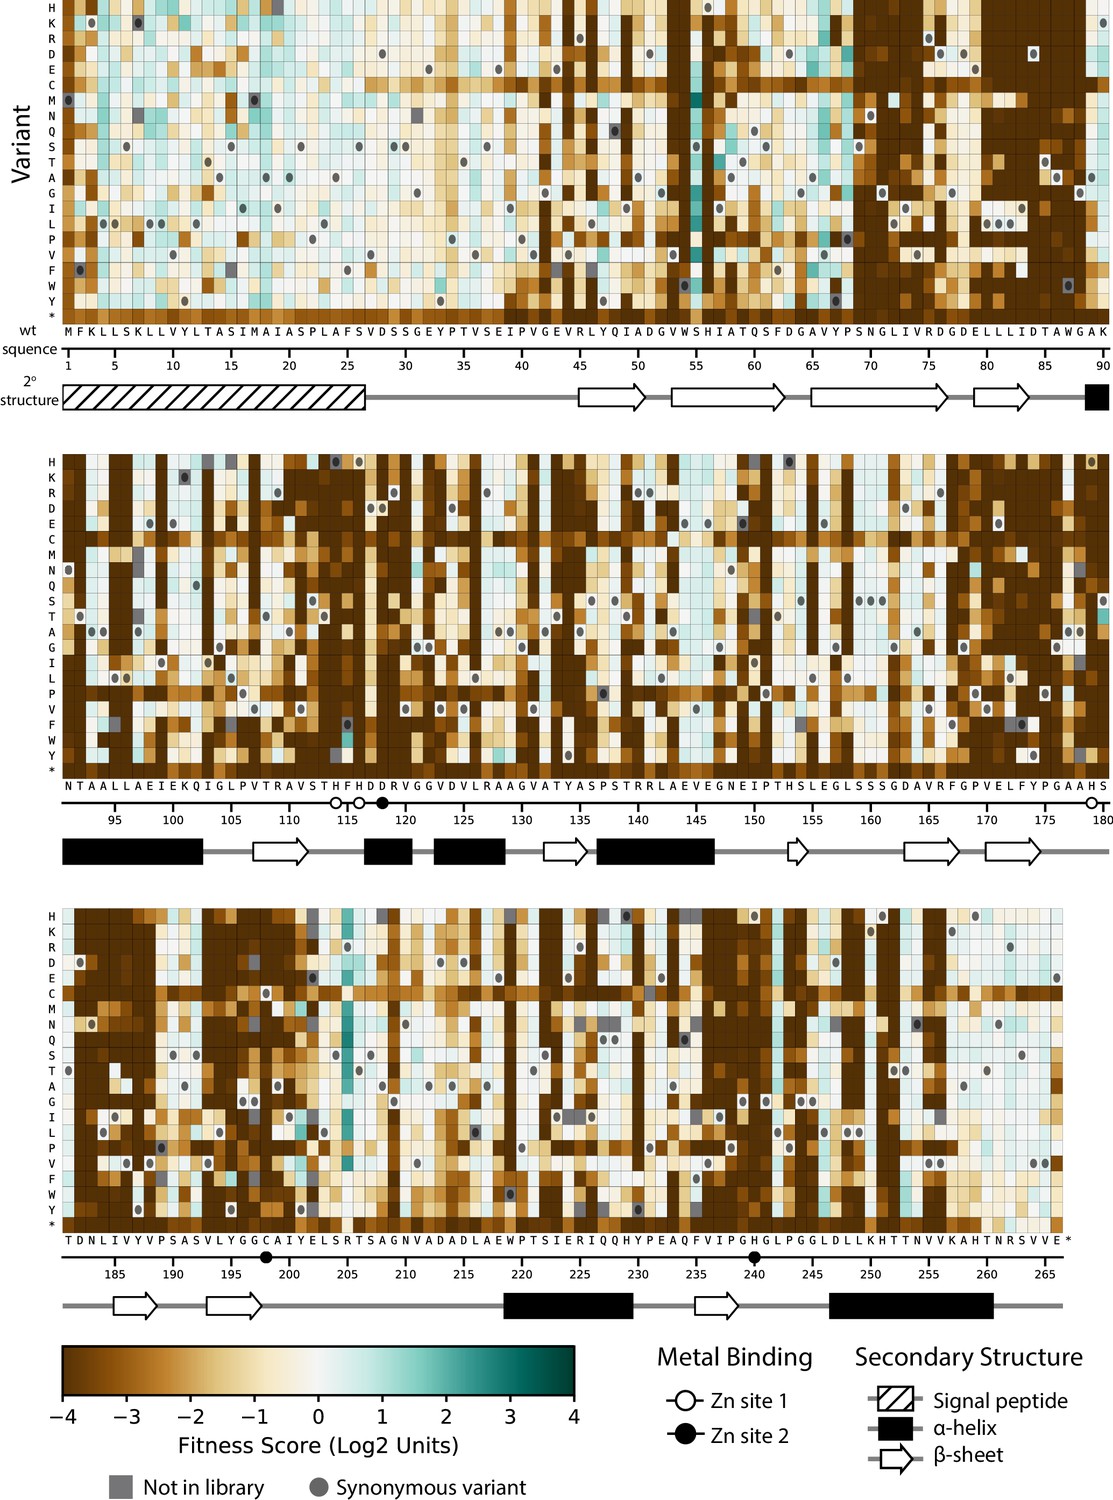
Fitness of all VIM-2 single amino acid variants under 0.031 µg/mL MEM selection.
Each cell in the heat map represents the fitness score of a single amino acid variant. Synonymous variants are indicated as dark grey circles and variants that are not present in the library are in grey. The x-axis under the heat map indicates the wt residue and position (the six active site metal binding residues are highlighted as circles), while the y-axis indicates the variant residue at that position. The secondary structure of the wtVIM-2 crystal structure (PDB: 4bz3) is displayed below the heat map.
Figure 3—figure supplement 3
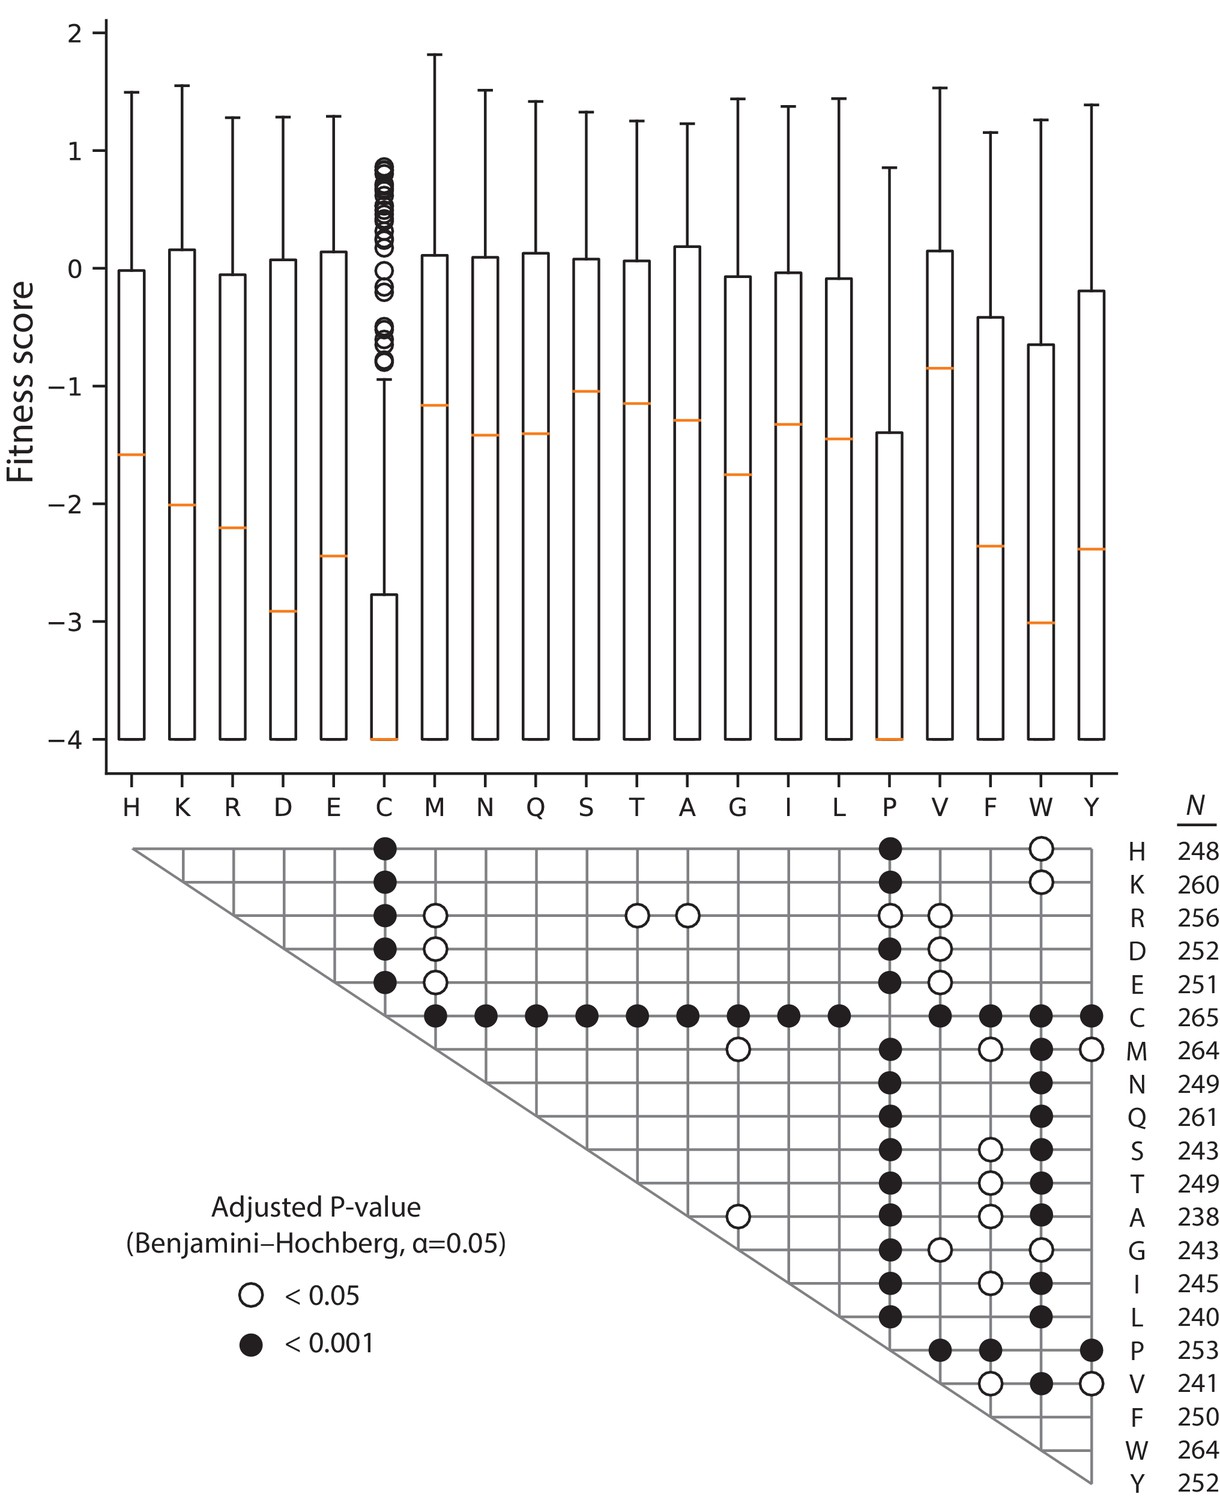
Comparison of fitness score by variant residue in 128 µg/mL AMP.
The box and whisker plots depict the distribution of fitness scores for all missense variants mutated to the indicated amino acid, with the median highlighted by the orange line. The grid below the plot shows the significant results of two-tailed Mann-Whitney U tests between all pairwise combinations of amino acid fitness score distributions; the P-values are adjusted for false discovery rate using the Benjamini-Hochberg procedure with α = 0.05 (190 tests total). The number of variants in each amino acid distribution is shown to the right of the grid.
Figure 4
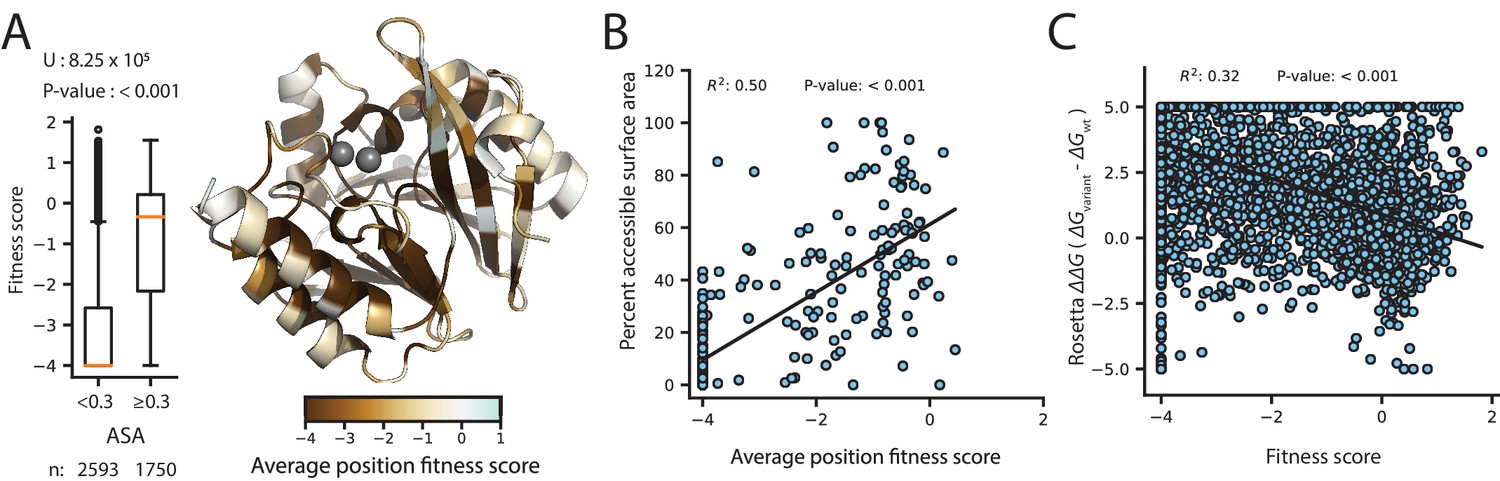
Correlation of fitness with structural attributes.
Fitness scores are from DMS at 128 µg/mL AMP selection. (A) To the right, is the crystal structure of wtVIM-2 (PDB: 4bz3) colored by the average fitness of 20 amino acid mutations at each position. The inset to the left shows distributions of fitness scores for variants at positions with relative accessible surface area (ASA) <0.3 in wtVIM-2 or positions with ASA ≥0.3, with the number of variants in each distribution shown at the bottom and the results of a two-tailed Mann-Whitney U test between the two distributions at the top. (B) The correlation between accessible surface area and the average fitness of 20 amino acid mutations at each position. (C) The correlation between the changes in folding energy predicted by Rosetta and the DMS fitness scores for all variants.
Figure 5 with 3 supplements
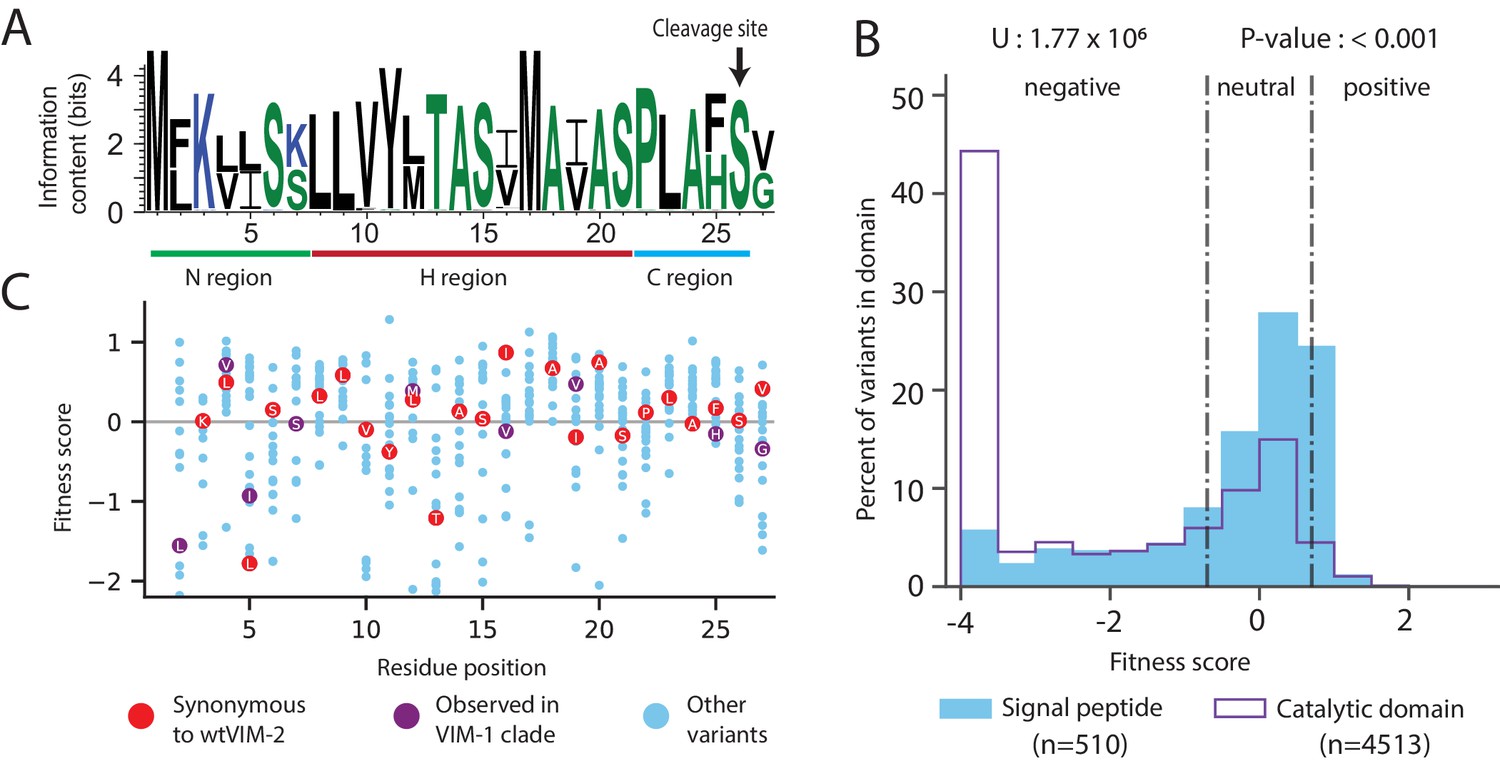
Conservation patterns and fitness scores in the signal peptide.
(A) Sequence logo of the signal peptide region aligned across all VIM natural variants generated using WebLogo (https://weblogo.berkeley.edu/). Positions with two major naturally occurring residues are conserved differences between the VIM-1 and VIM-2 clades (clades are defined in Figure 8—figure supplement 1). (B) The distribution of fitness effects of all missense variants, separated into signal peptide variants and catalytic domain variants. The number of variants in each distribution are displayed in the legend below the distributions. The results of a two-tailed Mann-Whitney U test between the distributions are displayed above the distributions. (C) DMS fitness scores of all variants at each position of the signal peptide. Synonymous variants of wtVIM-2 and conserved variants observed in the VIM-1 clade are highlighted as labelled circles. Additional information on codon variant fitness in the signal peptide can be found in Figure 5—figure supplement 1 (replicate correlation of codon variant fitness), Figure 5—figure supplement 2 (heat map of codon variant fitness) and Figure 5—figure supplement 3 (correlation between RNA folding energy and codon variant fitness).
Figure 5—figure supplement 1
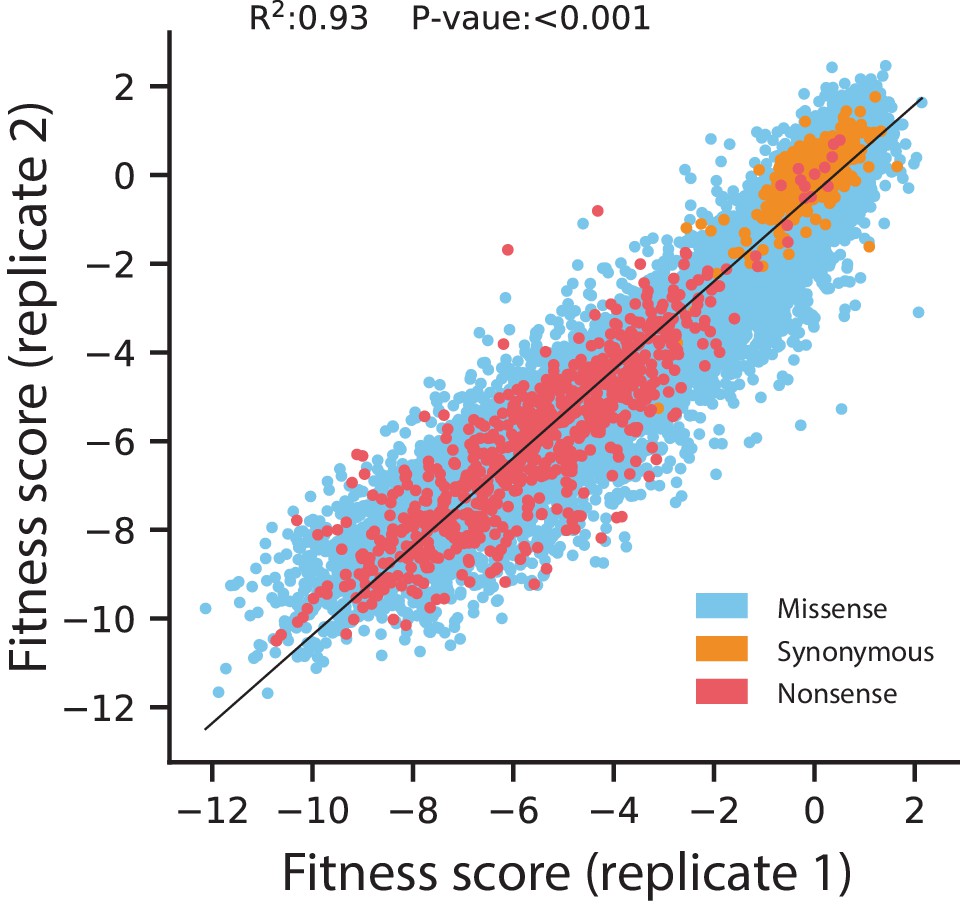
Replicate correlation for fitness scores of all codon variants under selection in 128 µg/mL AMP.
Data points are colored according to the type of mutation. The black line indicates the line of best fit for a linear regression between the replicates, with the R2 and P-value displayed at the top.
Figure 5—figure supplement 2
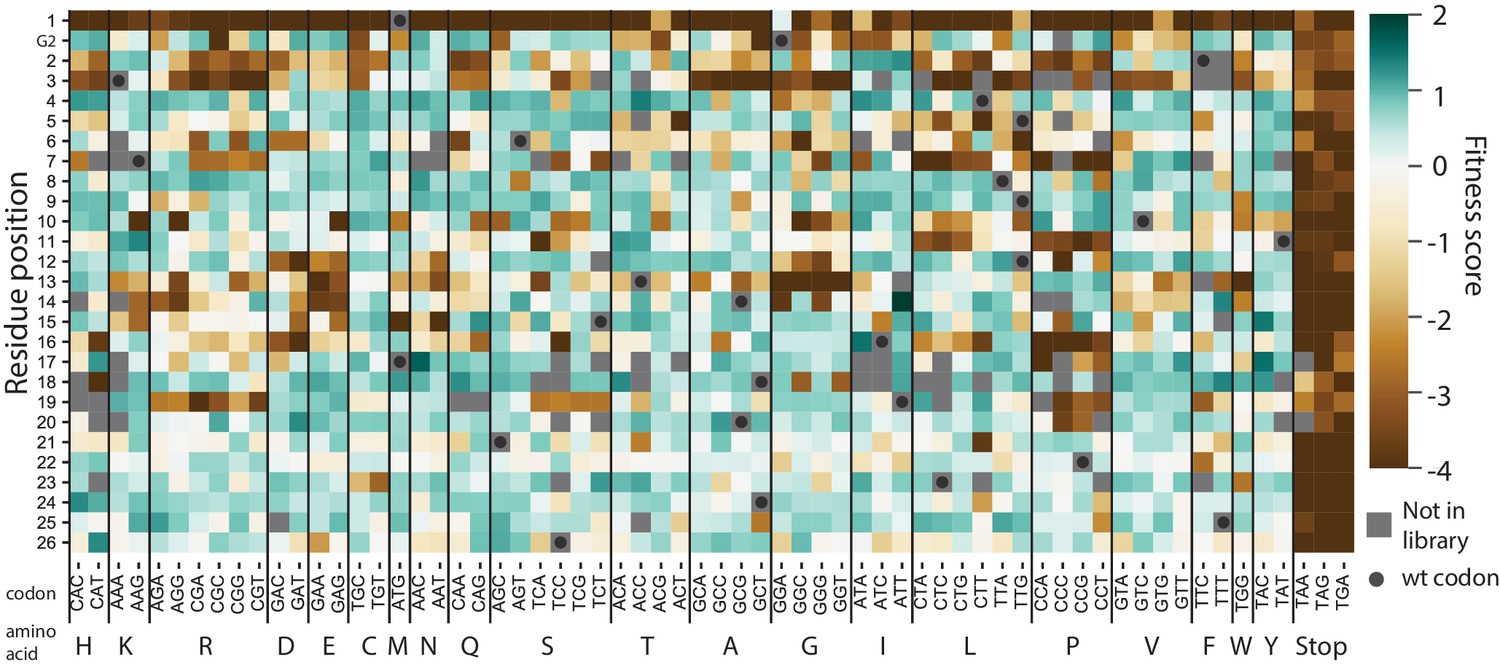
Heat map of codon variant fitness scores for the signal peptide of VIM-2 under selection in 128 µg/mL AMP.
The residue positions are indicated on the y-axis (G2 refers to the Glycine two in the inhouse sequence that is not a part of wtVIM-2), while the codon mutations are indicated on the x-axis.
Figure 5—figure supplement 3
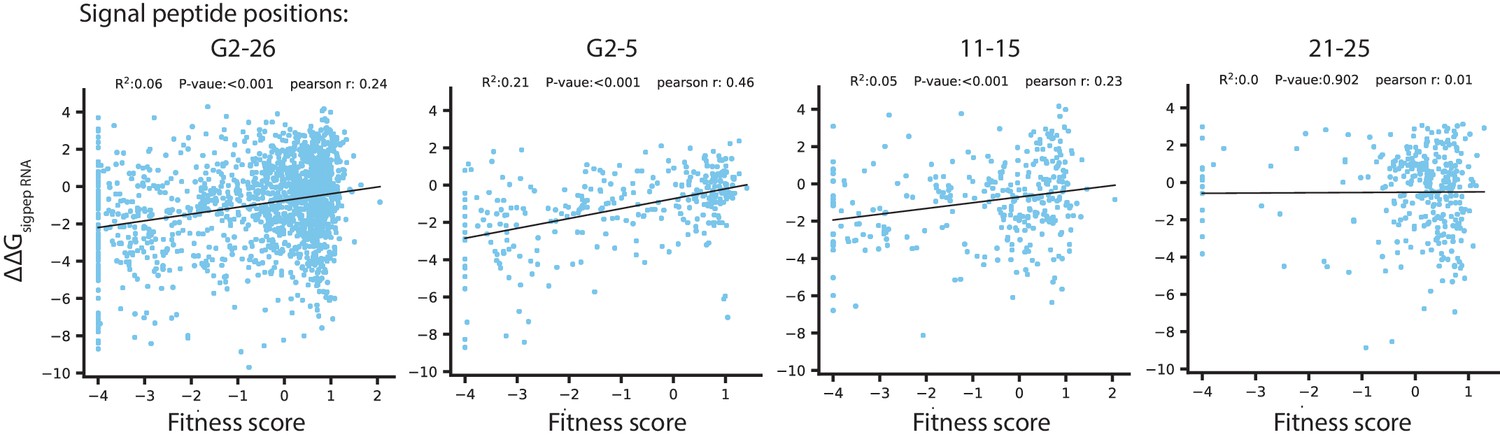
Correlation between the fitness score under selection in 128 µg/mL AMP and predicted ΔΔG of RNA folding for codon variants in the signal peptide.
The energy ΔΔG are calculated as the difference in ΔG between wtVIM-2 mRNA transcript and the transcript of each signal peptide codon-variant (isolating the contributions from the 5’ UTR and the signal peptide region). The ΔΔG is normalized to a multiple of the thermal energy factor kT, such that a ΔΔG of 1 indicates a 1 × kT increase in ΔG of the variant over the wt. The label above each plot indicates the positions where codon variants were considered for the correlation (G2 refers to the Glycine two in the inhouse sequence that is not a part of wtVIM-2).
Figure 6 with 2 supplements

Distribution of mutational tolerance and temperature dependence of wtVIM-2 residues.
(A) Scatterplots comparing fitness scores under selection at 25°C and 37°C (128 µg/mL AMP). Variants within the classified positions are highlighted in dark blue while all variants are plotted in grey for reference. (B) Proportion of residues in the wtVIM-2 catalytic domain that have been classified into each behavioral category. (C–D) The wtVIM-2 crystal structure (PDB: 5yd7) is colored by the behavioral classifications, the active-site zinc ions are colored in lime green. (C) View of the spacial distribution of temperature dependence in wtVIM-2, with residues depicted as spheres. The upper row depicts all residues, while the lower row depicts only essential and temperature dependent residues. (D) Cartoon representation of wtVIM-2 with metal-binding residues shown as sticks. All classifications can be found in Supplementary file 2F. Additional analysis of temperature dependence can be found in Figure 6—figure supplement 1 (correlation of Rosetta ΔΔG with temperature dependence) and Figure 6—figure supplement 2 (proportion of sidechain-backbone hydrogen bonding by temperature dependence).
Figure 6—figure supplement 1
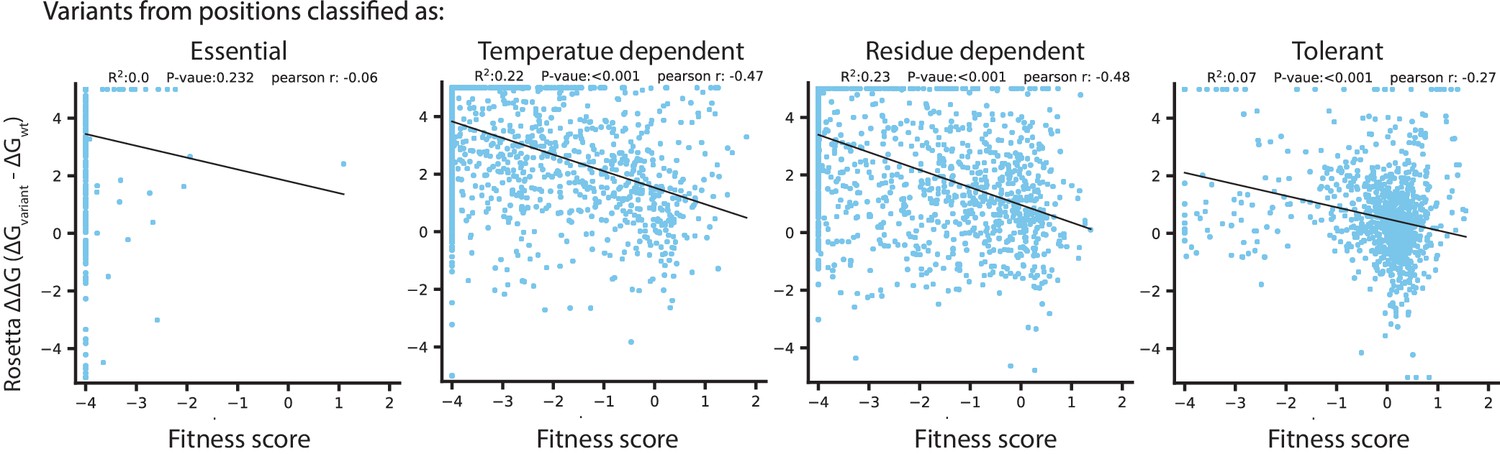
Rosetta ΔΔG in relation to temperature dependence classifications.
In each plot, Rosetta ΔΔG is correlated with fitness score for amino acid variants from the catalytic domain, in positions with the temperature dependence classification indicated at the top.
Figure 6—figure supplement 2
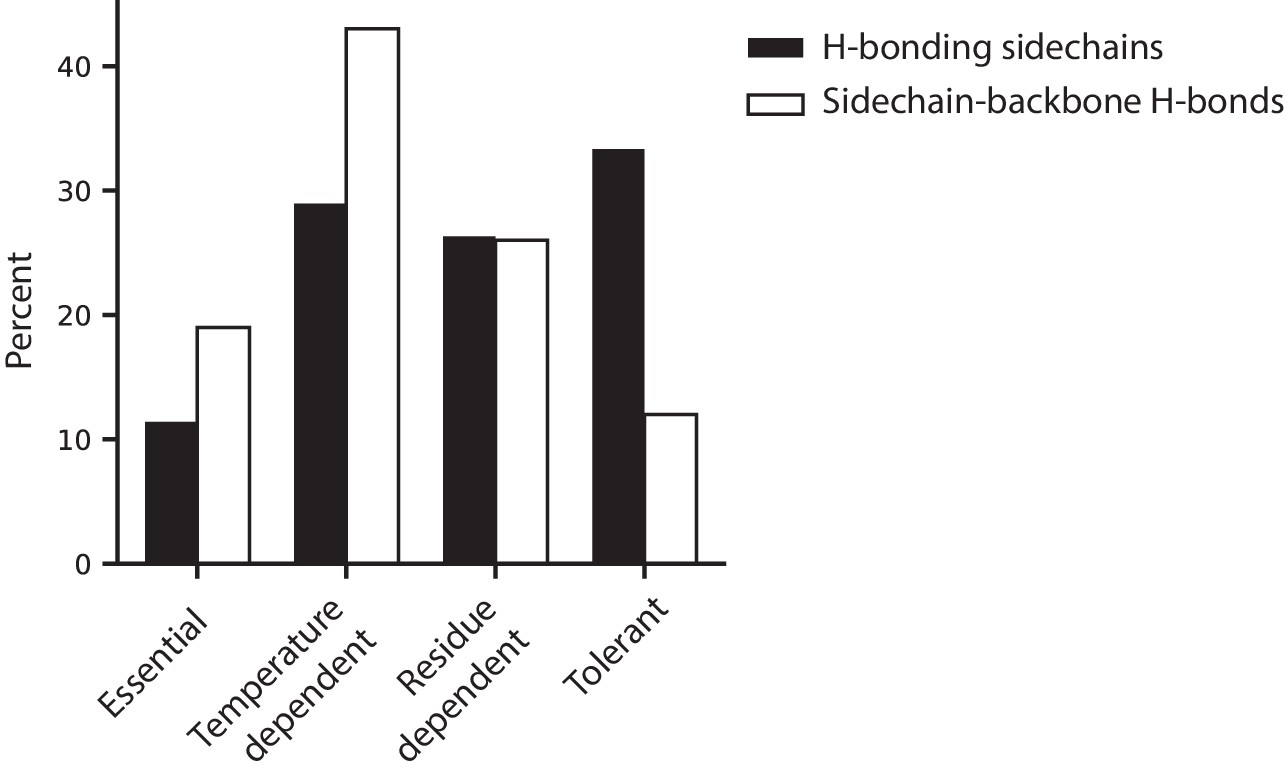
Hydrogen bonding behavior in relation to temperature dependence classifications.
A comparison of proportion of h-bonding sidechains to the proportion of sidechain-backbone h-bonds within each temperature dependent classification (determined from the wtVIM-2 crystal structure, PDB: 5yd7). The black bars display the percentage of h-bonding sidechains within the wtVIM-2 catalytic domain (114 total) that fall within each temperature dependence classification. The white bars show the percentage of sidechain-backbone h-bonds (73 total) that are formed through sidechains of residues with the classification. All h-bonding in the 5yd7 structure can be found in Supplementary file 2G.
Figure 7 with 2 supplements
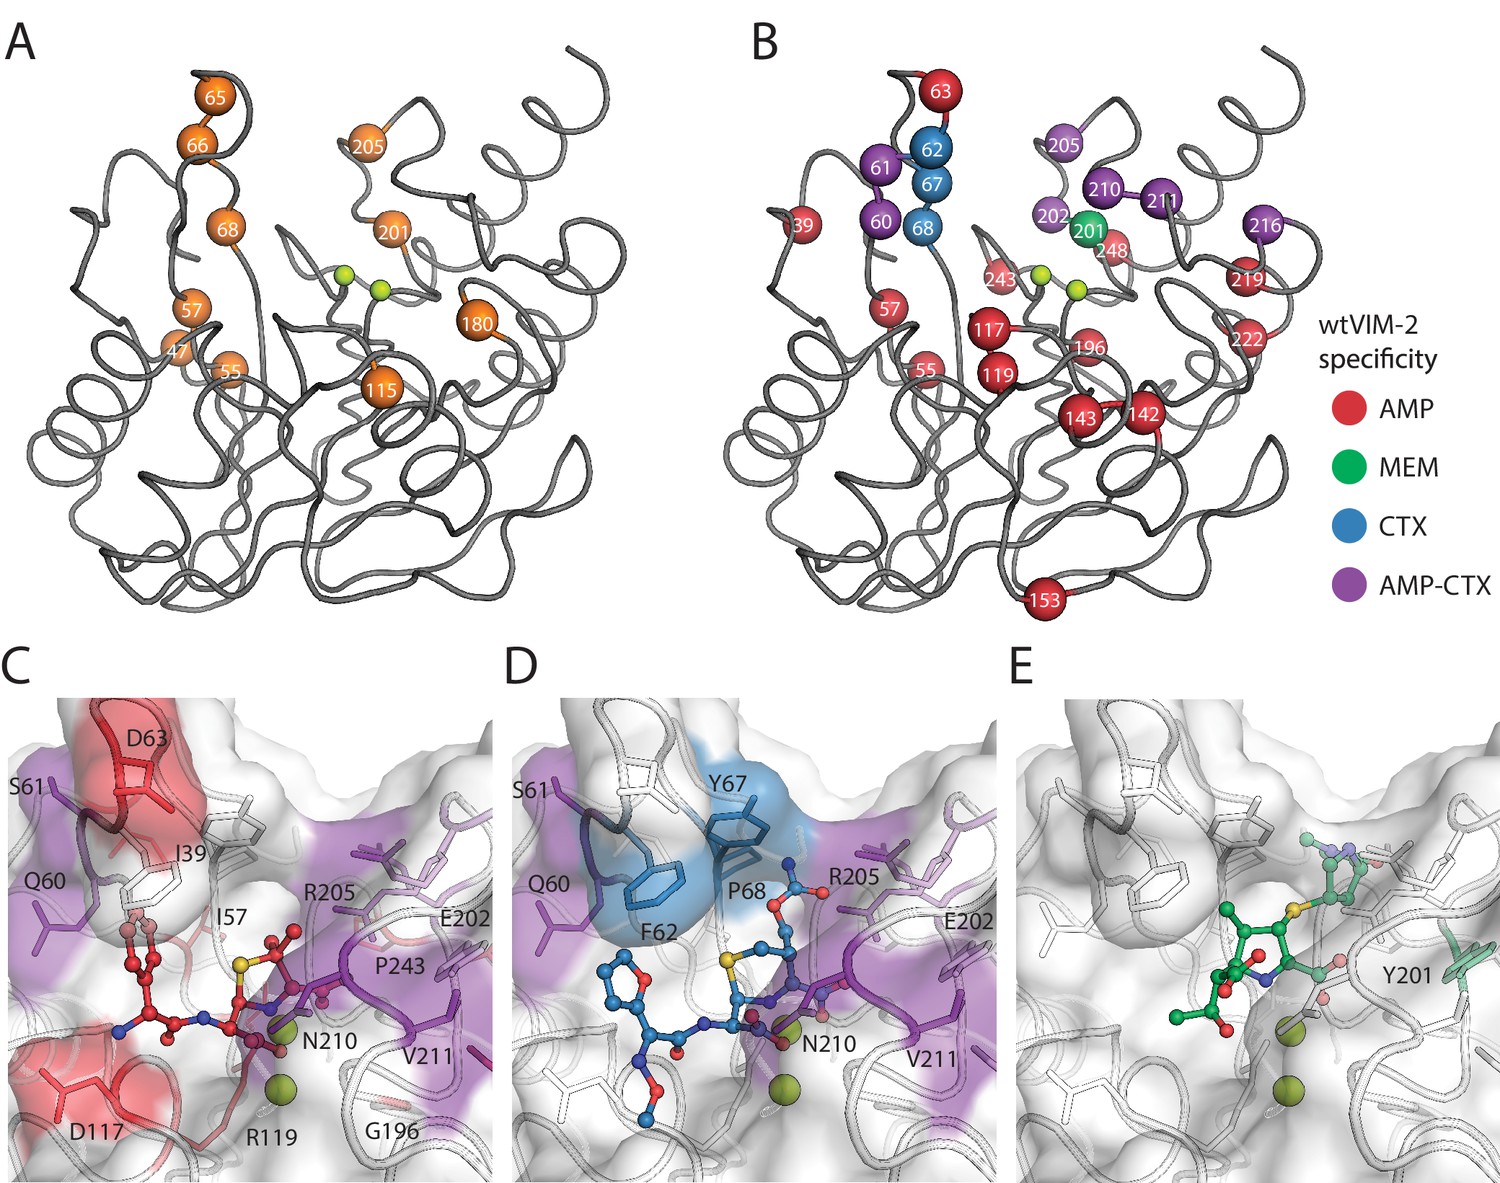
Visualization of VIM-2 specificity determining positions.
The wtVIM-2 crystal structure (PDB: 5yd7) is featured in all panels, with the active site Zn ions depicted as lime green spheres. (A) Positions with at least one globally positive mutation are highlighted as orange spheres, which are also found in Supplementary file 2H. (B) Positions classified as being responsible for specificity towards certain antibiotics in wtVIM-2 are color coded by antibiotic and highlighted as spheres; the positions are listed by specificity in Table 3. Individual variants classified as having changes in specificity are listed in Supplementary file 2I. Heat maps of specificity positions for fitness under selection in each antibiotic and fitness differences between antibiotics can be found in Figure 7—figure supplement 1. (C–E). Close-up views of the specificity residues in the active site with (C) hydrolyzed ampicillin (PDB: 4hl2), (D) cefuroxime (PDB: 4rl0) and (E) meropenem (PDB: 5n5i) from VIM-1 and NDM-1 structures that have been aligned to the wtVIM-2 structure using the active site residues. Residues are colored by the inferred substrate specificity as in B). Substrates are shown in stick and ball representation. Comparison of fitness changes with EC50 changes in individual variants are found in Figure 7—figure supplement 2.
Figure 7—figure supplement 1
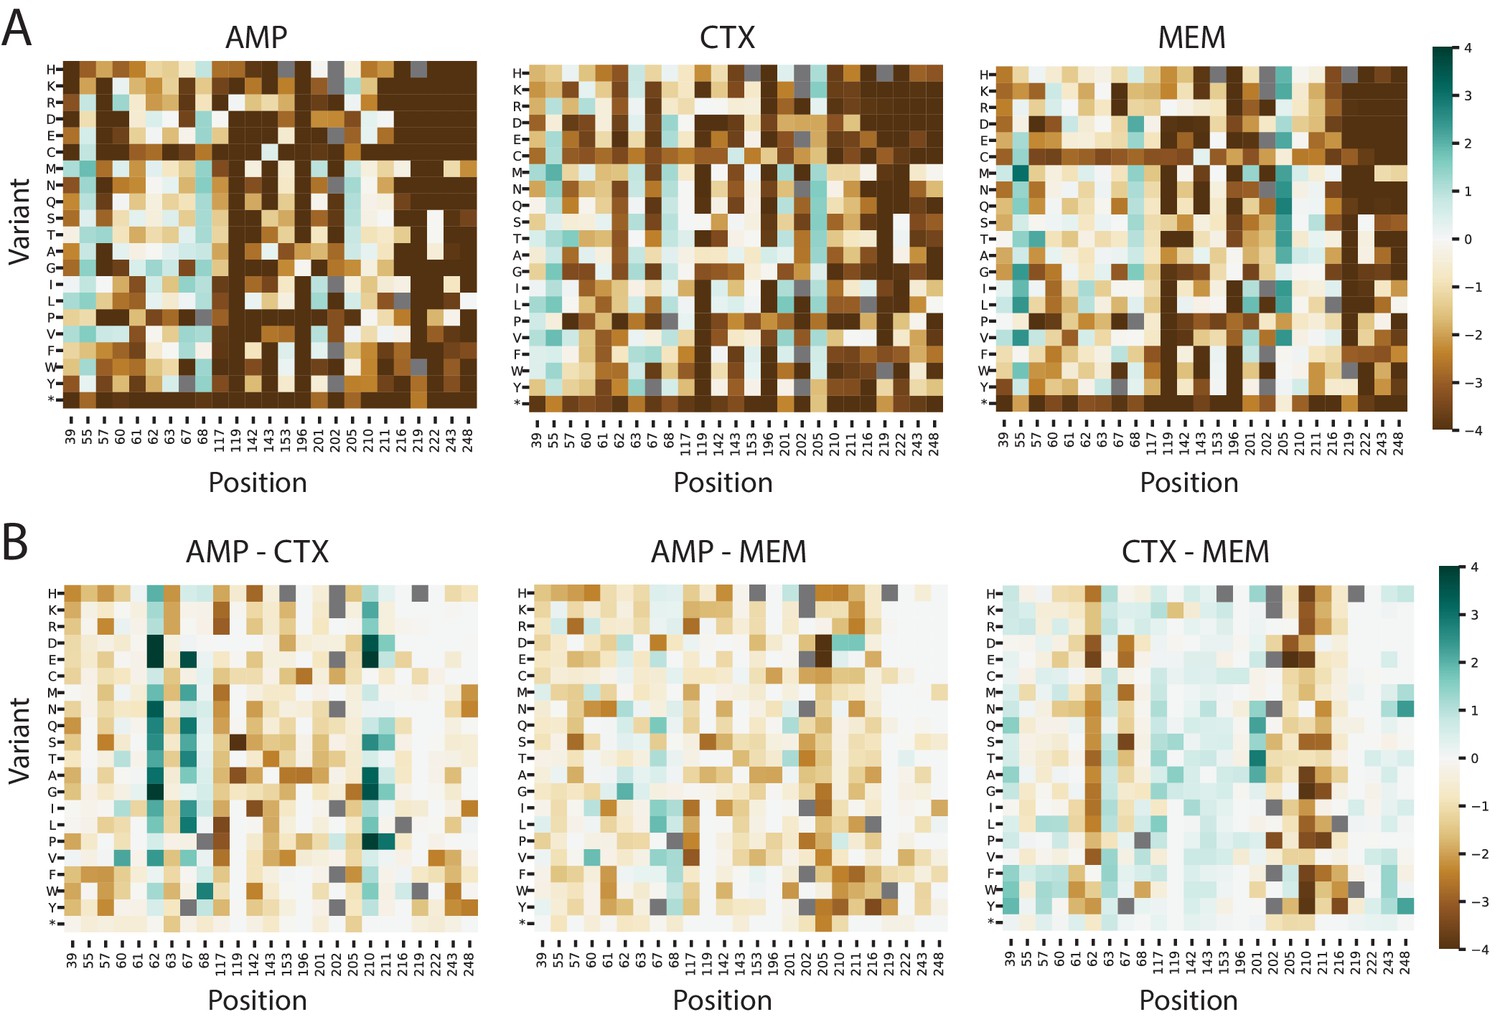
Fitness landscapes of VIM-2 at substrate specificity positions.
(A) Heat maps of variant fitness scores for variants at specificity positions in VIM-2 when selected using 128 µg/mL AMP, 4.0 µg/mL CTX and 0.031 µg/mL MEM. (B) Heat maps showing the difference in fitness scores between the conditions shown in panel A). For both panels, variants shown in grey squares are not present in the library.
Figure 7—figure supplement 2
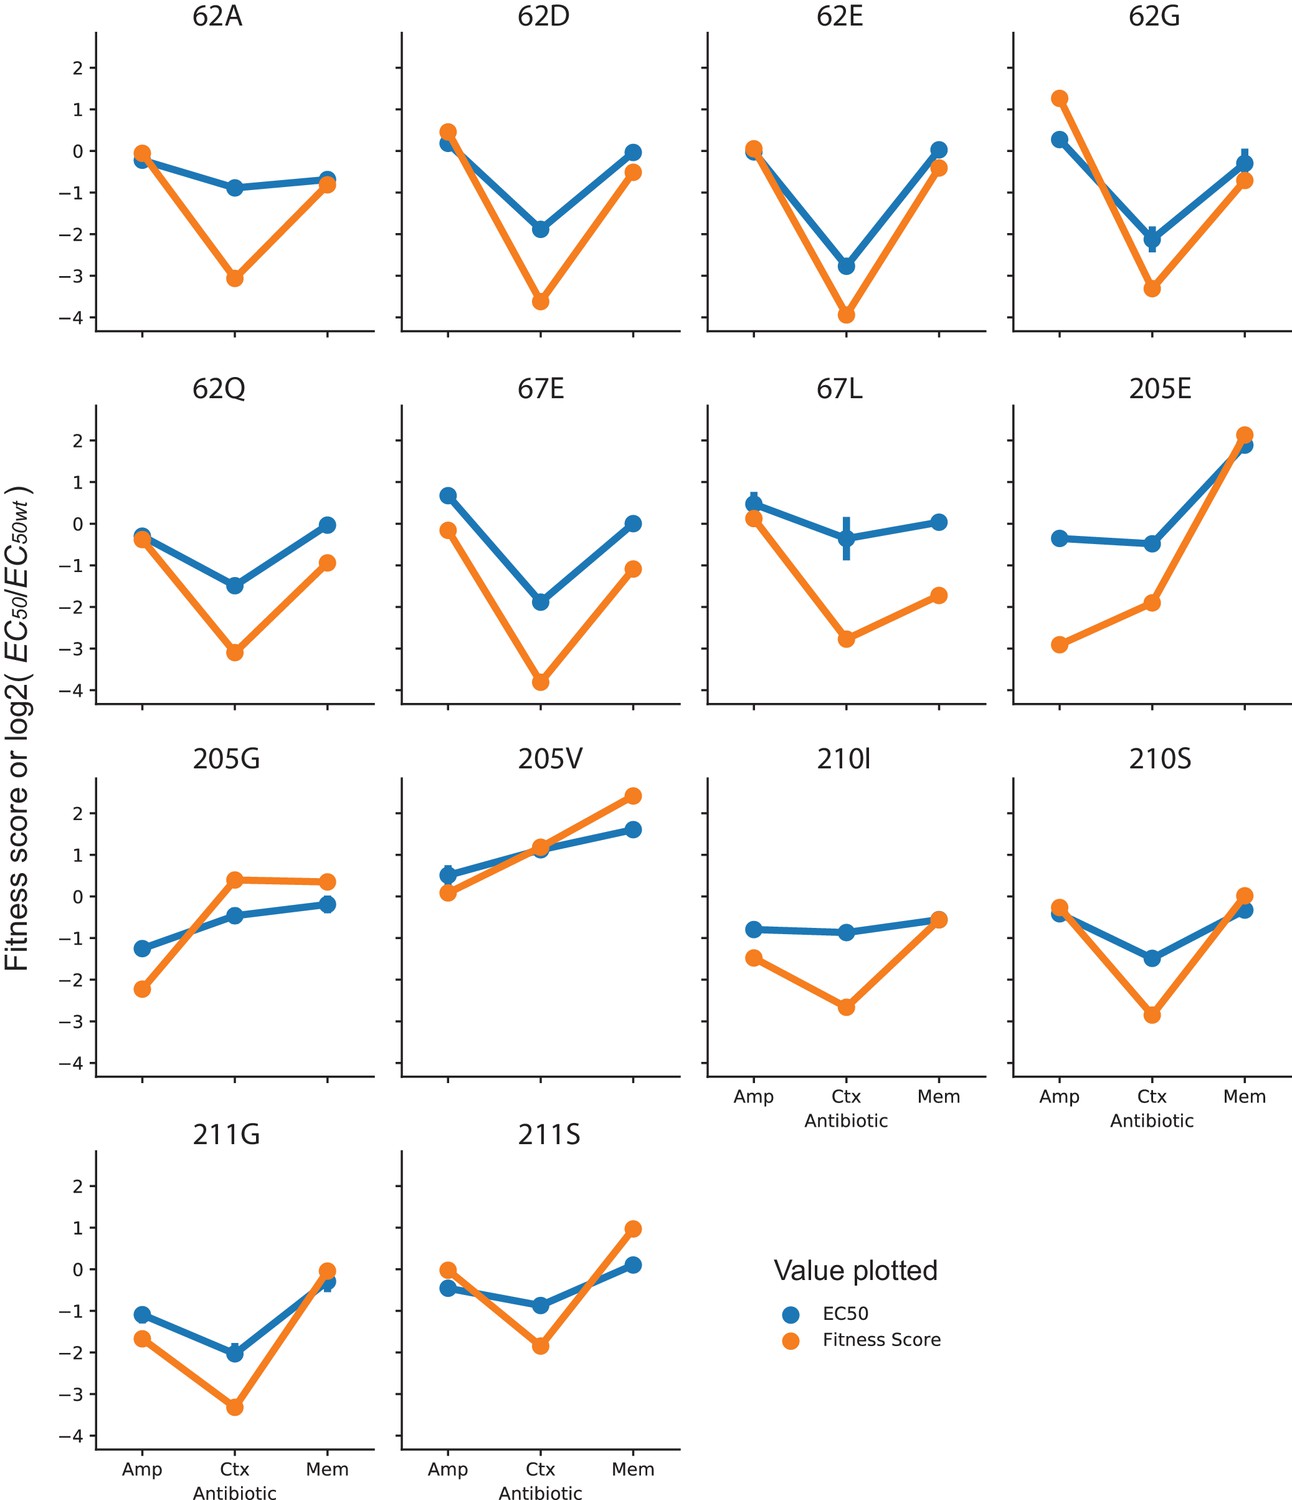
Comparison of fitness scores and EC50 of specificity variants.
Each plot shows the fitness score obtained from DMS (128 µg/mL AMP, 4.0 µg/mL CTX and 0.031 µg/mL MEM) or the EC50 fitted from a dose response curve for the variant indicated. Fitness scores are plotted directly, while EC50 values have been normalized to log2(EC50/EC50 wt) to allow them to be compared on the same scale as the fitness scores. EC50 values of the same amino acid variants (different codon variants or same codon variants isolated and measured multiple times) show the average EC50 with error bars indicating the 95% confidence interval.
Figure 8 with 2 supplements
Behavior of natural VIM variants inferred from DMS fitness.
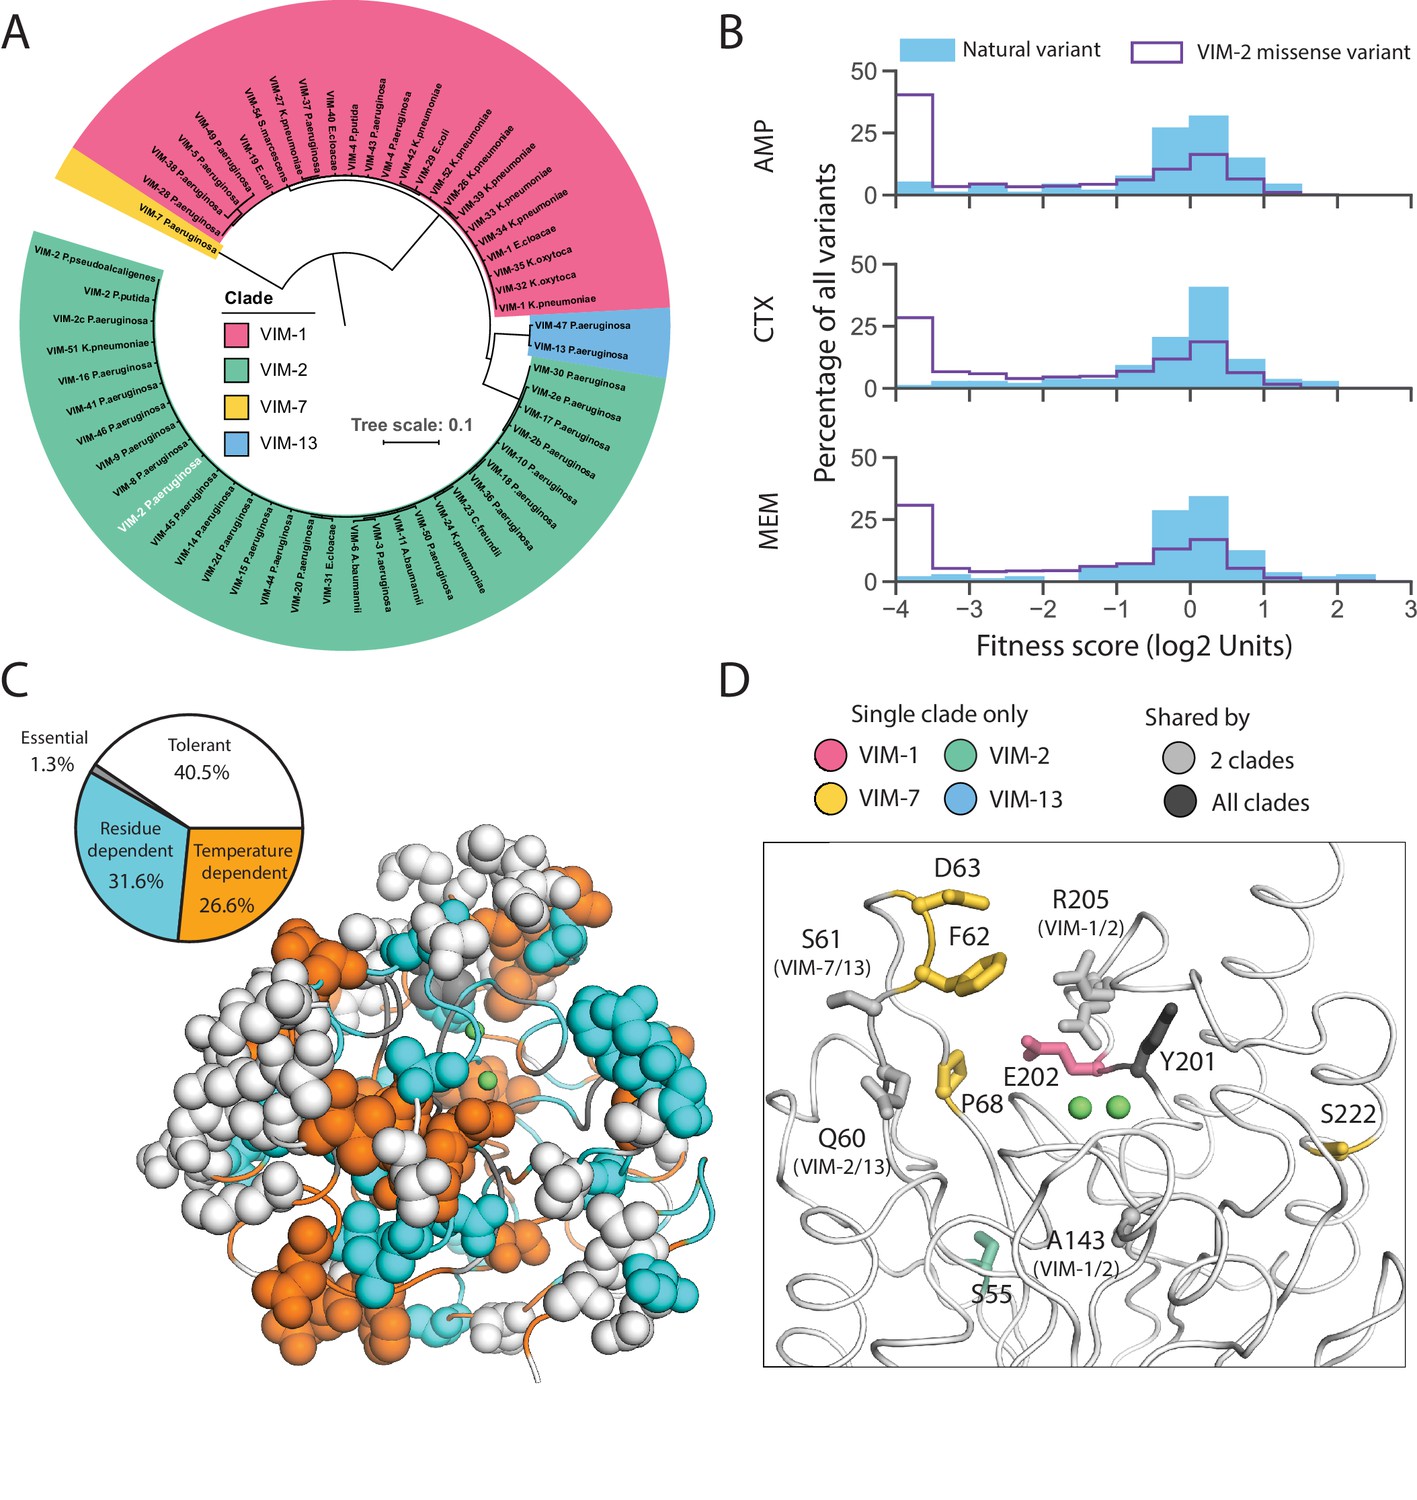
(A) Maximum likelihood phylogenetic tree of all natural VIM variants examined in this study, colored by major clades (a larger version of the tree is presented in Figure 8—figure supplement 1). The wtVIM-2 sequence is highlighted in white. (B) Distribution of fitness for all unique individual mutations found in VIM natural variants compared to all missense variants measured in DMS for all three antibiotics. (C) All residues mutated in the natural variants are shown in sphere representation and colored by mutational tolerance and temperature dependence. The pie chart on the left shows the proportion of natural variant positions in each classification. (D) wtVIM-2 residues that are both mutated in at least one natural variant and affect specificity are highlighted as sticks, colored by the clade(s) in which the residue is mutated. All positions mutated in natural VIM-type variants relative to wtVIM-2 can be found in Figure 8—figure supplement 2.
Figure 8—figure supplement 1
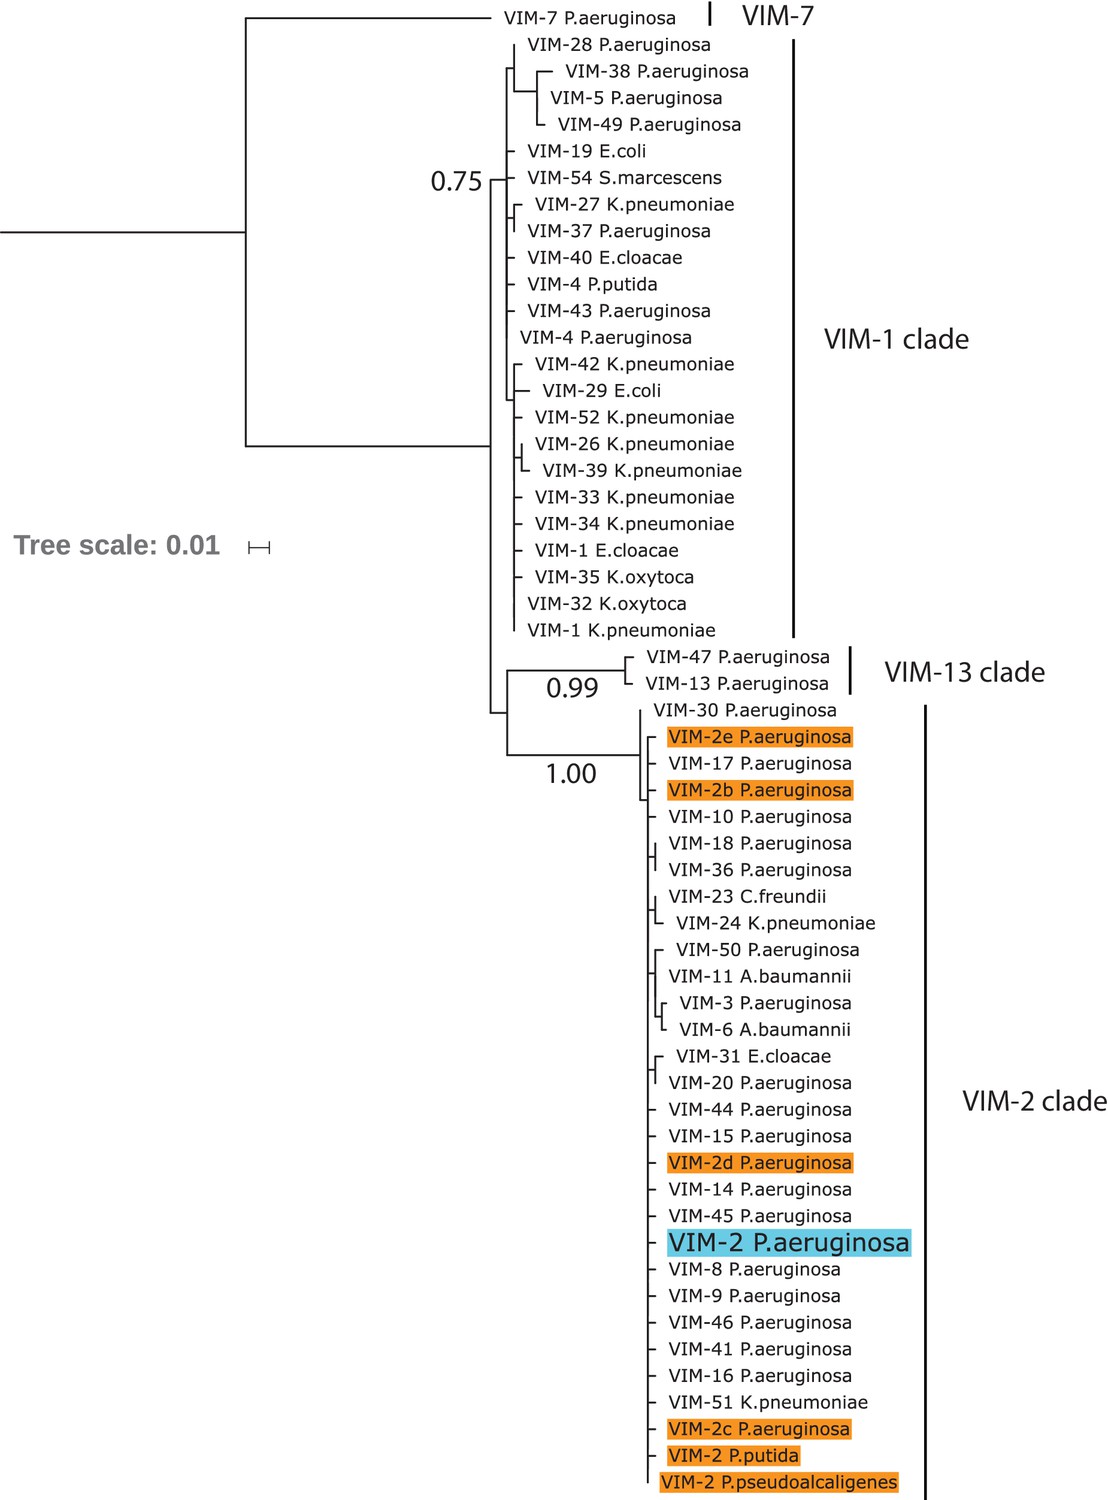
Maximum likelihood phylogenetic tree of wtVIM-2 and 55 VIM-type variants.
The leaves in the tree indicate individual VIM-type variants labeled by number and host organism, with the wtVIM-2 sequence highlighted in blue. Other VIM-2 sequences are labeled in orange, and VIM-2 sequences that share the same host as wtVIM-2 have been labeled VIM-2b/c/d/e for disambiguation. The number beneath the branches indicate the normalized bootstrap value of 100 bootstrap replicates, and only bootstrap values above 0.75 are displayed. The major clades are noted by the labels on the right side. The tree was generated using MEGA7. The full list of variants can be found in Supplementary file 2J.
Figure 8—figure supplement 2

Mutated positions in natural VIM variants.
VIM-2 residues that are mutated in any natural variant are shown in sphere representation on the VIM-2 crystal structure (PDB: 5yd7), with positions mutated only within a single clade colored by clade and positions mutated in multiple clades colored by the number of clades.
Tables
Table 1
Linear model output for DMS fitness scores under 128 µg/mL AMP selection
| Predictor* | Estimated effect† | Adjusted P-value (α = 0.05)‡ | Variance explained§ | |
|---|---|---|---|---|
| (Intercept)¶ | −1.73 | <0.001 | ||
| ASA** | 2.83 | <0.001 | 21% | |
| Rosetta ΔΔG†† | −0.28 | <0.001 | 18% | |
| Starting(wt) residue | C | −1.53 | <0.001 | 10% |
| D | −1.33 | <0.001 | ||
| E | −0.53 | <0.001 | ||
| G | −0.92 | <0.001 | ||
| H | −1.09 | <0.001 | ||
| I | −0.50 | <0.001 | ||
| L | −0.43 | <0.001 | ||
| N | −0.62 | <0.001 | ||
| R | −0.35 | 0.001 | ||
| S | −0.23 | 0.018 | ||
| V | −0.36 | <0.001 | ||
| W | −1.35 | <0.001 | ||
| Variant residue | C | −1.69 | <0.001 | 5% |
| D | −0.40 | 0.002 | ||
| P | −0.61 | <0.001 | ||
| W | −0.45 | <0.001 | ||
-
*Each predictor indicates a class of wtVIM-2 derived values that were used as explanatory variables to model a linear relationship with the observed fitness score.
†The estimated effect is the predicted change in fitness score away from the intercept with a one unit increase in a continuous predictor or a binary change in a categorical predictor.
-
‡P-values indicates whether a predictor makes a significant contribution to the change fitness score, and are adjusted for a false discovery rate of 5% using the Benjamini-Hochberg procedure.
§The adjusted R2 of each predictor when correlated with fitness, which is a measure of how much variation in the fitness score can be explained by each predictor in the linear model.
-
¶The intercept is the average fitness of all variants where the continuous variable is 0 (ASA and Rosetta ΔΔG) and the wt or variant residue is Ala.
**ASA ranges from 0.0 to 1.0.
-
††Rosetta ΔΔG ranges from −5.0 to 5.0 Rosetta energy units.
Table 2
Variants observed in each library group.
| 37°C* | 25°C* | |||||
|---|---|---|---|---|---|---|
| Group | Number of positions | Total possible variants | Both replicates† | At least one replicate‡ | Both replicates | At least one replicate |
| 1 | 39 | 819 | 808 | 811 | 808 | 812 |
| 2 | 39 | 819 | 812 | 813 | 811 | 814 |
| 3 | 39 | 819 | 803 | 807 | 802 | 807 |
| 4 | 39 | 819 | 802 | 813 | 809 | 812 |
| 5 | 39 | 819 | 801 | 812 | 804 | 811 |
| 6 | 39 | 819 | 775 | 793 | 789 | 796 |
| 7 | 33 | 693 | 682 | 686 | 678 | 690 |
| Total | 267 | 5607 | 5483 | 5535 | 5501 | 5542 |
| % coverage | 97.8% | 98.7% | 98.1% | 98.8% | ||
-
*Non-selected libraries were grown, sequenced and filtered separately at 37°C and 25°C.
†The observed number of variants that passed noise filtering in both sequencing replicates of the non-selected library.
-
‡The observed number of variants that passed noise filtering in at least one sequencing replicate of the non-selected library.
Table 3
Inferred specificity of residues in wtVIM-2.
| Specificity | Positions* |
|---|---|
| AMP | 39, 55, 57, 63, 117, 119, 142, 143, 153, 196, 219, 222, 243, 248 |
| CTX | 62, 67, 68 |
| AMP or CTX | 60, 61, 202, 205, 210, 211, 216 |
| MEM | 201 |
-
*Positions in bold are temperature dependent. The underlined position is tolerant. The unformatted positions are residue dependent.
Key resources table
| Reagent type (species) or resource | Designation | Source or reference | Identifiers | Additional information |
|---|---|---|---|---|
| Gene (Pseudomonas aeruginosa) | wtVIM-2 | UniProt | UniProtKB:A4GRB6 | |
| Strain, strain background (Escherichia coli) | E. cloni 10G | Lucigen | 60061 | Electrocompetent cells |
| Recombinant DNA reagent | pIDR2-wtVIM-2 | this paper | Plasmid housing the wtVIM-2 sequence, maintained by the Tokuriki lab. See Supplementary file 1 for full sequence. | |
| Sequence-based reagent | primers with Nextera transposase adapter sequence | this paper | Primers used to extract regions of the VIM-2 gene from variant libraries after a selection experiment, attaching the Nextera transposase adaptor sequence in the process. See Supplementary file 2L for all primer sequences. | |
| Chemical compound, drug | Ampicillin | Fisher Scientific | BP1760 | |
| Chemical compound, drug | Cefotaxime | Fisher Scientific | BP29511 | |
| Chemical compound, drug | Meropenem | Sigma Aldrich | M2574 | |
| Commercial assay or kit | NextSeq 500/550 High Output Kit (300 cycles) | Illumina | 20024908 | |
| Software, algorithm | DMS-FastQ-Processing script | this paper | Script used to merge and quality filter paired end FastQ reads. Code available at https://github.com/johnchen93/DMS-FastQ-processing (Chen, 2020; copy archived at https://github.com/elifesciences-publications/DMS-FastQ-processing) |
Additional files
-
Supplementary file 1
Plasmid map of pIDR2-wtVIM-2 in GenBank format.
- https://cdn.elifesciences.org/articles/56707/elife-56707-supp1-v2.gb
-
Supplementary file 2
Data and additional information.
Includes the following: (A) Fitness scores for amino acid variants under all selection conditions, (B) EC50 measured from individually isolated variants, (C) Data used in linear models, (D) Fitness scores for codon variants selected under 128 µg/mL AMP, (E) Calculated RNA folding energy of signal peptide variants, (F) Temperature dependence classifications for the catalytic domain of VIM-2, (G) Hydrogen bonds found in the 5yd7 crystal structure, (H) Variants with positive fitness (>1) in all antibiotics, (I) All identified variants with altered specificity, (J) List of all VIM-type natural variants, (K) Mutations in VIM-type natural variants relative to wtVIM-2, and (L) Primers used to extract the VIM-2 gene for deep sequencing.
- https://cdn.elifesciences.org/articles/56707/elife-56707-supp2-v2.xlsx
-
Supplementary file 3
Linear model results for variant fitness selected under CTX and MEM.
(A) Variants selected under 4.0 µg/mL CTX. (B) Variants selected under 0.031 µg/mL MEM.
- https://cdn.elifesciences.org/articles/56707/elife-56707-supp3-v2.xlsx
-
Transparent reporting form
- https://cdn.elifesciences.org/articles/56707/elife-56707-transrepform-v2.docx
Download links
A two-part list of links to download the article, or parts of the article, in various formats.
Downloads (link to download the article as PDF)
Open citations (links to open the citations from this article in various online reference manager services)
Cite this article (links to download the citations from this article in formats compatible with various reference manager tools)
Comprehensive exploration of the translocation, stability and substrate recognition requirements in VIM-2 lactamase
eLife 9:e56707.
https://doi.org/10.7554/eLife.56707


