CARD14E138A signalling in keratinocytes induces TNF-dependent skin and systemic inflammation
- The Francis Crick Institute, United Kingdom
- Department of Immunology & Inflammation, Imperial College London, United Kingdom
- National Heart & Lung Institute, Imperial College London, United Kingdom
- Bioinformatics and Biostatistics, The Francis Crick Institute, United Kingdom
- Crick Scientific Computing - Digital Development Team, The Francis Crick Institute, United Kingdom
- Departments of Oncological Science, Dermatology, and Genetics & Genome Sciences, Icahn School of Medicine at Mount Sinai, United States
Figures
Figure 1 with 3 supplements
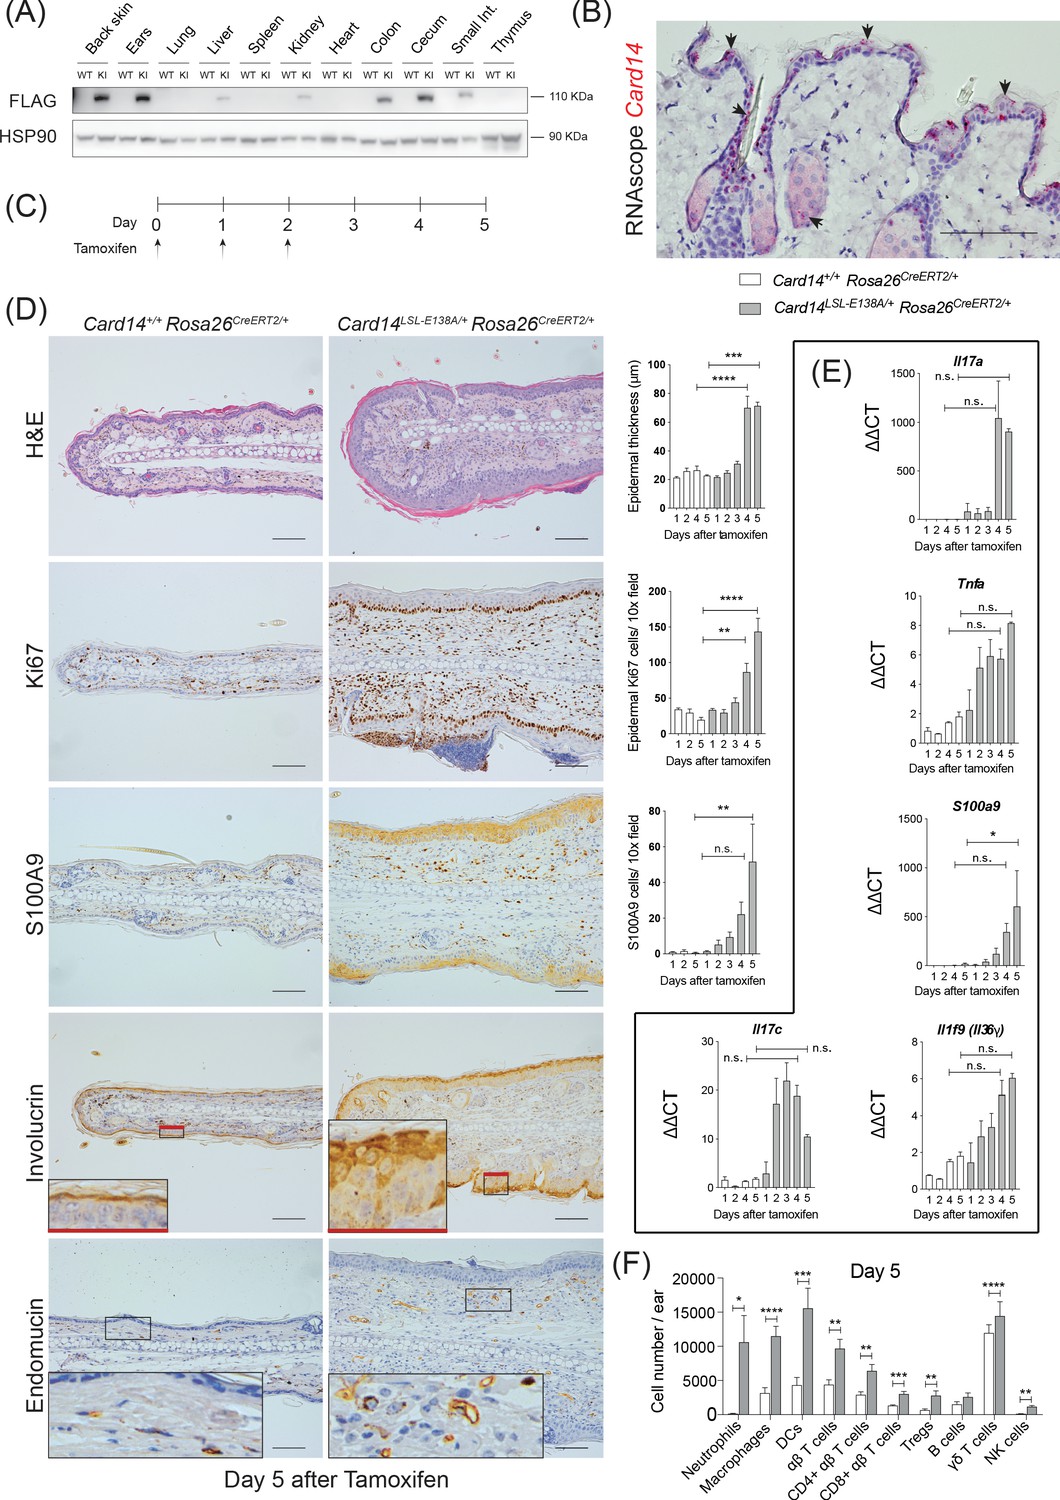
Conditional expression of CARD14E138A in Card14LSL-E138A/+ Rosa26CreERT2/+ mice induces rapid changes in ear skin histology.
(A) CARD14-FLAG protein expression analysed in total extracts from different organs from control (WT) and Card14E138A-LSL (KI) mice by immunoblotting. (B) Localisation of Card14 mRNA expression in the skin assessed by RNAscope. (C) Timeline of the Card14E138A induction by tamoxifen and sample collection. (D) Representative histology images of ears on d5 after tamoxifen injection: (first panel) H and E staining and acanthosis quantification over time; (second panel) Ki67 staining at d5 and quantitation; (third panel) S100A9 staining at d5 and quantitation; (fourth panel) involucrin staining at d5 and (bottom panel) endomucin staining at d5. (E) qRT-PCR analysis of the expression of IL17a, Tnfa, S100a9, Il17c and Il1f9 mRNAs. (F) Quantification and characterisation of the immune cell infiltrate of the ears at d5 after tamoxifen by FACS. Data pooled from 4 independent experiments; Card14+/+ Rosa26CreERT2/+n = 22, Card14LSL-E138A/+ Rosa26CreERT2/+ 5d n = 22. Data collected from a mixture of male and female mice. (B, D) Scale bar = 100 µm. Differences between groups analysed by one-way ANOVA (D and E) or Student’s t-test (F). *, p<0.05; **, p<0.01; ***, p<0.001; ****, p<0.0001. For clarity, only statistical analyses between the two genotypes at day 4 and day 5 were noted.
Figure 1—figure supplement 1
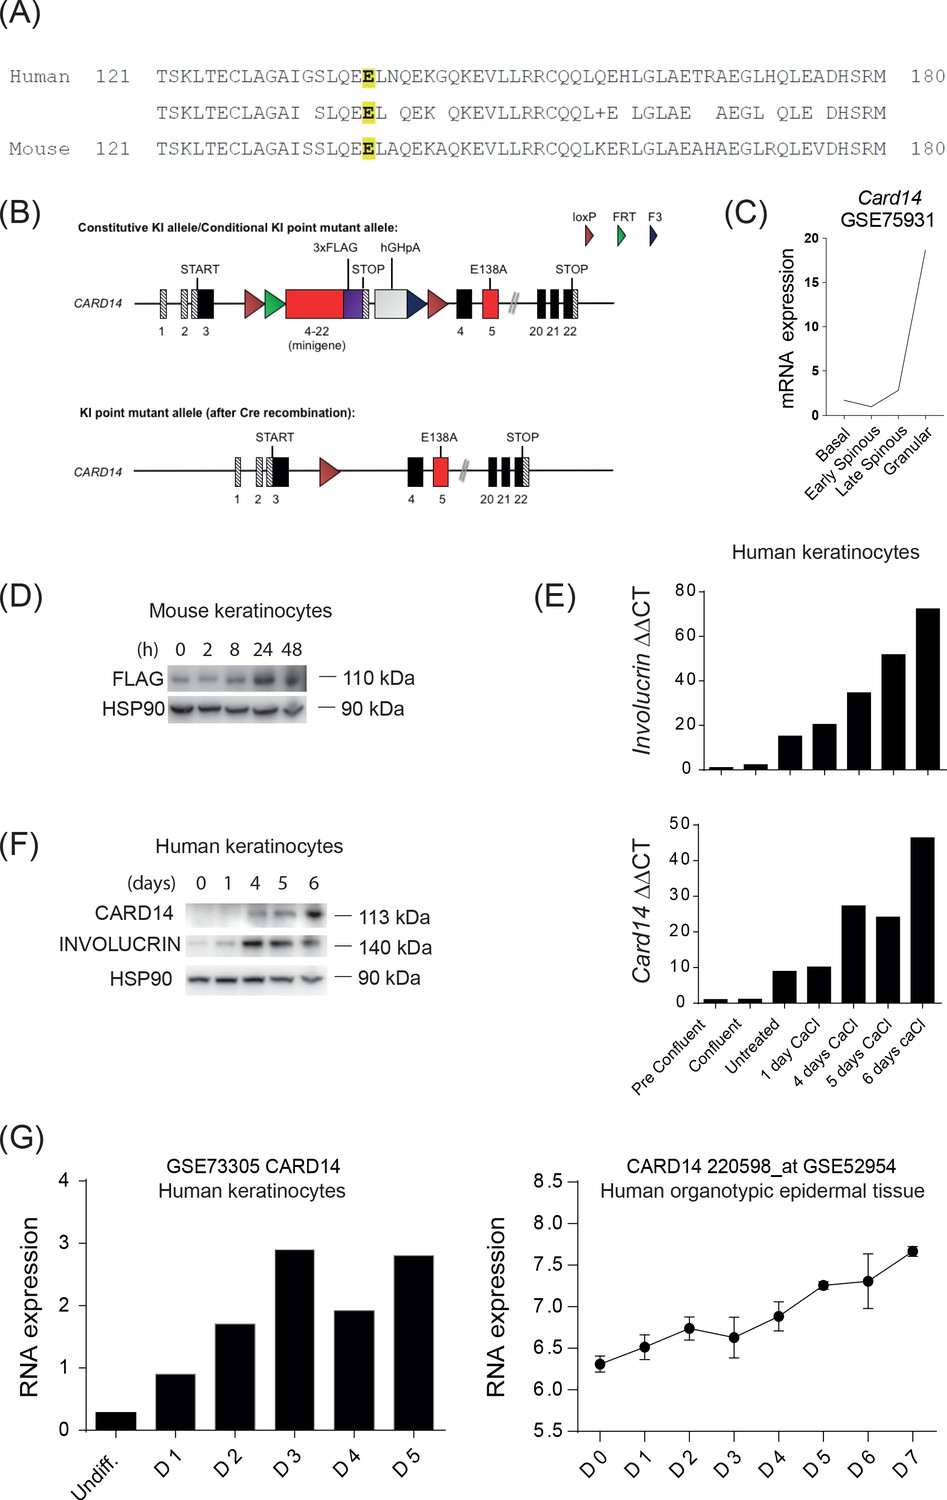
CARD14 expression increases with differentiation in human and mouse keratinocytes.
(A) pBlast alignment of the human (Q9BXL6) and mouse (Q99KF0) CARD14 protein sequences; highlighted in yellow is the conserved glutamic acid in the position 138 that is mutated in the psoriasis patient (Jordan et al., 2012b). (B) Schematic representation of Card14 knock in locus before and after Cre-mediated recombination. Under basal conditions (upper panel), Card14 is expressed from the early endogenous exons (starting from exon 3), and exons within the minigene. A 3xFLAG tag was inserted at the 3’ end of the minigene to attach a C-terminal tag on CARD14. The STOP and human growth hormone poly (A) (hGHpA) cassette prevented aberrant read-through to the remaining endogenous locus, in which the E138A point mutation (GAG >GCG) was introduced in exon 5. After Cre-mediated recombination (bottom panel), the minigene was excised and expression of Card14 from the endogenous exons was resumed, resulting in expression of CARD14E138A. (C) Card14 mRNA expression through the different layers of the mouse epidermis, RNAseq data from the public dataset GSE75931 (Asare et al., 2017). (D) Primary keratinocytes were isolated from Card14LSL-E138A mice and cultured for 7d. CaCl2 (2 mM) was added to promote differentiation and lysates were produced at the indicated times. CARD14-FLAG expression was assessed by immunoblotting. (E) Normal human epidermal keratinocytes were cultured in vitro and CaCl2 (2 mM) was added to promote differentiation. Lysates were analysed by qPCR for quantification of mRNA levels of Involucrin and CARD14. (F) Samples were produced as in (E), protein lysates were immunoblotted for CARD14, Involucrin and HSP90. (G) Expression of CARD14 mRNA from transcriptomes of human primary Keratinocytes (GSE73305) (Bin et al., 2016) and organotypic epidermal tissue (GSE52954) (Lopez-Pajares et al., 2015) at different differentiation stages. (D, E and F) representative from three independent experiments.
Figure 1—figure supplement 2

Conditional expression of CARD14E138A in Card14LSL-E138A/+ Rosa26CreERT2/+ mice induces rapid changes in back skin histology.
CARD14E138A expression was induced by tamoxifen injection of Card14LSL-E138A/+Rosa26CreERT2/+ mice, as in Figure 1C. (A) Representative histology image of the back skin: (first panel) H and E on d5 and acanthosis quantification over time; (second panel) immunohistochemistry of the back skin stained with Ki67 at d5 and its quantification over time; (third panel) immunohistochemistry of the back skin stained for S100A9 at d5 and quantification of dermal myeloid cells over time; (fourth panel) immunohistochemistry of the back skin stained for involucrin at d5 and (bottom panel) immunohistochemistry of the back skin stained for endomucin at d5. (B) qRT-PCR analysis of the expression of Il17a, Tnfa, S100a9, Il17c and Il1f9 over time. Data collected from a mixture of male and female mice. (A) Scale bar = 100 µm. (B) Differences between WT and KI analysed by one-way ANOVA. *, p<0.05; **, p<0.01; ***, p<0.001; ****, p<0.0001. For clarity, only statistics between the two genotypes at day 4 and day five were noted.
Figure 1—figure supplement 3
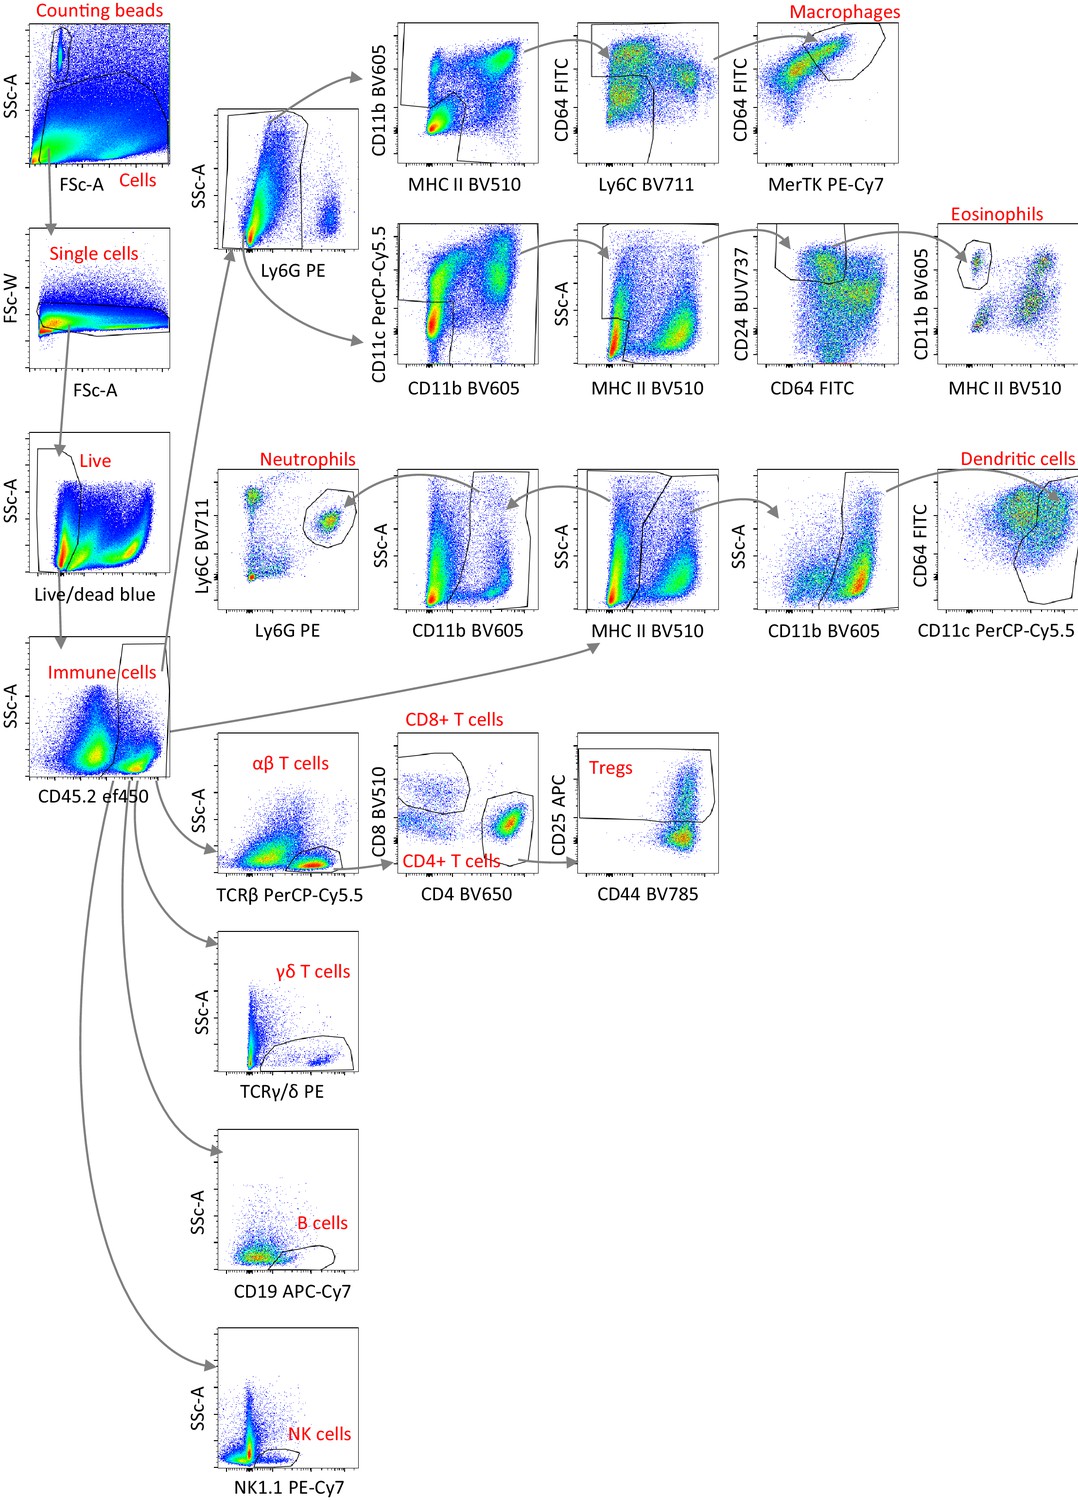
Flow cytometry gating strategy used to identify different immune cell populations FACS plots show cells in the ears of one representative Card14LSL-E138A/+Rosa26CreERT2/+ mouse at 1 m following the first tamoxifen injection.
The same gating strategy was used for all mice and tissues analysed.
Figure 2 with 2 supplements
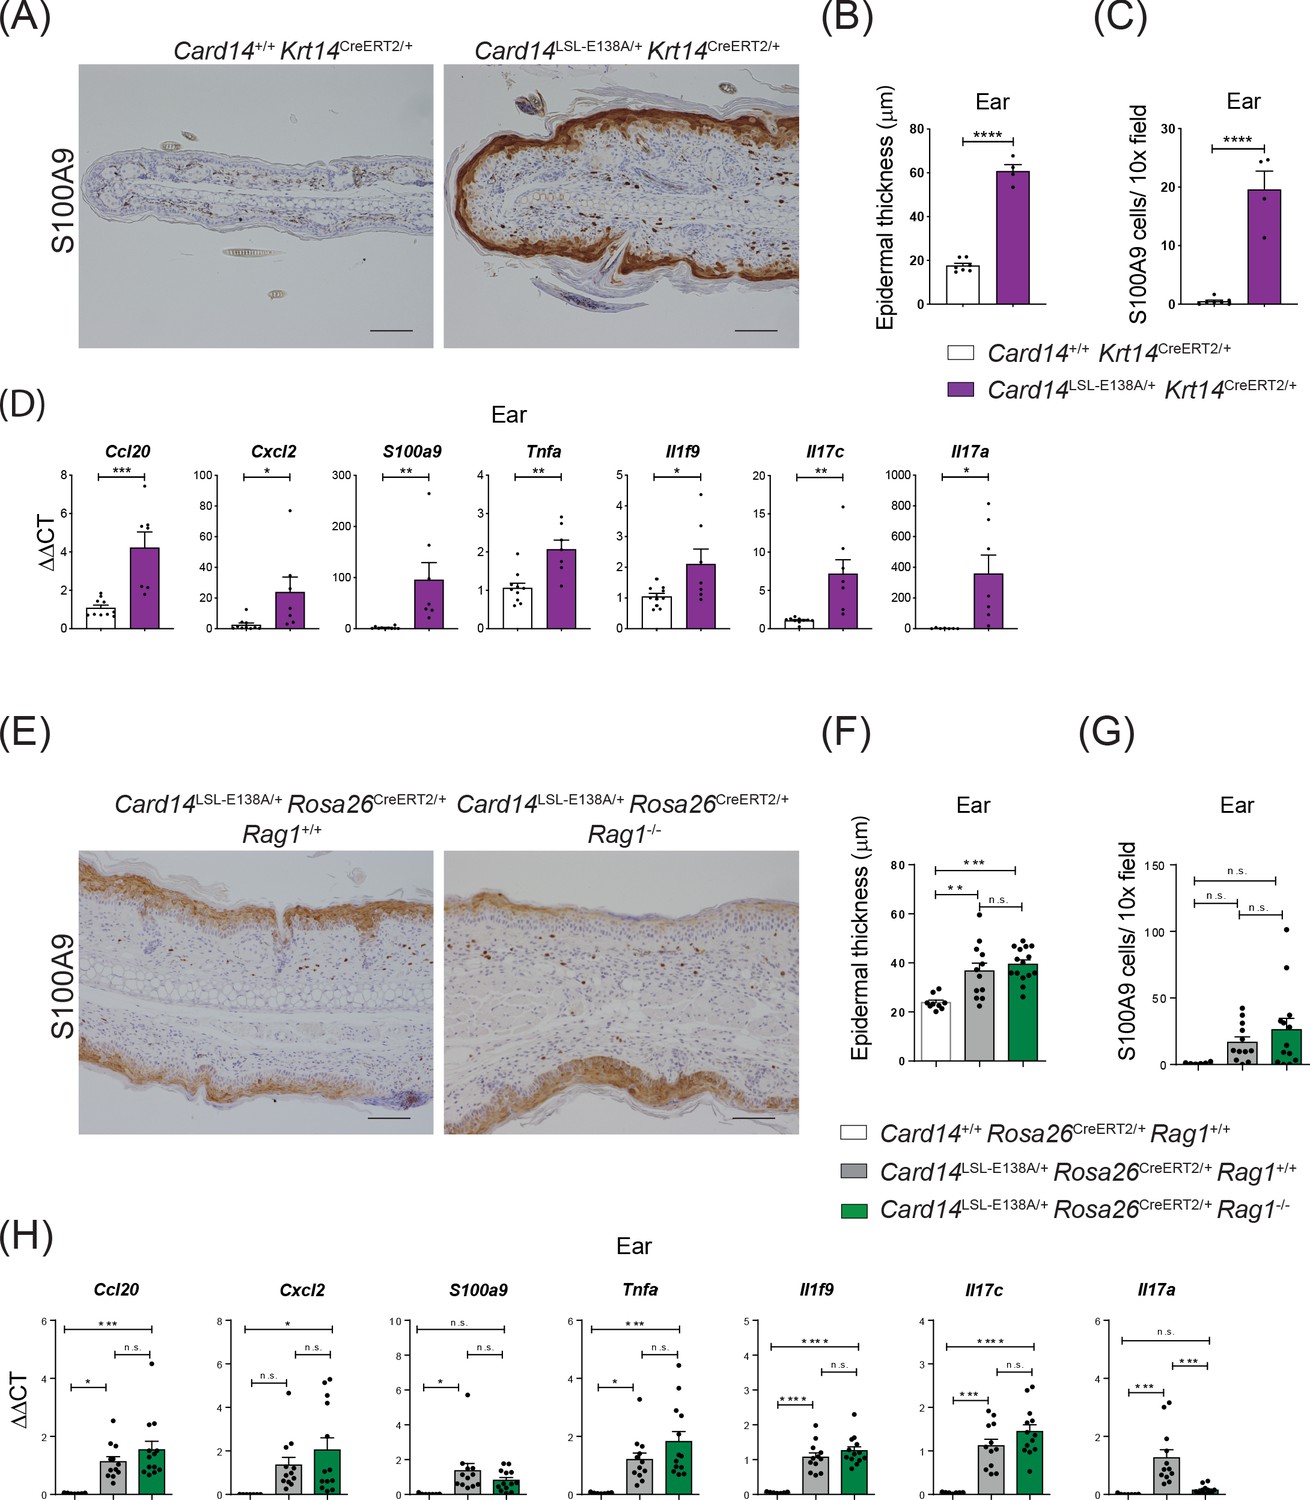
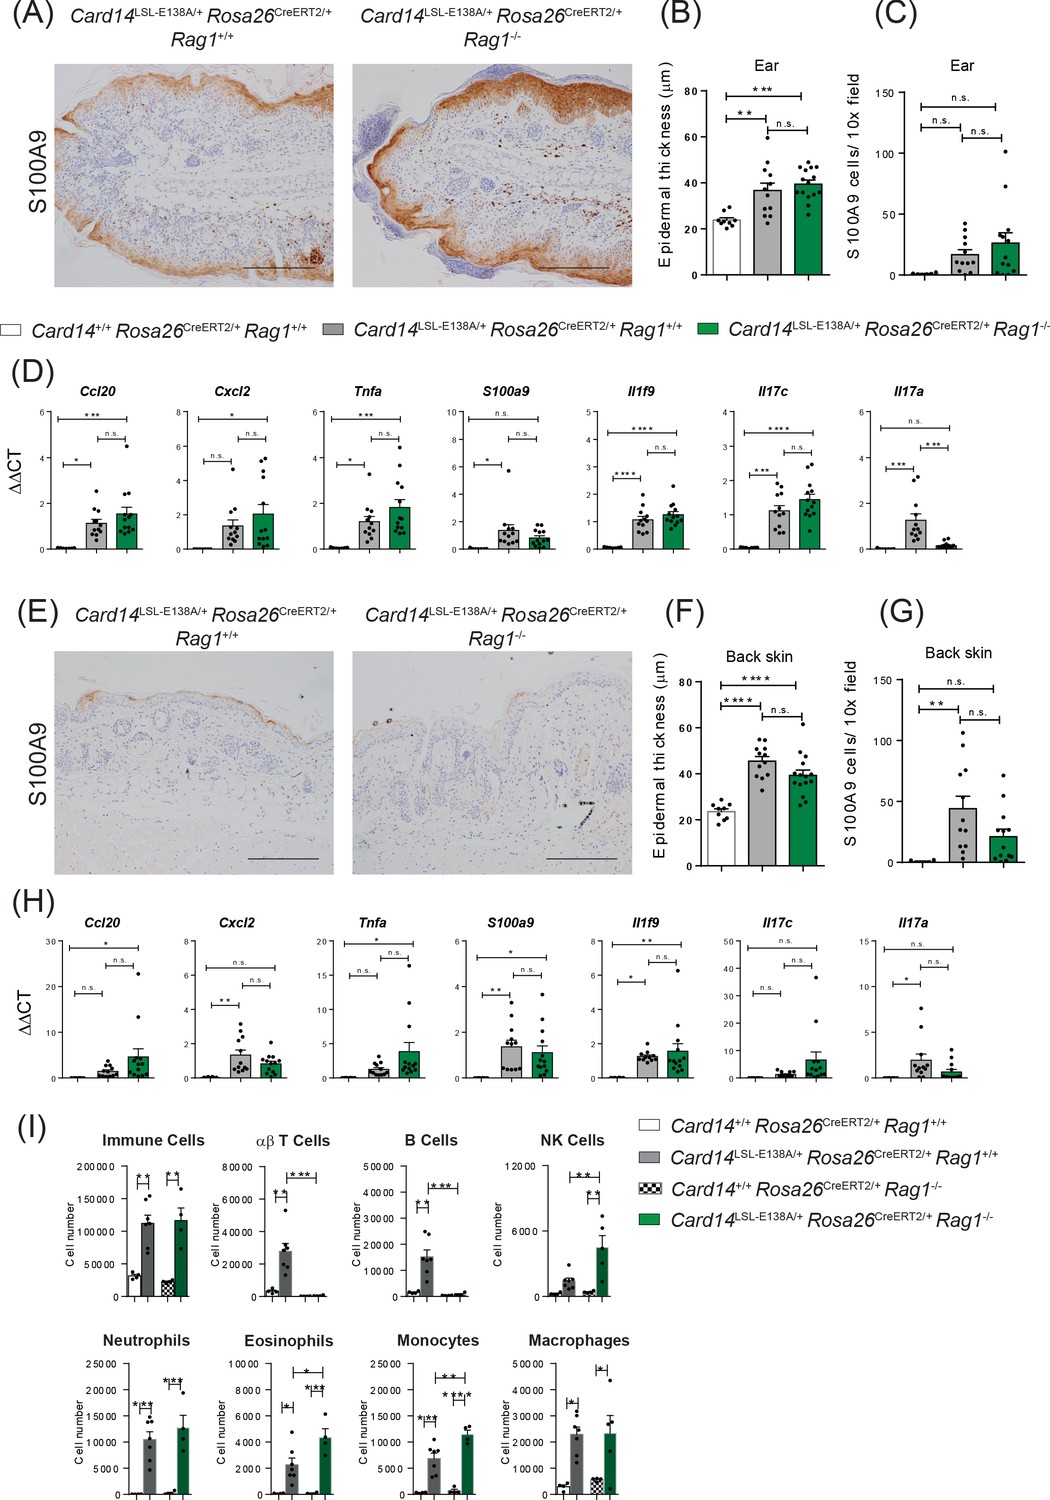
CARD14E138A signalling in keratinocytes induces ear skin inflammation independently of the adaptive immune system.
Eight-week old Card14+/+ Krt14CreERT2/+, Card14LSL-E138A/+ Krt14CreERT2/+, Card14LSL-E138A/+ Rosa26CreERT2/+ Rag1+/+, Card14+/+ Rosa26CreERT2/+ Rag1+/+ and Card14LSL-E138A/+ Rosa26CreERT2/+ Rag1-/- mice were injected intraperitoneally with tamoxifen on days 0, 1 and 2. Mice were sacrificed and tissues analysed at 5d after the first injection of tamoxifen. (A and E) Immunohistochemistry of the ear stained for S100A9 at d5. (B and F) Quantification of acanthosis (C and G) Quantification of dermal immune cell infiltration. (D and H) qRT-PCR analysis of mRNA expression of the indicated genes in the ear. Fold changes in (H) were calculated by comparison with the Card14LSL-E138A/+ Rosa26CreERT2/+ Rag1+/+ group. (A and E) Scale bar = 100 µm. Data in B and C from 1 of 2 similar experiments with n ≥ 4, data in D, F, G and H pooled from 2 independent experiments with n ≥ 4 (D) and with n ≥ 6 (F, G and H). Differences between groups analysed by Student’s t test (B, C and D) or one-way ANOVA (F, G and H). *, p<0.05; **, p<0.01; ***, p<0.001; ****, p<0.0001.
Figure 2—figure supplement 1
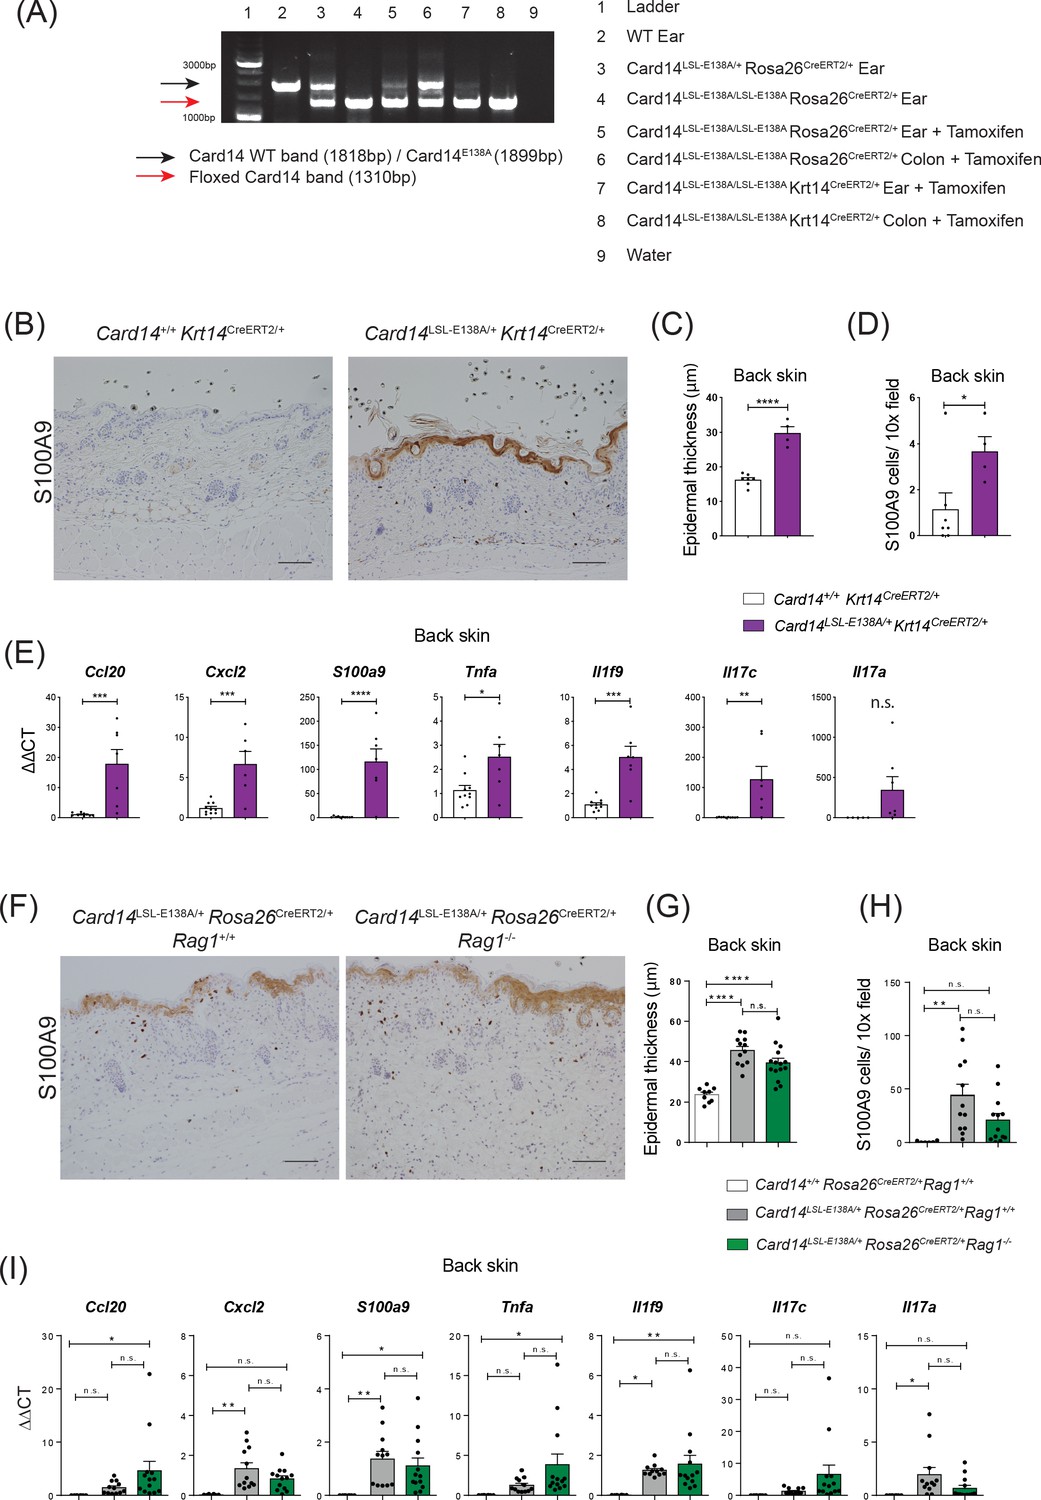
CARD14E138A expression in keratinocytes induces skin inflammation independently of the adaptive immune system.
Eight-week old Card14+/+Krt14CreERT2/+, Card14LSL-E138A/+ Krt14CreERT2/+, Card14LSL-E138A/+ Rosa26CreERT2/+ Rag1+/+, Card14+/+ Rosa26CreERT2/+ Rag1+/+ and Card14LSL-E138A/+ Rosa26CreERT2/+ Rag1-/- mice were injected intraperitoneally with tamoxifen on d0, 1 and 2. Mice were sacrificed and tissues analysed at 5d after the first injection of tamoxifen. (A) PCR was used to assess recombination of Card14LSL-E138A locus ± tamoxifen (5d) in tissues from Card14LSL-E138A/LSL-E138A Krt14CreERT2/+ mice. (B and F) Immunohistochemistry of the back skin stained with S100A9 at d5. (C and G) Quantification of acanthosis. (D and H) Quantification of dermal immune cell infiltration. (E and I) qRT-PCR analysis of the expression of the indicated genes in the back skin. Fold changes in (I) were calculated by comparison with a Card14LSL-E138A/+ Rosa26CreERT2/+ Rag1+/+ isotype injected group. (B and F) Scale bar = 100 µm. Data in C and D from 1 of 2 independent experiments with n ≥ 4, data in E, G, H and I pooled from 2 independent experiments with n ≥ 4 (E) and with n ≥ 6 (G, H and I). Differences between groups analysed by Student’s t-test (C, D and E) or one-way ANOVA (G, H and I). *, p<0.05; **, p<0.01; ***, p<0.001; ****, p<0.0001.
Figure 2—figure supplement 2
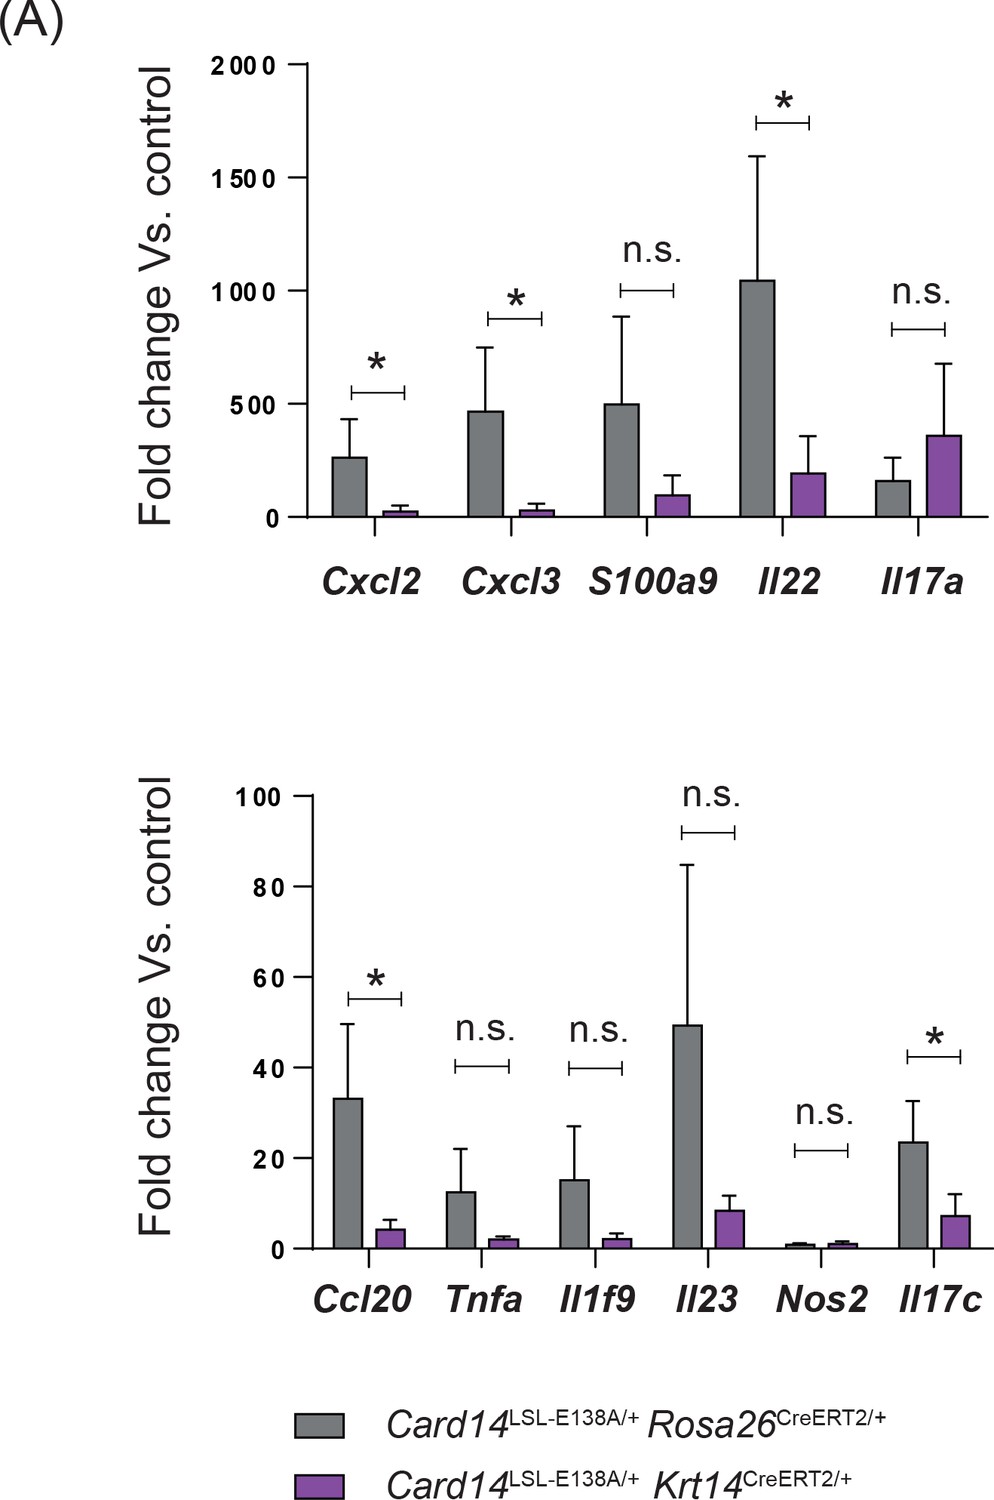
Ubiquitous and keratinocyte-specific expression of CARD14E138A promotes similar changes in gene expression in the skin.
(A) Comparison of the fold change from their respective controls between Card14LSL-E138A/+ Rosa26CreERT2/+ and Card14LSL-E138A/+ Krt14CreERT2/+ for the indicated genes as assessed by qRT-PCR. Values pooled from 2 independent experiment with each group n ≥ 4. Differences between groups analysed by Student’s t-test. *, p<0.05; **, p<0.01; ***, p<0.001; ****, p<0.0001.
Figure 3 with 3 supplements
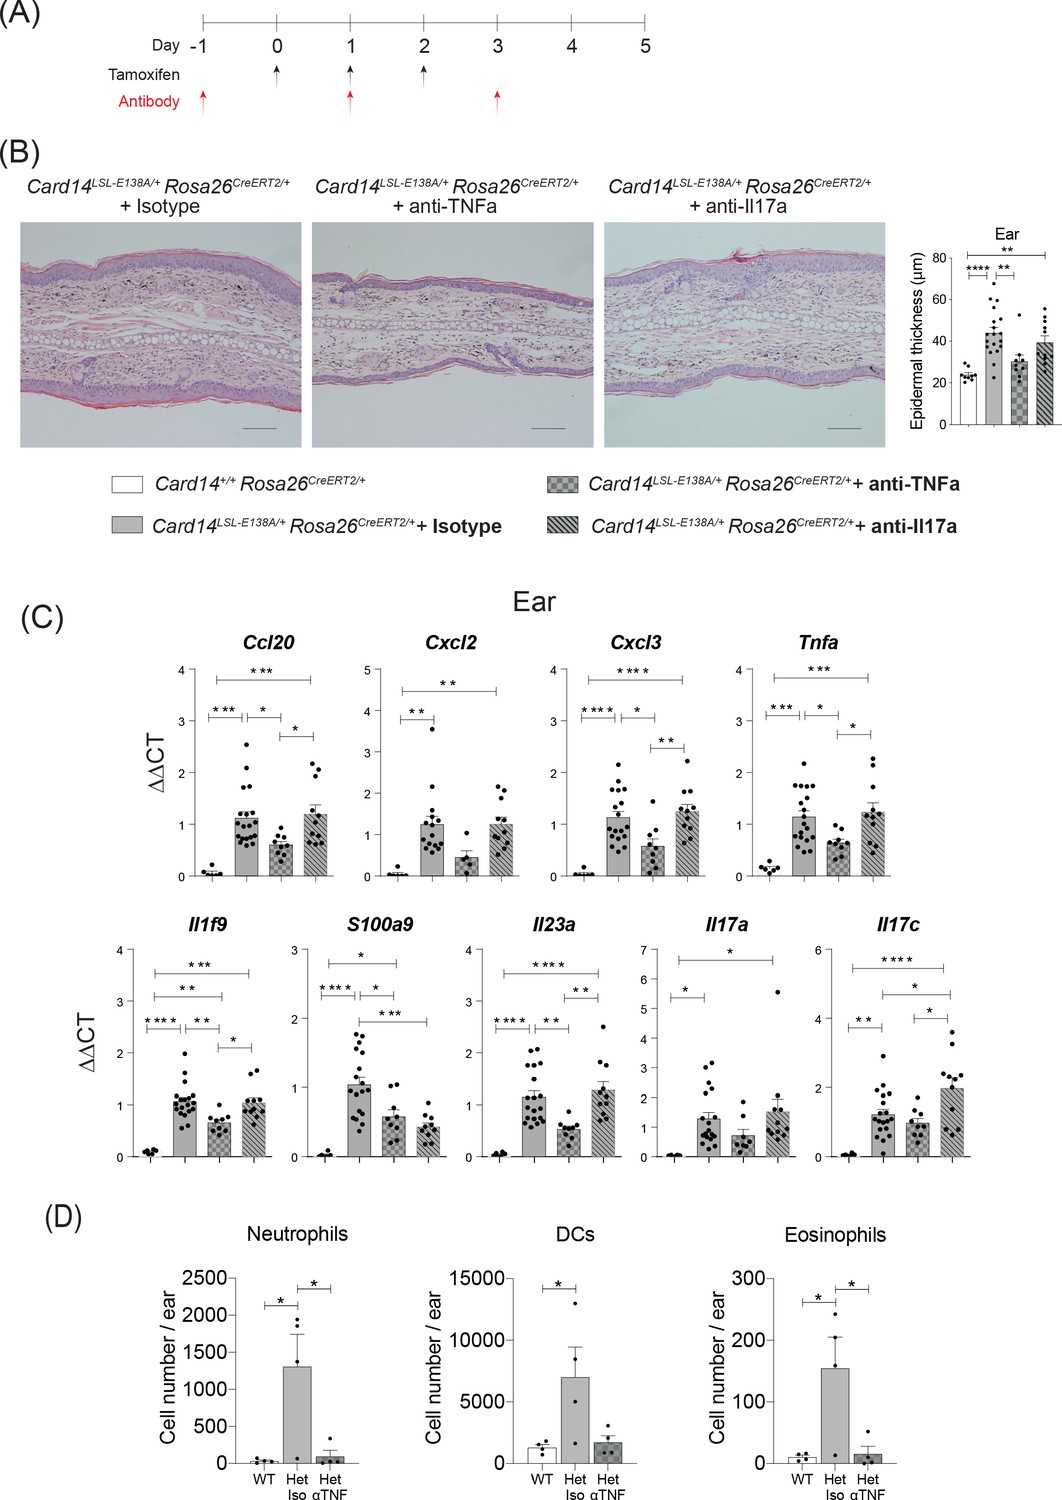
CARD14E138A-induced ear skin inflammation is ameliorated by anti-TNF.
Eight-week old Card14LSL-E138A/+Rosa26CreRT2/+ and Card14+/+ Rosa26CreERT2/+ mice treated with either tamoxifen and blocking antibodies or with tamoxifen and isotype control IgG following the scheme in A. (B) Representative histological image of ear stained by H and E on d5 and acanthosis quantification from mice receiving the different treatments. (C) qRT-PCR analysis of the expression of indicated genes Fold changes were calculated by comparing with the Card14LSL-E138A/+ Rosa26CreERT2/+ isotype treated group. (D) Quantification and characterisation of the immune cell infiltrate of the ears at d5 after tamoxifen by FACS. Data from 1 experiment (B) Scale bar = 100 µm. Data pooled from 2 experiments with at least n ≥ 4. Differences between groups analysed by one-way ANOVA. *, p<0.05; **, p<0.01; ***, p<0.001; ****, p<0.0001. For clarity, only statistically significant differences have been noted in the graphs.
Figure 3—figure supplement 1
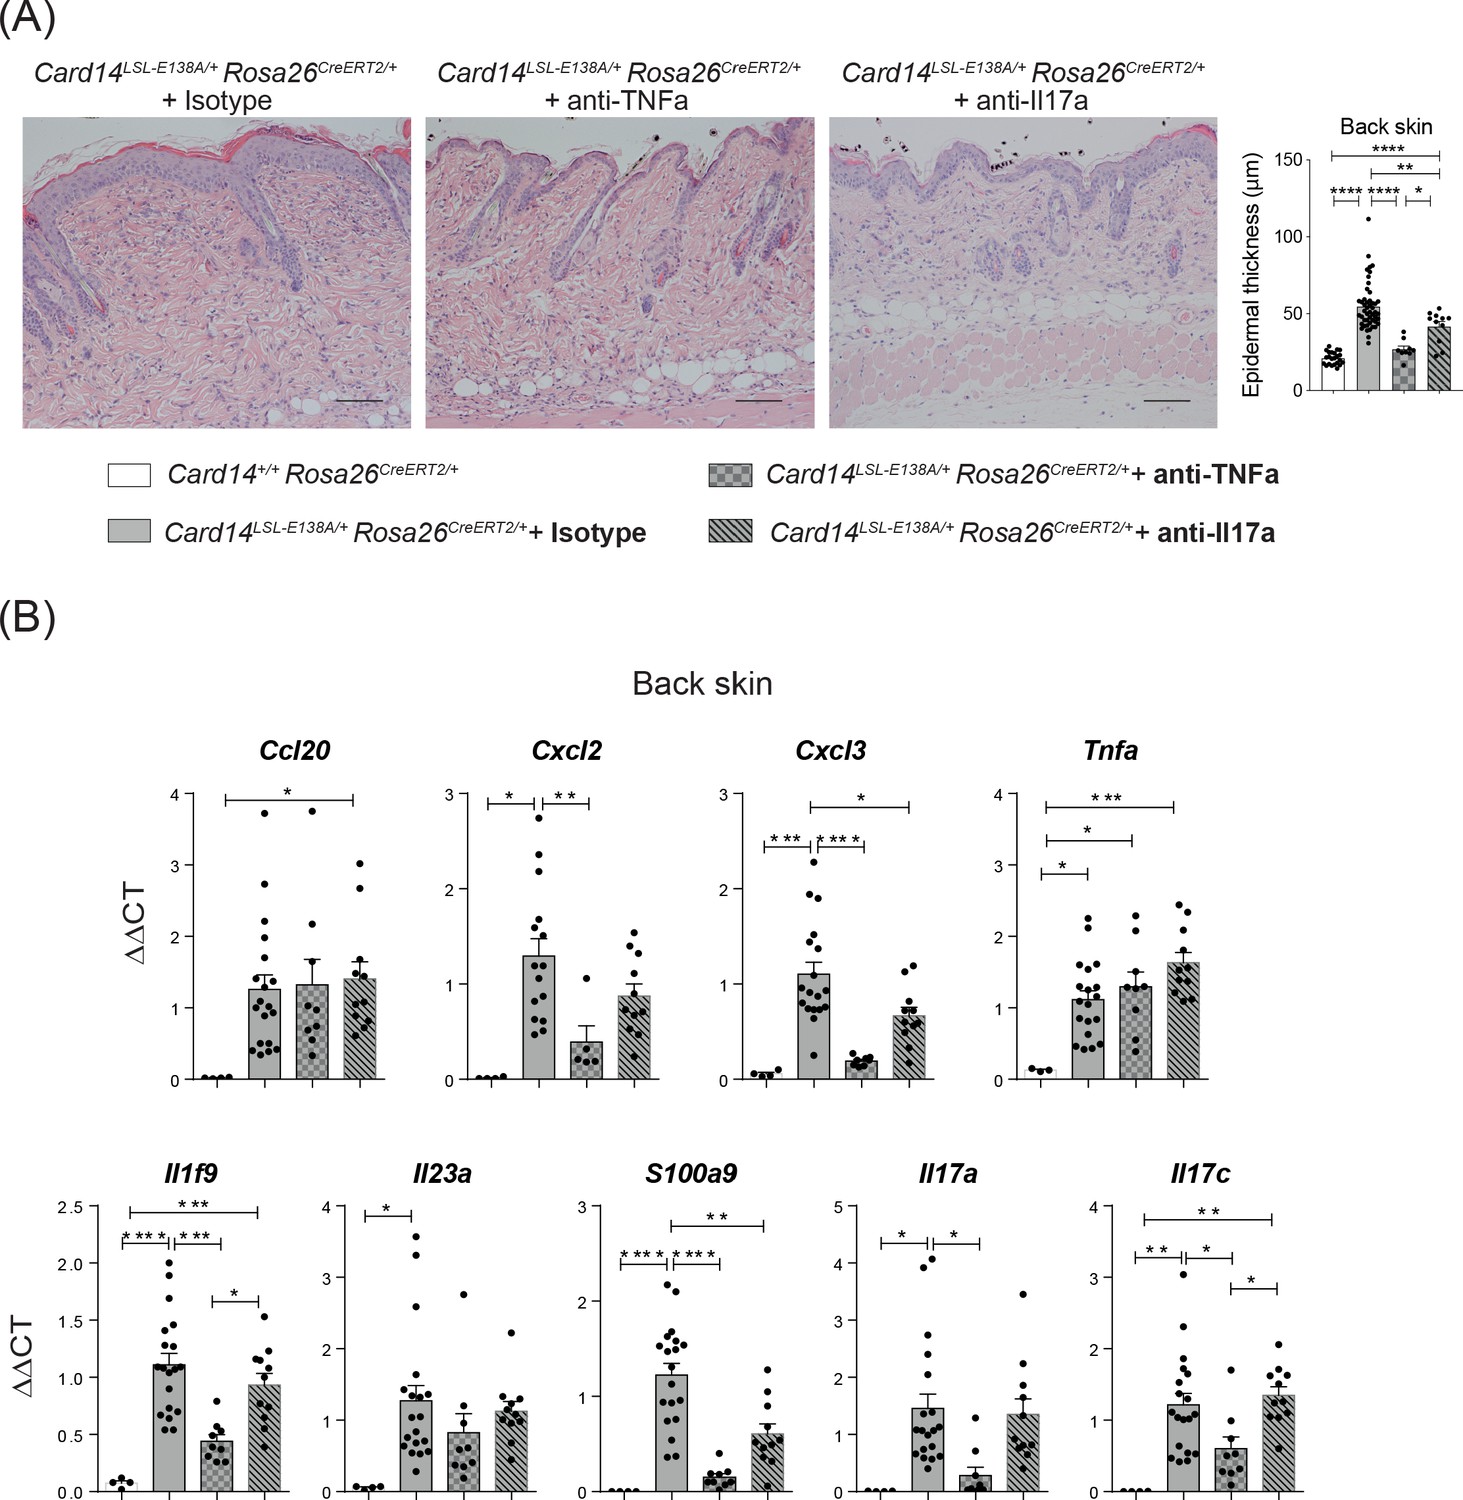
CARD14E138A-induced back skin inflammation is ameliorated by anti-TNF.
Eight-week old Card14LSL-E138A/+Rosa26CreERT2/+ and Card14+/+ Rosa26CreERT2/+ mice were all tamoxifen induced and simultaneously: given no antibody treatment, treated with indicated blocking antibodies, or treated with IgG isotype control. (A) Representative histology image of the back skin stained by H and E on d5 and acanthosis from mice receiving the different treatments. (B) qRT-PCR analysis of indicated gene expression. Fold changes were calculated over the Card14LSL-E138A/+ Rosa26CreERT2/+ isotype treated group. (A) Scale bar = 100 µm. Data pooled from at least 2 independent experiments with at least n ≥ 4. Differences between groups analysed by one-way ANOVA. *, p<0.05; **, p<0.01; ***, p<0.001; ****, p<0.0001.
Figure 3—figure supplement 2
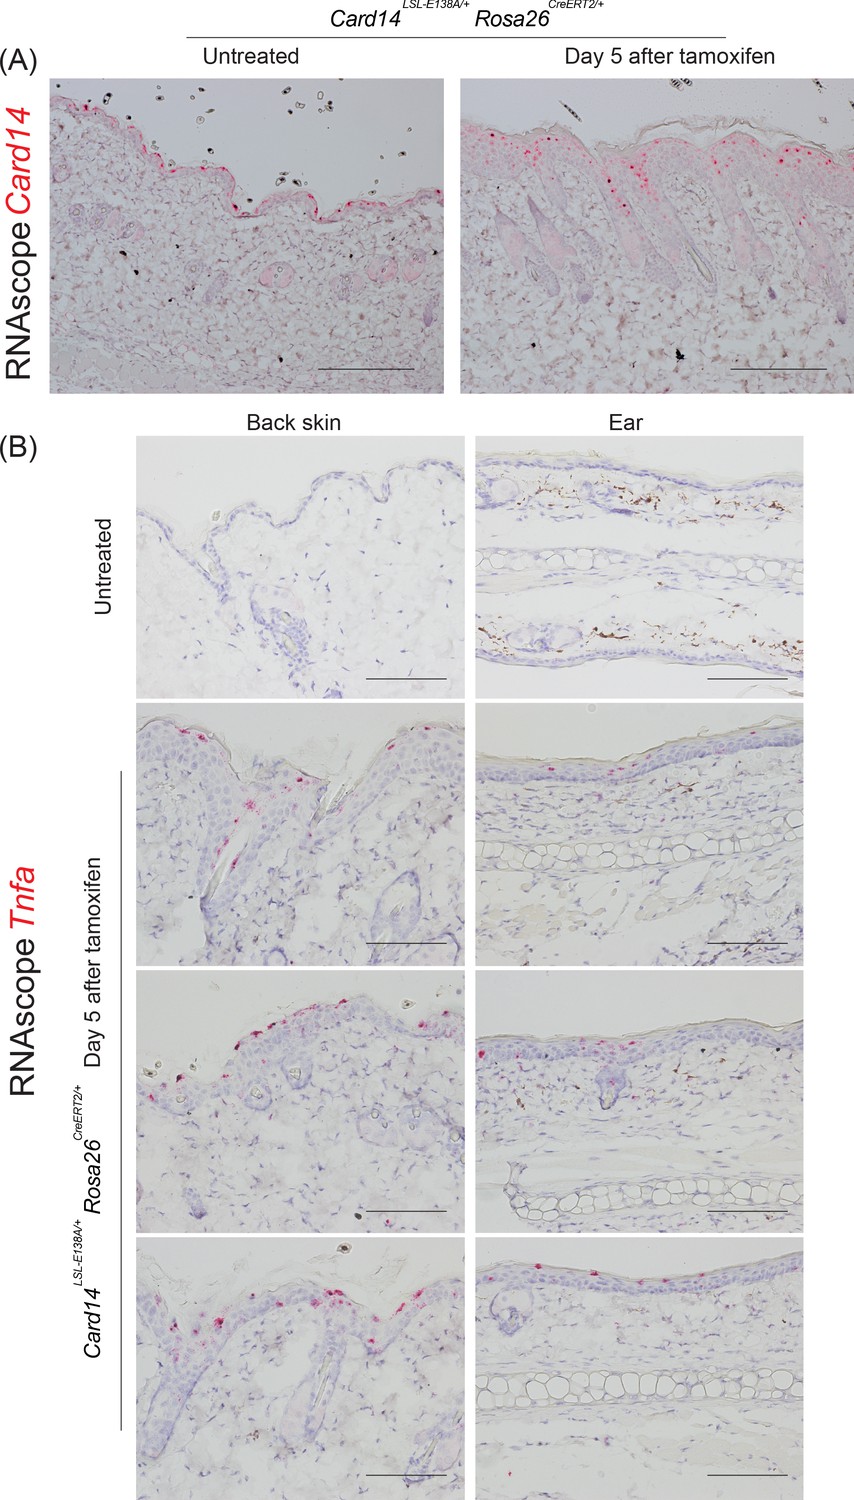
Expression of Tnfa mRNA in the epidermis of Card14LSL-E138A/+ Rosa26CreERT2/+ at day 5 following tamoxifen induction.
(A) Localisation of Card14 mRNA expression in the skin of untreated or 5 days after tamoxifen induced Card14LSL-E138A/+ Rosa26CreERT2/+ mice assessed by RNAscope. (B) Localisation of Tnfa mRNA expression in the back skin and ear of untreated or 5 days after tamoxifen induced Card14LSL-E138A/+ Rosa26CreERT2/+ mice assessed by RNAscope. Each picture corresponds to an individual mouse. Scale bar = 100 µm.
Figure 3—figure supplement 3
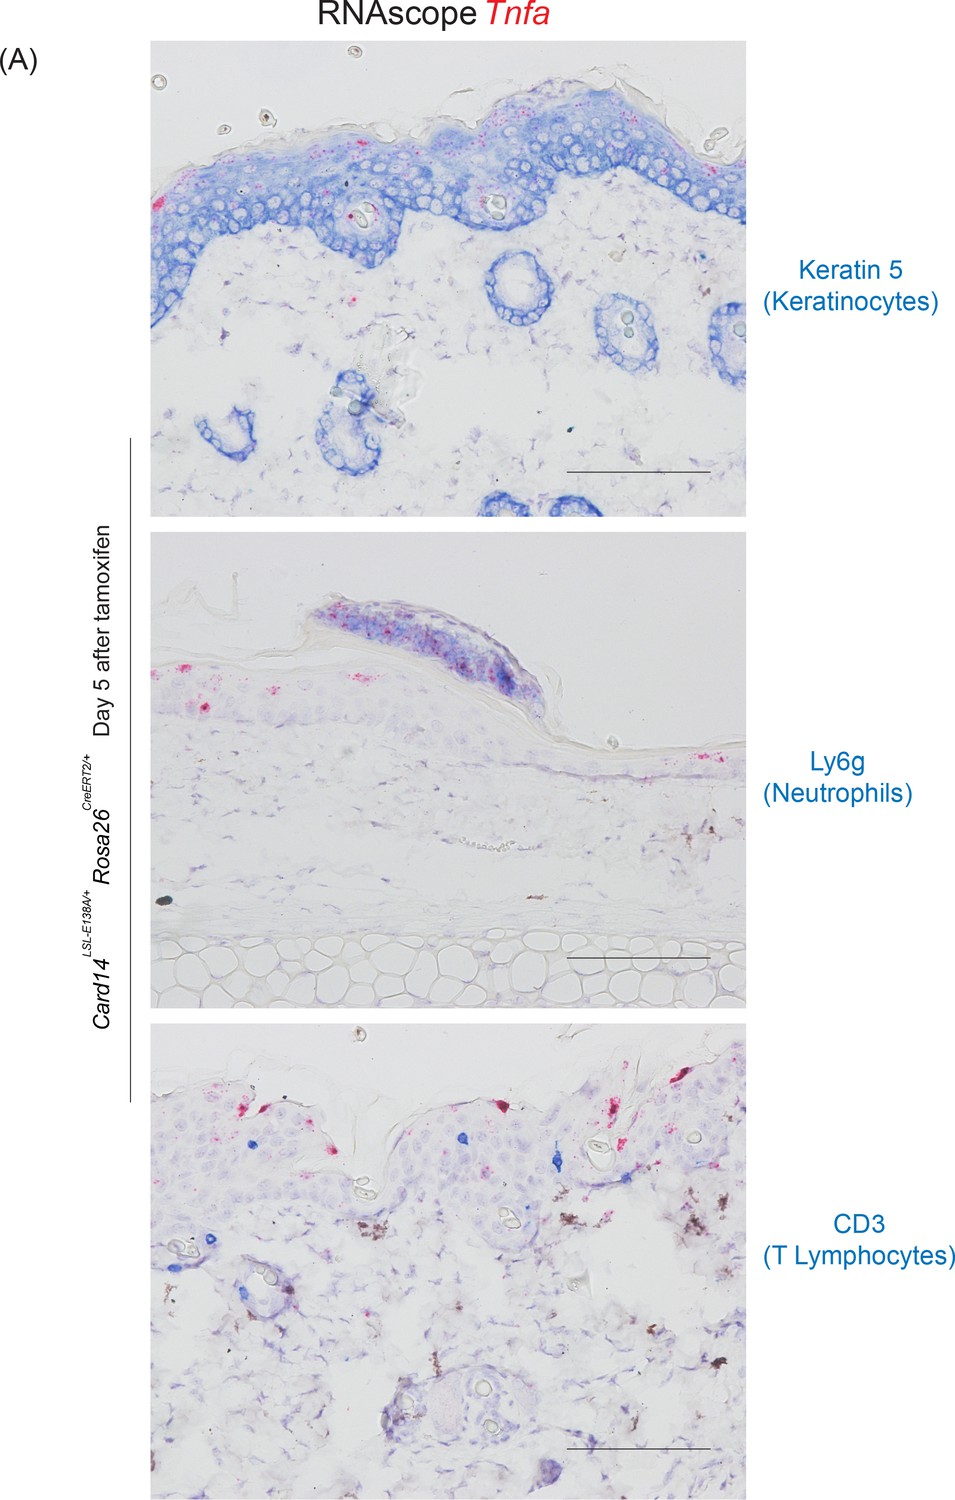
Keratinocytes are the main source of Tnfa mRNA in the epidermis of Card14LSL-E138A/+ Rosa26CreERT2/+ at day 5.
(A) Co-staining of Tnfa mRNA and keratin 5, Ly6g and CD3 in the skin 5 days after tamoxifen induction of Card14LSL-E138A/+ Rosa26CreERT2/+ mice assessed by RNAscope (pink - Tnfa mRNA) and IHC (blue - keratin 5, Ly6g, CD3). Scale bar = 100 µm.
Figure 4 with 1 supplement
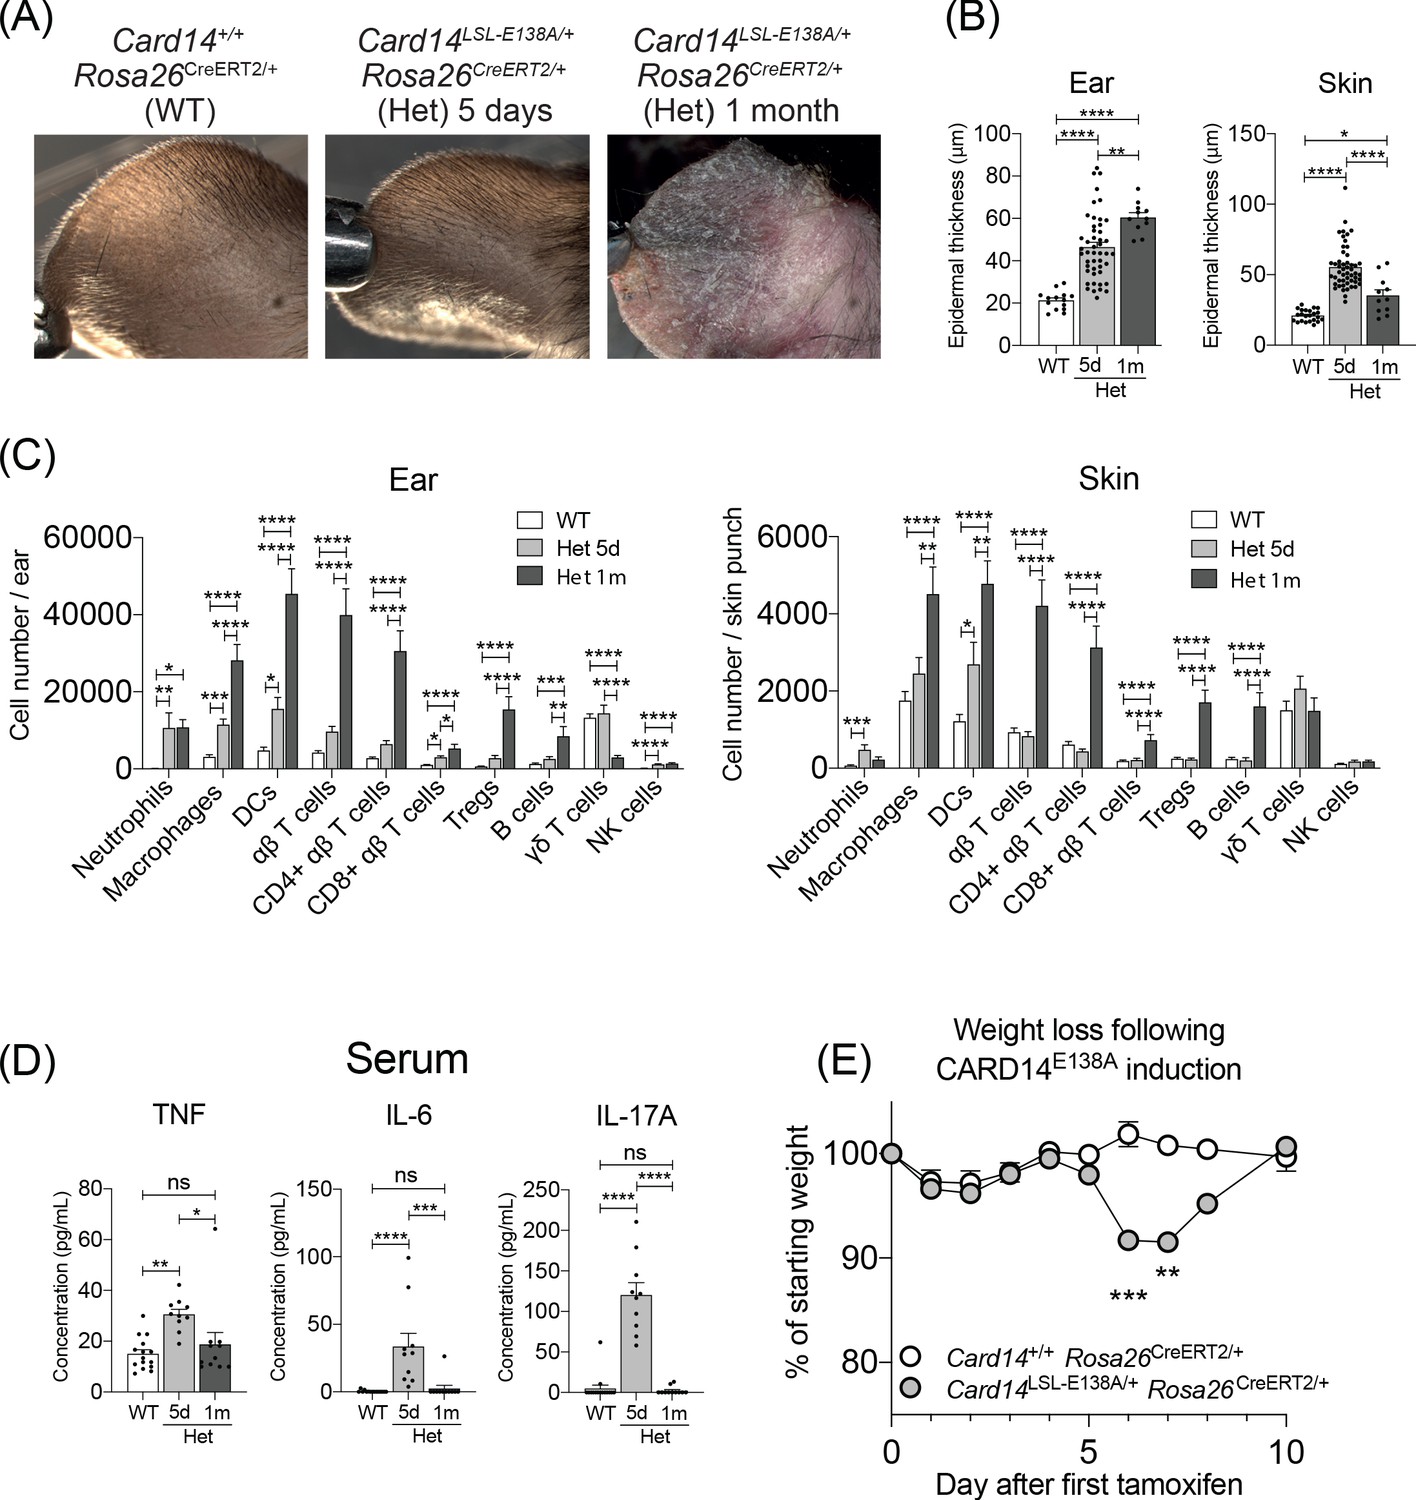
Evolution of inflammatory disease in Card14LSL-E138A/+ Rosa26CreERT2/+ mice over time.
Card14LSL-E138A/+Rosa26CreERT2/+ mice (Het) and Card14+/+ Rosa26CreERT2/+ controls (WT) were intraperitoneally injected with tamoxifen on days 0, 1 and 2. Mice were sacrificed and tissues analysed at 5d or 1 m following the first tamoxifen injection. (A) The backs of the ears were photographed. Photos shown are representative of numerous mice. (B) Epidermal thickness of ear and skin was measured from H and E stained tissue sections. Data shown are a pool of 14 independent experiments. (C) Flow cytometry was performed on ear and skin. Ear: data pooled from 6 independent experiments: WT, n = 31; Het 5d, n = 22; Het 1 m, n = 13. Skin: data pooled from 9 independent experiments: WT, n = 43; Het 5d, n = 32; Het 1 m, n = 18. Note: FACS data for d5 are the same as that shown in Figure 1F (D) Serum was collected and cytokine concentrations analysed by immunoplex array. Serum samples collected from 3 independent experiments. (E) Weight was monitored over time. Card14+/+ Rosa26CreERT2/+ (n = 5), Card14 LSL-E138A/+ Rosa26CreERT2/+ (n = 6). For each day, differences between groups analysed by Student’s t-test. Data collected from a mixture of male and female mice. (B-D) Differences between WT, Het 5d, and Het 1 m were analysed by one-way ANOVA. *, p<0.05; **, p<0.01; ***, p<0.001; ****, p<0.0001.
Figure 4—figure supplement 1
Lack of adaptive immune cells does not alter long-term pathology induced by heterozygous ubiquitous expression of CARD14E138A.
Eight-week old Card14+/+ Rosa26CreERT2/+Rag1+/+, Card14LSL-E138A/+ Rosa26CreERT2/+ Rag1+/+ and Card14LSL-E138A/+ Rosa26CreERT2/+ Rag1-/- mice were injected intraperitoneally with tamoxifen on days 0, 1 and 2. Mice were sacrificed and tissues analysed at 1 m after the first injection of tamoxifen. (A and E) Immunohistochemistry of the ear/back skin stained with S100A9 at 1 m. (B and F) Quantification of acanthosis (C and G) Quantification of dermal immune cell infiltration. (D and H) qRT-PCR analysis of the expression of the indicated genes in the ear/back skin. Fold changes were calculated by comparison with the Card14LSL-E138A/+ Rosa26CreERT2/+ Rag1+/+ mice group (I) Flow cytometry was performed on cells isolated from ears to characterise the immune cell infiltration at 1 m. Scale bar = 100 µm. Data in B, C, D, F, G and H pooled from 3 different experiments with n ≥ 4, data in I from 1 experiment with n ≥ 4. Differences between groups analysed by one-way ANOVA. *, p<0.05; **, p<0.01; ***, p<0.001; ****, p<0.0001.
Figure 5 with 3 supplements
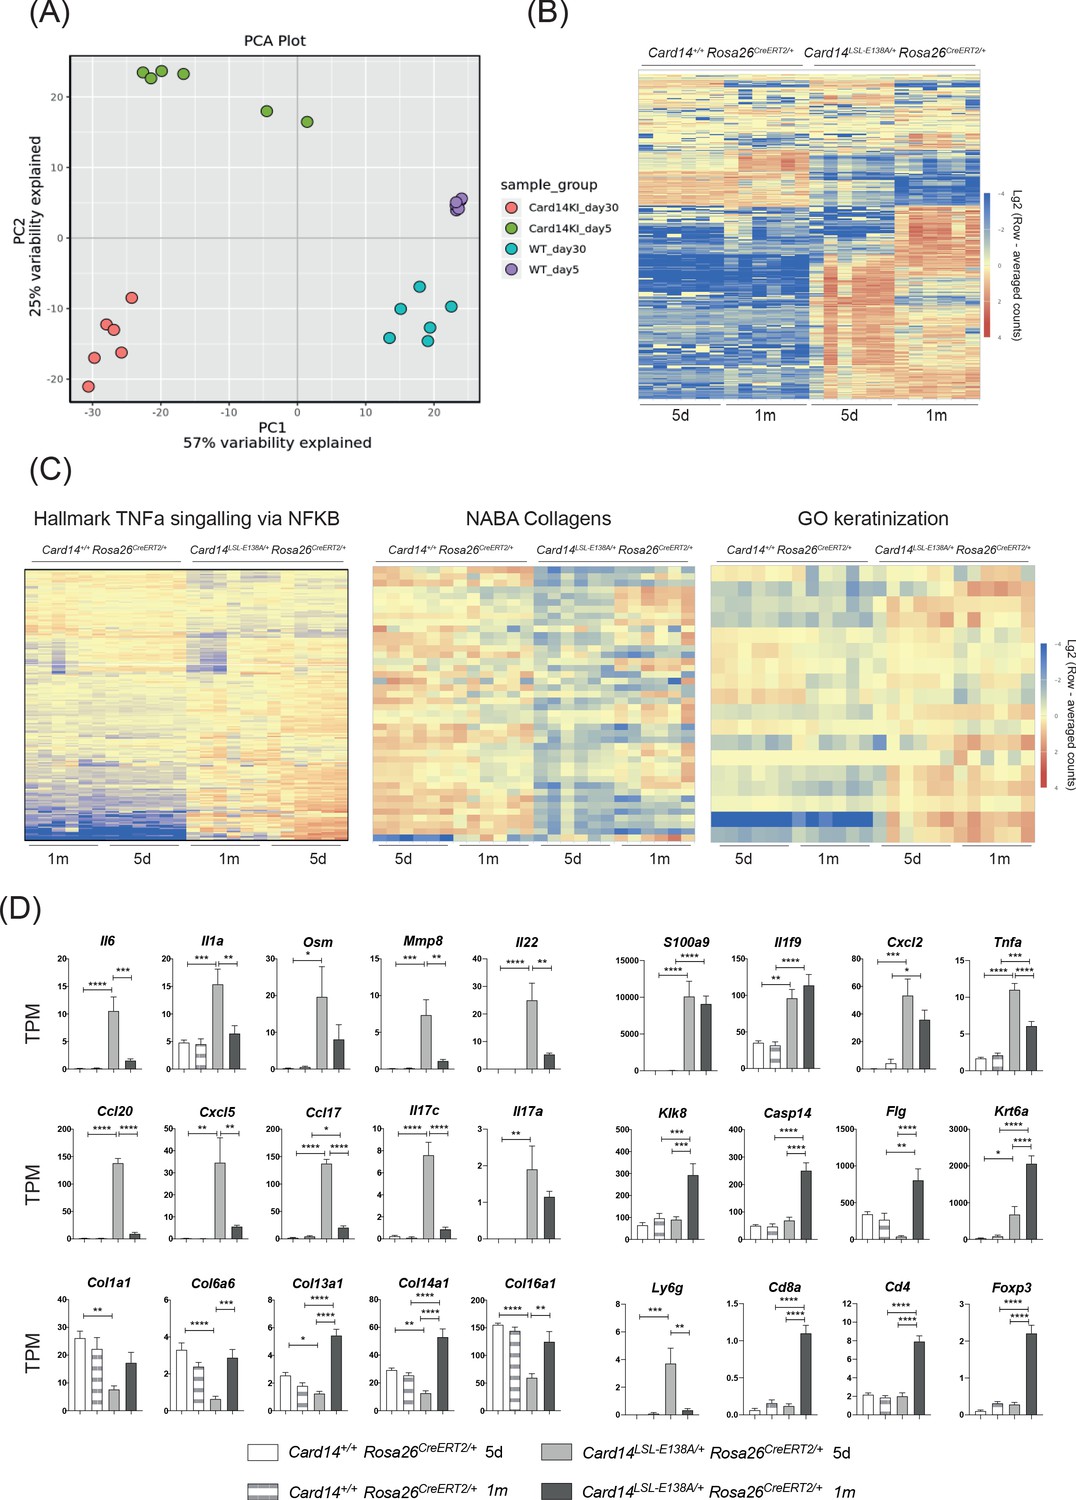
Acute and chronic effects of CARD14E138A signalling on gene transcription in the skin.
Card14LSL-E138A/+Rosa26CreERT2/+ mice (Het) and Card14+/+ Rosa26CreERT2/+ controls (WT) were intraperitoneally injected with tamoxifen on days 0, 1 and 2. Mice were sacrificed and tissues analysed at 5d or 1 m following the first tamoxifen injection (each experimental group n = 6). (A) Principal Component analysis separated samples by genotype (PCA1) and time point (PCA2). (B) Heatmap showing the top 500 differentially expressed genes. (C) Heatmap of the genes contained in the TNFα signalling via NF-κB (left), Naba Collagens (middle) and Keratinisation (right) pathways. (D) Graphs showing the expression levels of individual genes. TPM (Transcripts Per Million). Differences between WT, Het 5d and Het 1 m were analysed by one-way ANOVA. *, p<0.05; **, p<0.01; ***, p<0.001; ****, p<0.0001.
Figure 5—figure supplement 1
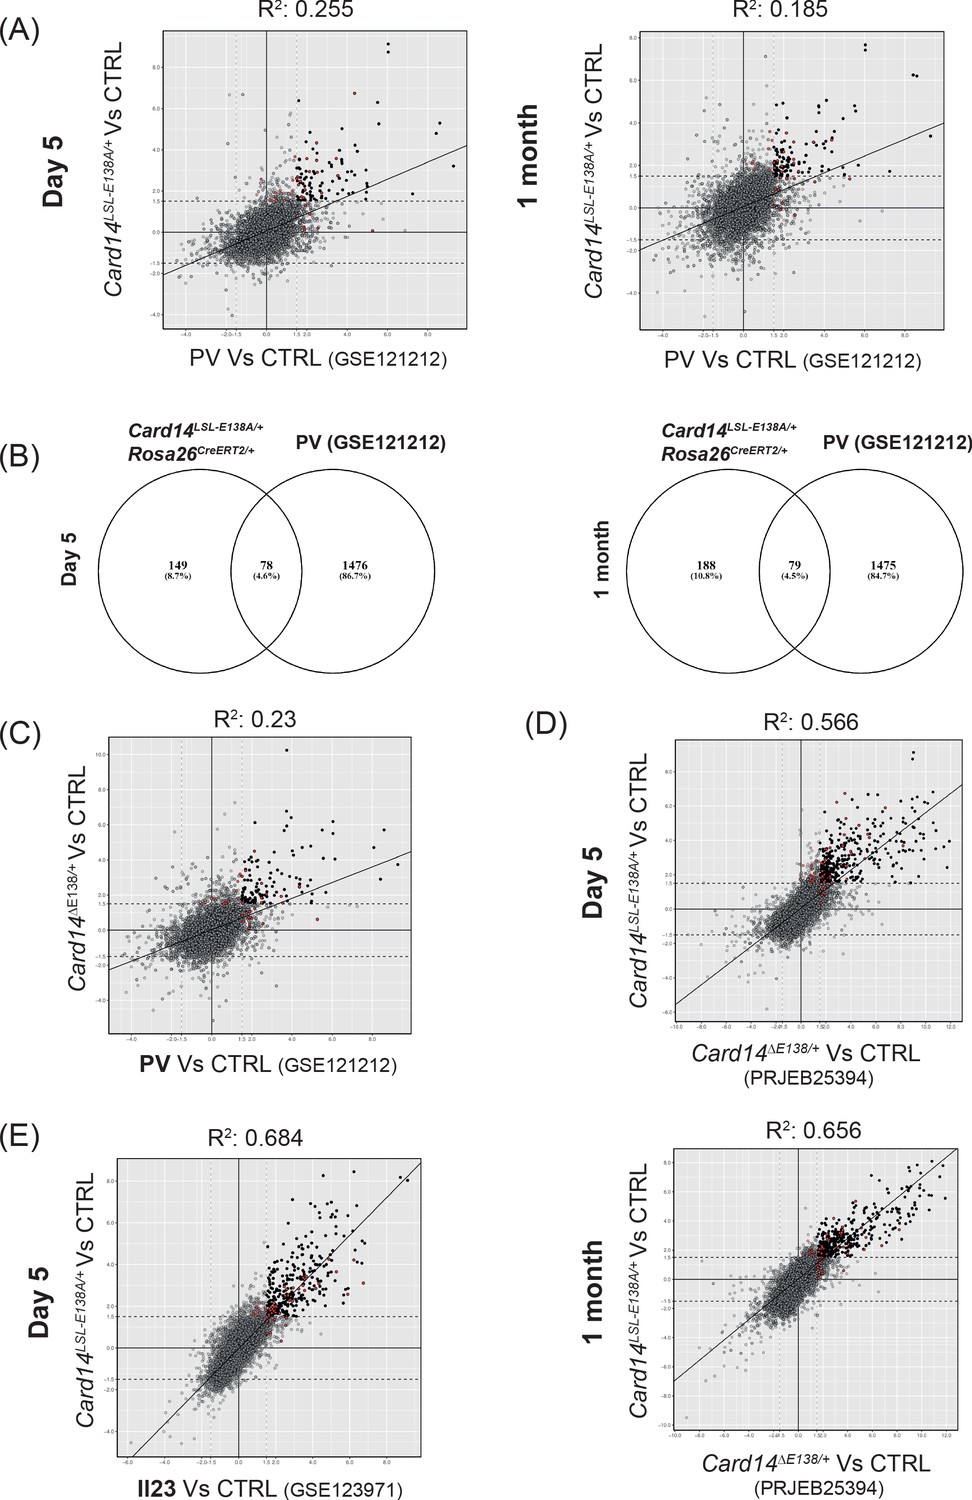
Similarities between the skin transcriptomes of Card14LSL-E138A/+ Rosa26CreERT2/+ mice and human skin pathologies.
(A) Scatter plots illustrating the concordance between logFC from genes of Card14LSL-E138A/+ Rosa26CreERT2/+ at d5 (left panel) and 1 m (right panel) and Psoriasis Vulgaris (PV) from the dataset GSE121212 (Tsoi et al., 2019). (B) Venn diagrams showing the amount of shared genes with logFC ≥2 and padj ≤0.05 between Card14LSL-E138A/+ Rosa26CreERT2/+ at d5 (left panel) and 1 m (right panel) and Psoriasis Vulgaris (PV) from the dataset GSE121212. (C) Scatter plots illustrating the concordance between logFC from genes of Card14ΔΕ138/+ and Psoriasis Vulgaris (PV) from the dataset GSE121212. (D) Scatter plots illustrating the concordance between logFC from genes of Card14LSL-E138A/+ Rosa26CreERT2/+ at d5 (upper panel) and 1 m (lower panel) and Card14Δ138/+ from the dataset PRJEB25394. (E) Scatter plot illustrating the concordance between logFC from genes of Card14LSL-E138A/+ Rosa26CreERT2/+ at d5 and the IL-23 injected mouse model at day five from dataset GSE123971 (Gauld et al., 2018). Red dots in the scatter plots indicate genes inside the Hallmark TNFa singaling via NFKB pathway.
Figure 5—figure supplement 2
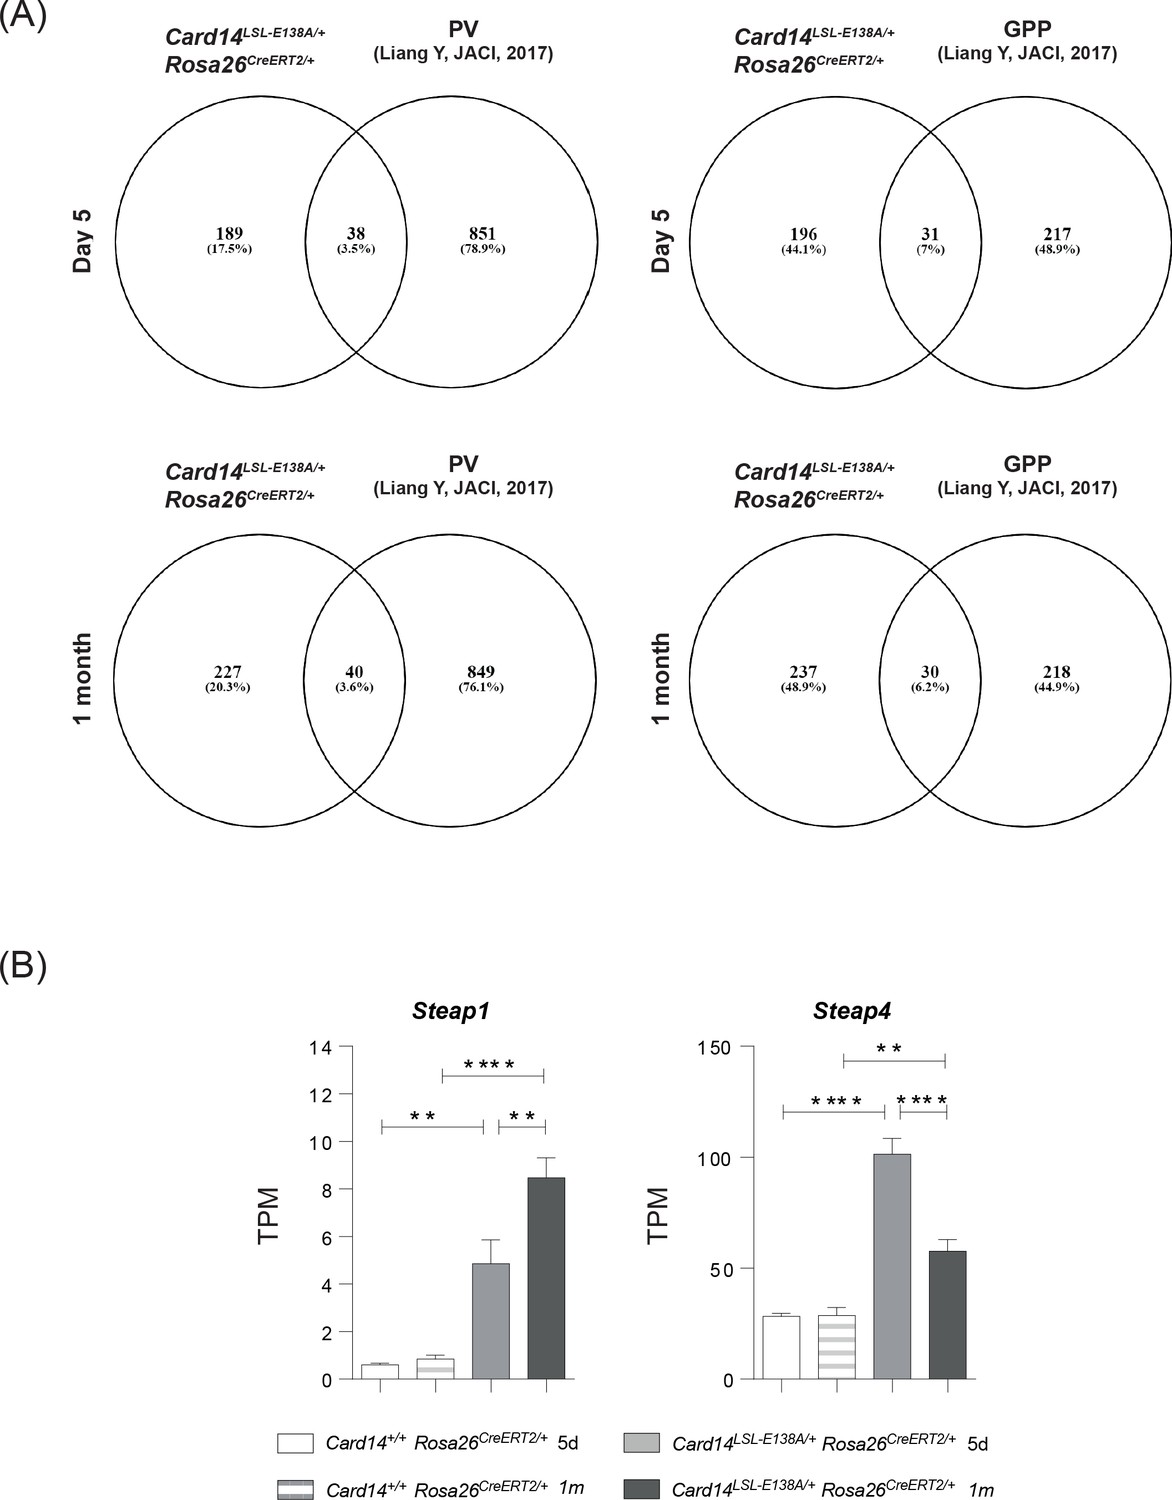
The skin transcriptome of Card14LSL-E138A/+Rosa26CreERT2/+ mice is more similar to the skin transcriptome of GPP than PV.
(A) Number and percentage of 2-fold upregulated differentially expressed genes shared with Card14LSL-E138A/+ Rosa26CreERT2/+ at d5 (upper panels) and 1 m (lower panels) and Psoriasis Vulgaris (PV) (left panels) and Generalised Pustular Psoriasis (GPP) (right panels) from Johnston et al., 2017. (B) Graphs show the expression levels of individual genes. TPM (Transcripts Per Million). Differences between Card14+/+ Rosa26CreERT2/+, Card14LSL-E138A/+ Rosa26CreERT2/+ 5d and Card14LSL-E138A/+ Rosa26CreERT2/+1 m were analysed by one-way ANOVA. *, p<0.05; **, p<0.01; ***, p<0.001; ****, p<0.0001.
Figure 5—figure supplement 3
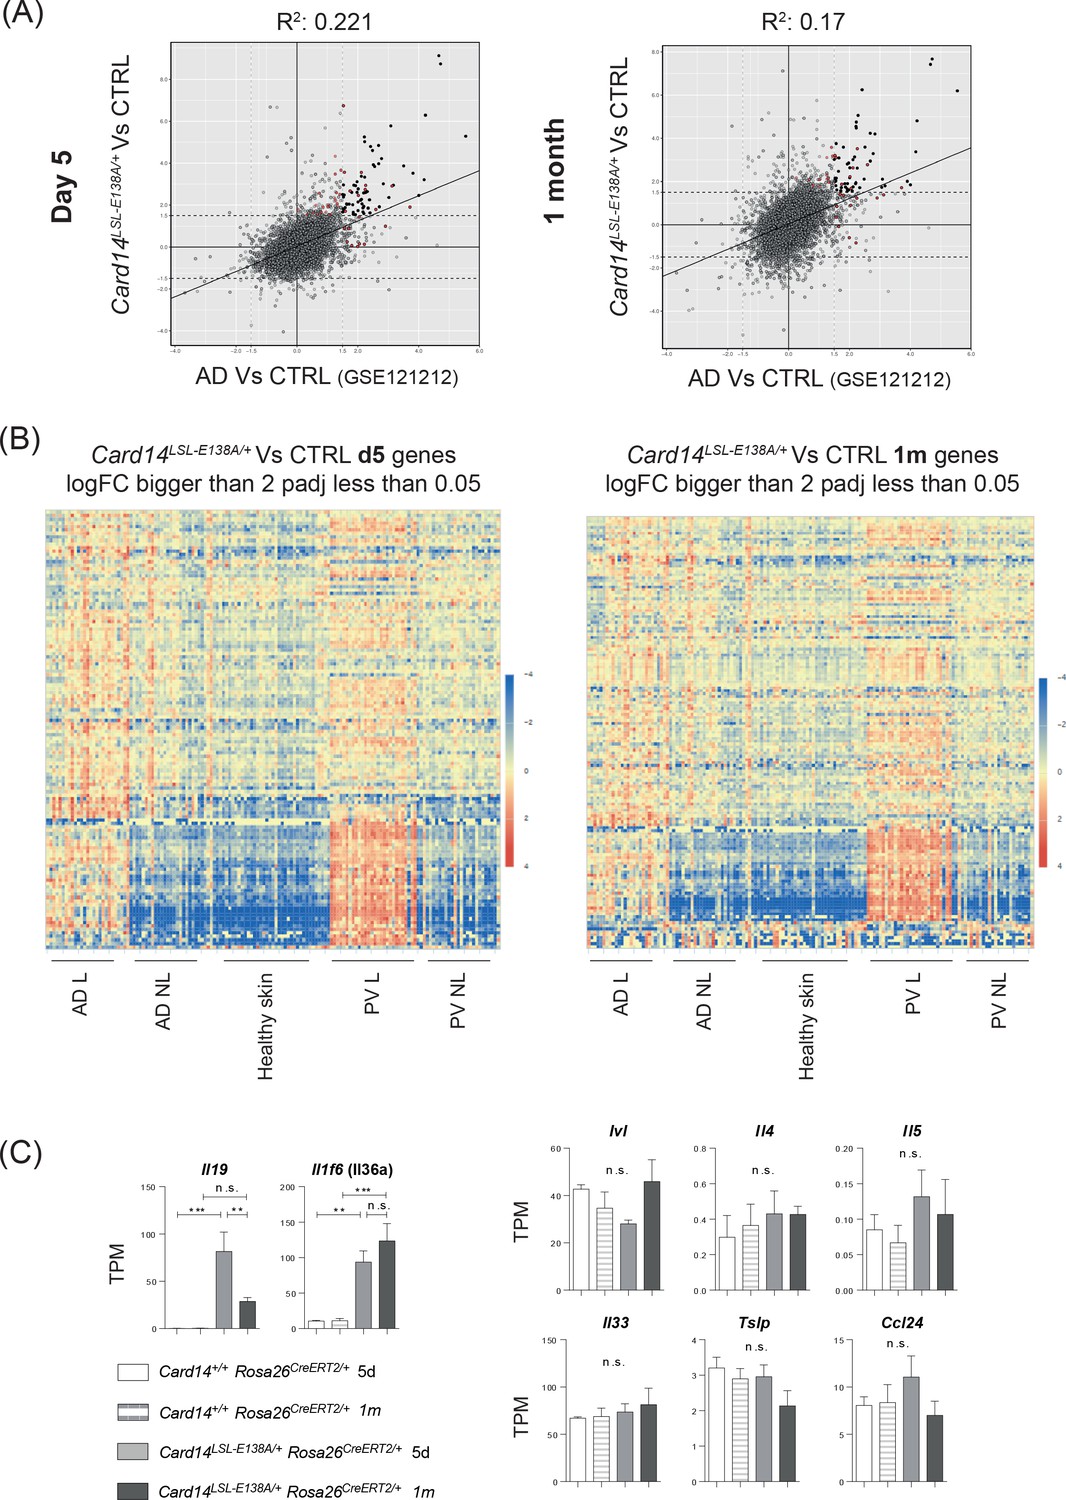
The skin transcriptome of Card14LSL-E138A/+Rosa26CreERT2/+ mice is more similar to the skin transcriptome of PV than AD.
(A) Scatter plots illustrating the concordance between logFC from genes of Card14LSL-E138A/+ Rosa26CreERT2/+ at d5 (left panel) and 1 m (right panel) an d Atopic Dermatitis (AD) from the dataset GSE121212 (Tsoi et al., 2019). (B) Heatmaps show the expression level of the genes logFC ≥2 and padj ≤0.05 from the skin of Card14LSL-E138A/+ Rosa26CreERT2/+ at d5 (left panel) and 1 m (right panel) in human skin samples (GSE121212). (C) Graphs showing the expression levels of individual genes. TPM (Transcripts Per Million). Red dots in the scatter plots indicate genes inside the Hallmark TNFa singaling via NFKB pathway. Differences between Card14+/+ Rosa26CreERT2/+ 5d, Card14+/+ Rosa26CreERT2/+1 m, Card14LSL-E138A/+ Rosa26CreERT2/+ 5d and Card14LSL-E138A/+ Rosa26CreERT2/+1 m were analysed by one-way ANOVA. *, p<0.05; **, p<0.01; ***, p<0.001; ****, p<0.0001.
Figure 6 with 2 supplements
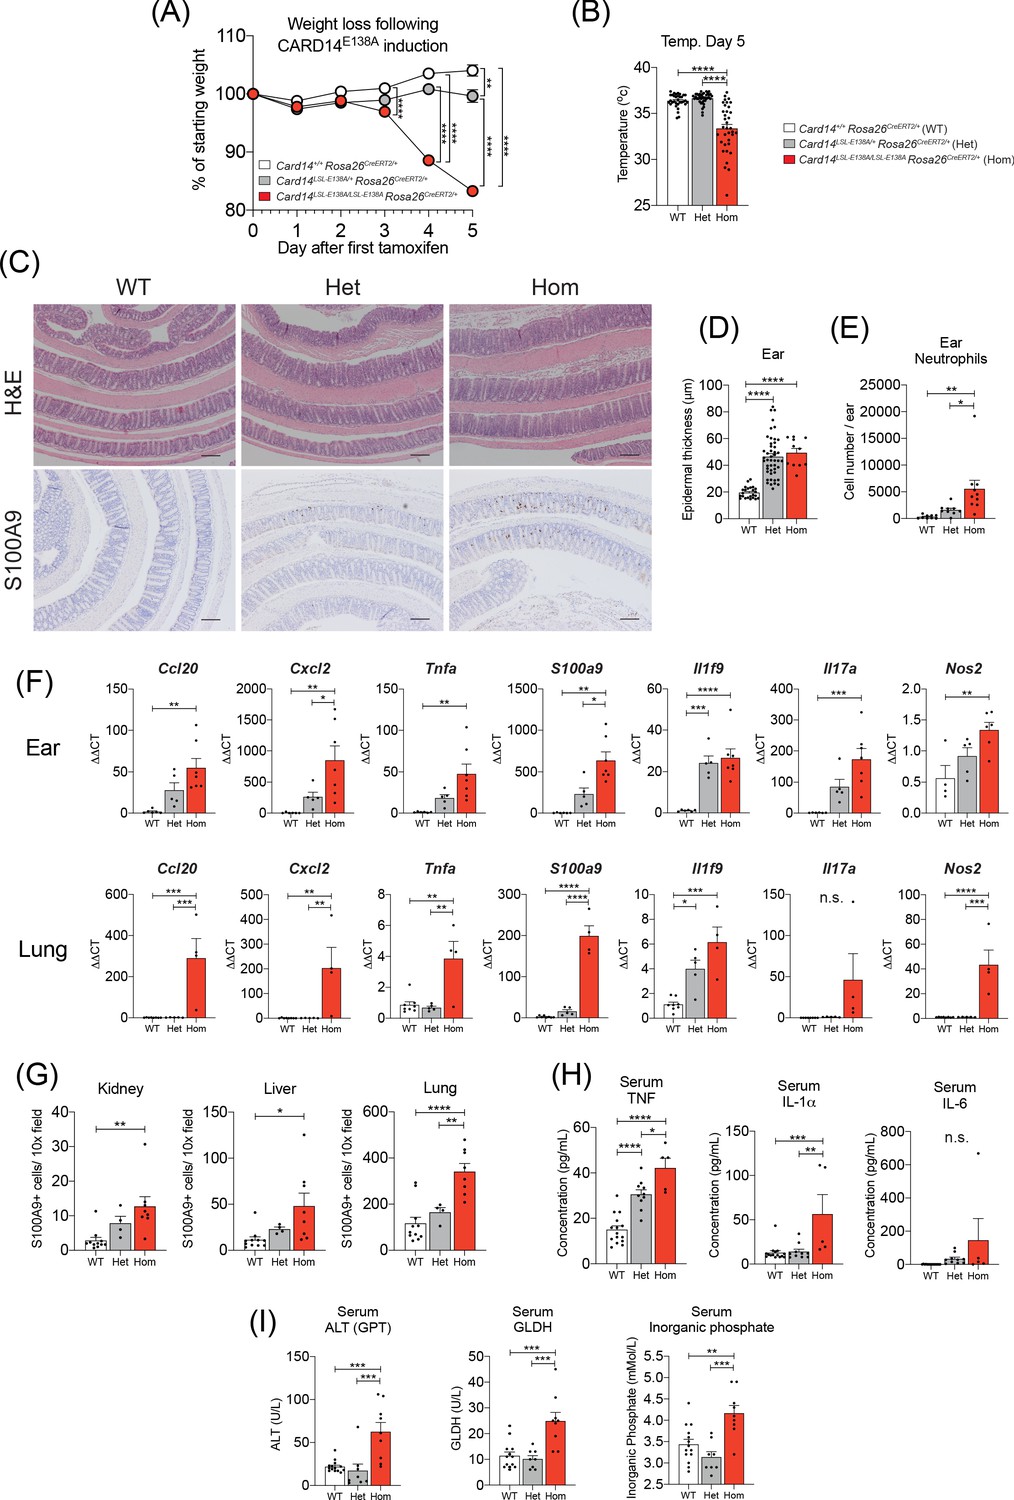
Induction of CARD14E138A in Card14LSL-E138A/LSL-E138A Rosa26CreERT2/+ mice induces a severe inflammatory phenotype.
Card14LSL-E138A/+Rosa26CreERT2/+ mice (Het), Card14LSL-E138A/LSL-E138A Rosa26CreERT2/+ mice (Hom) and Card14+/+ Rosa26CreERT2/+ controls (WT) were intraperitoneally injected with tamoxifen on d0, 1 and 2. All mice were sacrificed 5d after the first injection of tamoxifen and tissues collected for analysis. (A) Weight was monitored every day. WT (n = 24, from five independent experiments), Het (n = 22, from five independent experiments), Hom (n = 49, from nine independent experiments). (B) The temperatures of all mice were taken using a rectal thermometer on d5. WT from four independent experiments, Het from two independent experiments, Hom from six independent experiments. (C) Representative histology images of colons stained with H and E (upper panels) or anti-S100A9 (lower panels) are shown. (D) Epidermal thickness of ear at d5 was measured from H and E stained tissue sections. Data collected from 15 independent experiments. (E) Flow cytometry was performed to calculate neutrophil numbers in ears at d5. Data pooled from two independent experiments. (F) qRT-PCRs of d5 ear and lung tissue were performed. Fold changes were calculated by comparison with the WT mice group. Data pooled from two independent experiments. (G) S100A9 staining was performed via immunohistochemistry to enumerate myeloid cell numbers in kidney, liver, and lung at d5. Data pooled from two independent experiments. (H) Serum was taken at the point of sacrifice and analysed by immunoplex array. (I) Serum quantification of biochemistry for indicators of liver (ALT: alanine aminotransferase and GLDH: glutamate dehydrogenase) and kidney (inorganic phosphate) damage. Sera were collected from 4 (H and I) independent experiments. Data collected from a mixture of male and female mice. (B, D-I) Differences between WT, Het, and Hom analysed by one-way ANOVA. *, p<0.05; **, p<0.01; ***, p<0.001; ****, p<0.0001. (C) Scale bar = 200 µm.
Figure 6—figure supplement 1
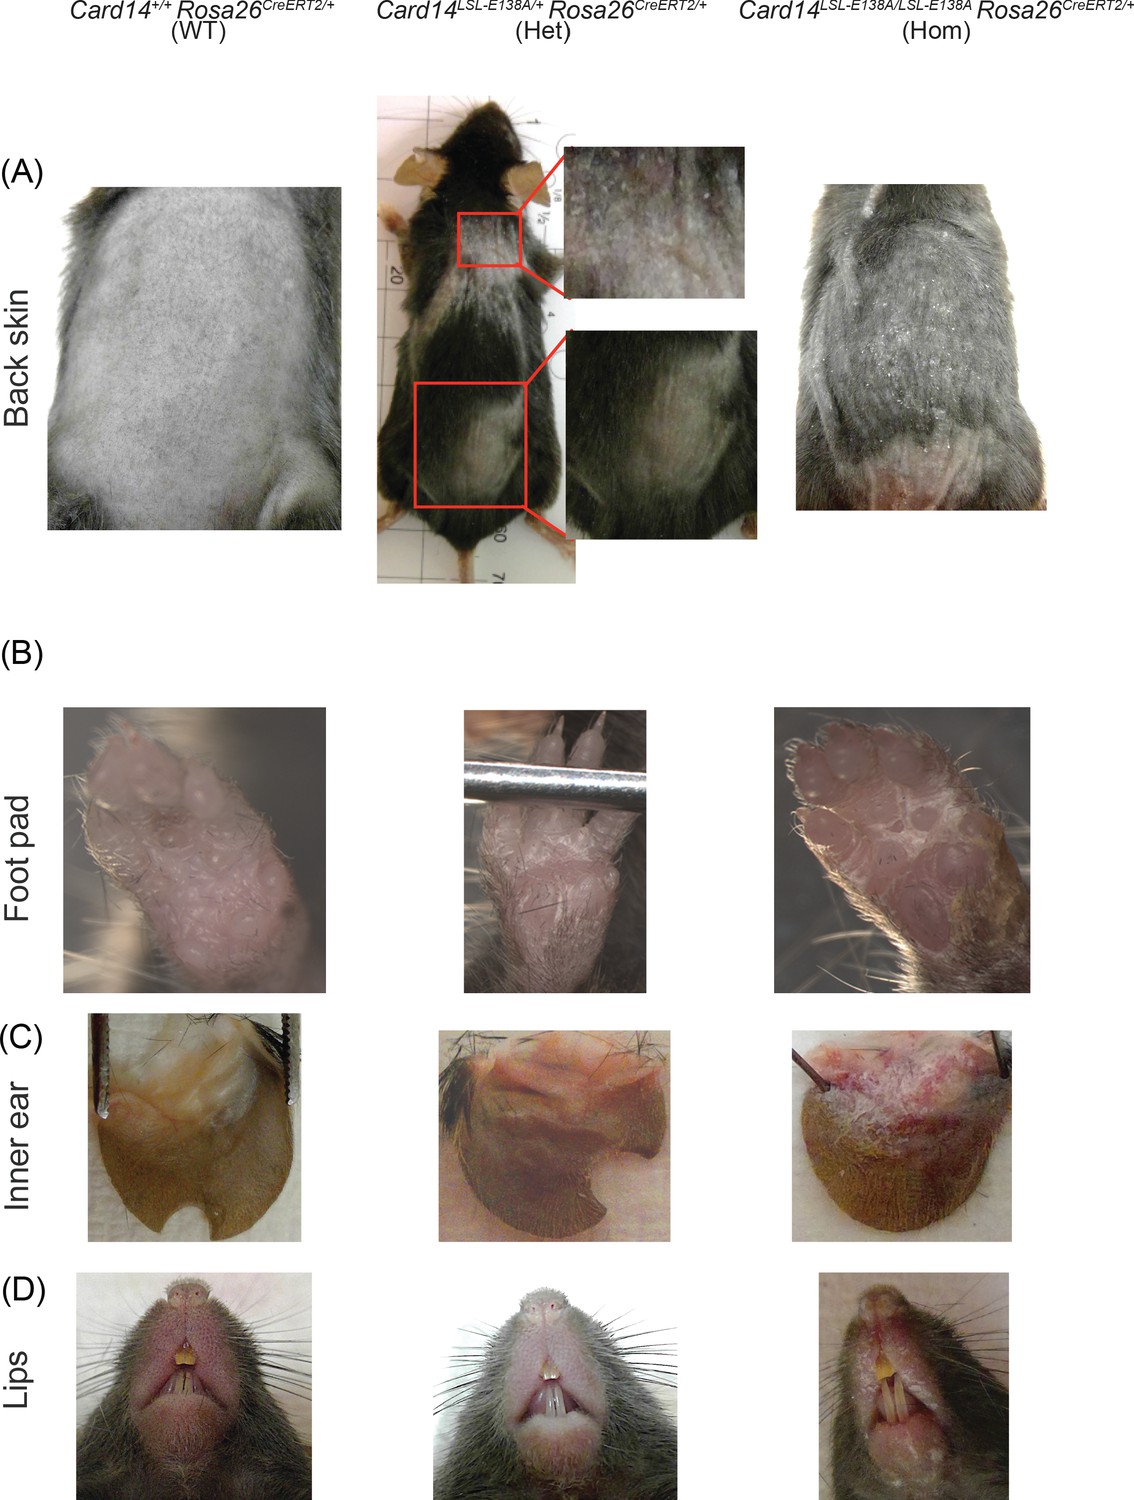
Increased skin scaling in Card14LSL-E138A/LSL-E138A Rosa26CreERT2/+ compared to Card14LSL-E138A/+ Rosa26CreERT2/+ mice following tamoxifen injection.
Card14LSL-E138A/LSL-E138A Rosa26CreERT2/+ (Hom), Card14LSL-E138A/+ Rosa26CreERT2/+ (Het), and Card14+/+ Rosa26CreERT2/+ (WT) mice were injected intraperitoneally with tamoxifen on d0, 1 and 2. Mice were sacrificed on d5 and photographs taken to show the extent of skin scaling on different areas of the body. (A) The uninvolved back skin of WT mice was compared to that of Het and Hom mice. The upper back of Het mice often showed visible scaling, whilst the lower did not. The total back skin of Hom mice was often uniformly covered by fine scales. (B) The foot pads of Het and Hom mice were affected to the same extent. (C) The inner ear of Hom mice was visibly scalier than that of Het mice. (D) The lips of Hom mice displayed consistent and extensive scaling, in contrast to Het mice.
Figure 6—figure supplement 2
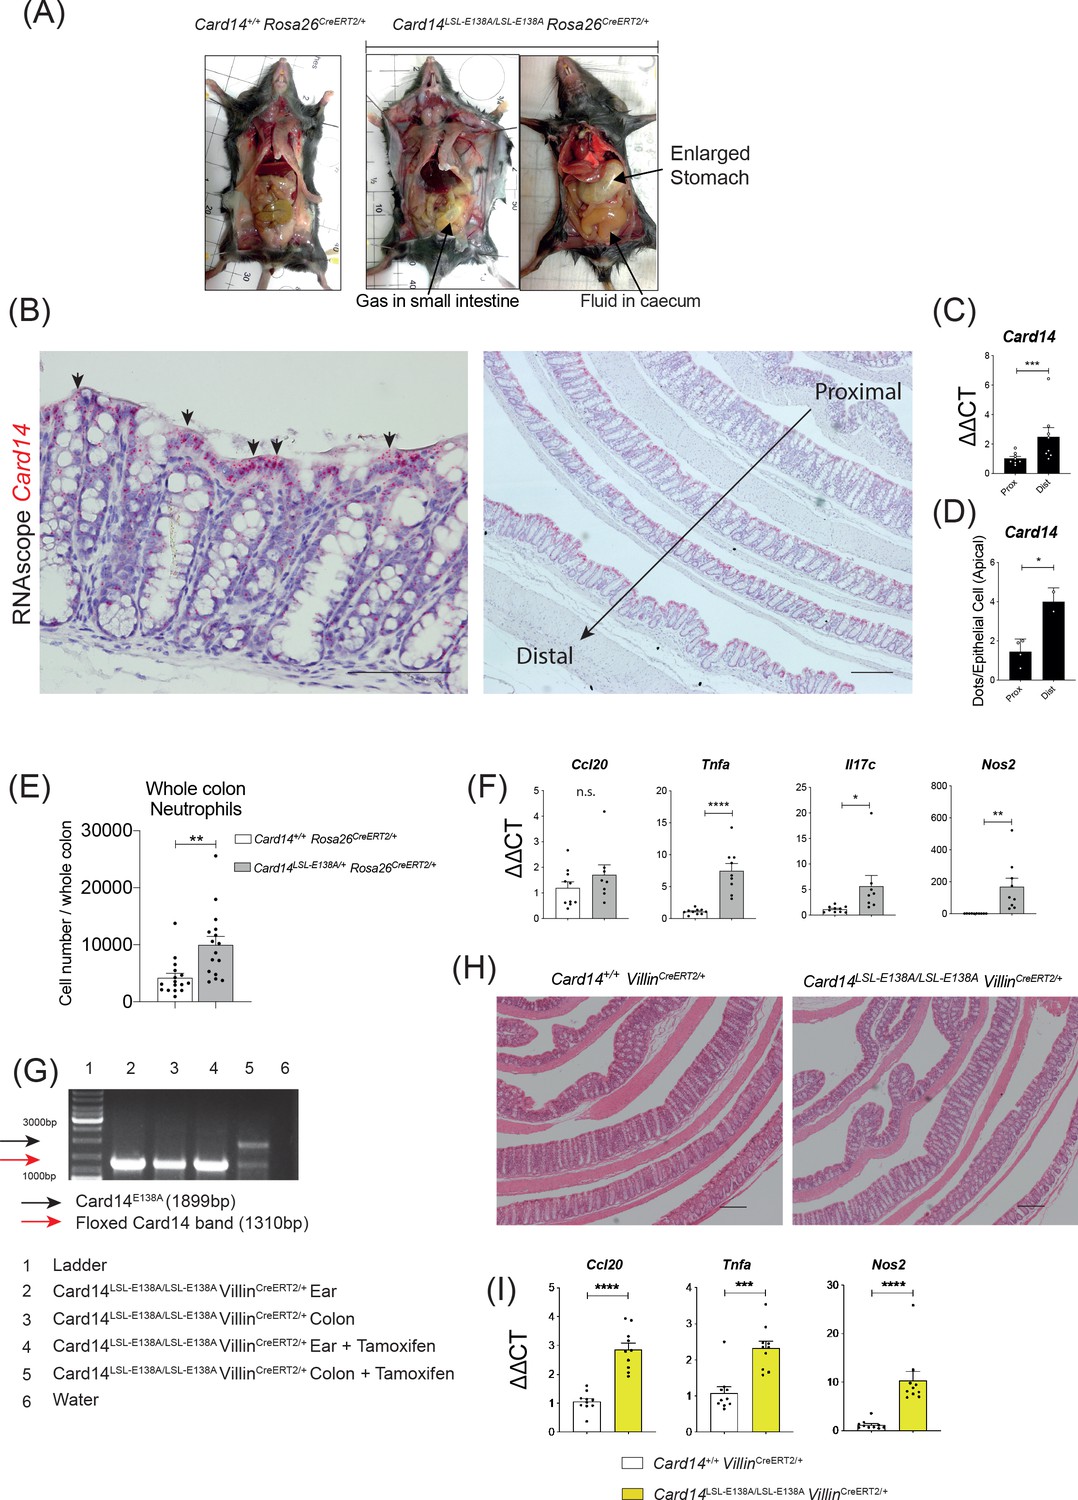
Effects of CARD14E138A expression in the colon.
(A) Following sacrifice, mice were dissected to display the gastrointestinal tract. Representative photographs are shown (B) Localisation of Card14 mRNA expression in the colon of a WT mouse was assessed by RNAscope. (C) qRT-PCR analysis of the expression of Card14 mRNA in the distal and proximal colon of a WT mouse. (D) Quantification of the expression of Card14 mRNA by RNAscope. Pink dots, each corresponding to a copy of mRNA from Card14 were counted in ten apical cells from the distal and proximal colon of 2 WT mice. Results are expressed as dots per cell. (E) The number of neutrophils infiltrating the colon at d5 after induction with tamoxifen assessed by FACS. Data pooled from three independent experiments. (F) qRT-PCR analysis of the expression of indicated genes in the colon at d5 after induction with tamoxifen. (G) PCR was used to monitor recombination of Card14E138A locus ± tamoxifen (5d) in tissues from Card14LSL-E138A/LSL-E138A VillinCreERT2/+ mice. (H) Representative histology image of the colons stained by H and E from Card14+/+ VillinCreERT2/+ and Card14LSL-E138A/LSL-E138A VillinCreERT2/+ mice 1 m after Tamoxifen injection. (I) qRT-PCR analysis of the expression of indicated genes in the colon at 1 m after induction with tamoxifen (B) Left picture Scale bar = 100 µm. (B) Right picture Scale bar = 200 µm. Data in C and F pooled from two independent experiments with n ≥ 4. Differences between groups analysed by Student’s t-test. *, p<0.05; **, p<0.01; ***, p<0.001; ****, p<0.0001.
Figure 7
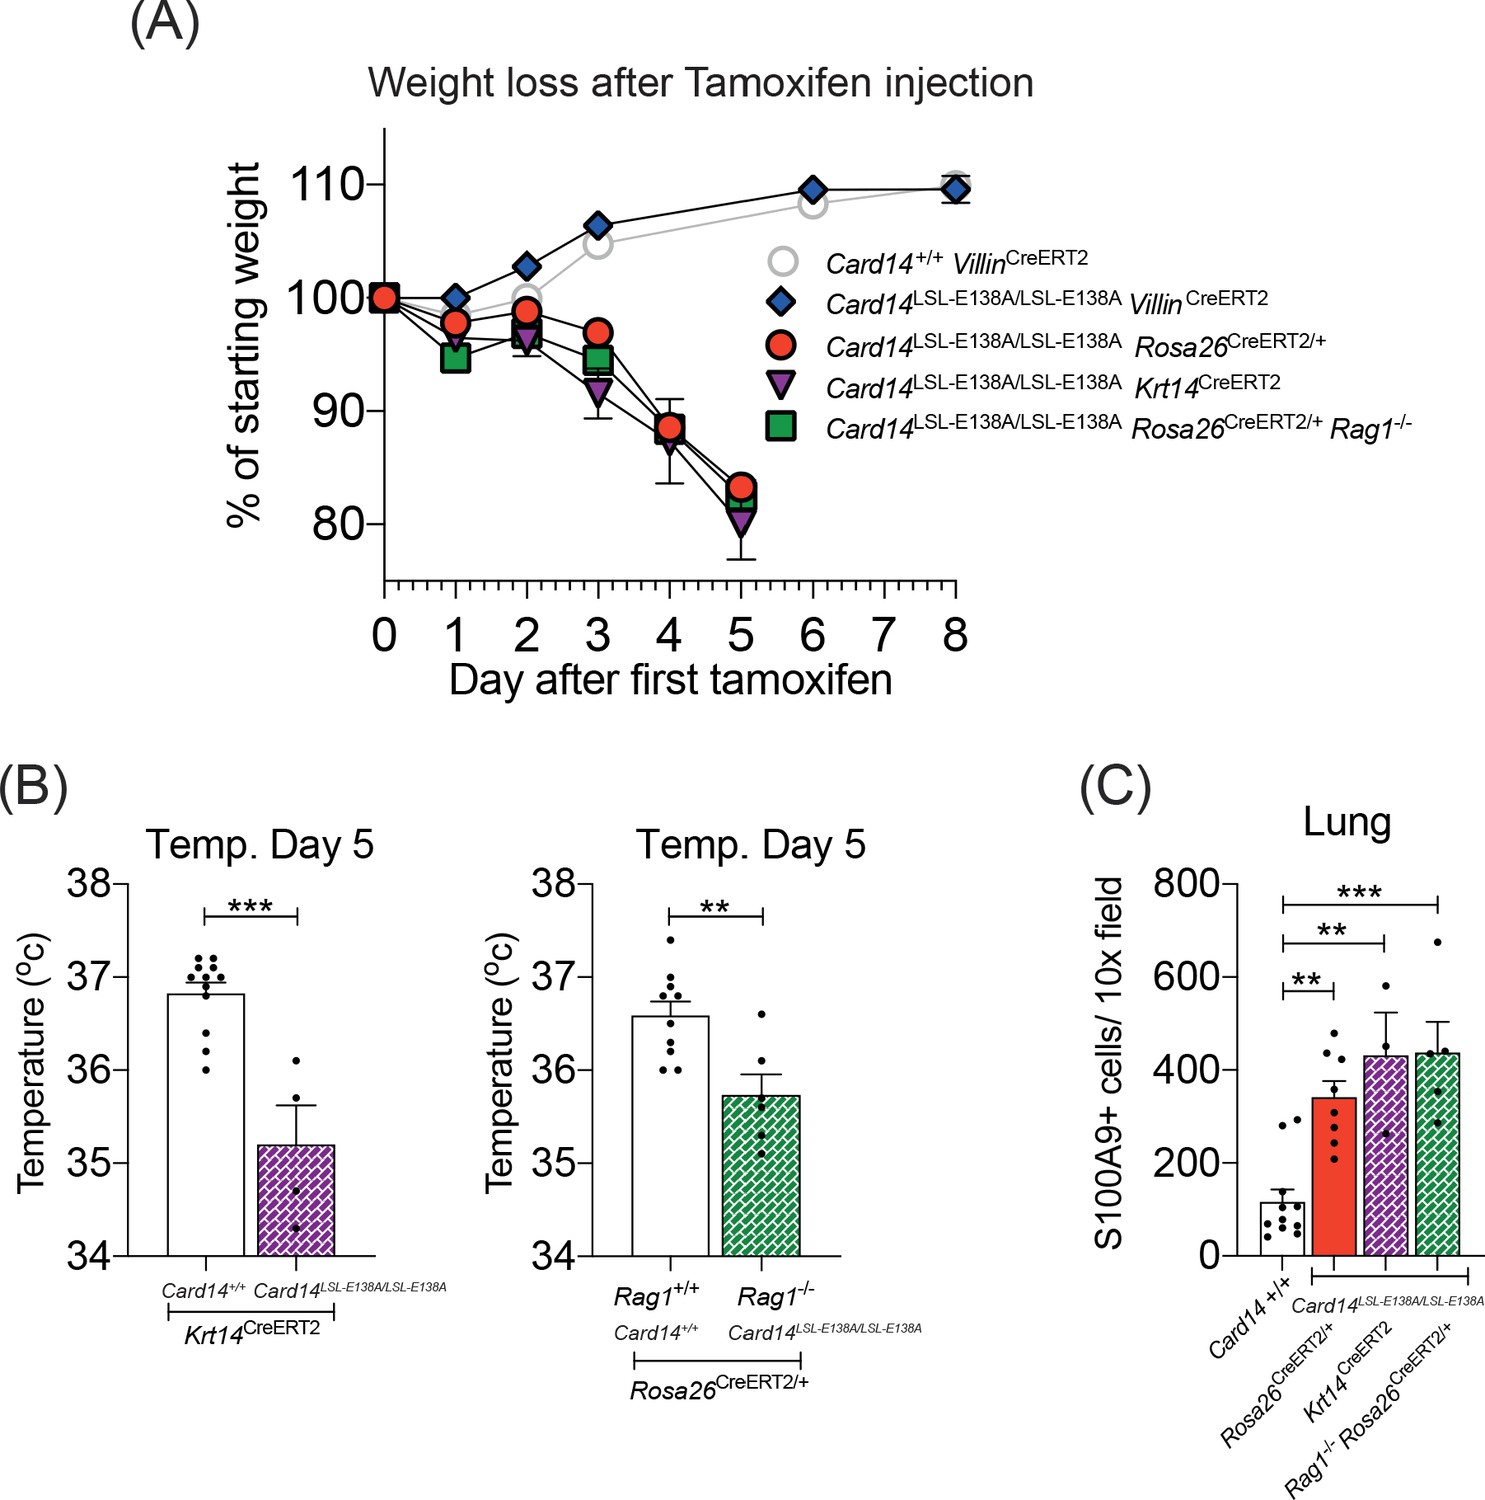
CARD14E138A signalling in keratinocytes induces a severe systemic phenotype independently of the adaptive immune system.
Mice of indicated genotypes were intraperitoneally injected with tamoxifen on d0, 1 and 2. (A) Weight was monitored over time. Card14LSL-E138A/LSL-E138A Rosa26CreERT2/+ (n = 49, from nine independent experiments), Card14LSL-E138A/LSL-E138A Krt14CreERT2 (n = 6, from two independent experiments), and Rag1-/-Card14LSL-E138A/LSL-E138A Rosa26CreERT2/+ mice (n = 11, from two independent experiments) lost weight, necessitating sacrifice 5d after the first injection of tamoxifen. Card14LSL-E138A/LSL-E138A VillinCreERT2 mice (n = 7, from two independent experiments) and Card14+/+ VillinCreERT2 controls (n = 19, from four independent experiments) were monitored for an extended period and did not lose weight. (B) Temperatures of indicated mice were taken by rectal thermometer 5d after the first injection of tamoxifen. Card14+/+ Krt14CreERT2, and Card14LSL-E138A/LSL-E138A Krt14CreERT2, from two independent experiments; Rag+/+ Card14+/+ Rosa26CreERT2, from four independent experiments; Rag-/- Card14LSL-E138A/LSL-E138A Rosa26CreERT2, from one experiment. Differences between groups analysed by Student’s t-test. (C) Numbers of S100A9+ myeloid cells were calculated from stained sections of lung tissue taken from indicated genotypes on d5. Card14+/+ mice represent a mixture of Card14+/+ Rosa26CreERT2/+ and Card14+/+ Krt14CreERT2 mice. Data pooled from two independent experiments. Differences between groups analysed by one-way ANOVA. *, p<0.05; **, p<0.01; ***, p<0.001.
Figure 8

Anti-TNF ameliorates severe systemic phenotype induced in Card14LSL-E138A/LSL-E138ARosa26CreERT2/+ mice Card14LSL-E138A/LSL-E138ARosa26CreERT2/+ mice were intraperitoneally injected with tamoxifen on d0, 1 and 2 and intraperitoneally injected with either isotype control, anti-TNF, or anti-GR1 on days −1, 1 and 3.
Mice were sacrificed on d5. (A) Mouse weight was monitored from d0 until the experiment end. Isotype (n = 24, from four independent experiments), anti-TNF (n = 11, from two independent experiments), anti-GR1 (n = 11, from two independent experiments). For each day, differences between groups were analysed by one-way ANOVA. (B) Mouse temperatures were taken by rectal thermometer on d5. Card14+/+ control mice are a mixture of Cre-, Rosa26CreERT2/+ and Krt14CreERT2 mice (from four independent experiments). Card14LSL-E138A/LSL-E138A Rosa26CreERT2/+ mice: isotype (from four independent experiments), anti-TNF (from two independent experiments), anti-GR1 (from two independent experiments). (C) Numbers of S100A9+ myeloid cells were calculated from stained sections of kidney, liver, and lung tissue taken from isotype, anti-TNF or anti-GR1 treated Card14LSL-E138A/LSL-E138A Rosa26CreERT2/+ mice and Card14+/+ Rosa26CreERT2/+ (not antibody treated) controls. Data pooled from three independent experiments. (D) qRT-PCR was performed on d5 ear and lung tissue from Card14+/+Rosa26CreERT2/+ control mice and Card14LSL-E138A/LSL-E138A Rosa26CreERT2/+ mice treated with either isotype control IgG or anti-TNF. Fold changes were calculated by comparison with the Card14LSL-E138A/LSL-E138A Rosa26CreERT2/+ isotype treated group One representative experiment of 2 is shown. (E) Serum quantification of biochemistry for indicators of liver (ALT: alanine aminotransferase and GLDH: glutamate dehydrogenase) and kidney (inorganic phosphate) damage. Sera were collected from nine independent experiments. Differences between groups analysed by one-way ANOVA (A-E). *, p<0.05; **, p<0.01; ***, p<0.001, ****, p<0.0001.
Tables
Key resources table
| Reagent type (species) or resource | Designation | Source or reference | Identifiers | Additional information |
|---|---|---|---|---|
| Genetic Reagent (M. musculus) | Card14LSL-E138A | Taconic | MGI:6111507 | Mice were bred into the C57BL6/J background for > 8 generations by the Ley lab. Strain name at the Francis Crick Institute SLAT. |
| Genetic Reagent (M. musculus) | Rosa26CreERT2 | PMID:12582257 | RRID:IMSR_TAC:10471 | Strain name at the Francis Crick Institute BRAW |
| Genetic Reagent (M. musculus) | VillinCreERT2 | PMID:15282745 | RRID:IMSR_JAX:020282 | Strain name at the Francis Crick Institute BRGU |
| Genetic Reagent (M. musculus) | Krt14CreERT2 | PMID:14742263 | (MGI:4357971) | Mice were bred into the C57BL6/J background for > 8 (more like N5 for the SLDD12) generations by the Ley lab Strain name at the Francis Crick Institute SLBN |
| Genetic Reagent (M. musculus) | Rag1-/- | PMID:7926785 | (MGI:2448994) | Historically Backcrossed 12 x to C57BL/6J total N unknown Strain name at the Francis Crick Institute BRAU |
| Gene (M. musculus) | Card14 | Mus musculus Mouse Genome Informatics | MGI:2386258 | |
| Cell line (H. sapiens) | NHEK | Lonza | Cat #00192627 | |
| Antibody | IgG1 isotype control (mouse monoclonal) | BioXcell | MOPC-21 | 0.5 mg per injection |
| Antibody | Anti-Il17a (mouse monoclonal) | BioXcell | clone 17F3 | 0.5 mg per injection |
| Antibody | IgG2b isotype control (Rat monoclonal) | BioXcell | LTF-2 | 0.5 mg per injection |
| Antibody | Anti-Gr1 (Rat monoclonal) | BioXcell | clone RB6-8C5 | 0.5 mg per injection |
| Antibody | rat IgG1 isotype control (Rat monoclonal) | BioXcell | TNP6A7 | 0.5 mg per injection |
| Antibody | Anti-TNFa (Rat monoclonal) | BioXcell | clone XT3.11 | 0.5 mg per injection |
| Antibody | Anti-Ki67 (Rabbit monoclonal) | Abcam | ab16667 | 1/350 |
| Antibody | Anti-Involucrin (Rabbit monoclonal) | In house | ERL-3 | Produced by the Crick Cell Services. 1/800 |
| Antibody | Anti-S100a9 (Rat monoclonal) | In house | 2b10 | 1/1000 (Can be purchased from abcam ab105472) |
| Antibody | Anti-Endomucin (Rat monoclonal) | Santa Cruz | sc-65495 | 1/400 |
| Antibody | anti-FLAG (Mouse monoclonal) | Sigma | F1804 | 1/1000 |
| Antibody | anti-CARD14 (Rabbit polyclonal) | This paper | CUK-1813 | Produced by Covalab 1/1000 |
| Antibody | anti-Hsp90 (Rabbit polyclonal) | Santa Cruz | sc-7947 | 1/5000 |
| Sequence-based reagent | Card14 oligo 1 | This paper | PCR oligo | TCAACATTATCTTCCAAGCTCC |
| Sequence-based reagent | Card14 oligo 2 | This paper | PCR oligo | TGACCTCACGTTTCATGCG |
| Commercial assay or kit | SuperScript VILO cDNA Synthesis Kit | Life Technologies | 11754250 | |
| Commercial assay or kit | RNeasy mini kit | Qiagen | 74106 | |
| Commercial assay or kit | LEGENDplex, | Biolegend | 740150 | |
| Commercial assay or kit | TaqMan Gene Expression Master Mix | Thermo Fisher | 4369514 | |
| Commercial assay or kit | Card14 RNAscope | ACDBio | Probe - Mm-Card14 Cat No 476041 | |
| Chemical compound, drug | Corn oil | Sigma | C8267 | 100 ul per injection |
| Chemical compound, drug | Tamoxifen | Sigma | T5648 | 2 mg per injection |
| Software, algorithm | Image J | NIH, Bethesda, MD | RRID:SCR_003070 | https://imagej.nih.gov/ij/ |
| Software, algorithm | GraphPad Prism | GraphPad Prism (https://graphpad.com) | RRID:SCR_002798 | GraphPad Prism eight software for Mac |
Additional files
Download links
A two-part list of links to download the article, or parts of the article, in various formats.
Downloads (link to download the article as PDF)
Open citations (links to open the citations from this article in various online reference manager services)
Cite this article (links to download the citations from this article in formats compatible with various reference manager tools)
CARD14E138A signalling in keratinocytes induces TNF-dependent skin and systemic inflammation
eLife 9:e56720.
https://doi.org/10.7554/eLife.56720


