Drosophila TRPγ is required in neuroendocrine cells for post-ingestive food selection
- Department of Bio and Fermentation Convergence Technology, Kookmin University, Republic of Korea
- Department of Biological Chemistry, The Johns Hopkins University School of Medicine, United States
- Neuroscience Research Institute and Department of Molecular, Cellular and Developmental Biology, University of California, Santa Barbara, United States
Figures
Figure 1 with 1 supplement
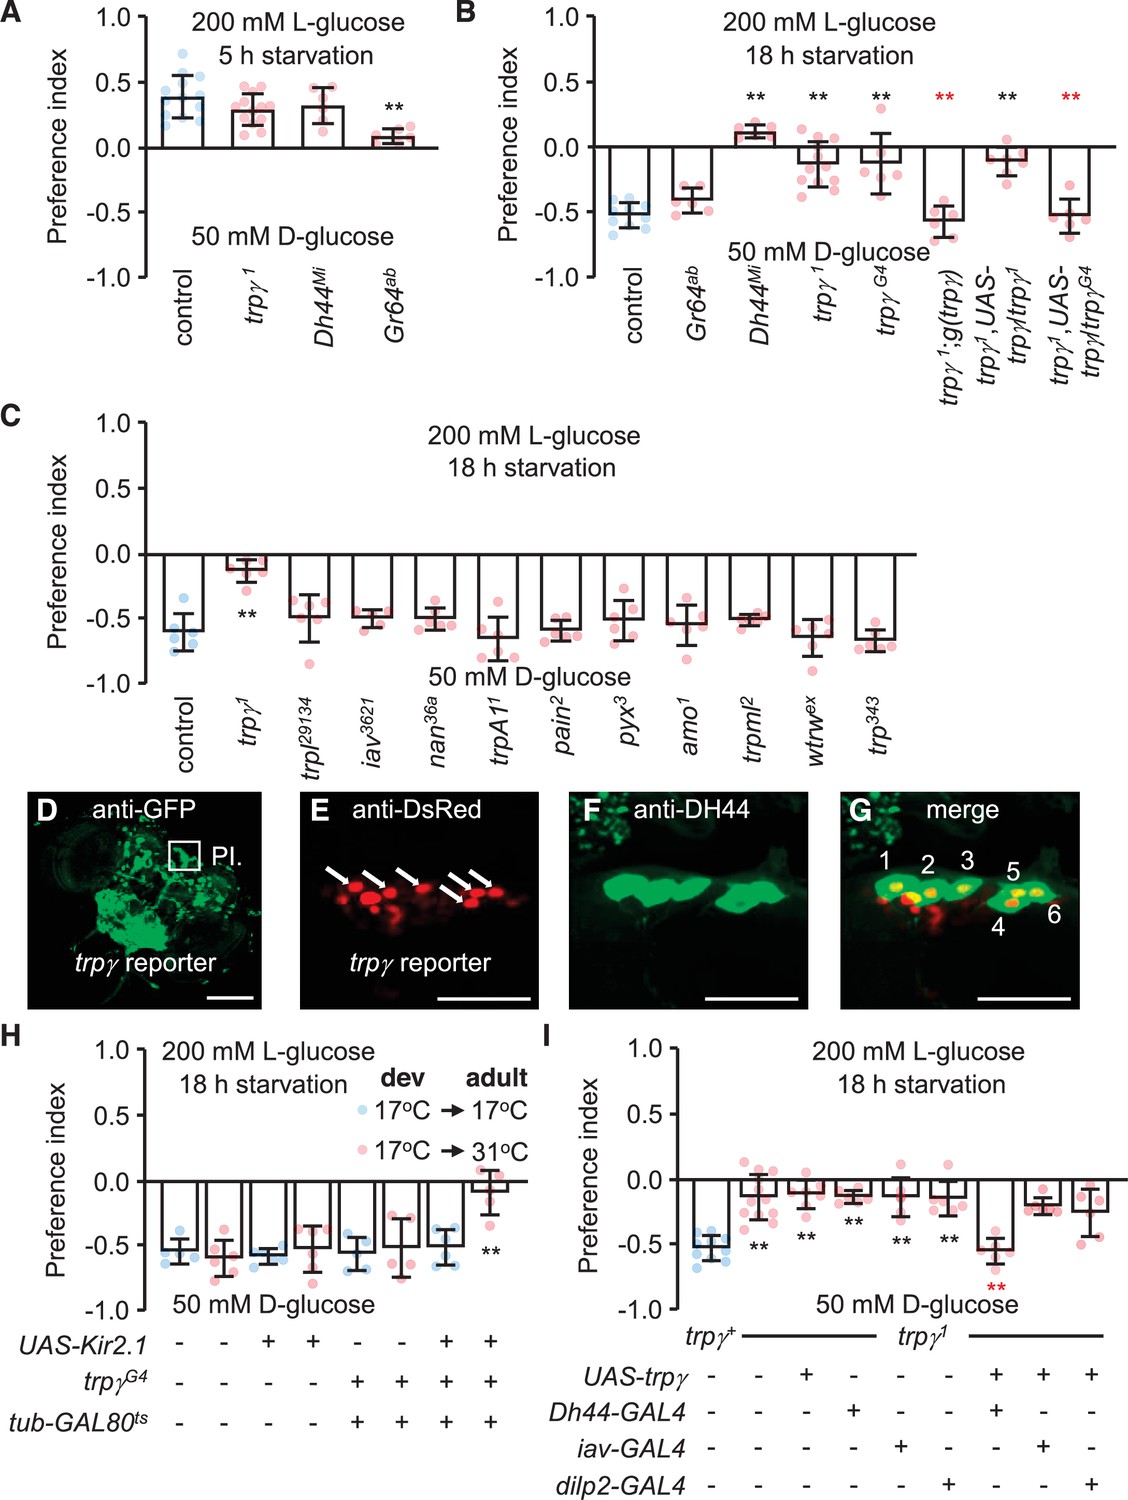
Characterization of TRPγ as a post-ingestion sensor using two-way feeding assays.
(A) Binary food choice assay showing preferences of control (w1118) and indicated flies (both males and females) to nutritive sugar (50 mM D-glucose) versus non-nutritive, but sweeter sugar (200 mM L-glucose) after 5 hr starvation. n = 6–13. (B) Binary food choice assay with the same food in A with the indicated flies after 18 hr starvation. All data points include a mixture of males and females. n = 6–11. (C) Screening trp mutants after 18 hr starvation using binary food choice assays (50 mM D-glucose versus 200 mM L-glucose). All data points include a mixture of males and females. n = 6. (D) Expression of a trpγ-GAL4 (trpγG4/+) reporter in brains. Whole brains from a trpγG4/+ > UAS-mCD8::GFP fly were stained with anti-GFP. The pars intercerebralis (PI) is indicated by the square. Scale bar represents 25 µm. (E–G) Co-staining of a brain from a trpγG4/+;UAS-nls::tdtomato/+ fly with (E) anti-DsRed (trpγ reporter) and (F) anti-diuretic hormone 44 (DH44). (G) Merged image of (E) and (F). Numbers (1–6) indicate cells stained with anti-DsRed and anti-DH44. Scale bars in E–G indicate 25 µm. (H) Binary food choice assay with the indicated flies starved for 18 hr. 17°C and 31°C are the permissive and non-permissive temperature for the temperature-sensitive GAL4 repressor (GAL80ts), respectively. The flies were either w1118 or w1118 with the indicated transgenes. All were cultured during development (dev) at 17°C until eclosion, and then maintained at 17°C during adulthood (adult) or switched to 31°C. All data points include a mixture of males and females. n = 5–6. (I) Binary food choice assays to test for rescue of the defect in selecting D-glucose over L-glucose in trpγ1 flies (males and females) that were starved for 18 hr. n = 6–12. Means ± SEMs. The black and red asterisks indicate significant differences from the controls and mutants, respectively (**p < 0.01) using ANOVA with Scheffe’s analysis as a post hoc test or unpaired Student’s t-tests (H). The red asterisks indicate significant levels of rescue.
Figure 1—figure supplement 1
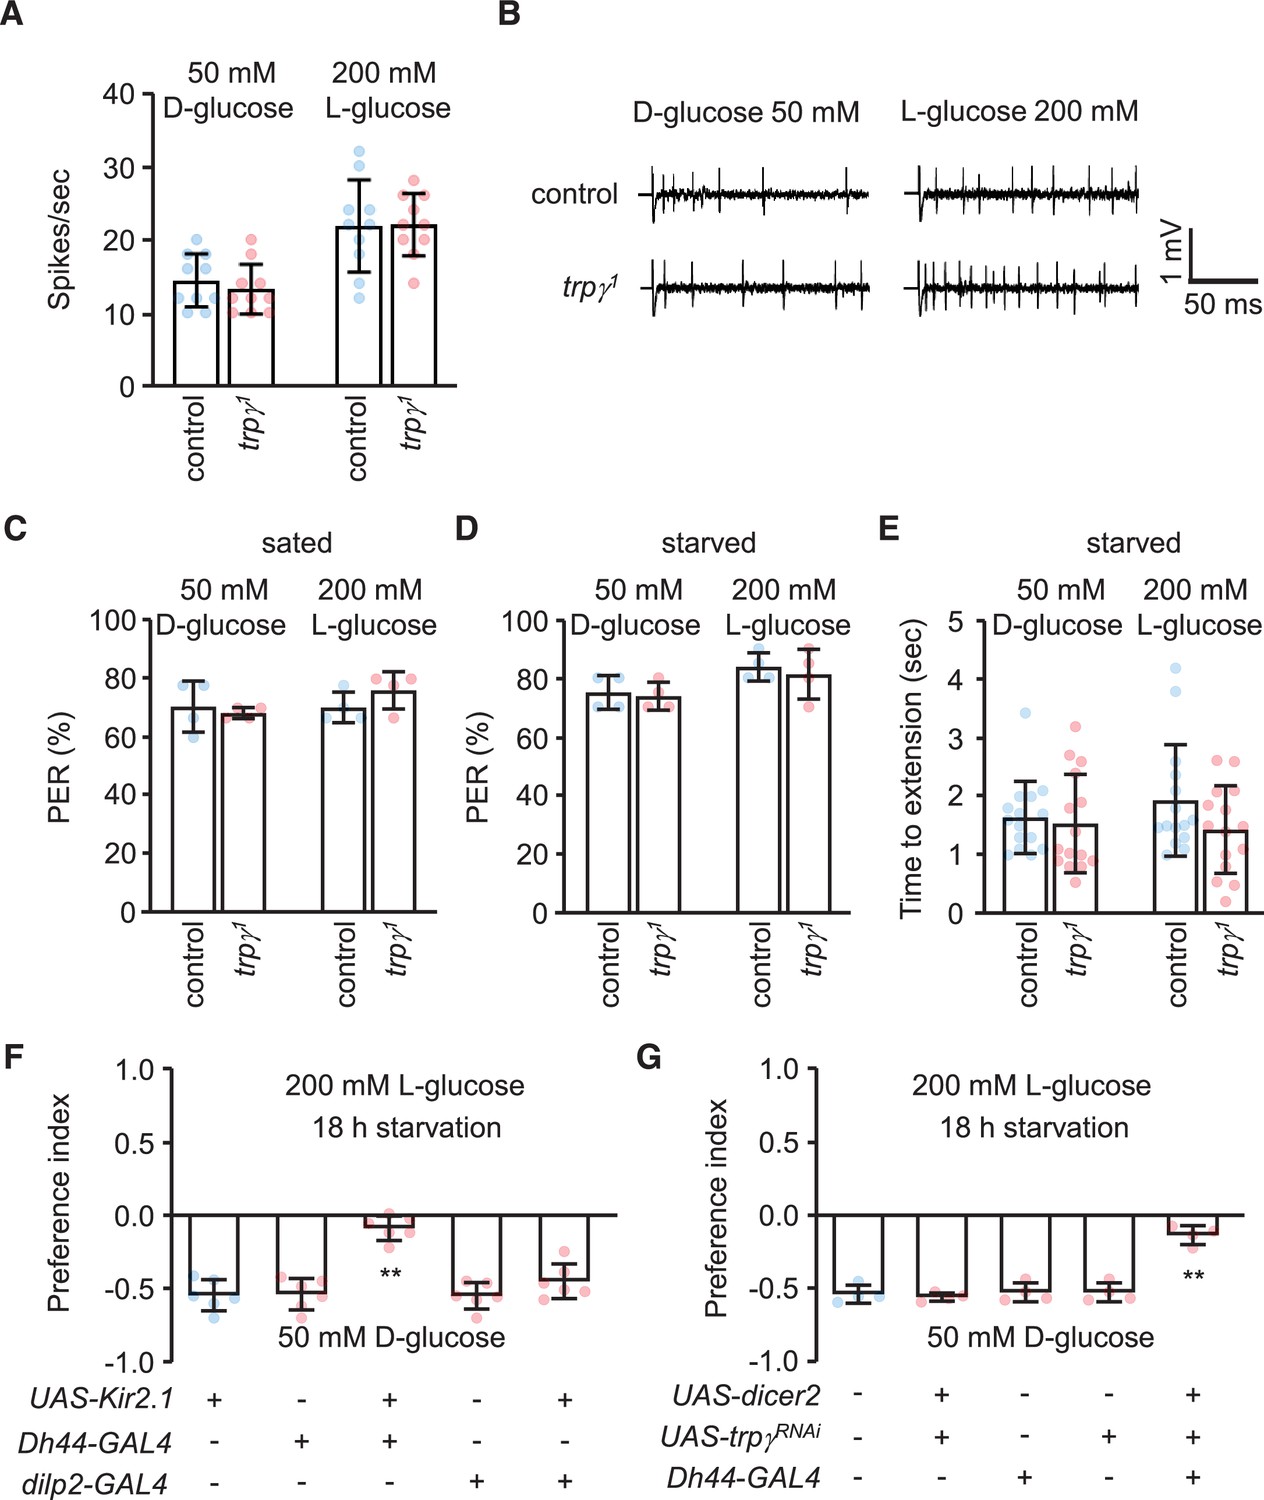
Tip recordings, and behavioral assays indicating that trpγ functions in diuretic hormone 44 (Dh44) neurons, and not in peripheral neurons.
(A) Frequencies of action potentials produced by electrophysiological recordings performed on L6 sensilla from labella of the indicated flies in response to 50 mM D-glucose or 200 mM L-glucose, respectively. n = 10. (B) Representative sample traces obtained from (A). (C) Average percentage of proboscis extension reflex (PER) responses of the indicated genotypes to 50 mM D-glucose and 200 mM L-glucose in 5 hr starvation condition. n = 4. (D) Average percentage of PER responses of indicated genotypes to 50 mM D-glucose and 200 mM L-glucose after 18 hr starvation . n = 4. (E) Quantification of time to proboscis extension by 18 hr starved flies in response to 50 mM D-glucose or 200 mM L-glucose. n = 15. (F–G) Binary food choice assays (using starved males and females) to determine selection of D-glucose or L-glucose under the indicated conditions. (+) and (-) indicates the presence or absence of the indicated transgenes, respectively. (F) Testing selection of D-glucose or L-glucose after silencing dilp2 or diuretic hormone 44 (Dh44) neurons with Kir2.1. n = 6. (G) Testing selection of D-glucose or L-glucose after RNAi knockdown of trpγ under control of the Dh44-GAL4. n = 4. Means ± SEMs. Single-factor ANOVA with Scheffe’s analysis was used as a post hoc test to compare multiple sets of data (A, F and G). Unpaired Student’s t-tests were used to compare control and trpγ1 mutant (C, D, and E). Asterisks indicate significance from controls (**p < 0.01).
Figure 2 with 1 supplement
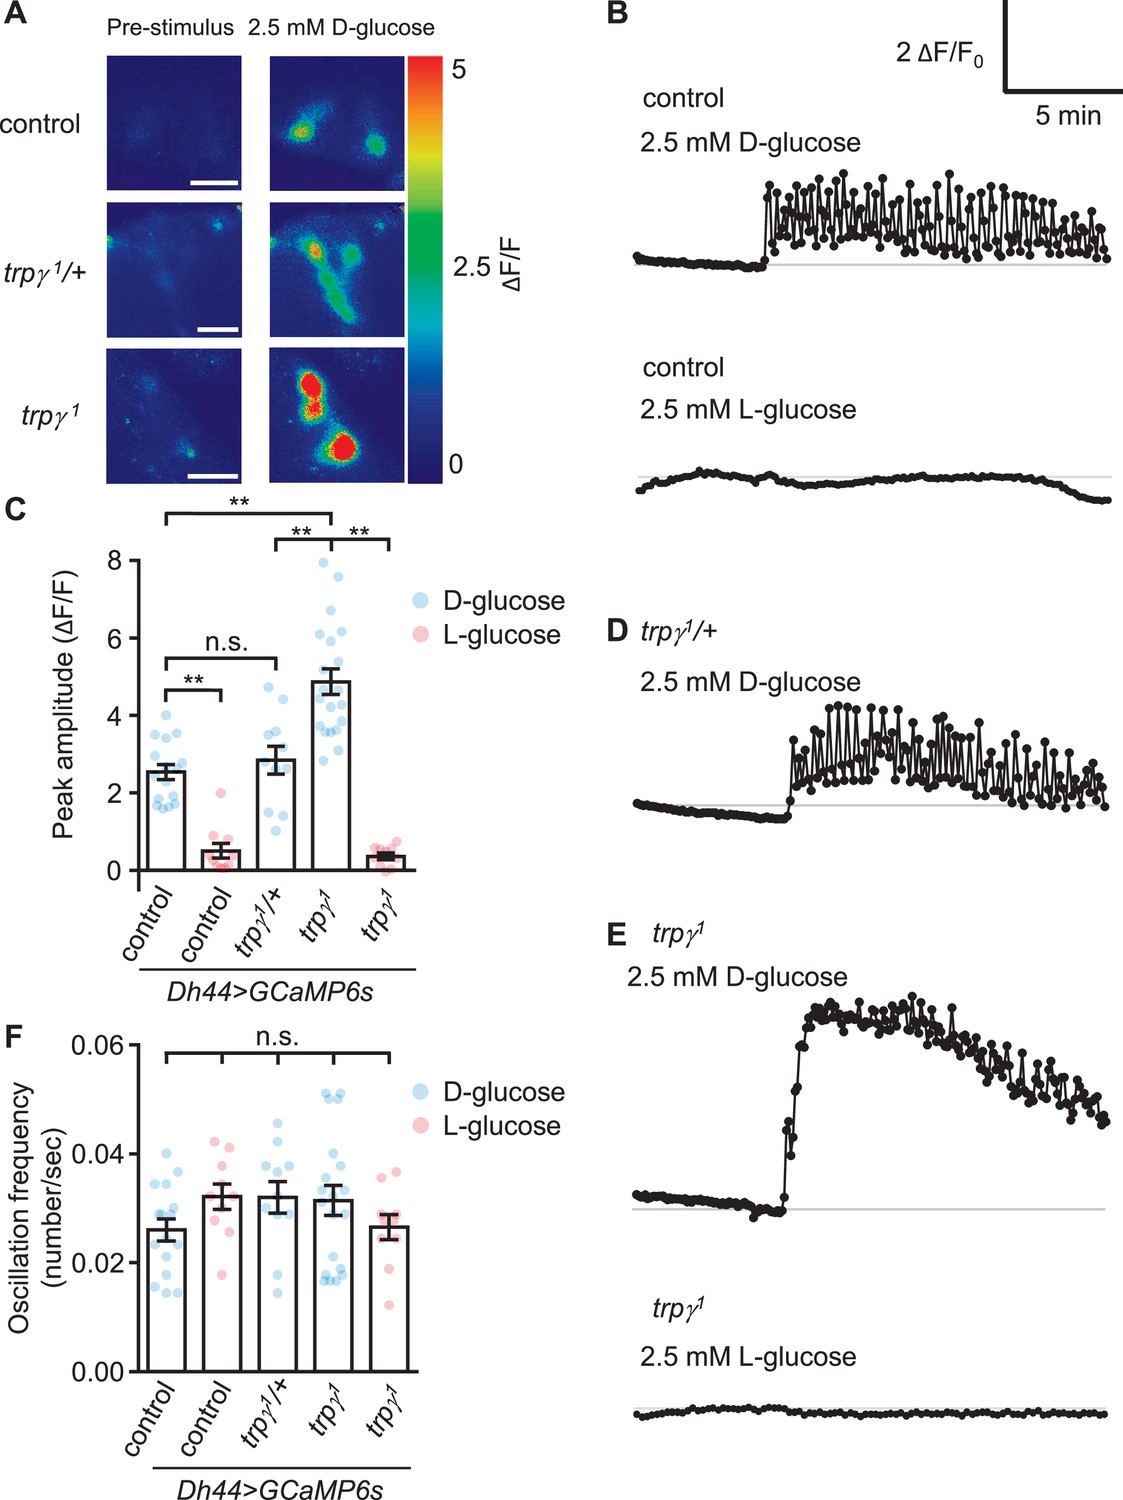
GCaMP responses of diuretic hormone 44 (Dh44) neurons to D-glucose or L-glucose.
Changes in GCaMP6s fluorescence in Dh44 neurons exposed to D-glucose or L-glucose. Brains were isolated from control, trpγ1/+, and trpγ1 male flies carrying the Dh44-GAL4 and UAS-GCaMP6s, and exposed to 2.5 mM D-glucose or L-glucose. (A) Images showing changes in GCaMP6s fluorescence. The left images show the pre-stimulation Ca2+ signals and the right images show the responses to 2.5 mM D-glucose. Scale bar, 20 µm. (B) Representative traces of Dh44 neuronal responses to D-glucose or L-glucose from control brains. (C) Quantification of GCaMP6s responses to 2.5 mM D-glucose and 2.5 mM L-glucose. The peak amplitude (ΔF/F) was calculated by subtracting the pre-stimulation baseline from the sugar-evoked peak value. The pre-stimulation baselines were calculated as the average of 10 frames before adding the sugar. n = 10–20 cells derived from 3–4 flies per genotype. (D) Representative trace of GCaMP6s response to D-glucose in trpγ1/+. (E) Representative traces of GCaMP6s responses to D-glucose and L-glucose in trpγ1. (F) Quantification of the oscillation frequencies in GCaMP6s responses to D-glucose and L-glucose. n = 10–20 cells. Means ± SEMs. The asterisks indicate significant differences (**p < 0.01) using the Mann-Whitney test; n.s., not significant.
Figure 2—figure supplement 1
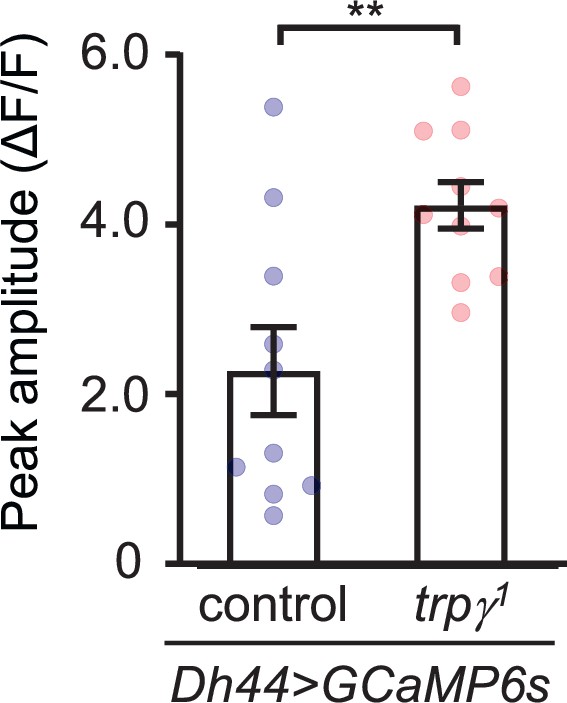
Quantification of GCaMP6s responses of diuretic hormone 44 (DH44) neurons to stimulation with 20 mM D-glucose.
Peak amplitudes (ΔF/F) were calculated by subtracting the pre-stimulation baseline from the sugar-evoked (20 mM D-glucose) peak value. The pre-stimulation baselines were calculated as the average of 10 frames before adding the sugar. n = 10 cells derived from each genotype.
Figure 3 with 1 supplement
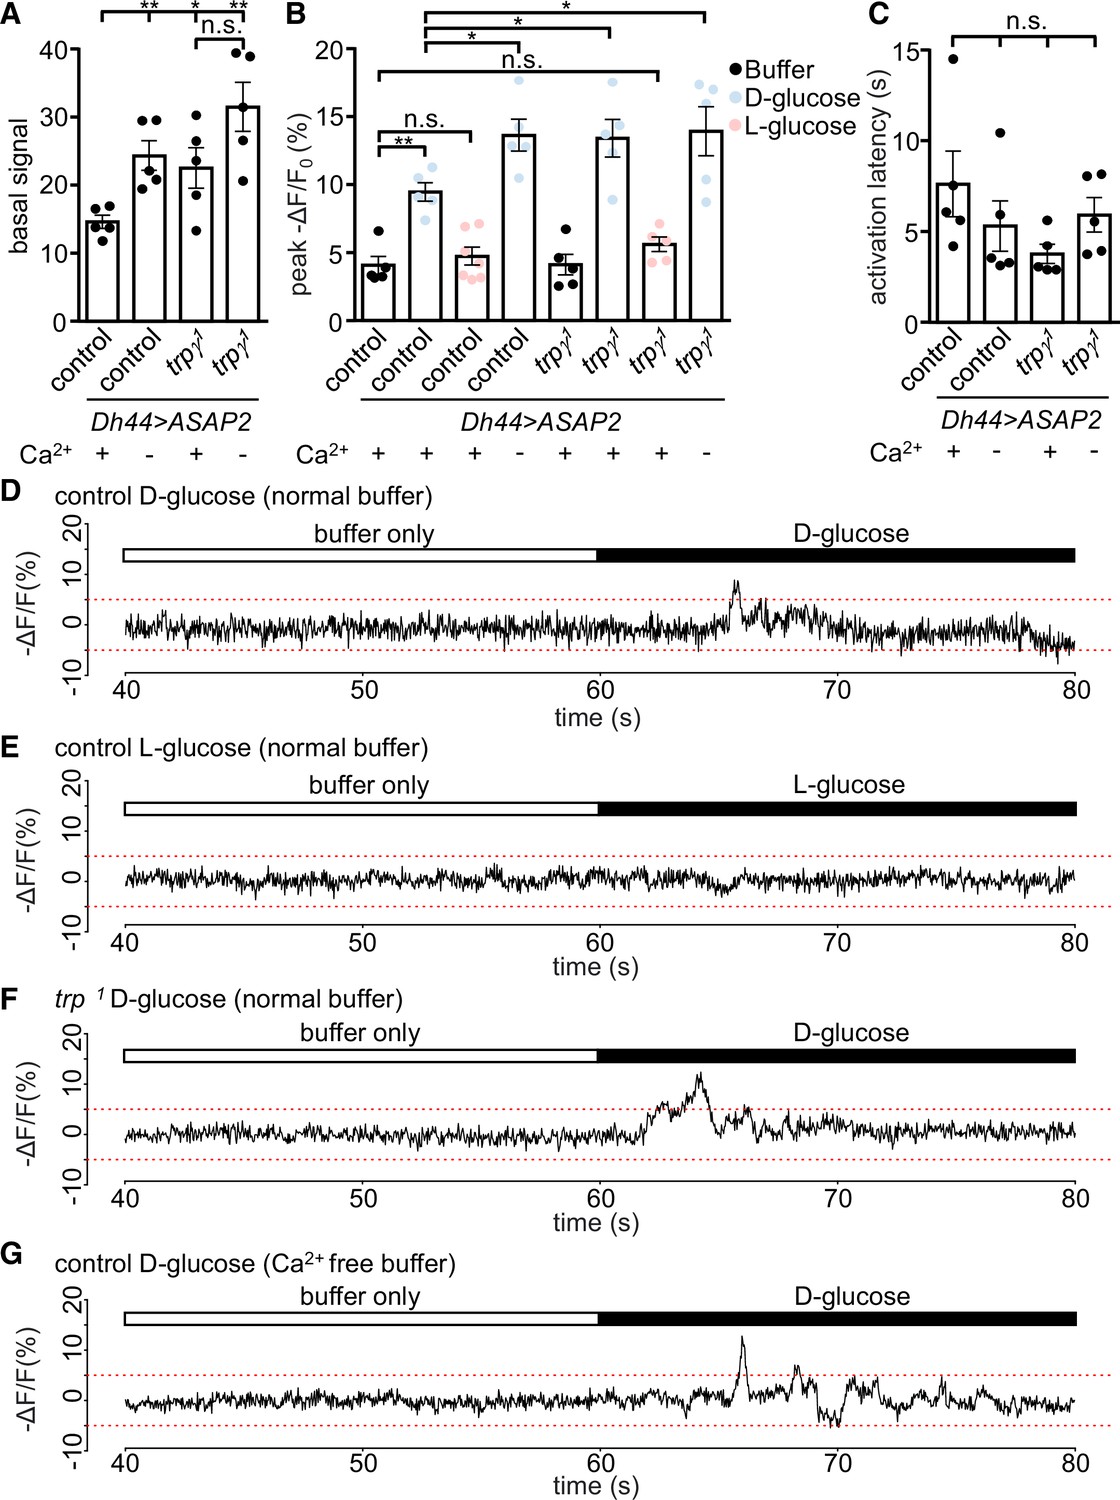
Voltage imaging of diuretic hormone 44 (DH44) neurons with ASAP2s.
The Dh44-Gal4 and UAS-ASAP2s transgenes were introduced into the control and trpγ 1 backgrounds. The DH44 neurons were activated by D-glucose or L-glucose in ex vivo brain preparations. (A–C) Voltage responses from brain preparations treated with normal (Ca2+-containing) buffer alone, normal buffer containing either 20 mM D-glucose or L-glucose, or Ca2+-free buffer alone. (A) Quantification of peak basal ASAP2s signals in normal buffer (+) or Ca2+-free buffer (-) in control or trpγ 1 DH44 neurons. The peak basal signals were calculated as the maximum value of brightness for 20 s (arbitrary values obtained using Bruker Prairie View 5.5), prior to the application of the stimuli. n = 5 brains. One neuron was analyzed per brain. The asterisks indicate significant differences from the control in Ca2+-containing buffer. (B) Quantification of peak voltage amplitude of DH44 neurons in response to D-glucose and L-glucose. The presence (+) or absence (-) of Ca2+ in the buffer is indicated. The peak amplitudes (-ΔF/F) were calculated by subtracting the pre-stimulation baseline from the stimulus-evoked peak value. The pre-stimulation baselines were calculated as the average of 100 data points (corrected for photobleaching) before stimulation. n = 5–7 brains. One neuron was analyzed per brain. (C) Quantification of the activation latencies of DH44 neurons in normal buffer (+) or Ca2+-free buffer (-). The activation latencies were calculated as the time (s) before the first activation peak occurred following application of the stimulus. n = 5 brains. One neuron was analyzed per brain. The analyses of statistical significance were based on comparisons with the control in Ca2+-containing buffer. (D–G) Representative traces of results quantified in B. (D) Response of DH44 neurons from control brains to 20 mM D-glucose. (E) Response of DH44 neurons from control brains to 20 mM L-glucose. (F) Response of DH44 neurons from trpγ1 brains to 20 mM D-glucose. (G) Response of DH44 neurons from control brains to 20 mM D-glucose in a Ca2+-free buffer. Means ± SEMs. The asterisks indicate significant differences using single-factor ANOVA with Scheffe’s analyses between each test condition and the control. *p < 0.05, **p < 0.01, n.s., not significant.
Figure 3—figure supplement 1
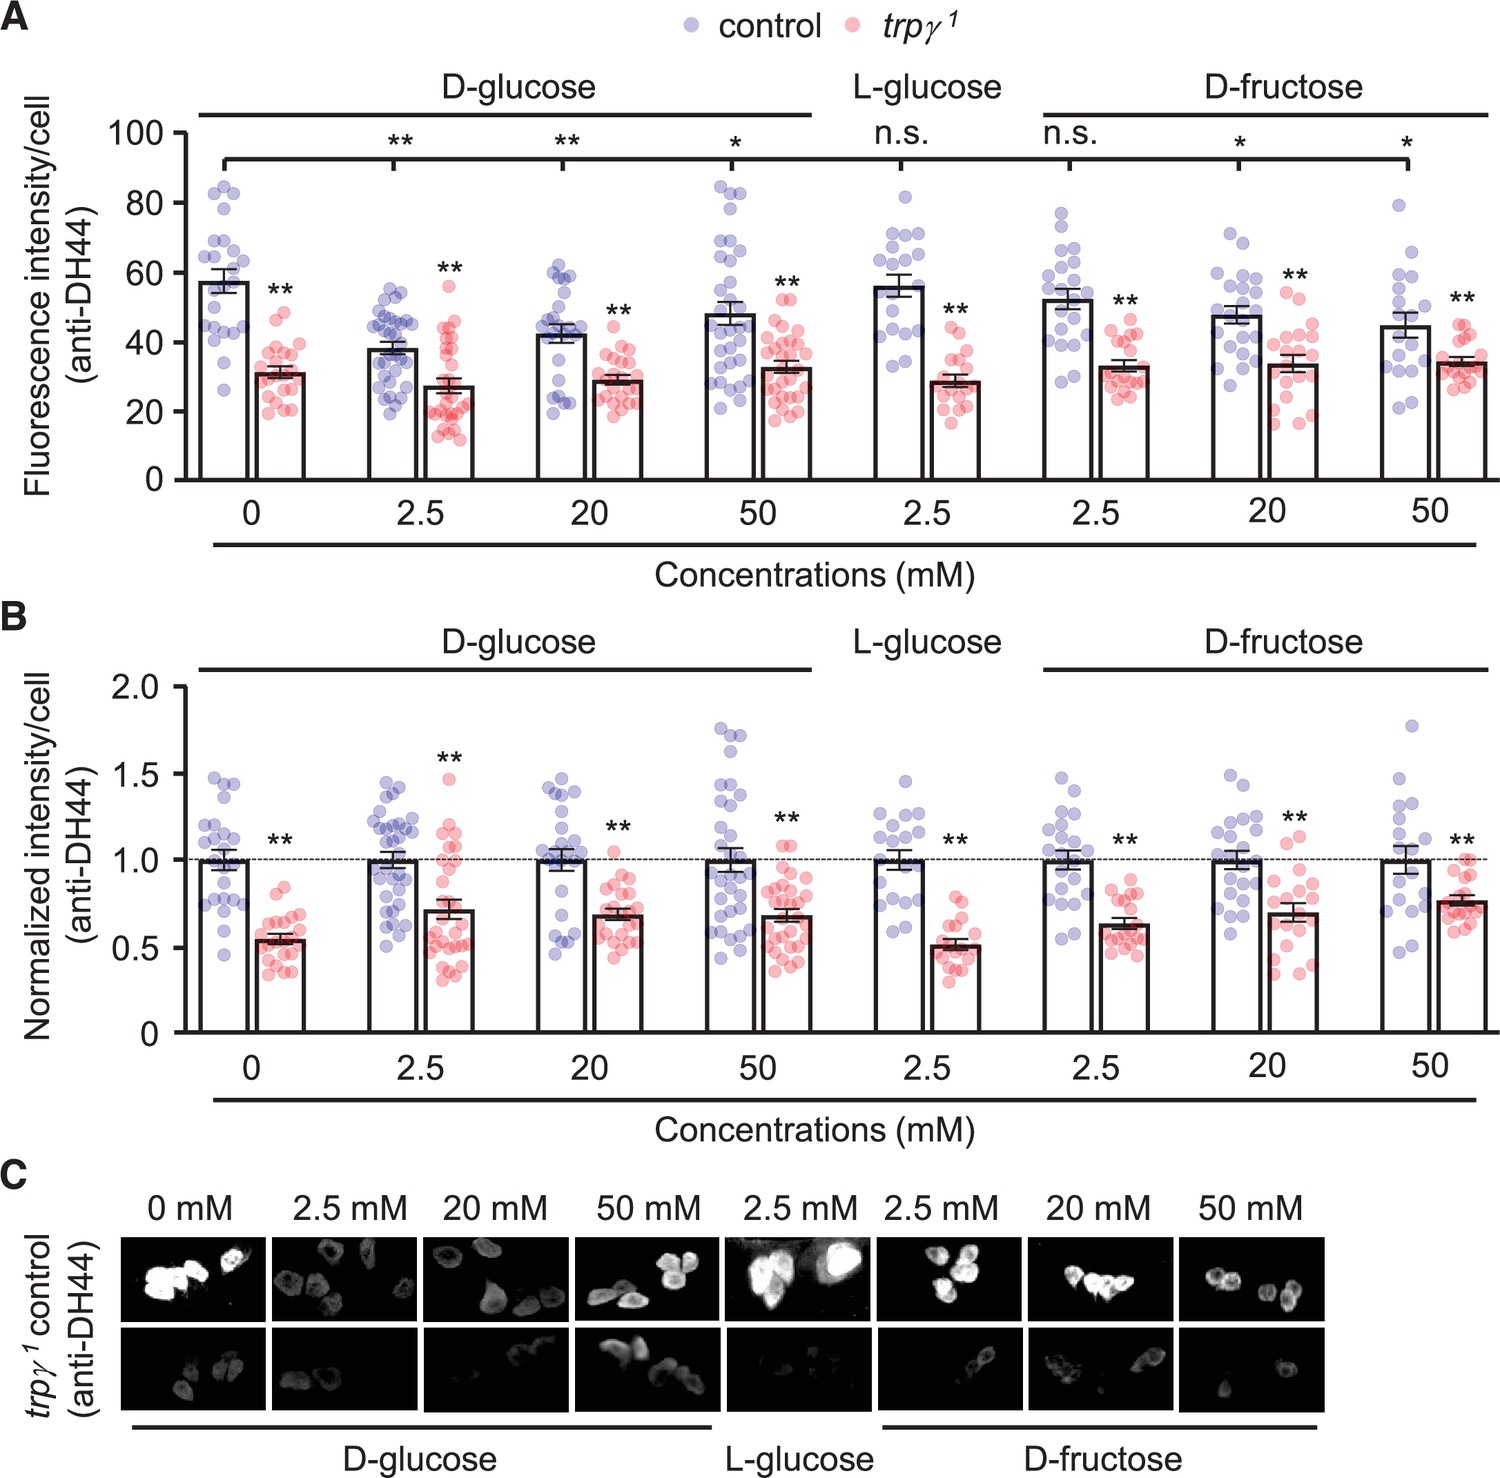
Quantification of intracellular anti-diuretic hormone 44 (DH44) signals in DH44 neurons after stimulation with different concentrations of D-glucose, L-glucose, and D-fructose.
(A) Quantification of immunofluorescence intensities (arbitrary units) produced by intracellular DH44 peptide probed with anti-DH44 with the indicated concentrations of D-glucose, L-glucose, and D-fructose solution in sugar-free Drosophila saline. The fluorescence intensities were quantified from each cell using ImageJ (Fiji) . n = 16–35 cells from 5 to 11 brains. (B) Relative intensities of intracellular anti-DH44 fluorescence from (A) normalized to the control cells. n = 16–35 cells from 5 to 11 brains. (C) Representative images of DH44 cells in (A).
Figure 4 with 1 supplement
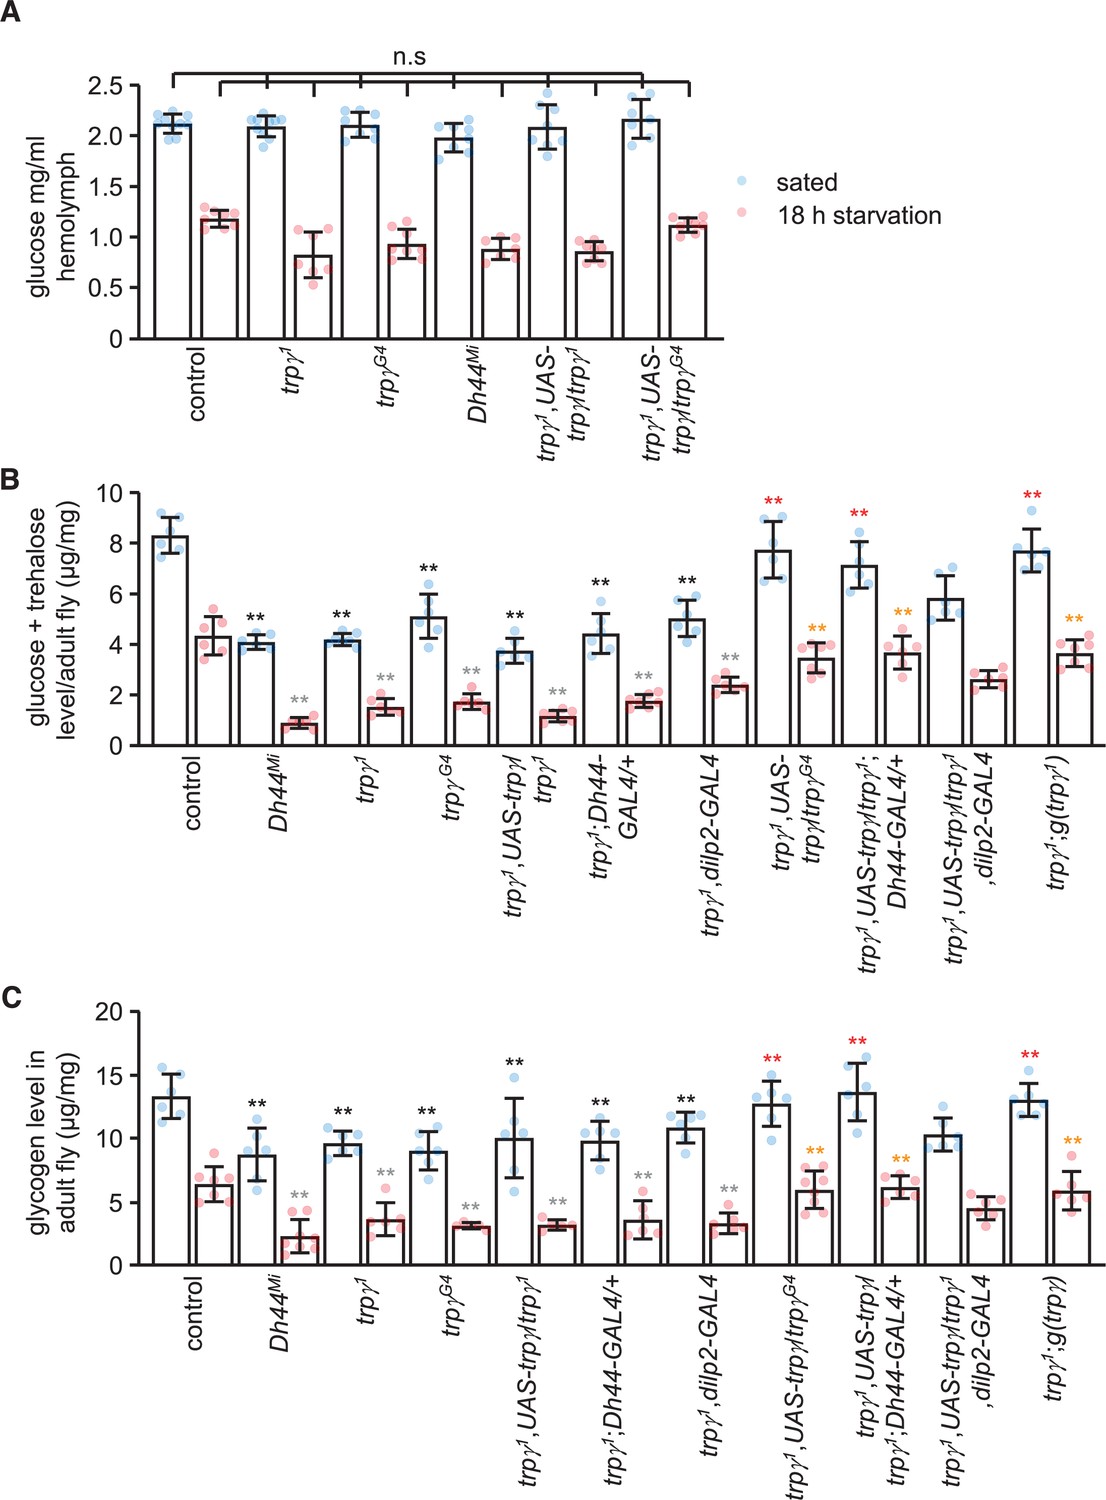
Sugars and glycogen levels under sated and starvation conditions.
(A) Glucose levels in the hemolymph. n = 7–10. (B) Trehalose and glucose levels in whole-body extracts. n = 6–7. (C) Glycogen levels in whole-body extracts. n = 5–8. Means ± SEMs. Single-factor ANOVA with Scheffe’s analysis was used as a post hoc test to compare multiple sets of data. The black and red asterisks indicate significant differences (**p < 0.01) from the sated controls and mutants, respectively. The gray and orange asterisks indicate statistical significance (**p < 0.01) from the starved controls and mutants, respectively. n.s., not significant.
Figure 4—figure supplement 1
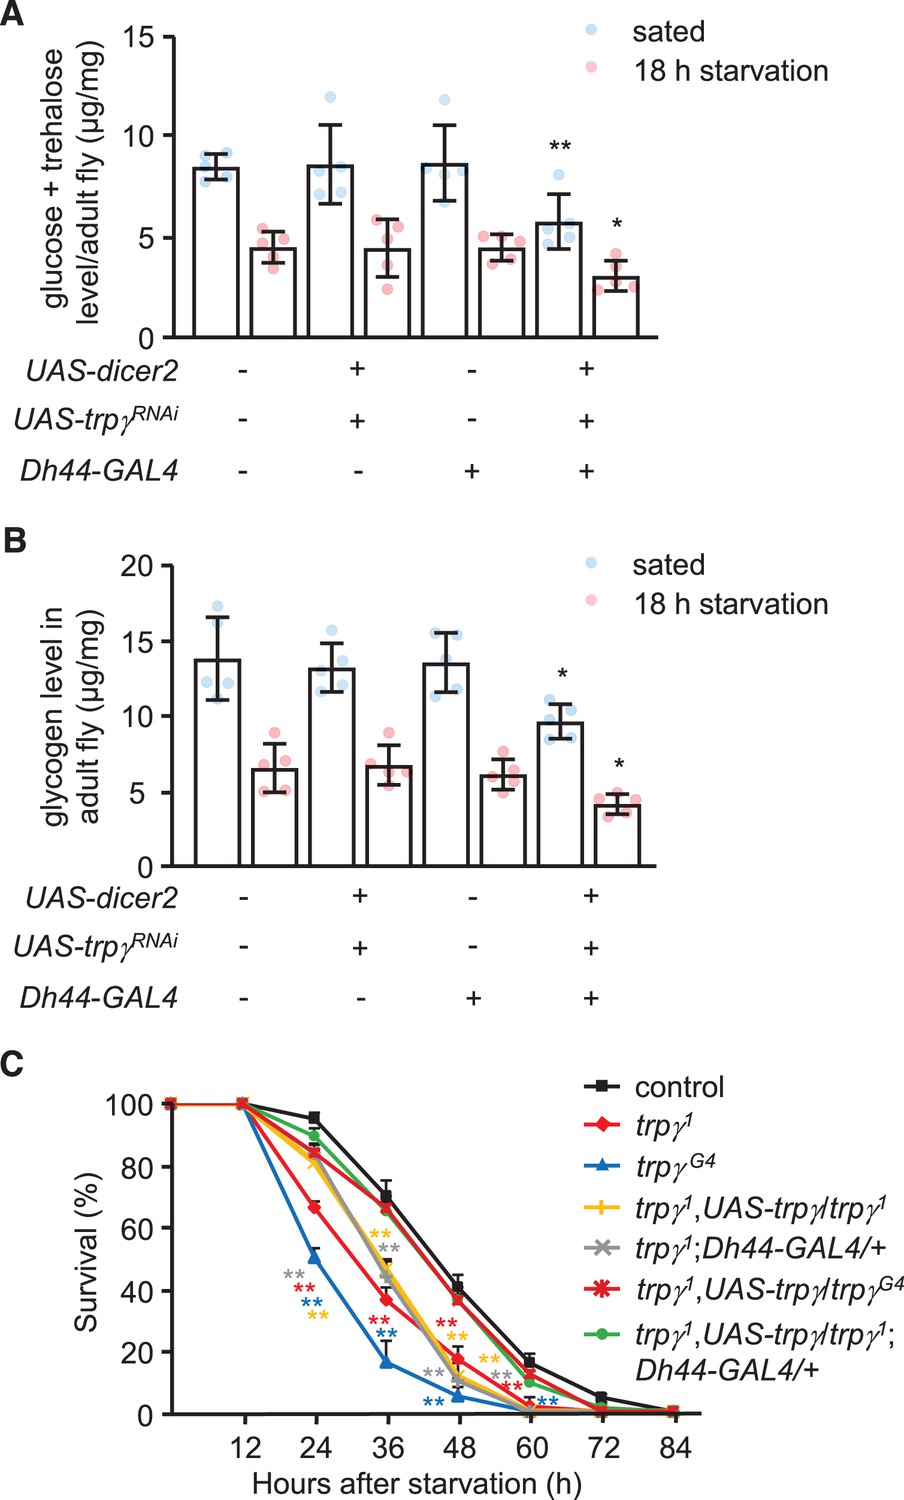
Sugars and glycogen levels under fed and starved conditions, and survival of flies under starvation condition.
(A) Trehalose and glucose levels in whole-body extracts after RNAi knockdown of trpγ under control of the Dh44-GAL4 in sated flies (5 hr starvation) or in flies starved for 18 hr. n = 5. (B) Glycogen levels in whole-body extracts after RNAi knockdown of trpγ under control of the Dh44-GAL4 in sated and starved flies. n = 5. (C) For the survival assays, 20 (3- to 4-day-old) male flies of each genotype were transferred to vials with filter papers soaked with water, and incubated at 25°C. The flies were transferred to new vials every 24 hr. Mortality rates were determined by counting the number of dead flies at 12 hr intervals. The LT50 values (time point when 50% flies are dead) were calculated using Kaplan-Meier survival analysis to test significance. n = 10. Means ± SEMs. Single-factor ANOVA with Scheffe’s analysis was used as a post hoc test to compare multiple sets of data (Figure 3—figure supplement 1A and B). The asterisks indicate significant differences from the control. *p < 0.05, **p < 0.01.
Figure 5 with 1 supplement
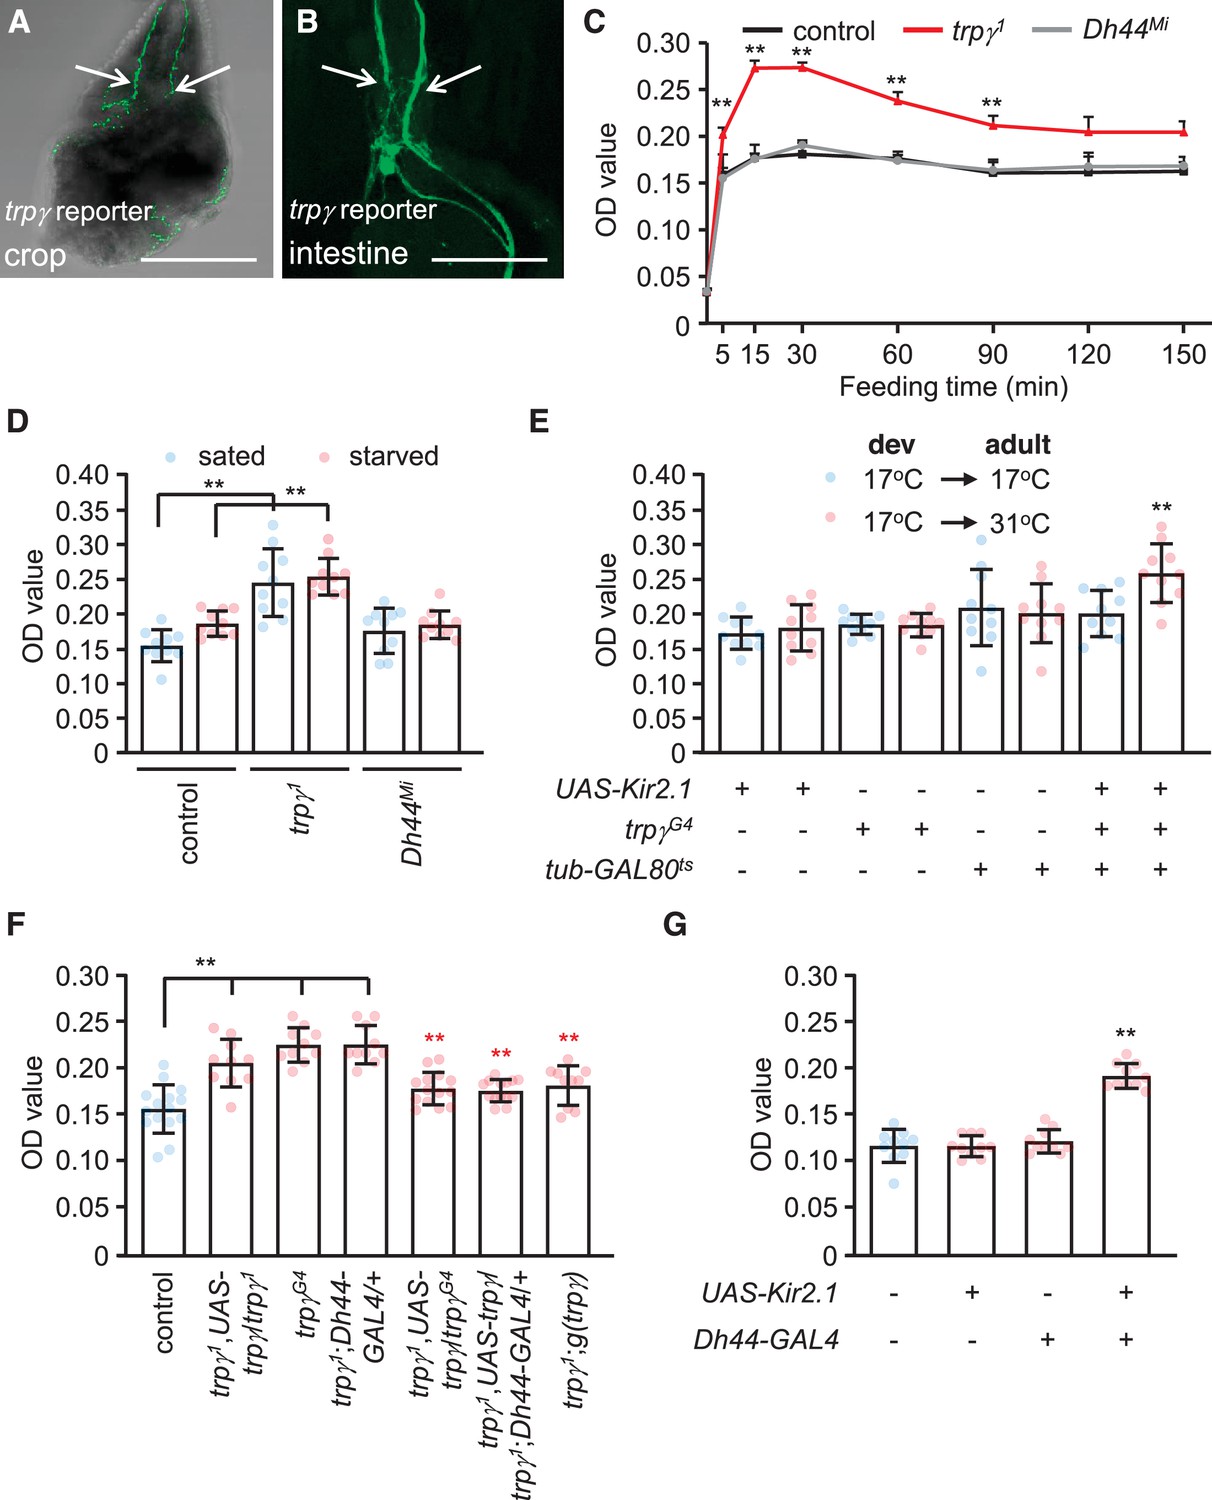
Requirement for trpγ in diuretic hormone 44 (DH44) neurons to control consumption.
(A–B) Confocal images of trpγ reporter expression (trpγG4/UAS-mCD8::GFP) in (A) the crop and (B) the intestine after staining the tissues with anti-GFP. Scale bars represent 25 µm. (C–G) Quantification of the levels of ingested food was determined by feeding flies 1% agarose containing 5% sucrose and blue food dye. The concentration of food was measured by determining the ODs (629 nm) of extracts from whole male flies. (C) The indicated sated flies were allowed to feed for various periods of time prior to quantification of internalized food. n = 10–12. (D) Levels of internalized food in the indicated sated or starved flies after feeding for 30 min. n = 10. (E) Feeding levels after inactivating trpγ neurons in adults only with Kir2.1. The GAL4 repressor (GAL80ts) is active at 17°C and inactive at 31°C. The flies were for sated for 30min before intiating the feeding assays. “Dev” indicates the temperature during all developmental stages through eclosion. n = 10. (F) Rescue of the trpγ phenotype (high levels of internal food) with the UAS-trpγ and the Dh44-GAL4, or with the trpγ genomic transgene. Red asterisks indicate significant differences from the trpγ1 mutant. n = 10–15. (G) Measurement of internalized food after silencing Dh44 neurons with Kir2.1. The flies were sated flies for 30 min prior to initiating the feeding assays. n = 10. Means ± SEMs. Single-factor ANOVA with Scheffe’s analyses was used as a post hoc test to compare multiple sets of data. The black and red asterisks indicate significance differences from the controls and mutants, respectively (**p < 0.01).
Figure 5—figure supplement 1
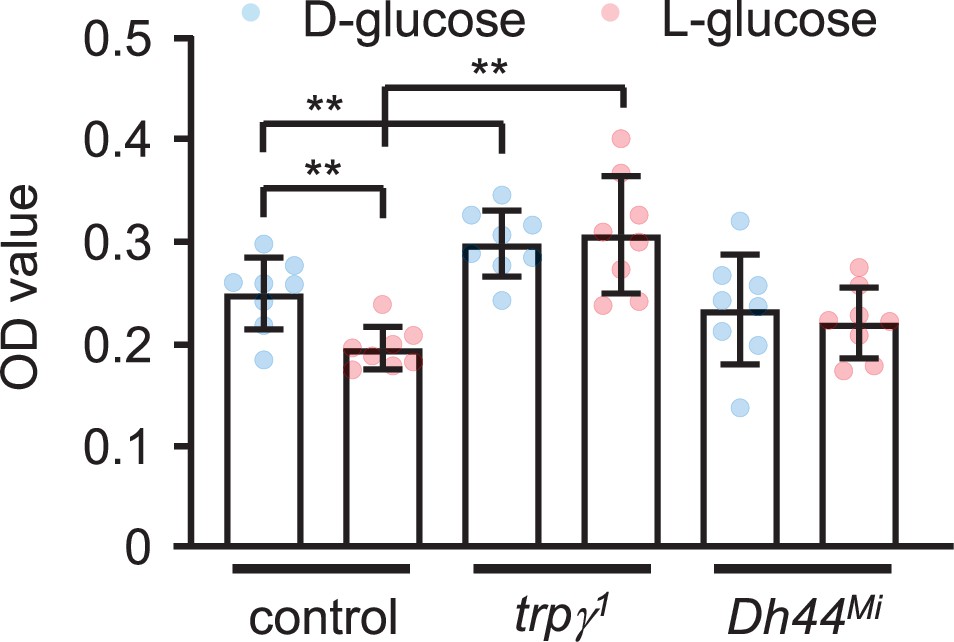
Internal food consumption.
Measurements of internalized food levels after feeding starved males 5% D-glucose or 5% L-glucose for 30 min. n = 8. Means ± SEMs. Unpaired Student’s t-tests were used for comparing two sets of data. Asterisks indicate significance from the control (**p < 0.01).
Figure 6 with 1 supplement
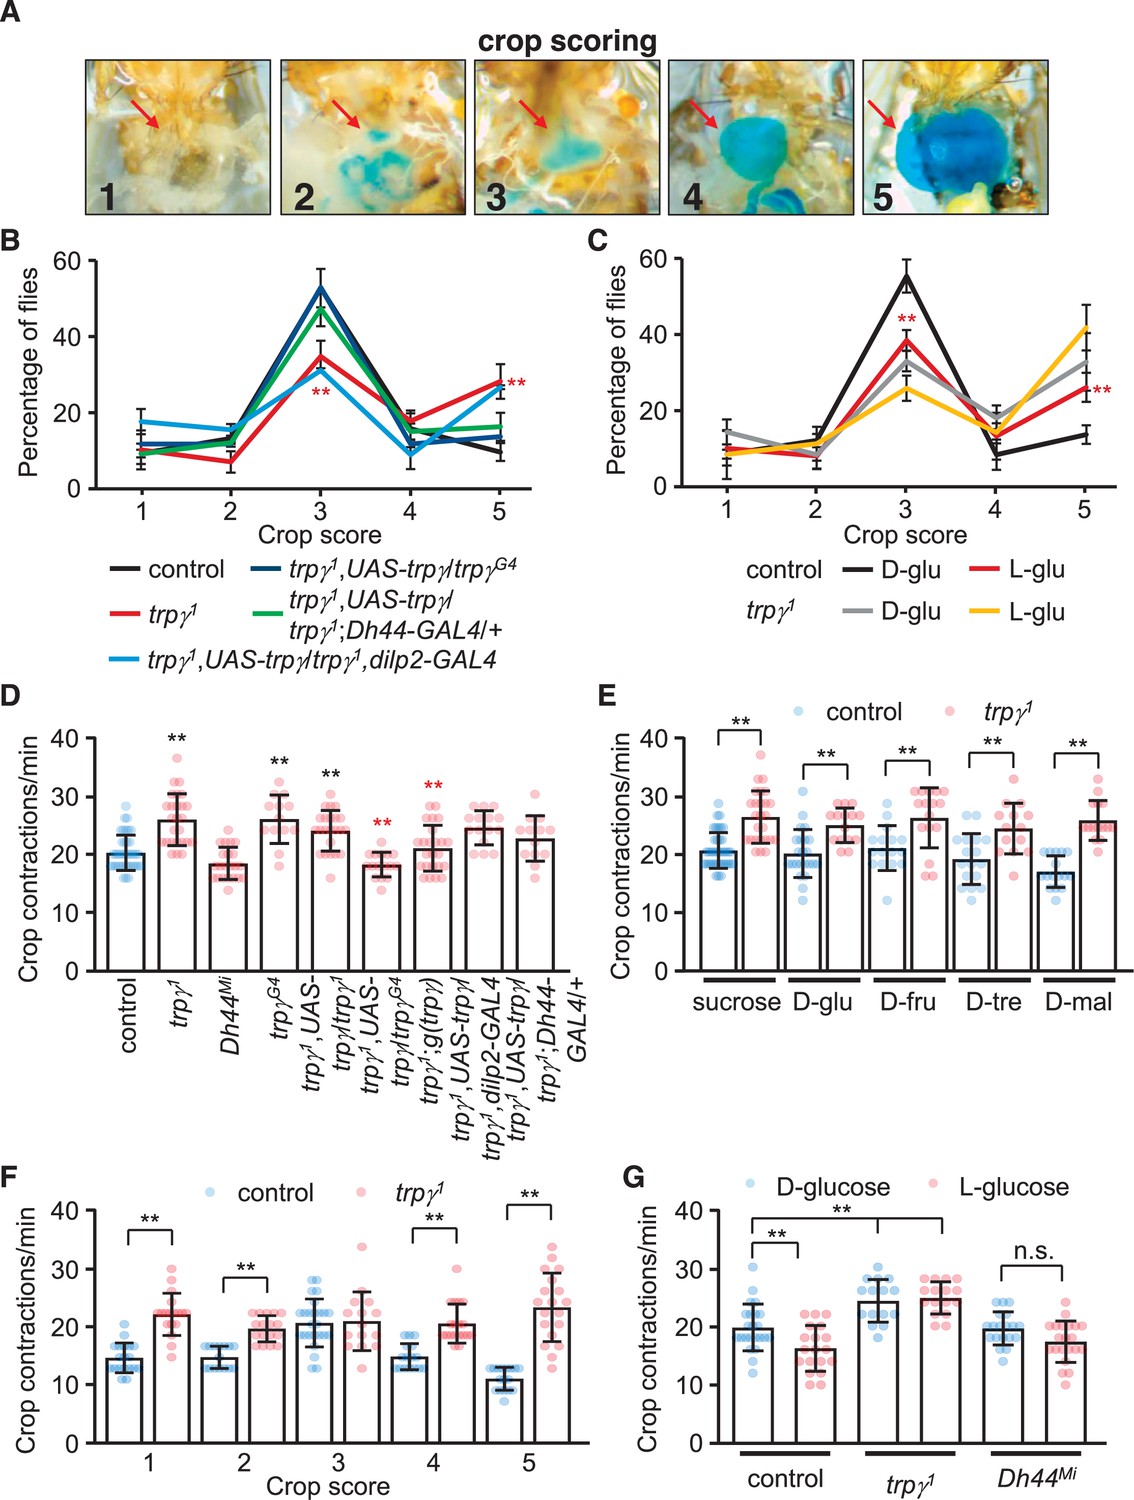
Crop extension and contraction rates.
(A) Representative images of crop sizes scored on a 1–5 scale after feeding for 12 hr 1% agarose containing 5% sucrose and blue food coloring. The images were acquired with an isolution IMTcam3 camera connected to a Nikon microscope. (B) The percentages of flies with crop sizes on a 1–5 scale after feeding for 12 hr on 5% sucrose. n = 5 (16–20 flies were used for each experiment: total 92–100 flies). Each genotype was compared with the control at each 1–5 scale. (C) The percentages of flies with crop sizes on a 1–5 scale after feeding on 5% D-glucose (D-glu) or 5% L-glucose (L-glu). n = 5 (15–20 flies were used for each experiment: total 75–80 flies). Comparisons were performed between flies of the same genotype that fed on either D-glu or L-glu. (D) Crop contraction rates after feeding on 5% sucrose (includes all scales). n = 13–34. (E) Crop contraction rates as a function of crop scale (1–5) after feeding on 5% sucrose. n = 14–31. (F) Crop contraction rates (all crop scales combined) after feeding on 5% D-glucose or 5% L-glucose. n = 14–27. (G) Crop contraction rates (all crop scales) after feeding on 5% sucrose, D-glu, D-fructose (D-fru), D-trehalose (D-tre), or D-maltose (D-mal). n = 14–23. Means ± SEMs. Single-factor ANOVA with Scheffe’s analysis was used as a post hoc test to compare multiple sets of data. The data in (F) were analyzed using unpaired Student’s t-tests. The red asterisks in (B) indicate significance from controls. The red asterisks in (C) indicate significance within same genotype for different sugars. n.s., not significant. (**p < 0.01).
Figure 6—figure supplement 1
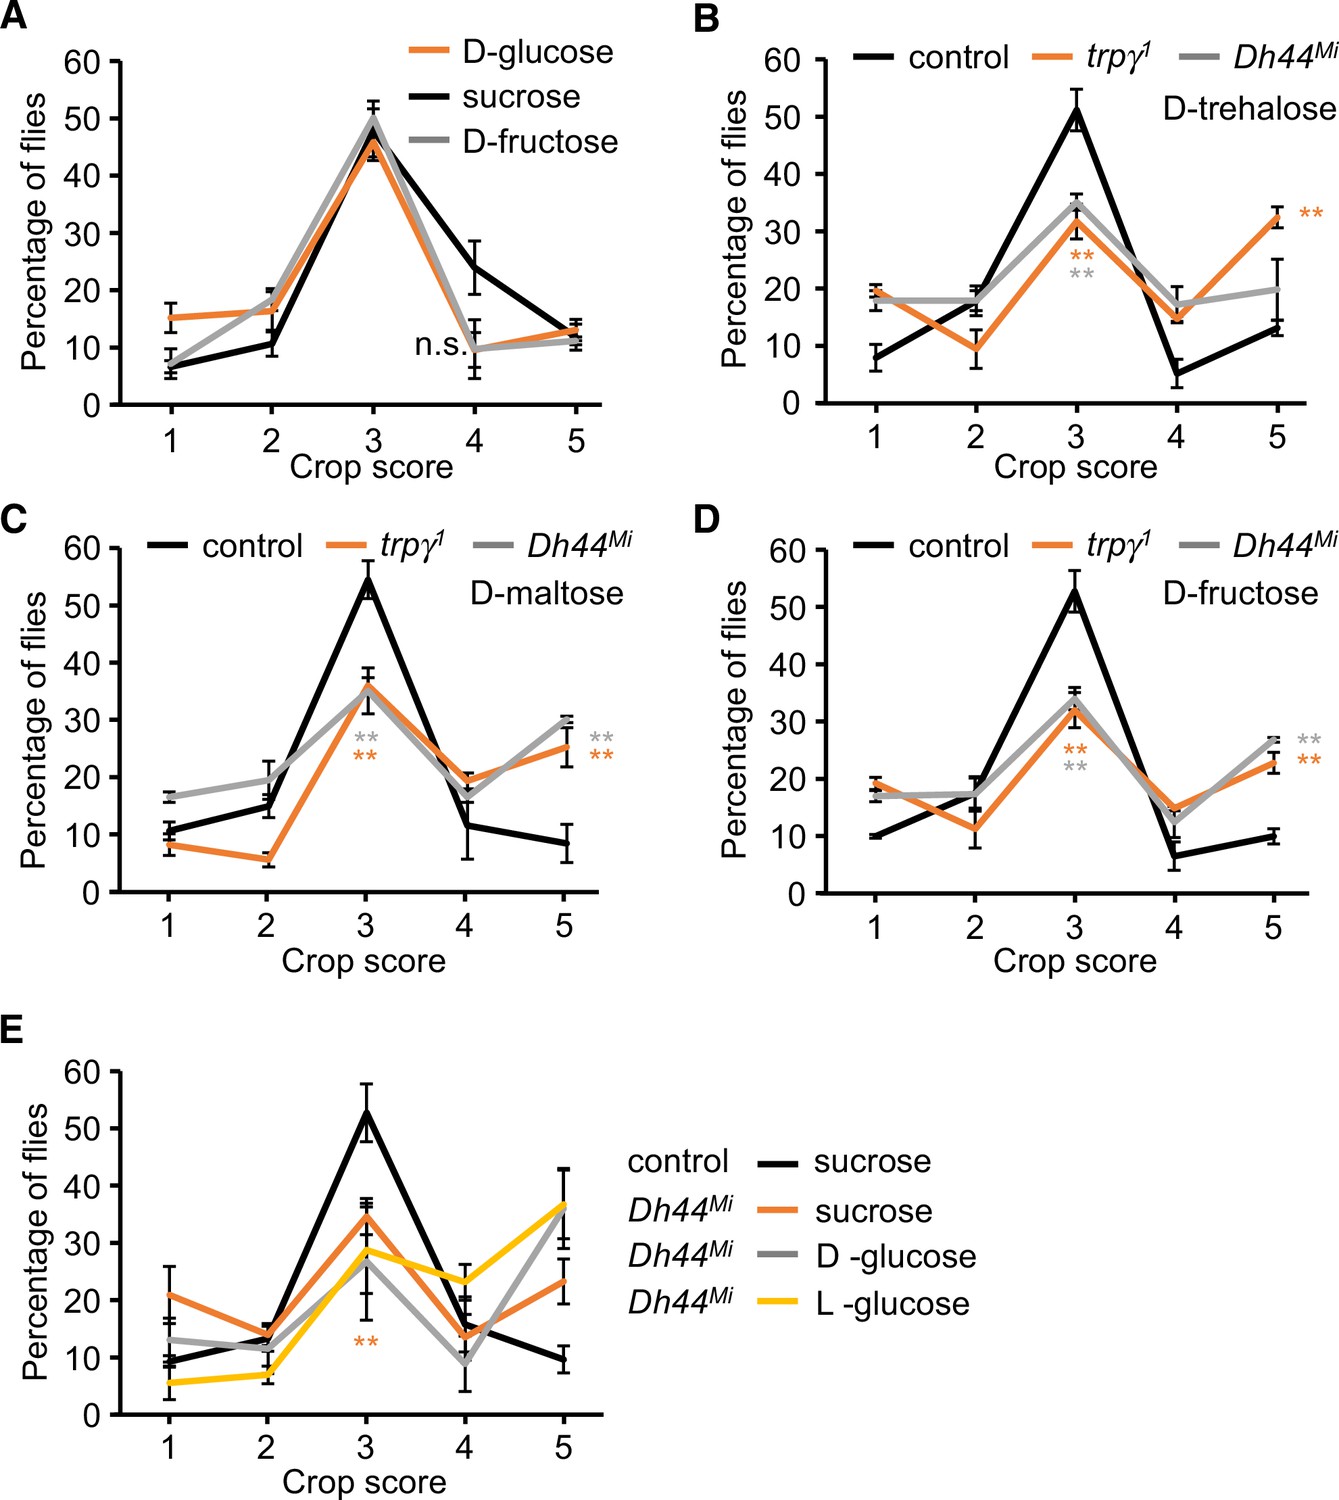
Scoring crop sizes after feeding on different sugars.
Male flies were fed 5% of the indicated sugars for 12 hr before scoring the percentages of each crop size (1–5 scale). (A) Crop sizes after feeding on 5% sucrose. n = 5 (total 80 flies). (B) Crop sizes after feeding on 5% D-trehalose. n = 5 (total 85–93 flies). (C) Crop sizes after feeding on 5% D-maltose. n = 5 (total 77 flies). (D) Crop sizes after feeding on 5% D-fructose. n = 5 (total 67 flies). (E) Crop sizes after feeding on the indicated sugars. To analyze statistical significance, we conducted two comparisons: (1) control versus Dh44Mi animals fed 5% sucrose, and (2) Dh44Mi animals fed 5% D-glucose versus 5% L-glucose . The difference between the sucrose fed control and Dh44Mi mutants was significant (first comparison) and is indicated with the red asterisks. n = 5 (total 82–95 flies). Means ± SEMs. Single-factor ANOVA with Scheffe’s analysis was used as a post hoc test to compare multiple sets of data for A–D. Unpaired Student’s t-test was used for comparison in (E). Colored asterisks (**p < 0.01) indicate significance of the indicated genotypes from the controls.
Figure 7 with 1 supplement
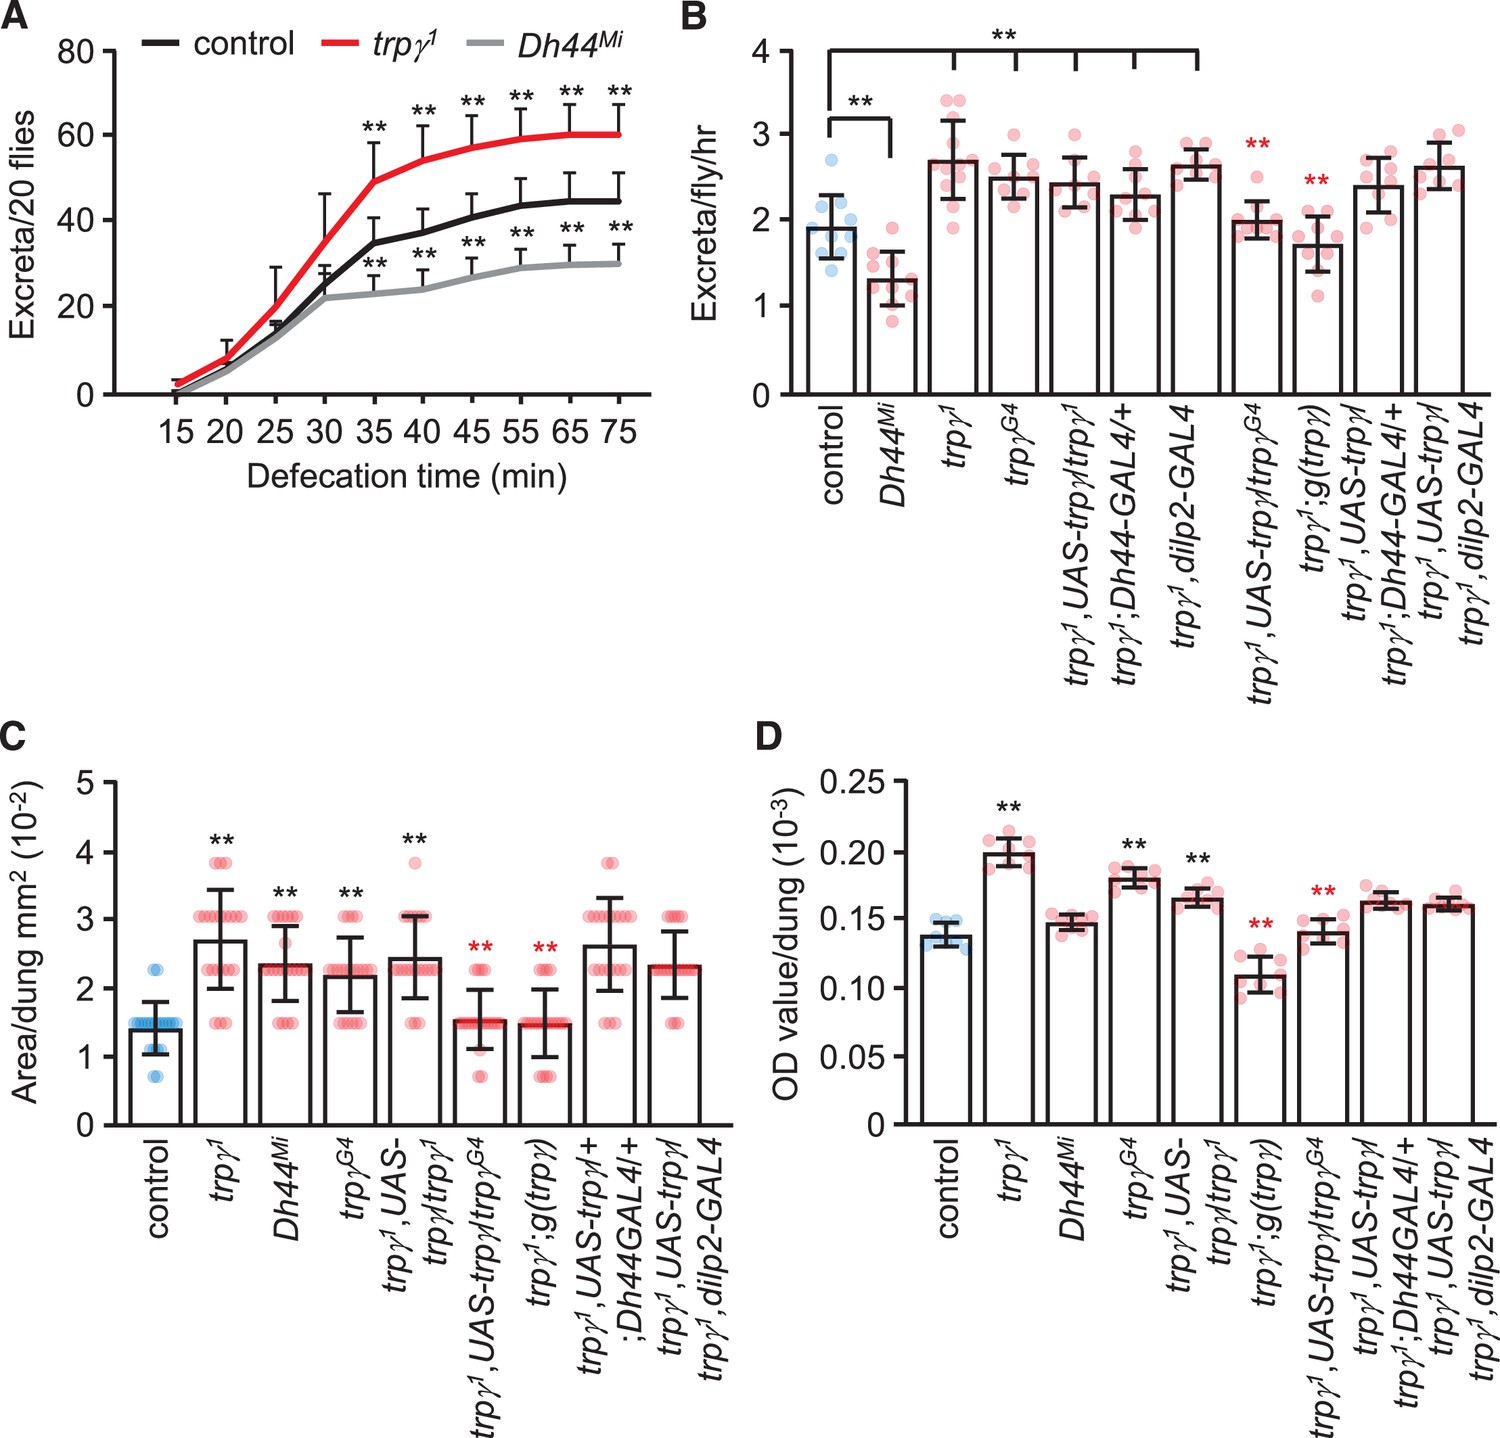
Rates and quantities of defecation.
(A) Cumulative defecation rates of male flies. n = 9. (B) Defecation rates of flies after 1 hr. n = 8–12. (C) Quantification of excreta size (area) of indicated male flies. n = 20. (D) Quantification of defecation amount per dung with the indicated male flies. n = 8. Means ± SEMs. Single-factor ANOVA with Scheffe’s analysis was used as a post hoc test to compare multiple sets of data. The black and red asterisks indicate significance from the controls and mutants, respectively (**p < 0.01).
Figure 7—figure supplement 1
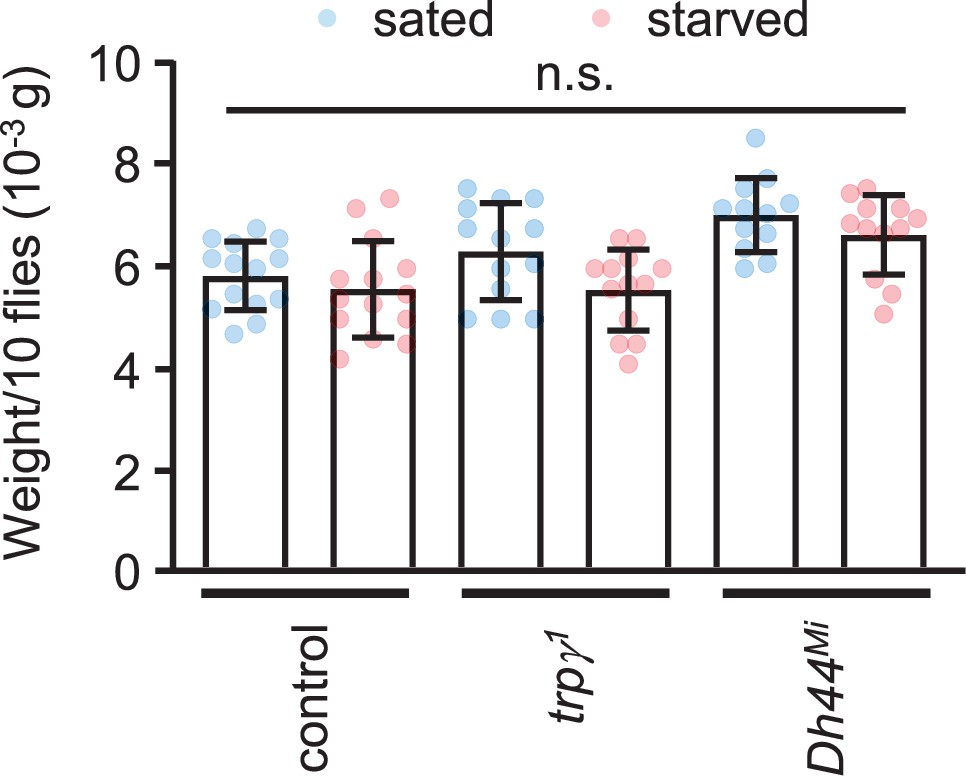
Body weight measurements.
Body weights of the indicated males under fed (no starvation) (blue data points) and 24 hr starvation (salmon colored data points) conditions were measured by selecting 10 (3- to 4-day-old) males of each indicated genotype. Body weights of groups of 10 males were measured using a digital balance. The weights were determined before they were starved (sated), and the same flies were starved for 24 hr in a vial containing wet Kimwipe paper, and their weights were measured again (starved). Unpaired Student’s t-tests were used to compare weights before and after starvation. n = 12–14. Means ± SEMs.
Videos
Video 1
Control fly displaying a proboscis extension response (PER) to 200 mM L-glucose after 18 hr starvation.
Video 2
trpγ1 mutant fly displaying a proboscis extension response (PER) to 200 mM L-glucose after 18 hr starvation.
Tables
Key resources table
| Reagent type (species) or resource | Designation | Source or reference | Identifiers | Additional information |
|---|---|---|---|---|
| Genetic reagent (Drosophila melanogaster) | trpγ1 | Akitake et al., 2015 | ||
| Genetic reagent (Drosophila melanogaster) | trpγG4 | Akitake et al., 2015 | ||
| Genetic reagent (Drosophila melanogaster) | trpγ1,UAS- trpγ/CyO | Akitake et al., 2015 | ||
| Genetic reagent (Drosophila melanogaster) | trpγ1;g(trpγ) | Akitake et al., 2015 | ||
| Genetic reagent (Drosophila melanogaster) | Dh44Mi | Bloomington Drosophila Stock Center | stock # 1454; RRID:BDSC_1454 | Provided by Y Kim (GIST) and Dr GS Suh (KAIST) |
| Genetic reagent (Drosophila melanogaster) | Dh44-GAL4 | Bloomington Drosophila Stock Center | stock # 1453; RRID:BDSC_1453 | Provided by Y Kim (GIST) and Dr GS Suh (KAIST) |
| Genetic reagent (Drosophila melanogaster) | UAS-hid/CyO | Bloomington Drosophila Stock Center | stock # 65403; RRID:BDSC_65403 | |
| Genetic reagent (Drosophila melanogaster) | UAS-mCD8::GFP | Bloomington Drosophila Stock Center | stock # 5130; RRID:BDSC_5130 | |
| Genetic reagent (Drosophila melanogaster) | UAS-nls::tdtomato | Knapp et al., 2015 | Provided by S Marella | |
| Genetic reagent (Drosophila melanogaster) | UAS-dicer2;UAS-trpγRNAi | Akitake et al., 2015 | Stock # 107656VDRC-107656 | |
| Genetic reagent (Drosophila melanogaster) | iav-GAL4 | Kwon et al., 2010 | ||
| Genetic reagent (Drosophila melanogaster) | dilp2-GAL4 | Rulifson et al., 2002 | Provided by EJ Rulifson | |
| Genetic reagent (Drosophila melanogaster) | Gr64ab | Jiao et al., 2007 | ||
| Genetic reagent (Drosophila melanogaster) | trpA11 | Kwon et al., 2008 | ||
| Genetic reagent (Drosophila melanogaster) | amo1 | Watnick et al., 2003 | ||
| Genetic reagent (Drosophila melanogaster) | trpml2 | Venkatachalam et al., 2008 | ||
| Genetic reagent (Drosophila melanogaster) | trp343 | Wang et al., 2005 | Originally isolated from W Pak lab | |
| Genetic reagent (Drosophila melanogaster) | pyx3 | Lee et al., 2005 | ||
| Genetic reagent (Drosophila melanogaster) | wtrwex | Wang et al., 2005 | ||
| Genetic reagent (Drosophila melanogaster) | trpl29134 | Niemeyer et al., 1996 | ||
| Genetic reagent (Drosophila melanogaster) | pain2 | Tracey et al., 2003 | ||
| Genetic reagent (Drosophila melanogaster) | nan36a | Kim et al., 2003 | ||
| Genetic reagent (Drosophila melanogaster) | UAS-GCaMP6s | Bloomington Drosophila Stock Center | stock # 77131; RRID:BDSC_77131 | |
| Genetic reagent (Drosophila melanogaster) | UAS-dsRed | Bloomington Drosophila Stock Center | stock # 59853; RRID:BDSC_59853 | |
| Genetic reagent (Drosophila melanogaster) | 20xUAS-ASAP2s | Bloomington Drosophila Stock Center | stock# 76247; RRID:BDSC_76247 | |
| Genetic reagent (Drosophila melanogaster) | UAS-Kir2.1 | Bloomington Drosophila Stock Center | stock # 6596; RRID:BDSC_6596 | |
| Genetic reagent (Drosophila melanogaster) | iav3621 | Bloomington Drosophila Stock Center | stock # 24768; RRID:BDSC_24768 | Generated by Dr P Salvaterra |
| Genetic reagent (Drosophila melanogaster) | tubulin-GAL80ts | Bloomington Drosophila Stock Center | stock # 7017; RRID:BDSC_7017 | |
| Antibody | Mouse anti-GFP (mouse monoclonal) | Molecular Probes | A-11120 | (1:1000, 2 μL) |
| Antibody | Rabbit anti-DsRed (rabbit polyclonal) | Clontech | 632496 | (1:1000, 2 μL) |
| Antibody | Goat anti-mouse IgG (mouse polyclonal) | Thermo Fisher/Invitrogen | A-11031 | Alexa Fluor 488 (1:200, 10 μL) |
| Antibody | Goat anti-rabbit IgG (rabbit polyclonal) | Thermo Fisher/Invitrogen | A-11034 | Alexa Fluor 568 (1:200, 20 μL) |
| Antibody | Rabbit anti-DH44 (rabbit polyclonal) | Cabrero et al., 2002 | (1:500, 15 μL) | |
| Commercial assay or kit | Glucose (HK) Assay Kit | Sigma-Aldrich | Sigma: G3293 | |
| Chemical compound, drug | Brilliant blue FCF | Takeda-Wako Pure Chemical Industry Ltd | Cat. 3844-45-9 | |
| Chemical compound, drug | Paraformaldehyde | Electron Microscopy Sciences | Cat. 15710 | |
| Chemical compound, drug | Sulforhodamine B | Sigma-Aldrich | Cat. 3520-42-1 | |
| Chemical compound, drug | Sucrose | Sigma-Aldrich | Cat. 57-50-1 | |
| Chemical compound, drug | D-(+)-Glucose | Sigma-Aldrich | Cat. 50-99-7 | |
| Chemical compound, drug | D-(-)-Fructose | Sigma-Aldrich | Cat. 57-48-7 | |
| Chemical compound, drug | D-(+)-Maltose | Sigma-Aldrich | Cat. 6363-53-7 | |
| Chemical compound, drug | D-(+)-Trehalose | Sigma-Aldrich | Cat. 6138-23-4 | |
| Chemical compound, drug | KCl | Sigma-Aldrich | Cat. 7447-40-7 | |
| Chemical compound, drug | Hydrochloric acid | Samchun | Cat. 7647-01-0 | |
| Chemical compound, drug | Ethanol | Merck | Cat. 64-17-5 | |
| Chemical compound, drug | Trehalase from porcine kidney | Sigma-Aldrich | Cat. 9025-52-9 | |
| Chemical compound, drug | Amyloglucosidase from Aspergillus | Sigma-Aldrich | Cat. 9032-08-0 |
Additional files
-
Transparent reporting form
- https://cdn.elifesciences.org/articles/56726/elife-56726-transrepform1-v2.pdf
-
Source data 1
Detailed statistics for all data.
- https://cdn.elifesciences.org/articles/56726/elife-56726-data1-v2.docx
Download links
A two-part list of links to download the article, or parts of the article, in various formats.
Downloads (link to download the article as PDF)
Open citations (links to open the citations from this article in various online reference manager services)
Cite this article (links to download the citations from this article in formats compatible with various reference manager tools)
Drosophila TRPγ is required in neuroendocrine cells for post-ingestive food selection
eLife 11:e56726.
https://doi.org/10.7554/eLife.56726


