Phosphatidylinositol 3-phosphate and Hsp70 protect Plasmodium falciparum from heat-induced cell death
- Department of Molecular Genetics and Microbiology, School of Medicine, Duke University, United States
- Department of Chemistry, Duke University, United States
- Department of Biological Engineering, Massachusetts Institute of Technology, United States
- Department of Pharmacology and Cancer Biology, School of Medicine, Duke University, United States
Figures
Figure 1 with 3 supplements
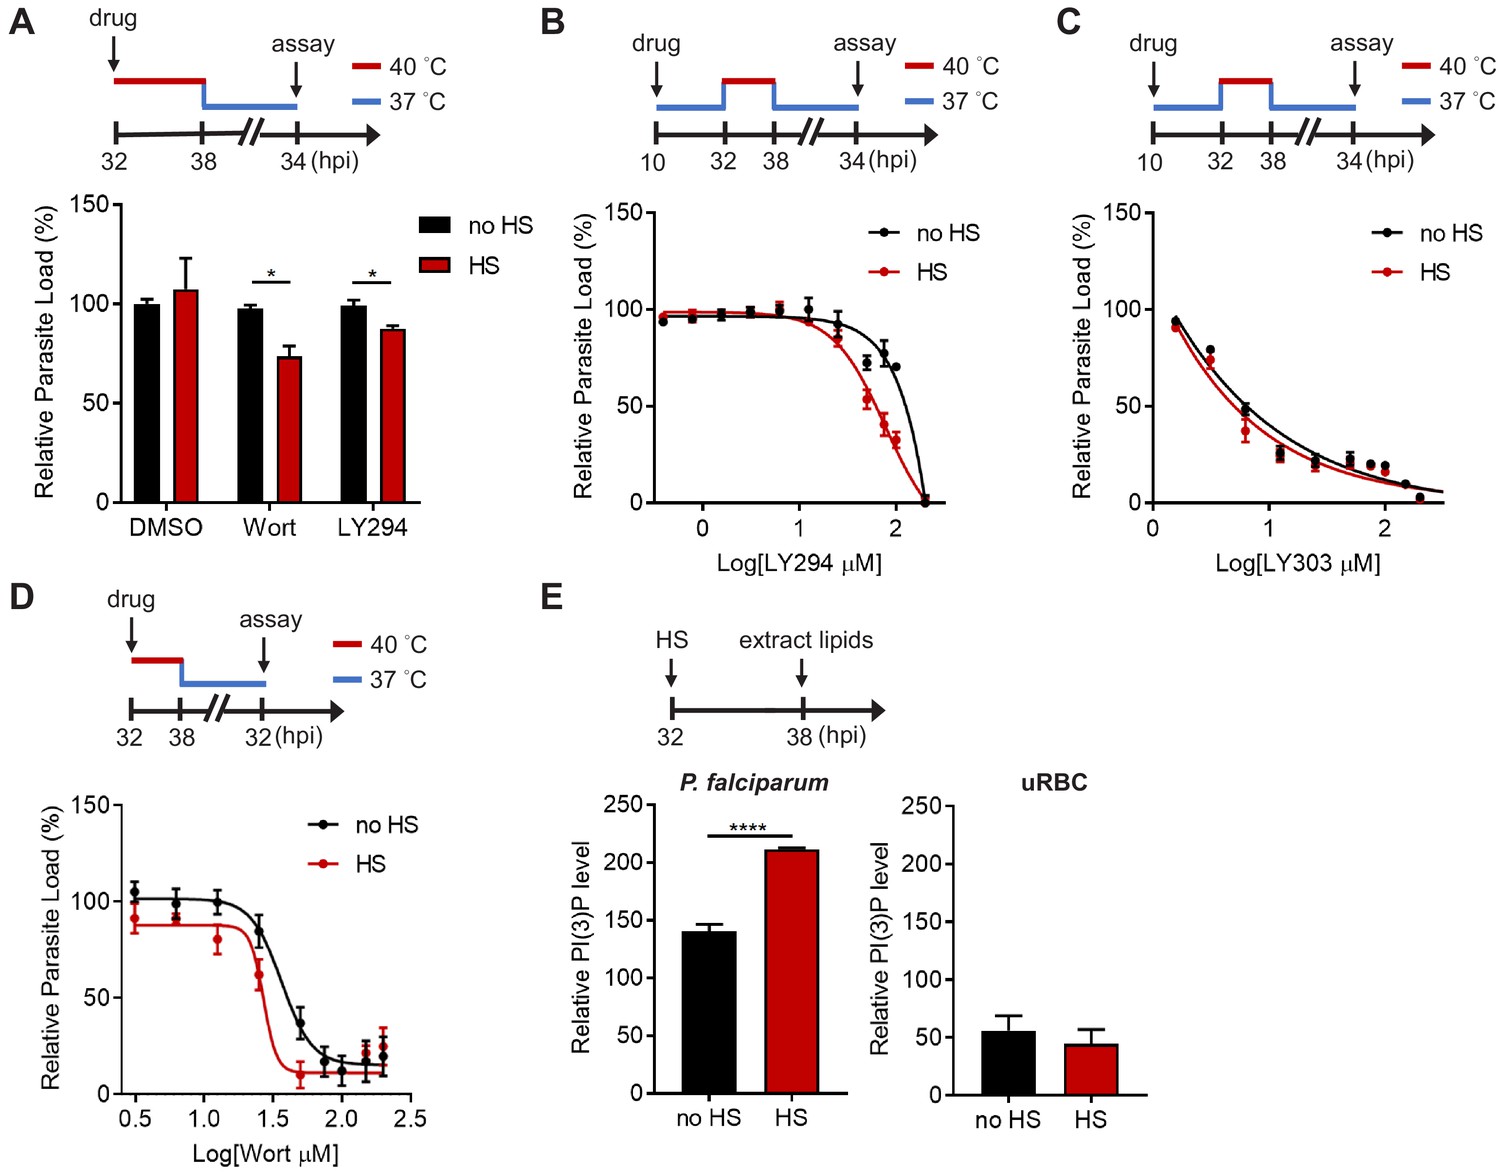
PI(3)P reduction sensitizes heat-shock-induced Plasmodium parasite death.
(A) Inhibition of PI(3)P synthesis reduces parasite fitness under heat shock. Assay schematic above plot shows drug administration 32 hpi and analysis at 34 hr after reinvasion (50 hr drug treatment) for the growth assay. P. falciparum 3D7 parasites were subjected to a 6 hr heat shock (32–38 hpi) (red line), followed by recovery at 37°C (blue line). Parasite loads were normalized to the DMSO-treated, non-heat-shocked control. Parasites that received (red bar) or did not receive (black bar) a 6 hr heat shock in the presence of 0.1% DMSO, 20 μM Wortmannin (Wort) or 40 μM LY294002 (LY294) are shown. Representative data of three biological replicates is shown (n = 3). *p<0.05 (unpaired t-test). (B–D) Dose response curves for LY294002 (B), LY303511 (LY303, inactive analog of LY294002) (C) and Wortmannin (D) inhibition of P. falciparum 3D7 with (red circles) or without (black circles) heat shock (HS). Assay schematics shown above plots indicate times of drug addition and assay analysis after reinvasion. Parasites received a 6 hr heat shock (32–38 hpi) (red line) and were maintained at 37°C (blue line) before and after heat shock. Representative data of two biological replicates are shown (n = 3). (E) The heat shock effect on intra-parasitic levels of PI(3)P. Assay schematic above plot indicates heat shock treatment and cell harvesting for lipid extraction. Total lipids of P. falciparum (left panel) and uninfected red blood cells (uRBC, right panel) that received (red bar) or did not receive (black bar) a 6 hr heat shock were extracted and spotted on a nitrocellulose membrane. The relative amounts of PI(3)P were quantified using a PI(3)P-specific binding peptide, 2xFyve. Representative data of three biological replicates is shown (n = 3). ****p<0.0001 (unpaired t-test). The bars represent mean ± SEM.
Figure 1—figure supplement 1
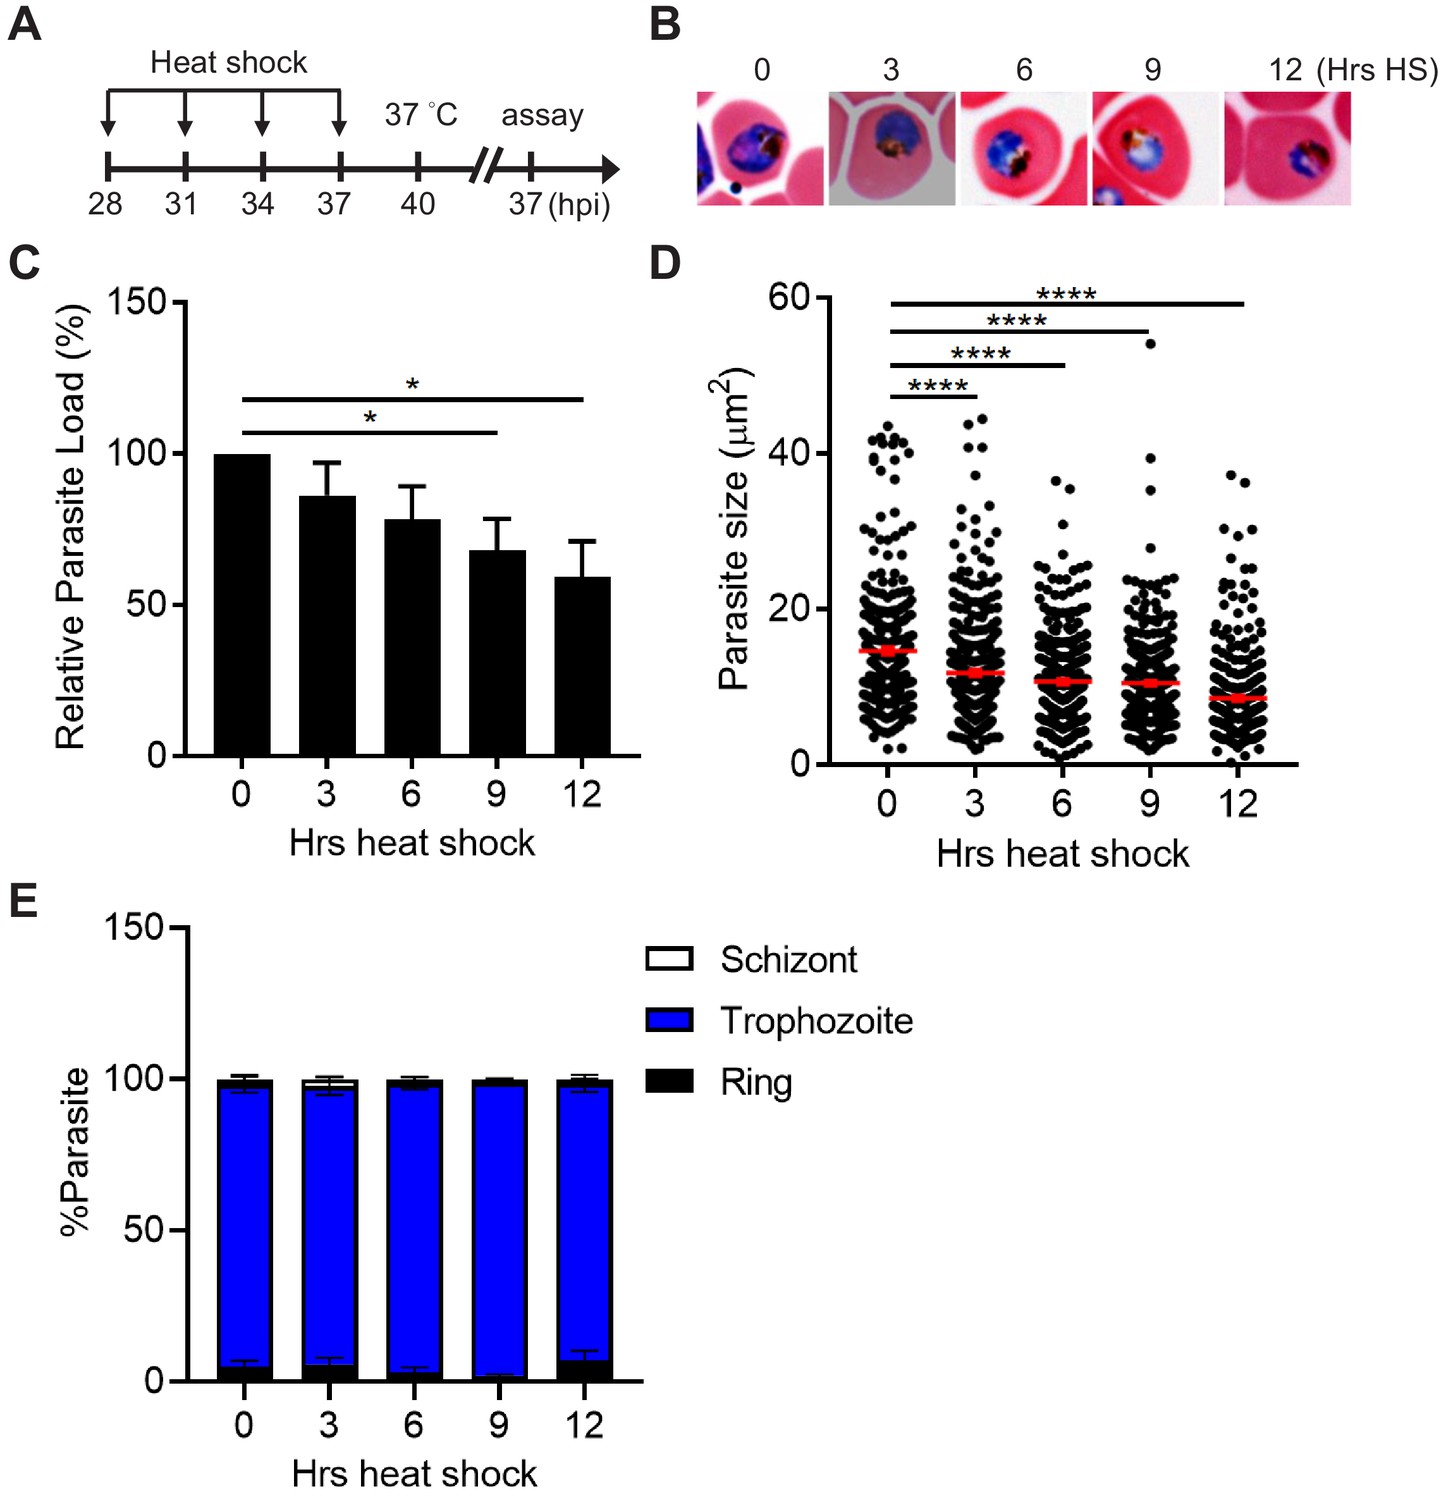
Plasmodium parasites at the trophozoite and early schizont stages tolerate a 6 hr heat shock.
(A) Assay schematic showing heat treatment (40°C) at 28–37 hpi, followed by recovery at 37°C at 40 hpi. Broken line indicates parasite reinvasion. The parasite growth assays were performed 37 hr after reinvasion (45 hr after recovery). (B) Representative images of counterstained P. falciparum 3D7-infected erythrocytes that were subjected to different length of heat shock (3–12 hr HS). A non-heat-shocked control (0 hr HS) is shown for comparison. (C) The heat stress effect on parasite growth. Parasite loads were normalized to the non-heat-shocked control (n = 3). The average of three biological replicates is shown. *p<0.05 (unpaired t-test). (D) The heat shock effect on parasite size. Representative data of three biological replicates is shown (n > 300). ****p<0.0001 (Welch’s t-test). (E) The heat-shock effect on parasite development. Percentage of parasites at ring (black bar), trophozoite (blue bar) and schizont (white bar) stages were measured. Representative data of three biological replicates is shown (n > 480). The bars represent mean ± SEM.
Figure 1—figure supplement 2
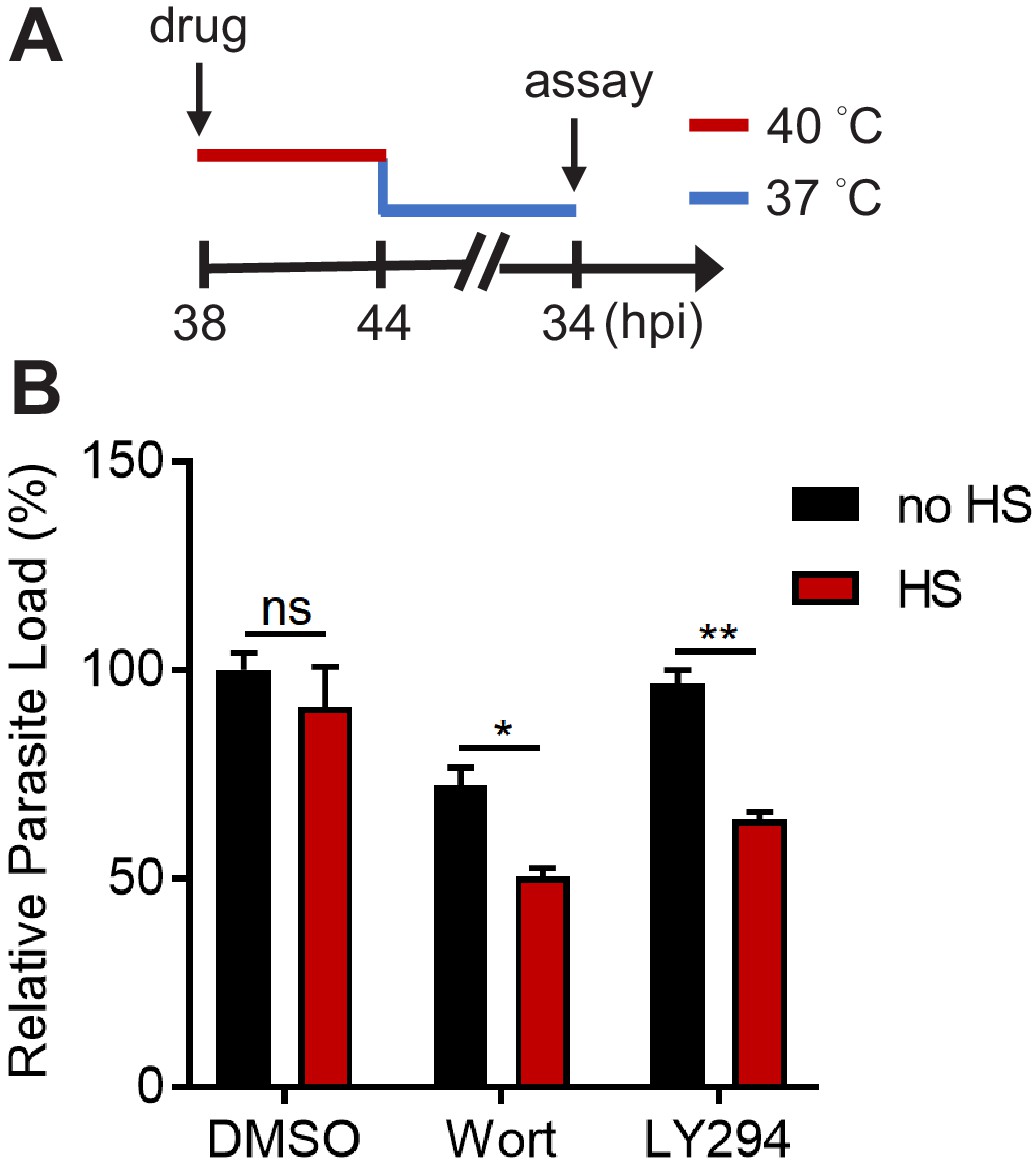
Inhibiting PI(3)P biogenesis reduces P. falciparum schizont growth during heat shock.
Plasmodium 3D7 parasites at the schizont stage (38 hpi) were treated with 0.1% DMSO, 20 μM Wortmannin (Wort) or 40 μM LY294002 (LY294) at 37°C (no HS) or 40°C (HS, red line) for 6 hr, followed by recovery at 37°C (blue line) at 44 hpi. (A) Assay schematic showing drug and heat treatment with parasite lysis at 34 hr after reinvasion (38 hr after recovery) for the growth assay. Broken line indicates parasite reinvasion. (B) Parasite loads were measured and normalized to the DMSO-treated, non-heat-shocked control. Parasites that received (red bar) or did not receive (black bar) a 6 hr heat shock are shown. Representative data of three biological replicates is shown (n = 3). *p<0.05; **p<0.01; ns, not significant (unpaired t-test). The bars represent mean ± SEM.
Figure 1—figure supplement 3
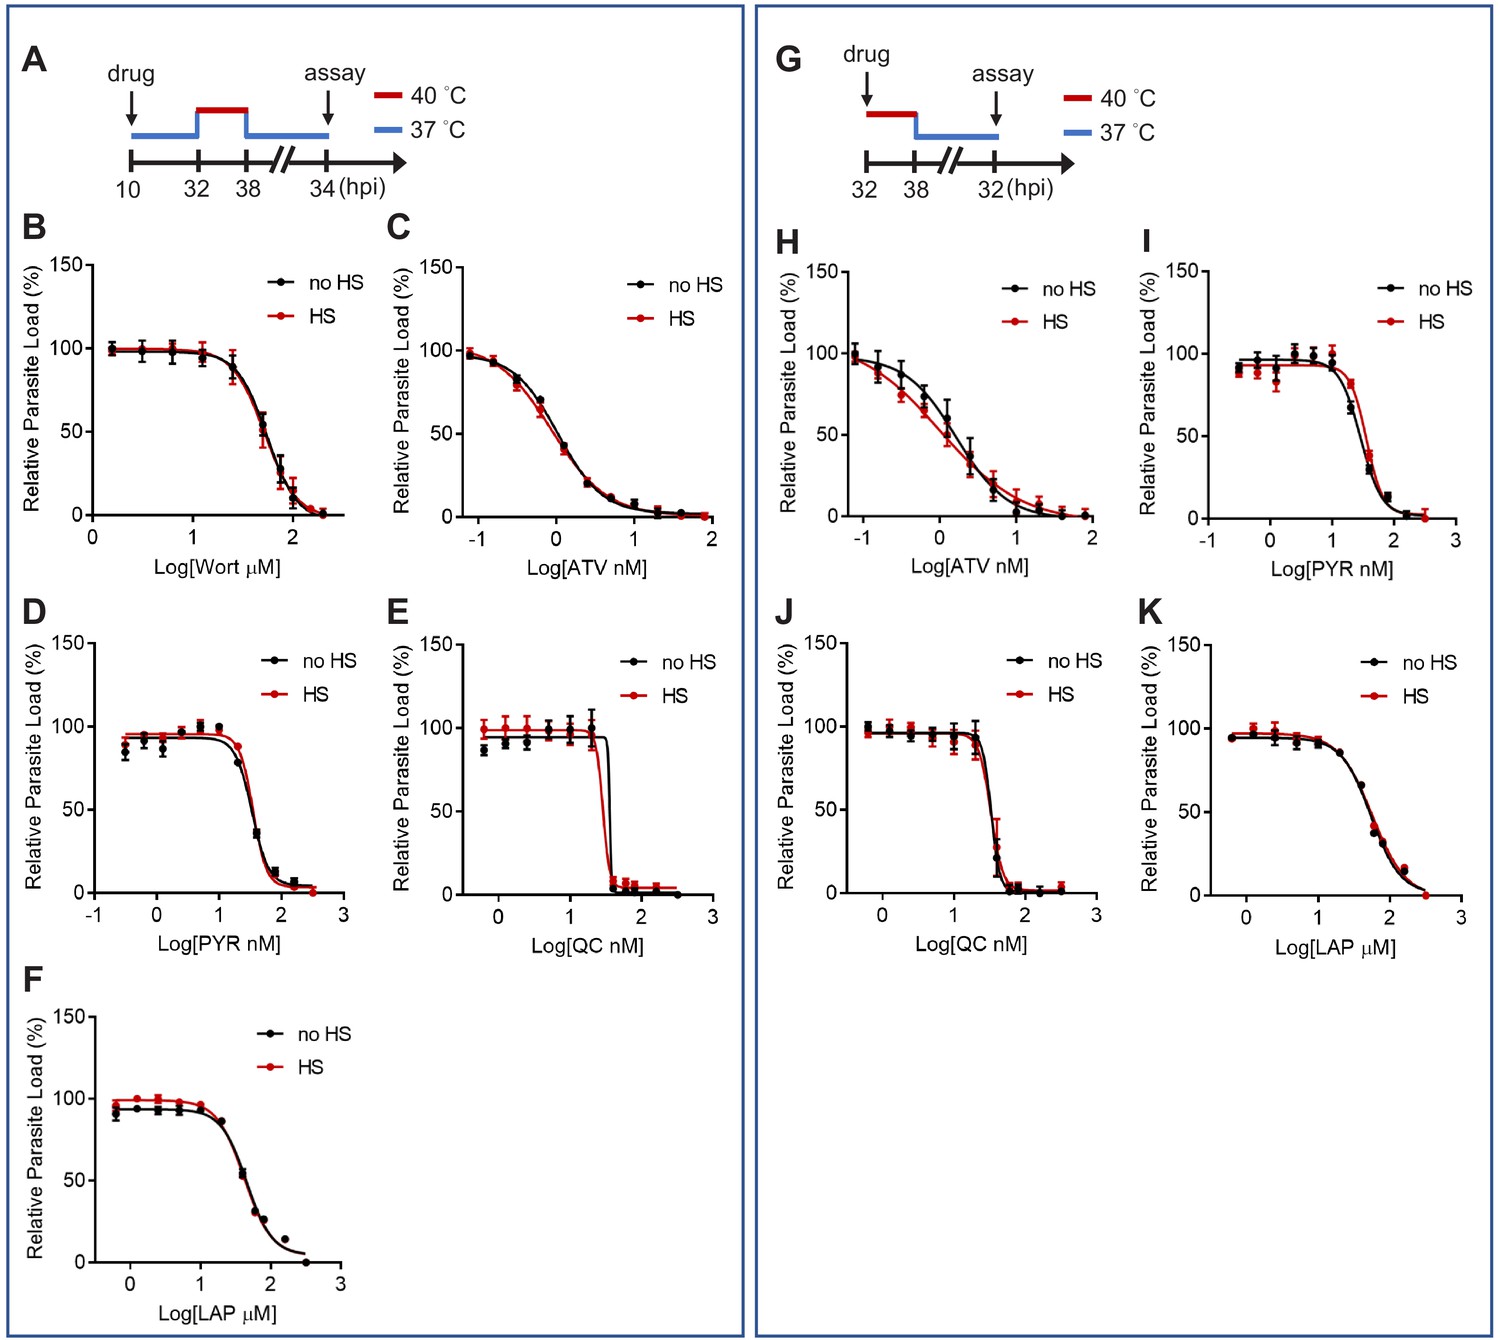
The heat-shock-induced drug hypersensitivity is not detected with other antimalarial drugs.
Parasites were drug-treated at different stages with or without a 6 hr heat shock at 32–38 hpi. (A and G) Assay schematics showing drug administration at 10 hpi (A–F) or 32 hpi (G–K) with heat shock (red line). Parasites were cultured at 37°C before and after heat shock (blue line) and lysed at 34 (A–F) or 32 (G–K) hr after reinvasion for the growth assays. Broken line indicates parasite reinvasion. (B–F and H–K) Dose response curves for Wortmannin (Wort) (B), atovaquone (ATV) (C and H), pyrimethamine (PYR) (D and I), quinacrine (QC) (E and J) and lapachol (LAP) (F and K) inhibition of P. falciparum with (red circles, HS) or without (black circles, no HS) heat shock. Representative data of two biological replicates are shown (n = 3). The bars represent mean ± SEM.
Figure 2
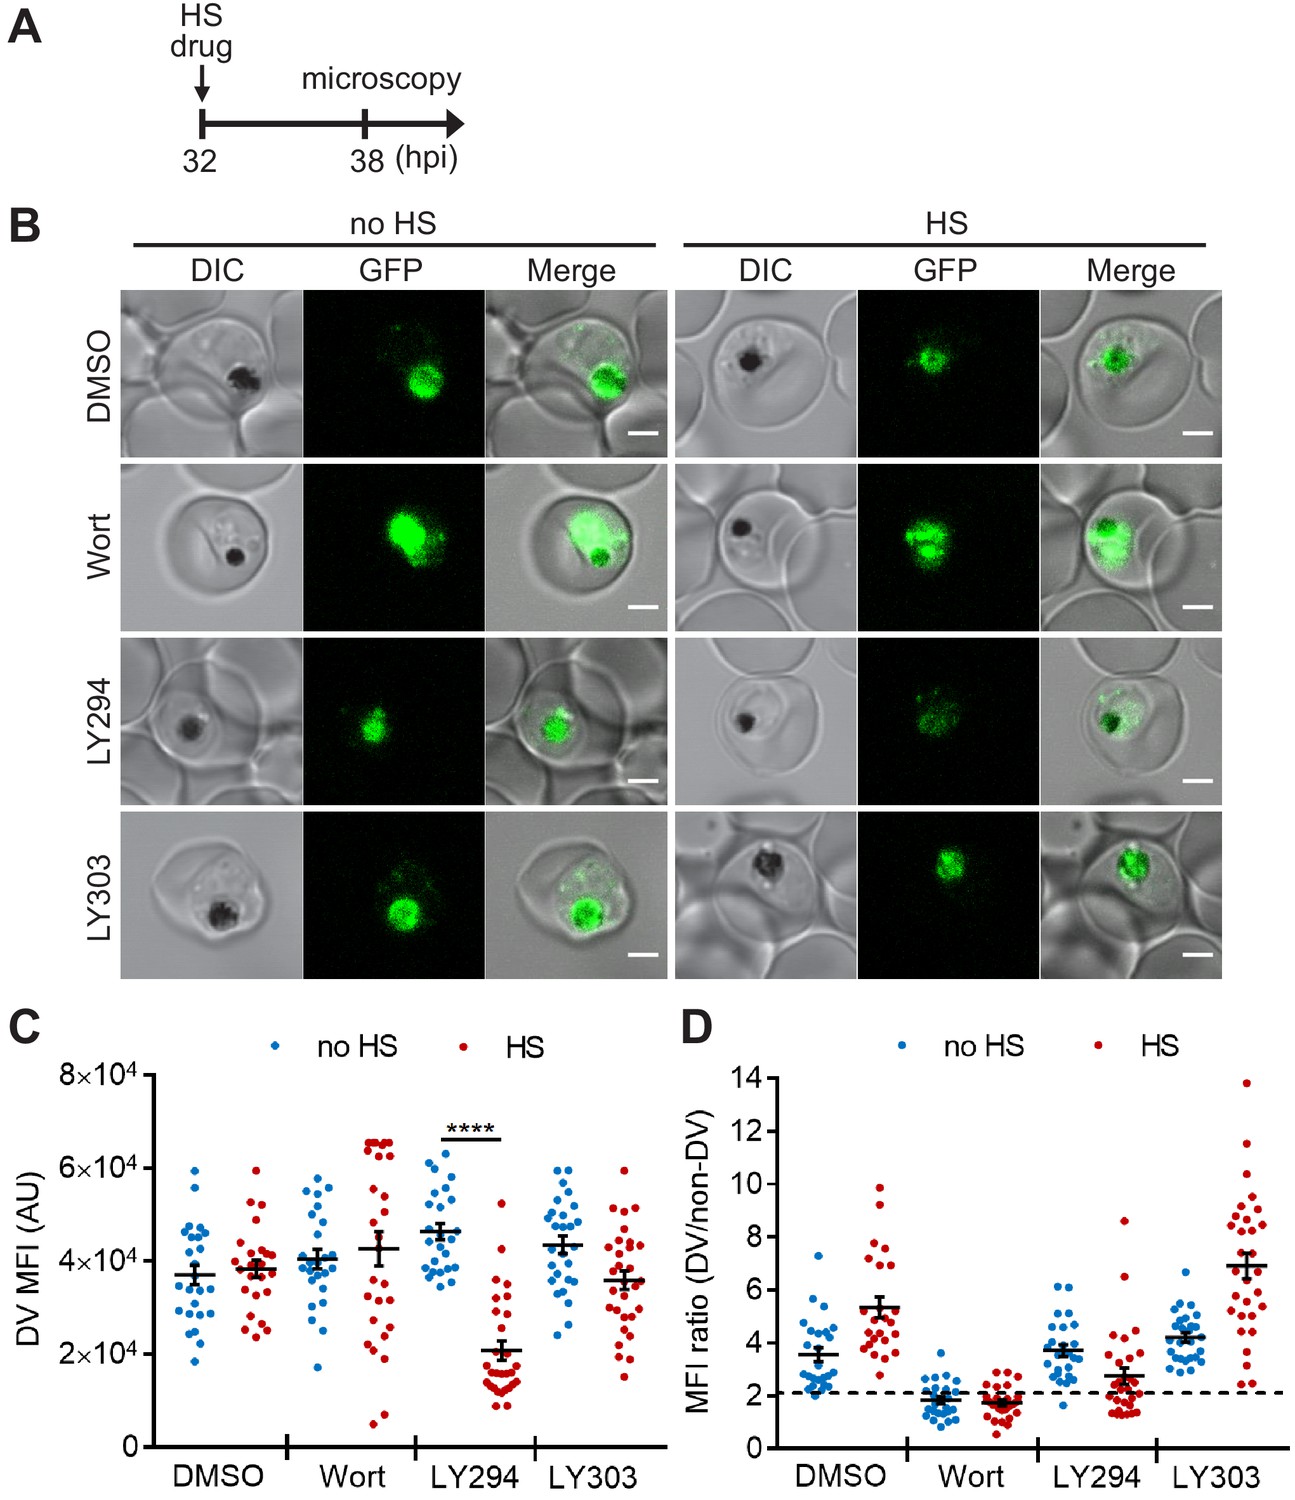
Targeting PI(3)P synthesis disrupts the subcellular localization of a DV-resident protein plasmepsin II under heat stress.
P. falciparum PM2GT parasites were treated with 0.1% DMSO, 20 μM Wortmannin (Wort), 40 μM LY294002 (LY294) or 40 μM LY303511 (LY303) at 37°C (no HS) or 40°C (HS) for 6 hr. (A) Assay schematic showing drug and heat shock treatment at 32 hpi, followed by microscopy at 38 hpi. (B) Representative images from live cell confocal microscopy are shown. GFP, green fluorescent protein-tagged plasmepsin II; DIC, differential interference contrast. Scale bar, 2 μm. (C) Mean fluorescence intensities of DVs (DV MFIs) in heat-shocked (red) and non-heat-shocked (blue) parasites were quantified. Representative data of three biological replicates is shown (n > 20). ****p<0.0001 (Welch’s t-test). The bars represent mean ± SEM. (D) The ratios of mean fluorescence intensities within DVs (DV MFI) to that in the non-DV areas (non-DV MFI) in heat-shocked (red) and non-heat-shocked (blue) parasites. The MFI ratio <2 (dotted line) indicates mislocalization of plasmepsin II-GFP to the non-DV regions. Representative data of three biological replicates is shown (n > 20).
-
Figure 2—source data 1
The DV MFIs and MFI ratios in Figure 2.
- https://cdn.elifesciences.org/articles/56773/elife-56773-fig2-data1-v1.xlsx
Figure 3 with 1 supplement
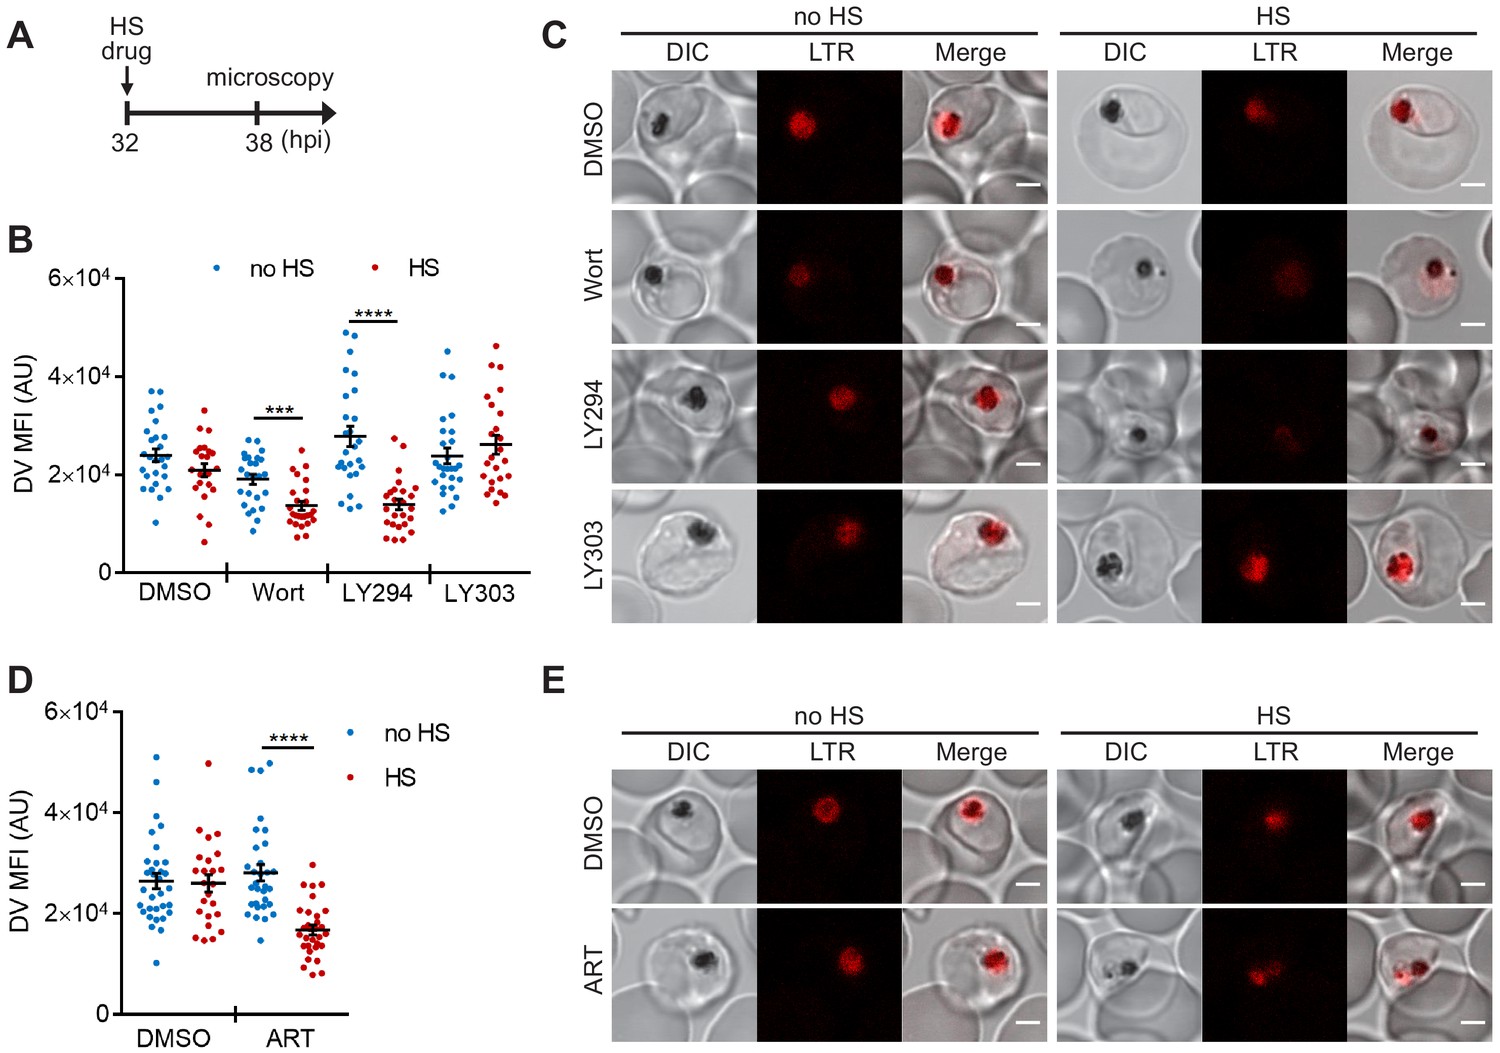
PI(3)P biogenesis maintains Plasmodium DV integrity under heat shock.
Plasmodium 3D7 parasites were loaded with LysoTracker Red to stain acidic organelles and treated with 0.1% DMSO, 20 μM Wortmannin (Wort), 40 μM LY294002 (LY294), 40 μM LY303511 (LY303) or 20 nM artesunate (ART) at 37°C (no HS) or 40°C (HS) for 6 hr. (A) Assay schematic showing drug and heat-shock treatment at 32 hpi, followed by live cell confocal microscopy at 38 hpi. (B and D) Mean fluorescence intensities of DVs (DV MFIs) in heat-shocked (red) and non-heat-shocked (blue) parasites were quantified. Representative data of three biological replicates are shown (n > 20). ***p<0.001; ****p<0.0001 (Welch’s t-test). The bars represent mean ± SEM. (C and E) Representative images from live cell confocal microscopy are shown. LTR, LysoTracker Red; DIC, differential interference contrast. Scale bar, 2 μm.
-
Figure 3—source data 1
The DV MFIs in Figure 3.
- https://cdn.elifesciences.org/articles/56773/elife-56773-fig3-data1-v1.xlsx
Figure 3—figure supplement 1
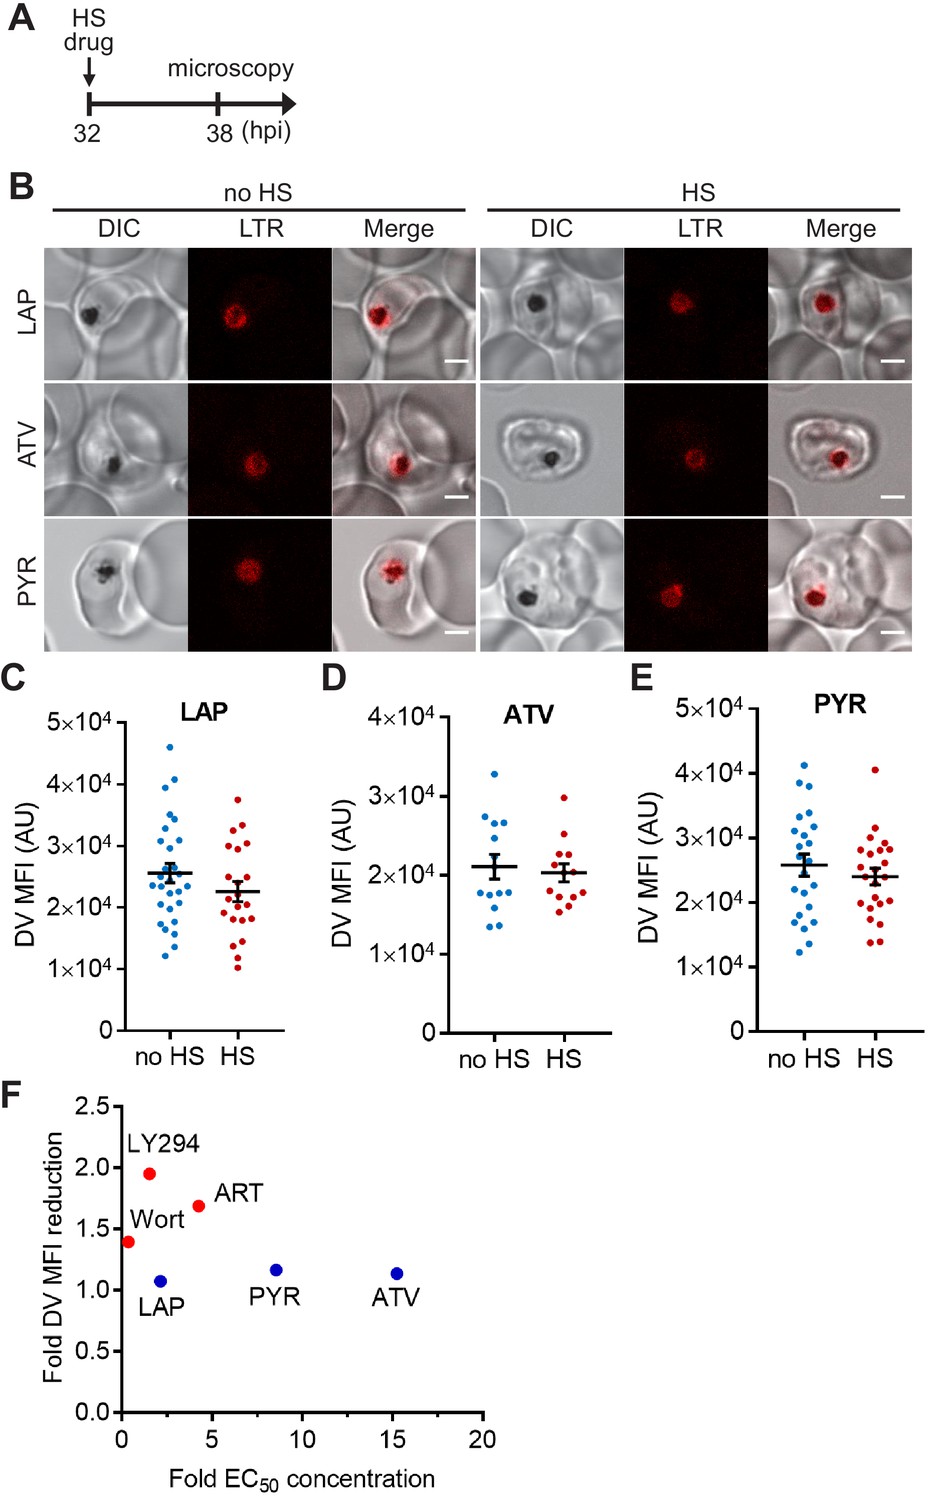
The heat-shock-induced DV destabilization does not correlate with antimalarial potency of the inhibitors.
Plasmodium 3D7 parasites were loaded with LysoTracker Red (LTR) to stain acidic vacuoles and treated with 40 μM lapachol (LAP), 40 nM atovaquone (ATV) or 200 nM pyrimethamine (PYR) at 37°C (no HS) or 40°C (HS) for 6 hr. (A) Assay schematic showing drug and heat shock treatment at 32 hpi, followed by live cell confocal microscopy at 38 hpi. (B) Representative microscopy images are shown. DIC, differential interference contrast. Scale bar, 2 μm. (C–E) Mean fluorescence intensities of DVs (DV MFIs) in heat-shocked (red) and non-heat-shocked (blue) parasites were measured. Representative data of three biological replicates are shown (n > 20). The bars represent mean ± SEM. (F) Correlation between DV MFI reduction and the fold EC50 concentrations (antimalarial potency) applied. The average DV MFI reductions in drug-treated parasites from three independent assays are plotted against the corresponding fold EC50 concentrations that are calculated by dividing the drug concentrations used in our assays by the arithmetic means of their reported EC50s (Supplementary file 2). For example, the reported EC50 value of ATV is 2.63 nM on average (Supplementary file 2) and the concentration we used to treat the parasites is 40 nM, giving its fold EC50 concentration to be 15.2. Red circles represent compounds that cause significant loss of DV integrity after heat shock, while blue circles represent those with no heat-induced DV signal reductions. Wort, Wortmannin; LY294, LY294002; ART, artesunate.
Figure 4
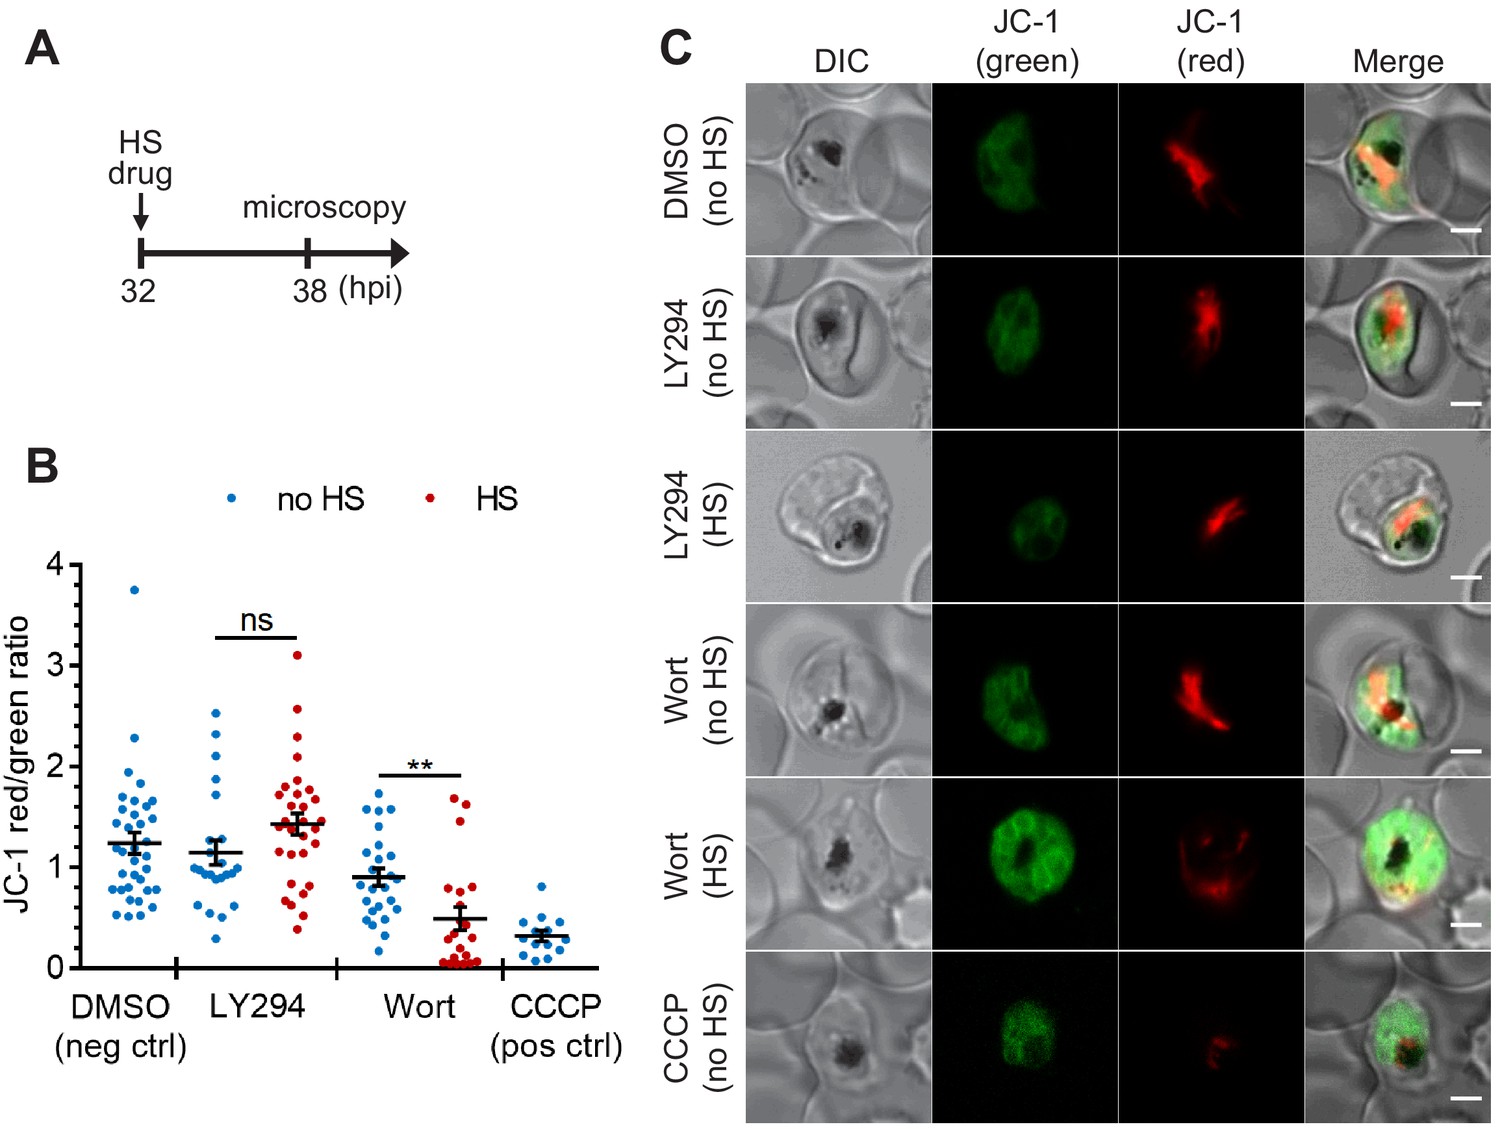
The heat-shock-induced DV destabilization is organelle specific and not a result of parasite death in PI(3)P-deficient cells.
Plasmodium 3D7 parasites were treated with 20 μM Wortmannin (Wort) or 40 μM LY294002 (LY294) at 37°C (no HS) or 40°C (HS) for 6 hr and loaded with JC-1 dye to monitor mitochondrial membrane potential as a marker for parasite viability. DMSO and CCCP were used as negative and positive controls for mitochondrial depolarization, respectively. (A) Assay schematic showing drug and heat-shock treatment at 32 hpi, followed by JC-1 loading for microscopy. (B) The ratios of JC-1 red fluorescence to JC-1 green fluorescence in heat-shocked (red) and non-heat-shocked (blue) parasites were quantified to determine the degree of mitochondrial membrane depolarization. Representative data of three biological replicates is shown (n > 20). **p<0.01; ns, not significant (Welch’s t-test). The bars represent mean ± SEM. (C) Representative images from live cell confocal microscopy are shown. JC-1 (green) indicates the monomeric dye in the cytoplasm, while the aggregated JC-1 in the mitochondria of viable parasites emits red fluorescence. DIC, differential interference contrast. Scale bar, 2 μm.
-
Figure 4—source data 1
The JC-1 red/green ratios in Figure 4.
- https://cdn.elifesciences.org/articles/56773/elife-56773-fig4-data1-v1.xlsx
Figure 5
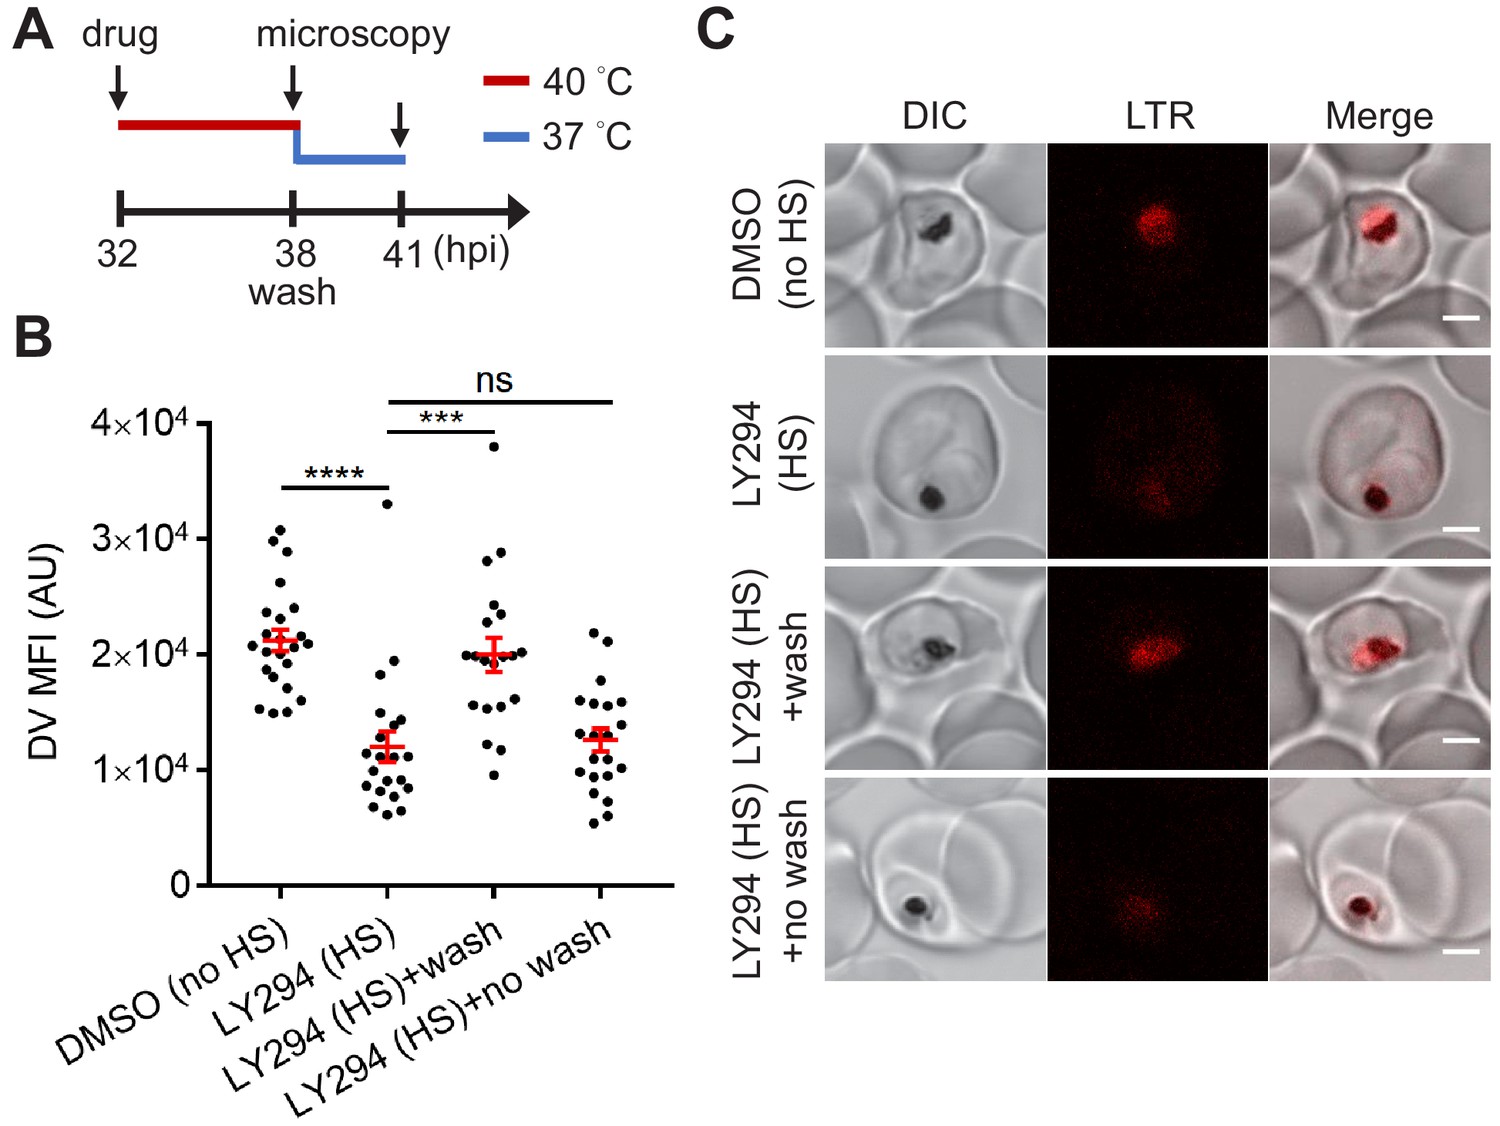
Reduced PI(3)P production causes delayed DV recovery.
Plasmodium 3D7 parasites were loaded with LysoTracker Red (LTR) to stain acidic organelles and treated with 0.1% DMSO or 40 μM LY294002 (LY294) at 37°C (no HS) or 40°C (HS) for 6 hr. (A) Assay schematic showing drug and heat treatment (red line) at 32 hpi, followed by recovery at 37°C (blue line) at 38 hpi for 3 hr in the presence (no wash) or absence (wash) of the inhibitor. Confocal microscopy was performed immediately after heat shock (38 hpi) or after recovery (41 hpi). (B) Mean fluorescence intensities of parasite DVs (DV MFIs) were quantified. Representative data of three biological replicates is shown (n > 20). ***p<0.001; ****p<0.0001; ns, not significant (Welch’s t-test). The bars represent mean ± SEM. (C) Representative confocal images are shown. DIC, differential interference contrast. Scale bar, 2 μm.
-
Figure 5—source data 1
The DV MFIs in Figure 5.
- https://cdn.elifesciences.org/articles/56773/elife-56773-fig5-data1-v1.xlsx
Figure 6 with 1 supplement
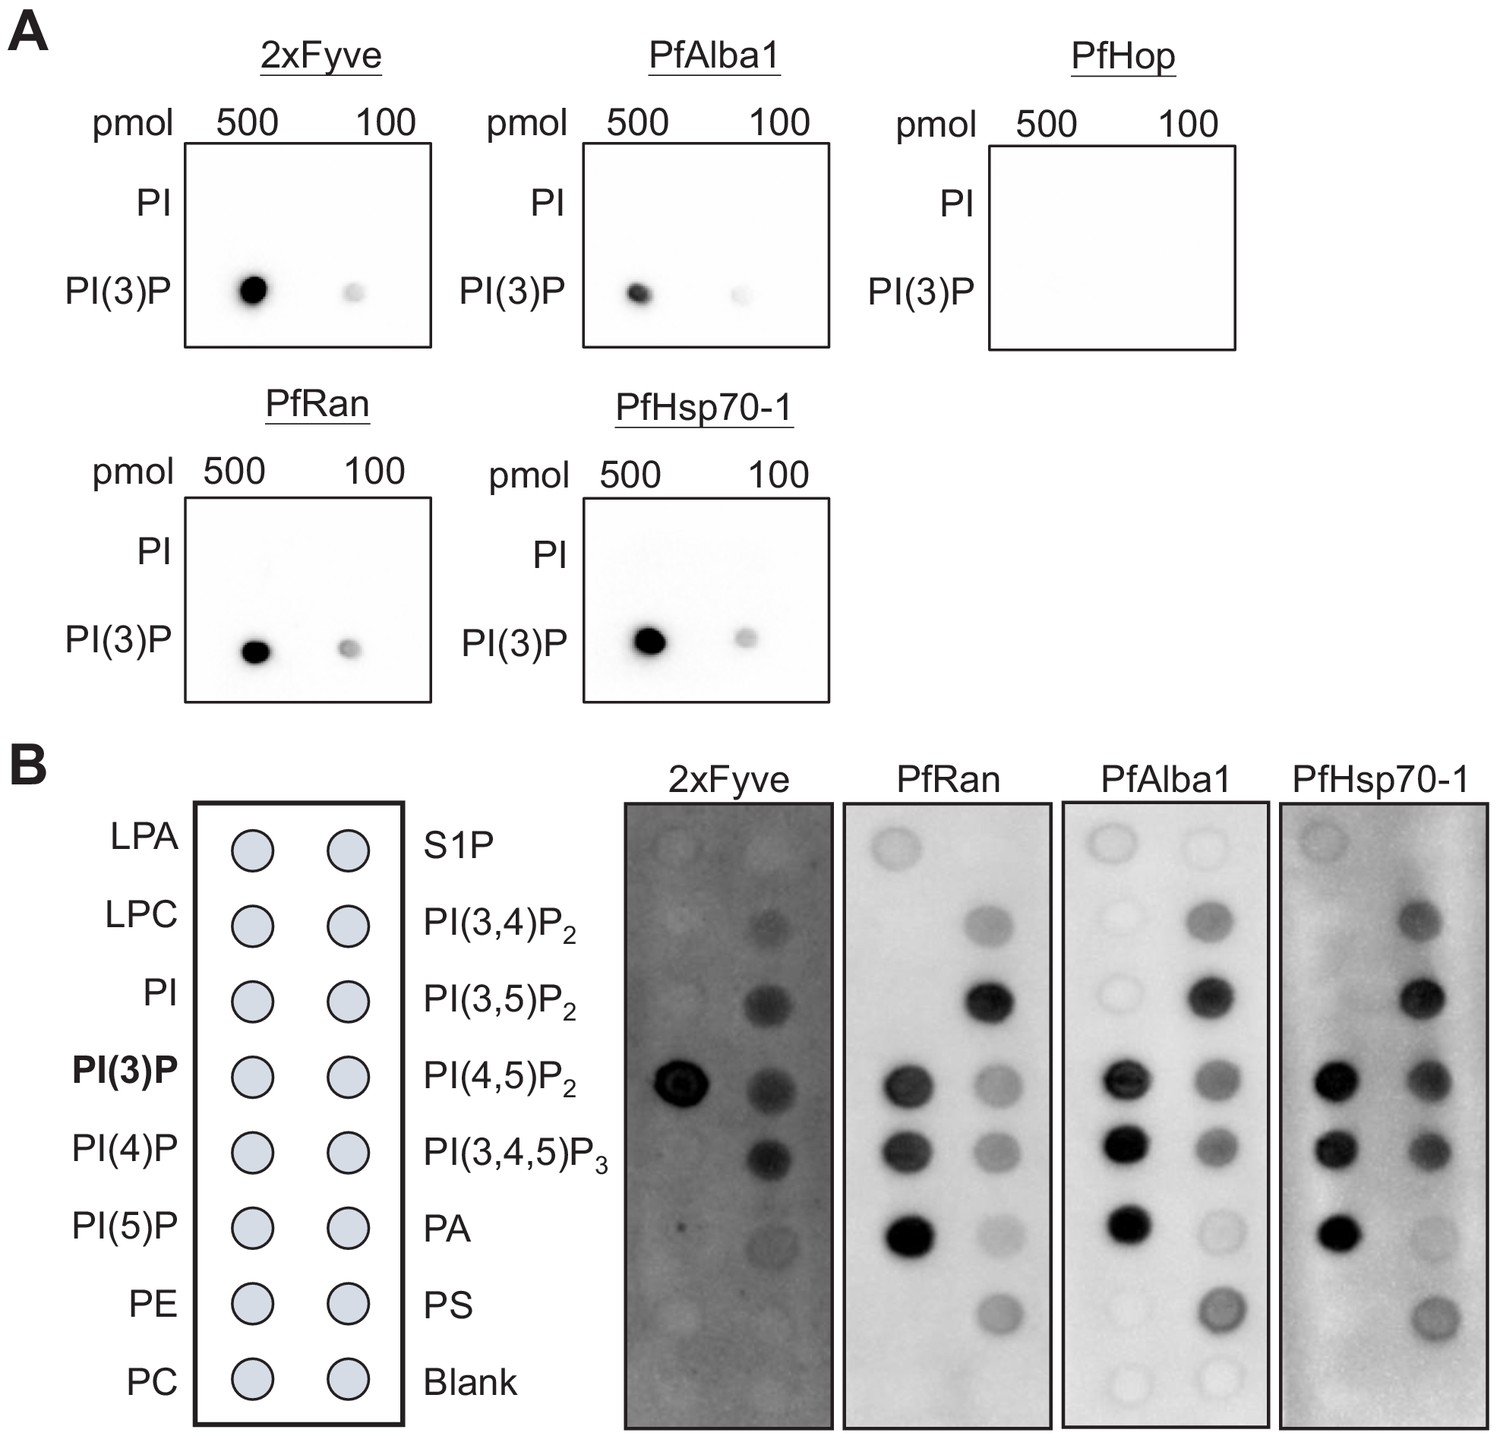
Identified P. falciparum proteins bind to PI(3)P.
(A) A proteomic approach identified several P. falciparum proteins that may bind to PI(3)P. Candidate proteins (PfRan, PfAlba1 and PfHsp70-1) and a known PI(3)P-specific binding peptide, 2xFyve, were expressed and purified from yeast. Purified His-tagged proteins (>95% pure) were used to probe nitrocellulose membranes spotted with 100 pmol and 500 pmol lipids (PI(3)P and PI). Lipid-binding proteins were detected using electrochemiluminescence. Another His-tagged protein, PfHop, was used as a negative control. Representative data from two–three independent assays is shown. (B) Characterization of the lipid-binding specificity for PI(3)P-binding proteins. Map of different lipid spots (100 pmol/spot) indicated (left panel) and specificity of 2xFyve, PfRan, PfAlba1 and PfHsp70-1, respectively, shown.
Figure 6—figure supplement 1
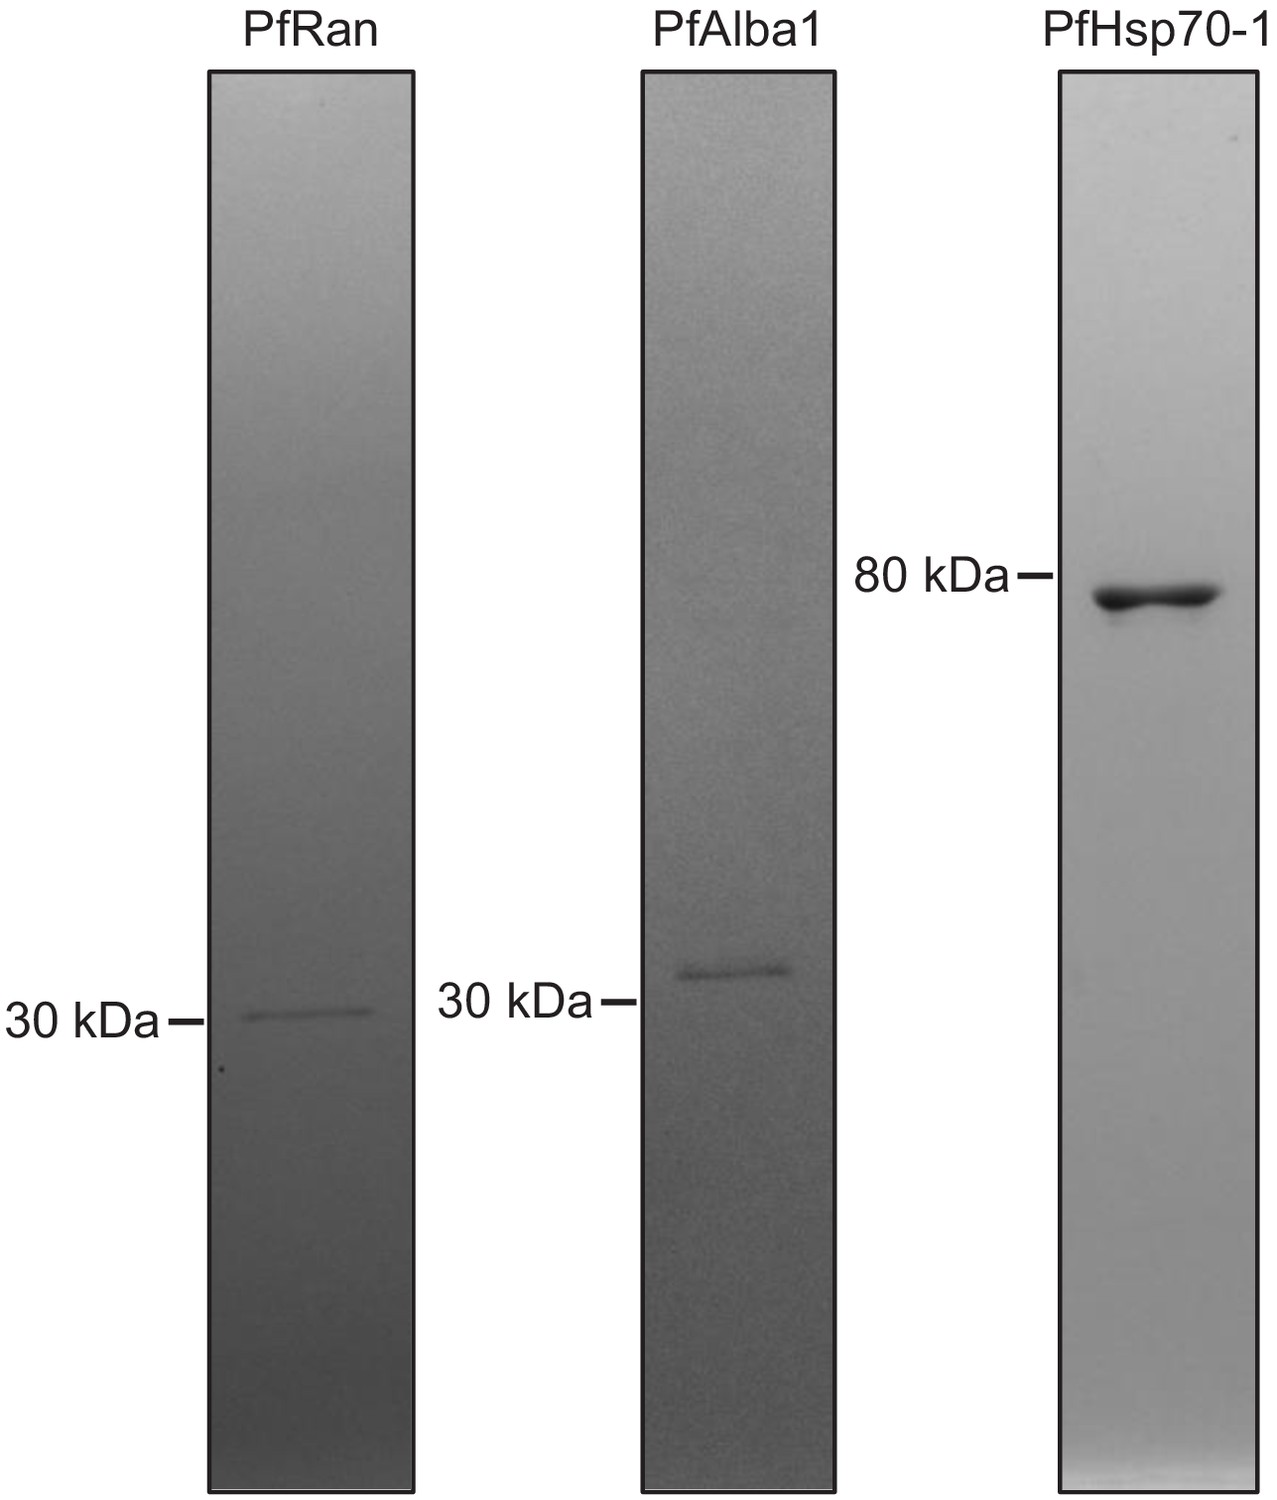
Identified P. falciparum PI(3)P-binding proteins can be purified for downstream in vitro binding assays.
Candidate genes (PfRan, PfAlba1 and PfHsp70-1) were individually cloned and expressed in yeast. Proteins were purified, resolved on gels, followed by Coomassie blue staining to assess purity. Proteins > 95% pure were used for the biochemical studies.
Figure 7 with 8 supplements
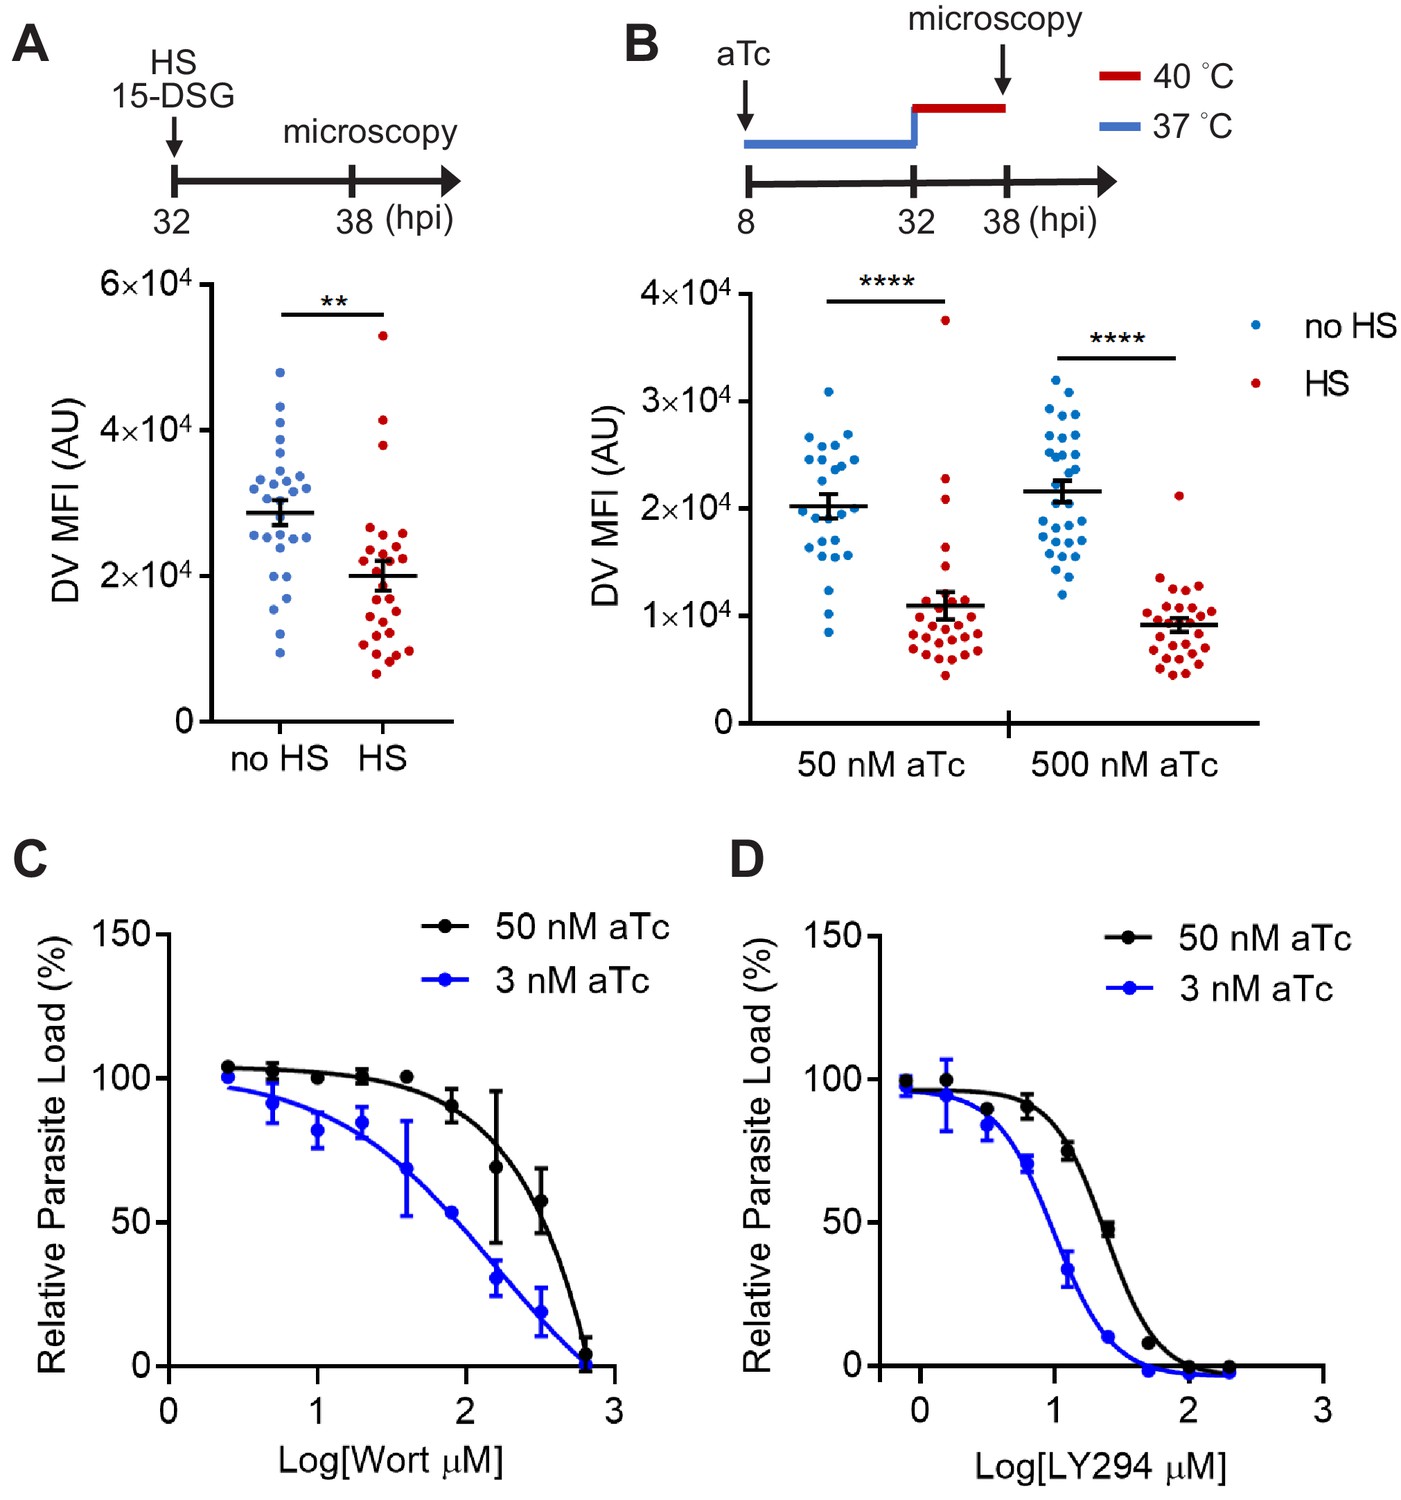
PfHsp70-1 depletion causes increased sensitivity to PI3K inhibitors and destabilizes Plasmodium DV during heat shock.
(A) Plasmodium 3D7 parasites were loaded with LysoTracker Red and treated with a PfHsp70-1 inhibitor, 15-deoxyspergualin (15-DSG, 1 μM). Assay schematic above plot indicates drug and heat shock treatment at 32 hpi, followed by live cell microscopy at 38 hpi. Mean fluorescence intensities of DVs (DV MFIs) in heat-shocked (HS, red) and non-heat-shocked (no HS, blue) parasites were quantified. Representative data of three biological replicates is shown (n > 20). **p<0.01 (Welch’s t-test). (B) A tunable PfHsp70-1 parasite line was cultured in 50 nM or 500 nM anhydrotetracycline (aTc) for 24 hr before LysoTracker Red loading at 32 hpi. Assay schematic above plot indicates aTc treatment to modulate PfHsp70-1 expression at 37°C (blue line), followed by a 6 hr heat shock (red line). DV MFIs in heat-shocked (HS, red) and non-heat-shocked (no HS, blue) parasites were quantified. Representative data of two biological replicates is shown (n > 20). ****p<0.0001 (Welch’s t-test). (C and D) Dose response curves for Wortmannin (Wort) (C) and LY294002 (LY294) (D) in the PfHsp70-1 knockdown line. Drug sensitivities in the presence of 3 nM (blue circles) and 50 nM (black circles) aTc are shown. Representative data of three–four biological replicates is shown. The bars represent mean ± SEM.
-
Figure 7—source data 1
The DV MFIs in Figure 7.
- https://cdn.elifesciences.org/articles/56773/elife-56773-fig7-data1-v1.xlsx
Figure 7—figure supplement 1
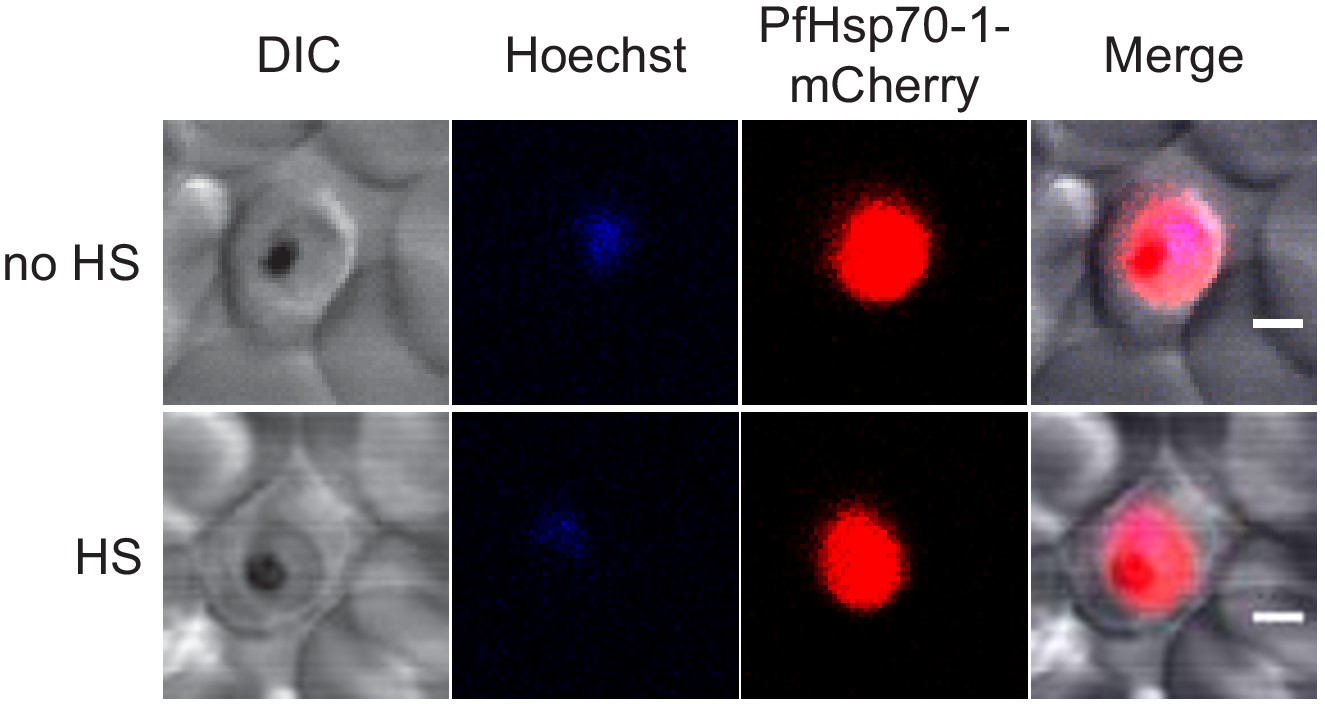
PfHsp70-1 is localized throughout P. falciparum parasites under heat shock and the regular culture conditions.
3D7 parasites expressing PfHsp70-1-mCherry were cultured at 37°C (no HS) or 40°C (HS) for 3 hr, followed by live cell confocal microscopy. Representative images are shown (n > 25). DIC, differential interference contrast. Scale bar, 2 μm.
Figure 7—figure supplement 2

C-terminal LID domain deletion disrupts the PI(3)P-binding capacity of PfHsp70-1.
Wild-type PfHsp70-1 (PfHsp70-1WT) contains a nucleotide-binding domain (NBD), a substrate-binding domain (SBD) and a LID domain (Top panel). Purified His-tagged proteins (≥98% pure) were used to probe nitrocellulose membranes spotted with 500 pmol PI(3)P (six spots). PI(3)P-binding signals were measured in parallel using electrochemiluminescence. Representative data of three independent assays is shown.
Figure 7—figure supplement 3

PfHsp70-1 is essential during P. falciparum intraerythrocytic cycle.
Parasite growth curves for the conditional PfHsp70-1 knockdown strain cultured in 0 nM (yellow circles, no aTc), 3 nM (blue circles) or 50 nM (black circles) aTc. Relative parasite loads (luminescence) were determined at 0, 72 and 120 hr post-treatment. The bars represent mean ± SEM.
Figure 7—figure supplement 4
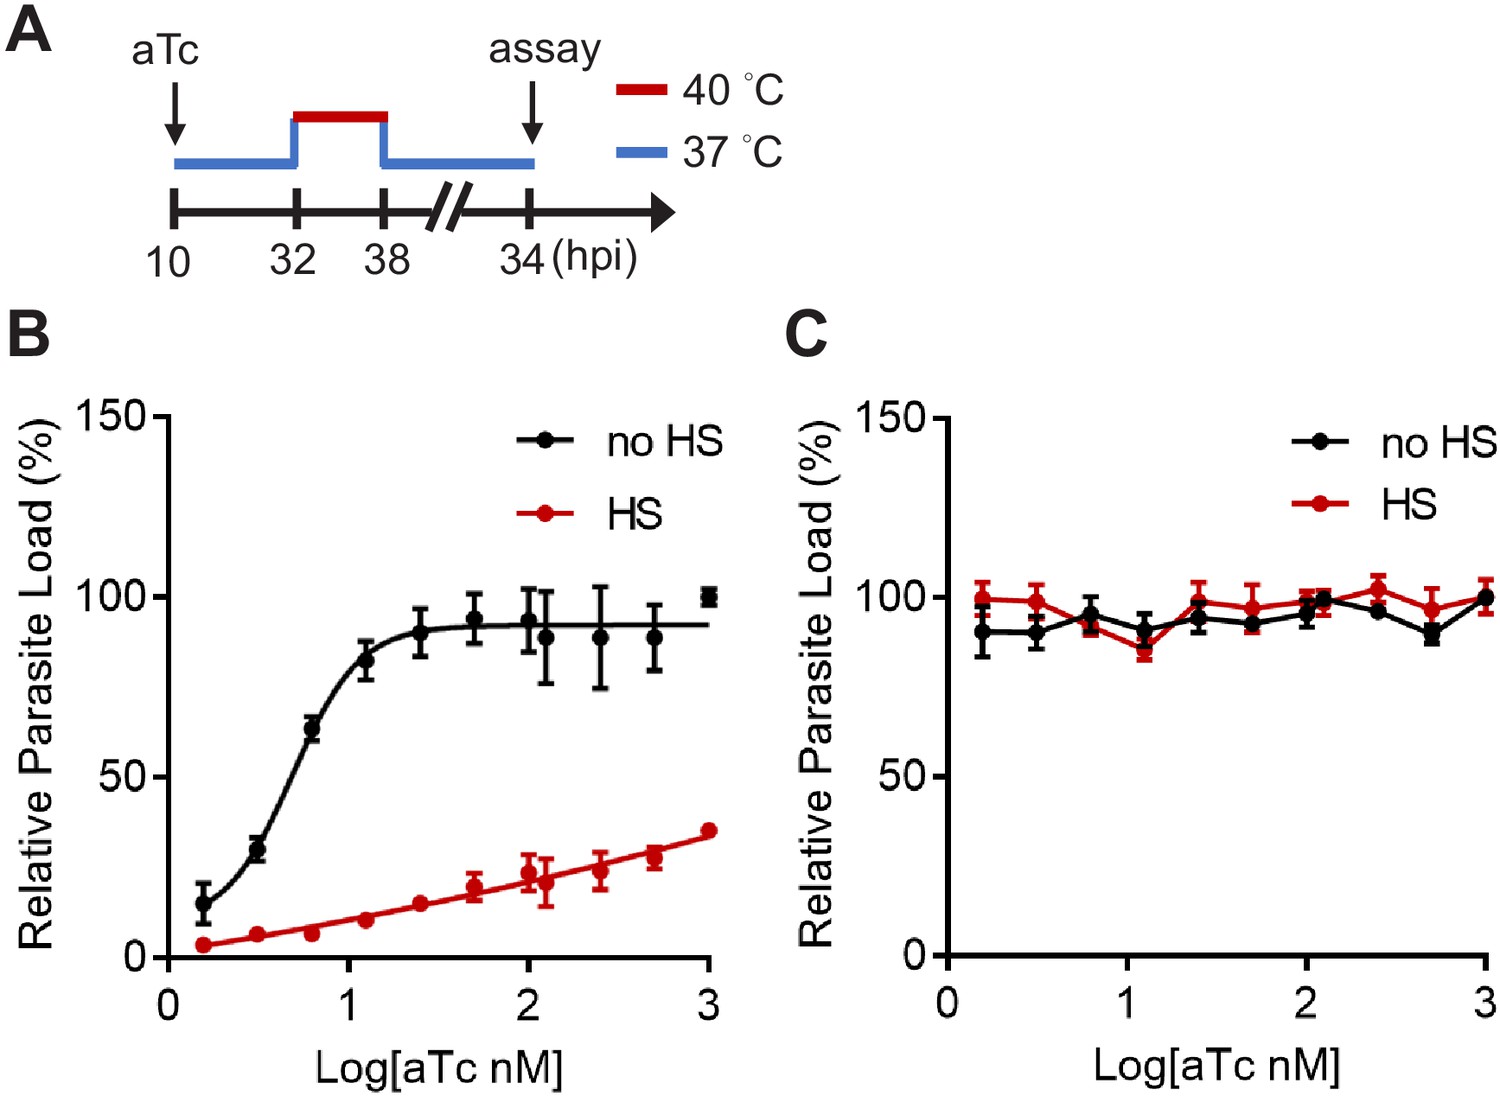
The tunable PfHsp70-1 knockdown strain is sensitive to heat shock.
PfHsp70-1 and a control yellow fluorescent protein (YFP) parasite strains were treated with serial dilutions of anhydrotetracycline (aTc, 0–1 μM) with or without a 6 hr heat shock at 32–38 hpi. (A) Assay schematic showing aTc and heat treatment with parasite measurement at 34 hr after reinvasion for the growth assay. Broken line indicates parasite reinvasion. (B and C) Dose response curves for aTc effect on the PfHsp70-1 (B) and YFP (C) parasite growth with (red circles, HS) or without (black circles, no HS) heat shock. Representative data of two biological replicates is shown. The bars represent mean ± SEM.
Figure 7—figure supplement 5
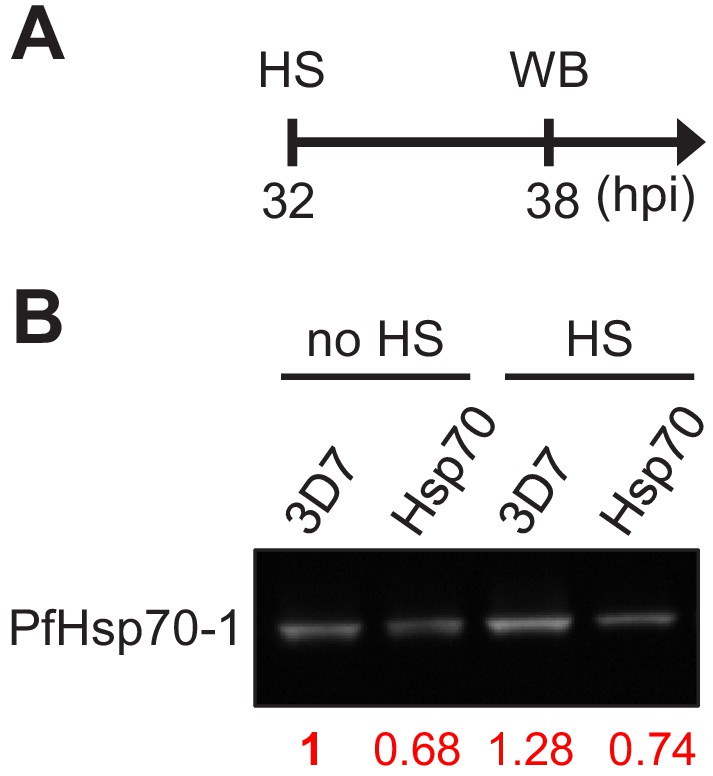
The PfHsp70-1 line has lower PfHsp70-1 expression compared to the wild-type strain 3D7.
(A) Assay schematic showing heat-shock treatment at 32 hpi before cell harvesting for Western blot (WB). (B) PfHsp70-1 protein levels in wild-type and transgenic parasites were determined. The band intensities were normalized to the corresponding Ponceau S signals and compared to non-heat-shocked 3D7 strain (red numbers).
Figure 7—figure supplement 6
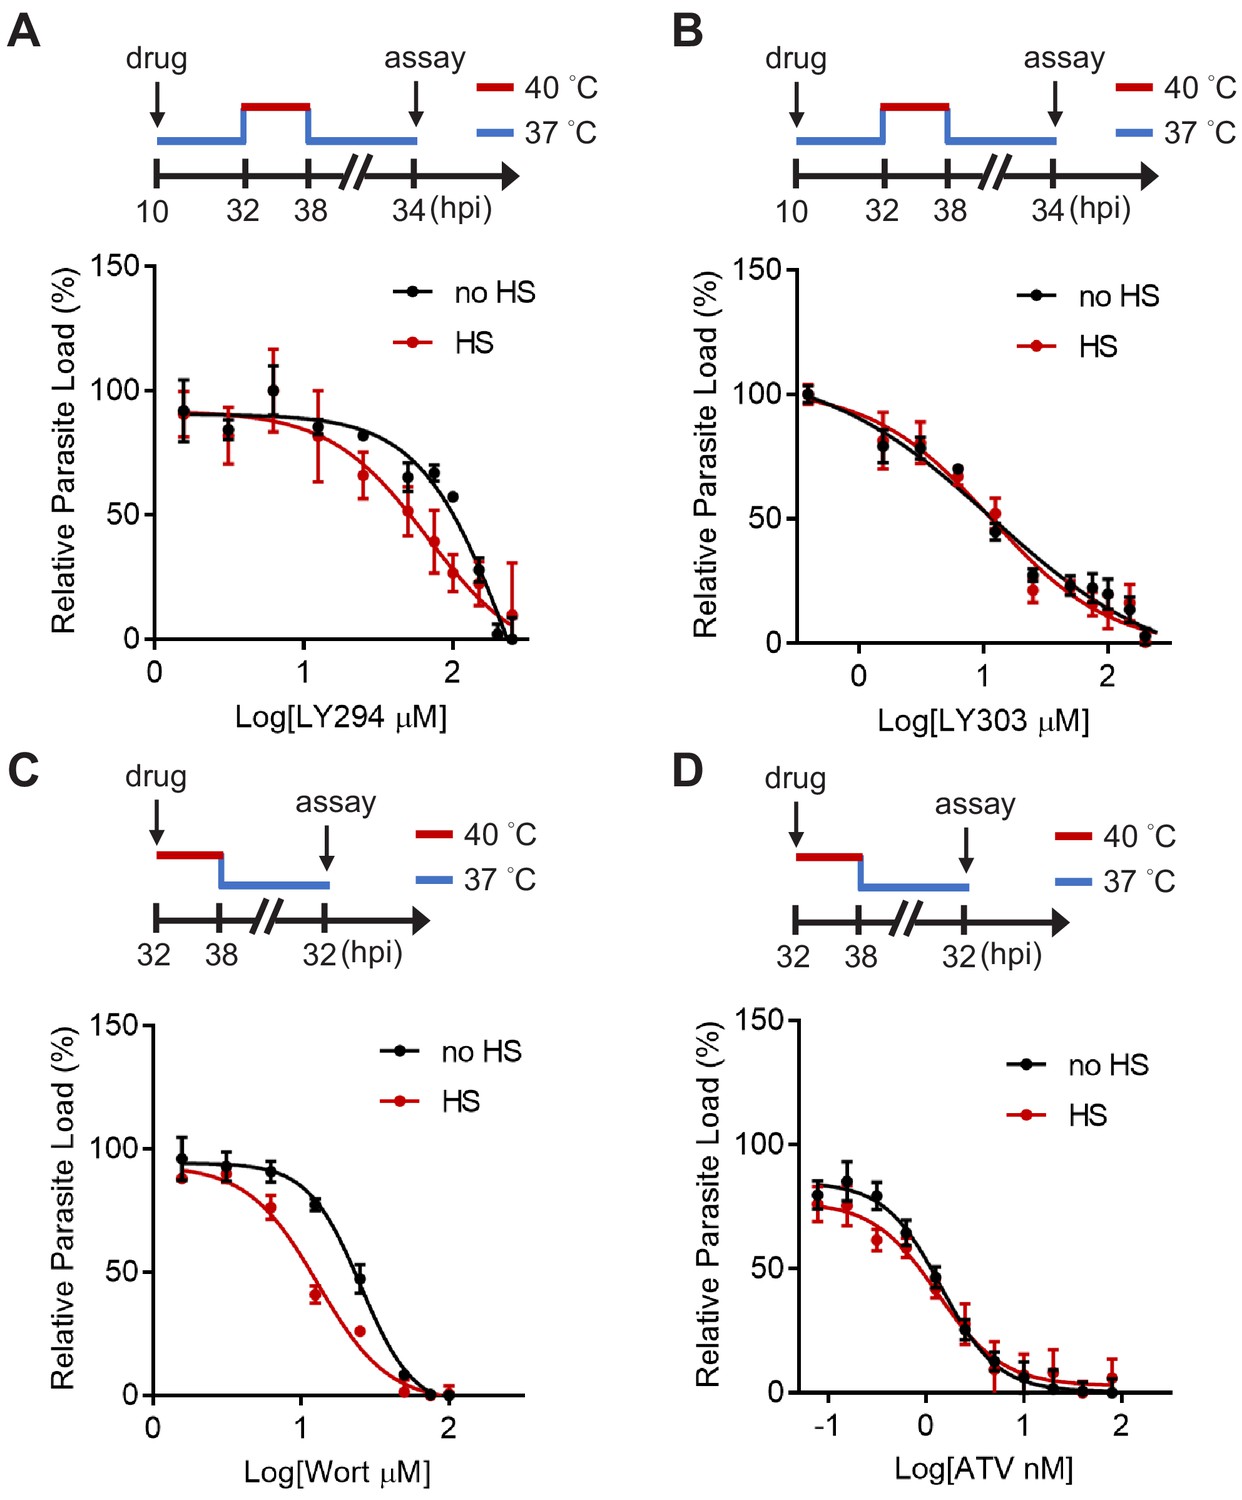
Inhibiting PI(3)P synthesis sensitizes heat-shock-induced cell death in the PfHsp70-1 line.
Dose response curves for LY294002 (A), LY303511 (B), Wortmannin (C) and atovaquone (D) inhibition of the PfHsp70-1 line with (red circles) or without (black circles) heat shock (HS). Assay schematics shown above plots indicate times of compound addition and assay analysis after reinvasion. Parasites received a 6 hr heat shock (32–38 hpi) (red line) and were maintained at 37°C (blue line) before and after heat shock. Representative data of two biological replicates are shown (n = 3).
Figure 7—figure supplement 7

The heat-shock-induced DV destabilization in the PfHsp70-1 knockdown line is not caused by parasite death.
A tunable PfHsp70-1 parasite line was cultured in 50 nM or 500 nM anhydrotetracycline (aTc) for 24 hr before heat shock at 32 hpi. (A) Assay schematic showing aTc treatment at 37°C (blue line), followed by a 6 hr heat shock (red line) and JC-1 stain after treatment. (B) The ratios of JC-1 red fluorescence to JC-1 green fluorescence in heat-shocked (HS, red dots) and non-heat-shocked (no HS, blue dots) parasites were measured. Representative data of two biological replicates is shown (n ≥ 7). ns, not significant (Welch’s t-test). The bars represent mean ± SEM. (C) Representative images from live cell confocal microscopy are shown. DIC, differential interference contrast. Scale bar, 2 μm.
Figure 7—figure supplement 8
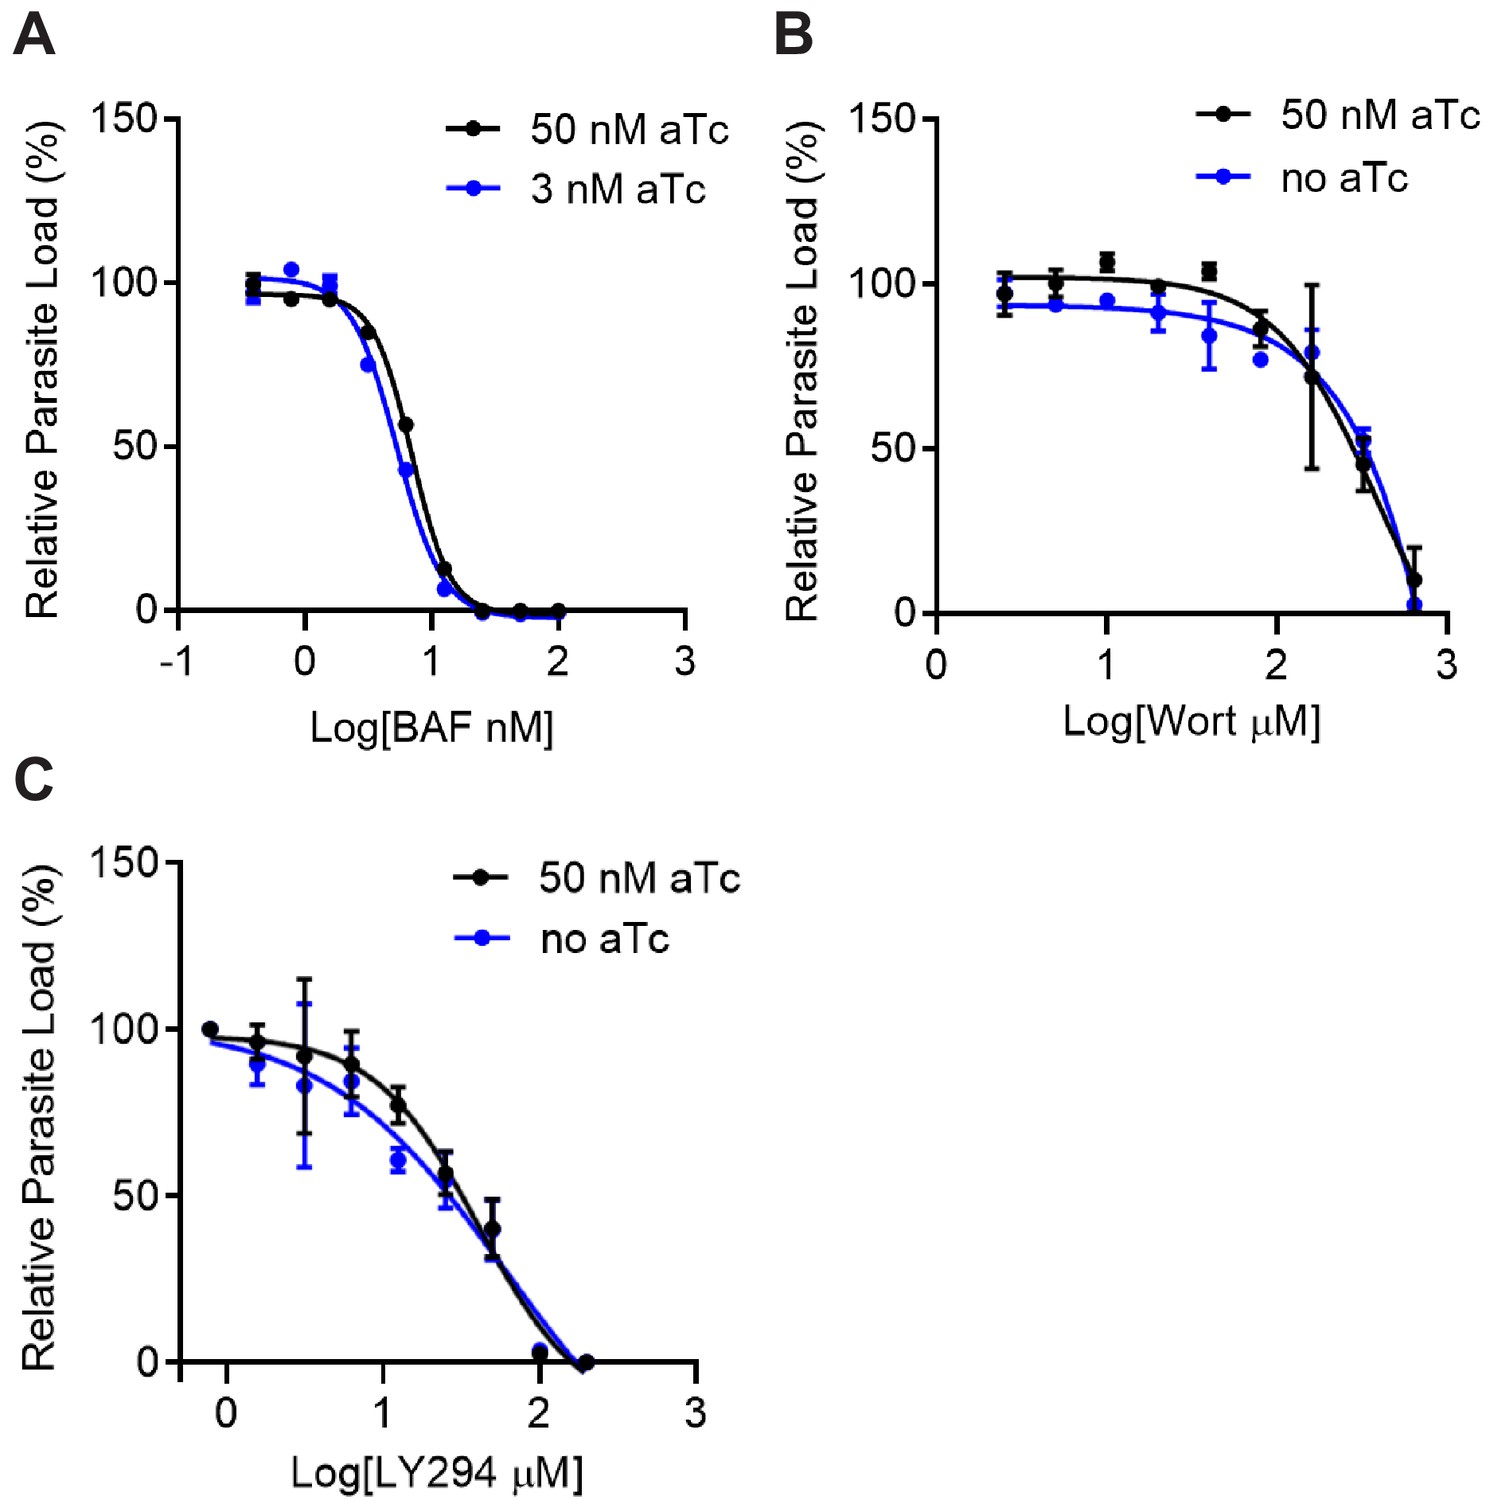
The hypersensitivity to PI3K inhibitors in PfHsp70-1 knockdown parasites is not a general non-specific phenotype.
(A) Dose response curves for Bafilomycin A (BAF) in the conditional PfHsp70-1 knockdown line. Parasites were cultured in 3 nM (lower PfHsp70-1 expression, blue circles) or 50 nM (higher PfHsp70-1 expression, black circles) anhydrotetracycline (aTc). BAF is a Plasmodium inhibitor that is not known to influence PfHsp70-1 or PI(3)P levels. (B and C) Dose response curves for Wortmannin (Wort) (B) and LY294002 (C) in a control yellow fluorescent protein (YFP) line. Parasites were cultured with (50 nM, black circles) or without (no aTc, blue circles) aTc. The bars represent mean ± SEM.
Figure 8 with 2 supplements
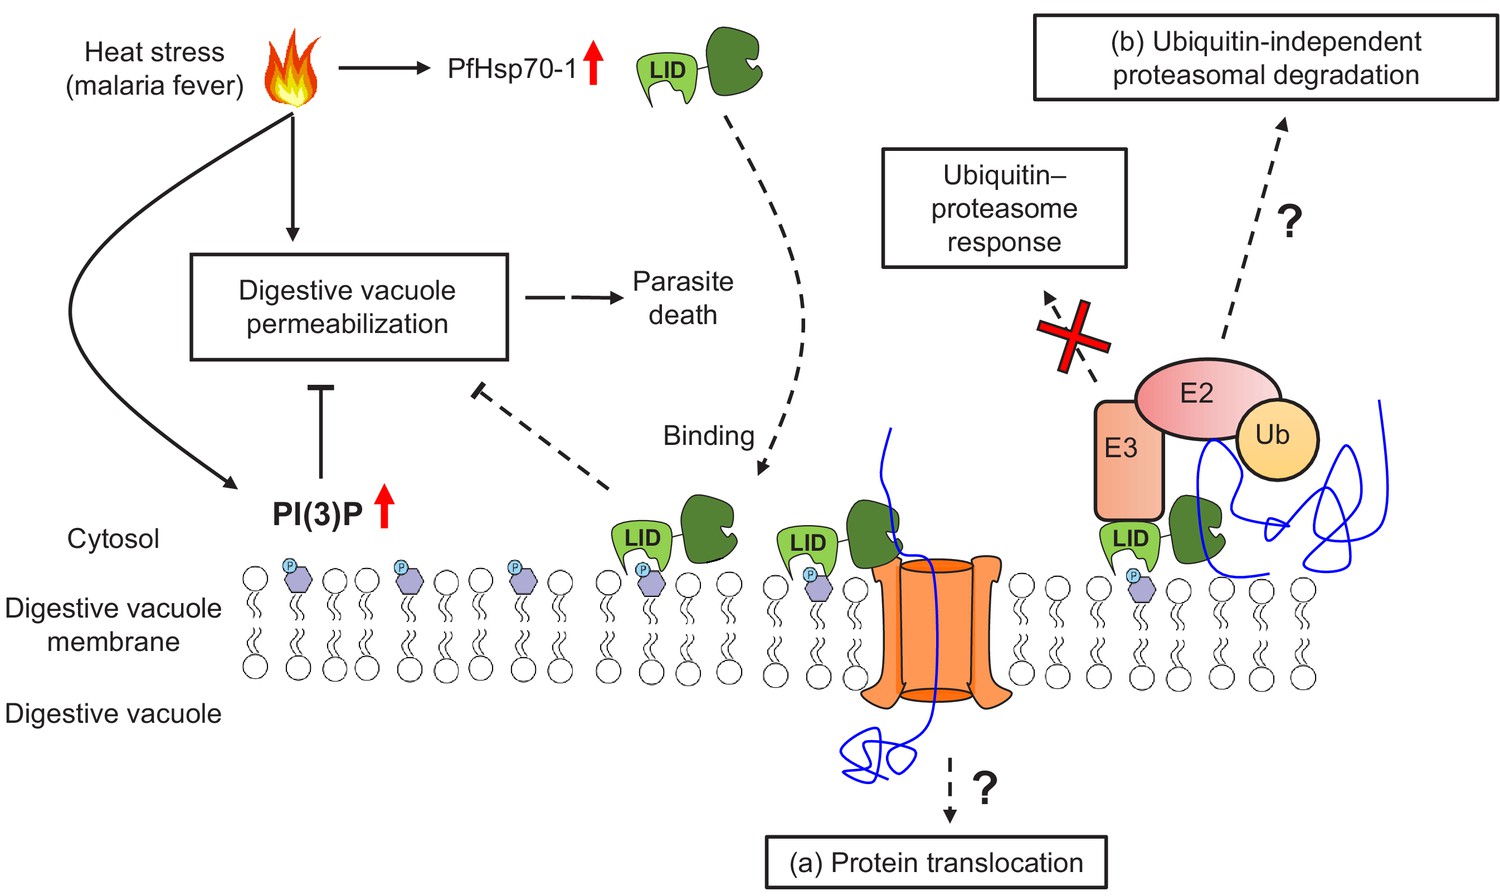
A model for PI(3)P-mediated heat stress response in P. falciparum.
PI(3)P accumulates in P. falciparum during febrile episodes and prevents membrane destabilization of the digestive vacuole (DV), thus increasing parasite fitness under heat stress. PfHsp70-1 may be recruited to the DV via PI(3)P binding and contribute to the cytoprotective function. Possible mechanisms of this lipid–protein interaction may include (a) PfHsp70-1-mediated translocation of DV proteins that maintain the membrane integrity from the inner leaflet of the acidic compartment or (b) proteasomal degradation pathway that removes local proteotoxic stress.
Figure 8—figure supplement 1

Inhibiting PI(3)P production does not alter the overall K48-ubiquitination level in P. falciparum under heat shock.
P. falciparum 3D7 parasites were treated with 20 μM Wortmannin (Wort), 40 μM LY294002 (LY294), 40 μM LY303511 (LY303, negative control) or 0.08% DMSO (vehicle control) at 37°C (no HS) or 40°C (HS) for 6 hr. (A) Assay schematic showing drug and heat shock treatment at 32 hpi before cell harvesting for western blot (WB). (B) K48-linked ubiquitin levels in Plasmodium protein lysates were measured. The overall K48 ubiquitin signals of each lane were normalized to the corresponding Ponceau S signals and compared to non-heat-shocked DMSO control (red numbers).
Figure 8—figure supplement 2

Targeting 26S proteasome may sensitize the heat shock-induced DV destabilization.
Parasites were loaded with LysoTracker Red and treated with 100 μM bortezomib (BOR) at 37°C (no HS) or 40°C (HS) for 6 hr. (A) Assay schematic with drug and heat treatment at 32 hpi, followed by microscopy at 38 hpi. (B) Mean fluorescence intensities of DVs (DV MFIs) in heat-shocked (red) and non-heat-shocked (blue) parasites were quantified. Representative data of three biological replicates is shown (n > 20). ****p<0.0001 (Welch’s t-test). The bars represent mean ± SEM. (C) Representative confocal images are shown. LTR, LysoTracker Red; DIC, differential interference contrast. Scale bar, 2 μm.
Tables
Table 1
Identified P. falciparum proteins that interacted with PI(3)P.
| Protein name | UniProt accession | Peptide matches | %Coverage* | Apicoplast† | Secretory‡ | Digestive vacuole§ |
|---|---|---|---|---|---|---|
| PfRan | W7JA41 | 6 | 33.2 | - | - | + |
| PfRps4 | W7J × 33 | 4 | 20.5 | - | - | - |
| PfRps19 | W7JZJ7 | 3 | 18.2 | - | - | - |
| PfRps18 | W7JTH8 | 3 | 23.7 | - | + | - |
| PfAlba1 | W7JW62 | 3 | 10.5 | - | - | + |
| PfRps9 | W7K9C7 | 2 | 12.2 | ++ | - | - |
| PF14_0141 | W7JMY4 | 1 | 16 | - | - | - |
| PfHsp70-1 | W7K6C4 | 1 | 1.6 | - | - | + |
| PfRpl3 | W7K5U2 | 1 | 2.3 | - | + | - |
| PFF0885w | W7K862 | 1 | 9.5 | ++ | - | - |
| PF07_0088 | W7K740 | 1 | 5.1 | ++ | - | - |
| MAL7P1.201 | W7KIX5 | 1 | 0.7 | 0 | - | - |
-
*The coverage of proteins by identified peptides.
†Prediction by the PlasmoAP algorithm based on apicoplast-targeting peptides (++ very likely, 0 uncertain, - unlikely).
-
‡Prediction by PSEApred based on the amino acid composition (+ secretory, - non-secretory).
§Reported P. falciparum proteins associated with the digestive vacuole (+ found, - not found).
Additional files
-
Supplementary file 1
Primers for gene cloning.
- https://cdn.elifesciences.org/articles/56773/elife-56773-supp1-v1.docx
-
Supplementary file 2
Reported EC50 values of small molecule inhibitors used in this study.
- https://cdn.elifesciences.org/articles/56773/elife-56773-supp2-v1.docx
-
Transparent reporting form
- https://cdn.elifesciences.org/articles/56773/elife-56773-transrepform-v1.docx
Download links
A two-part list of links to download the article, or parts of the article, in various formats.
Downloads (link to download the article as PDF)
Open citations (links to open the citations from this article in various online reference manager services)
Cite this article (links to download the citations from this article in formats compatible with various reference manager tools)
Phosphatidylinositol 3-phosphate and Hsp70 protect Plasmodium falciparum from heat-induced cell death
eLife 9:e56773.
https://doi.org/10.7554/eLife.56773


