Inhibition of striatonigral autophagy as a link between cannabinoid intoxication and impairment of motor coordination
- Centro de Investigación Biomédica en Red sobre Enfermedades Neurodegenerativas (CIBERNED), Instituto Universitario de Investigación Neuroquímica (IUIN) and Department of Biochemistry and Molecular Biology, Complutense University, Spain
- Instituto Ramón y Cajal de Investigación Sanitaria (IRYCIS), Spain
- Centre National de la Recherche Scientifique (CNRS) and University of Bordeaux, Institut des Maladies Neurodégénératives, France
- Institut National de la Santé et de la Recherche Médicale (INSERM) and University of Bordeaux, NeuroCentre Magendie, Physiopathologie de la Plasticité Neuronale, France
Figures
Figure 1
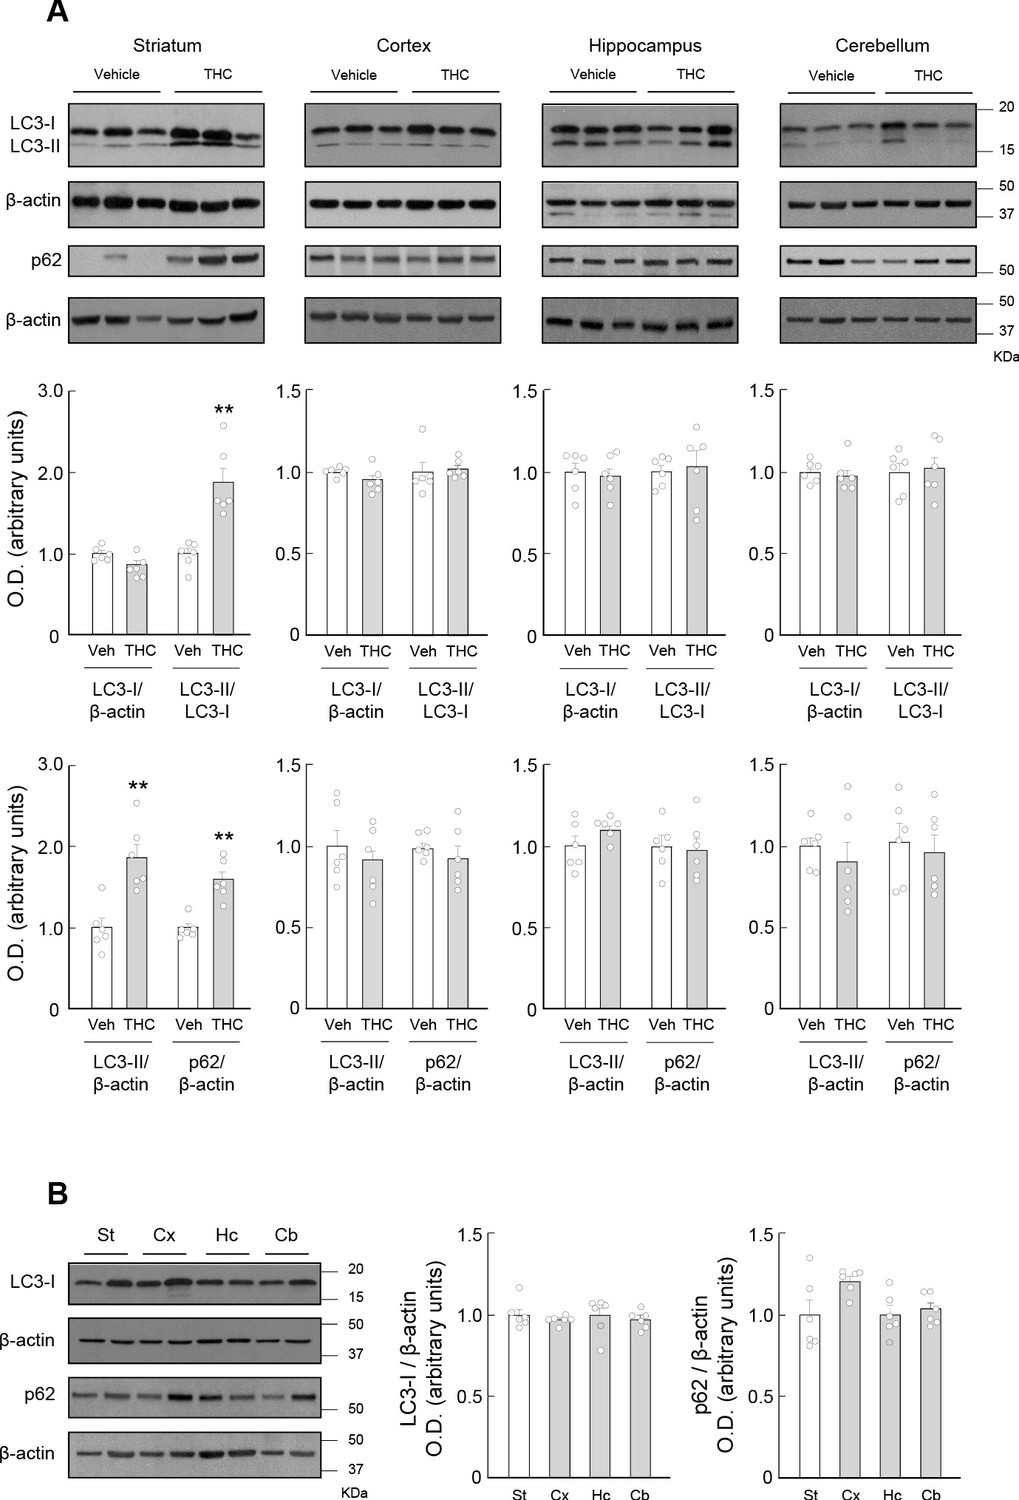
THC impairs autophagy in the mouse striatum.
Wild-type C57BL/6N mice were treated with THC (10 mg/kg as a single i.p. injection) or its vehicle. Four hours later, the striatum (St), cortex (Cx), hippocampus (Hc) and cerebellum (Cb) were dissected for Western blot analysis. (A) Effect of THC on autophagy markers in the different brain regions. (B) Relative levels of LC3-I and p62 in the different brain regions from vehicle-treated animals. In both panels, representative blots of each condition, together with optical density values relative to those of the respective loading controls, are shown (n = 6 animals per group). Blots were cropped for clarity. Electrophoretic migration of molecular weight markers is depicted on the right-hand side of each blot. **p<0.01 from vehicle-treated group by unpaired Student t-test. Raw numerical data and further statistical details are shown in Figure 1—source data 1.
-
Figure 1—source data 1
Source data for THC impairs autophagy in the mouse striatum.
- https://cdn.elifesciences.org/articles/56811/elife-56811-fig1-data1-v1.xlsx
Figure 2
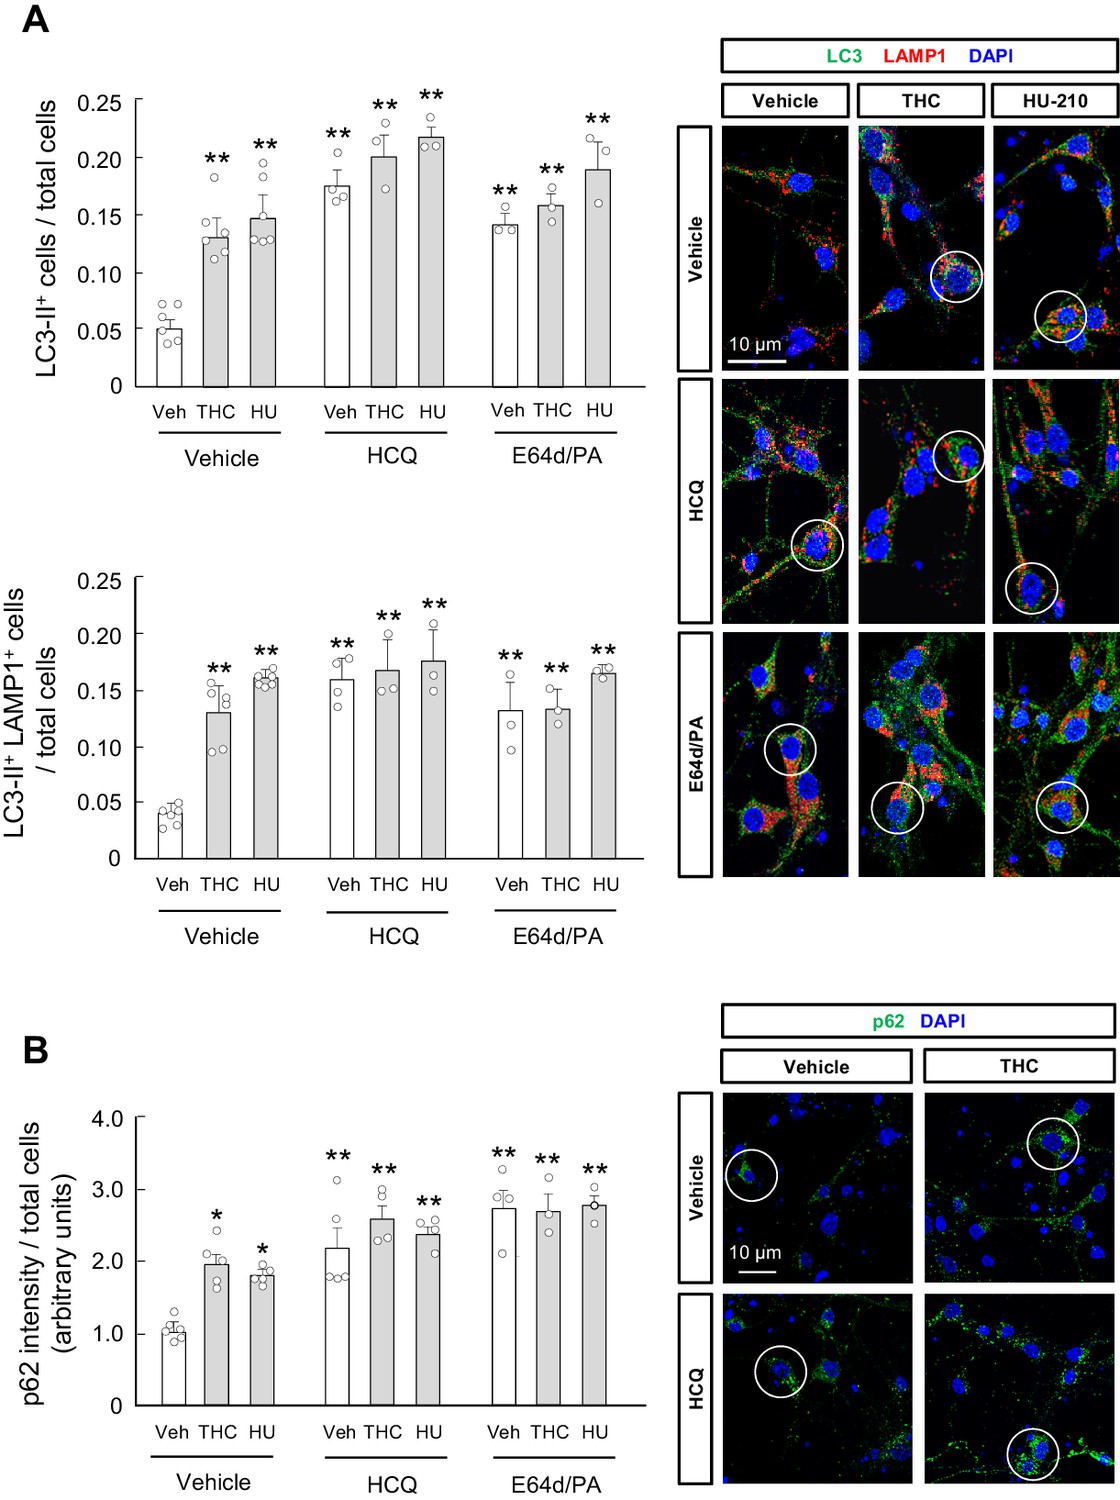
THC impairs autophagy in primary striatal neurons.
Primary striatal neurons from C57BL/6N mice were exposed for 24 hr to THC (0.75 µM) or HU-210 (10 nM), alone or in combination with hydroxychloroquine (0.1 mM), E64d (0.1 µM) and/or pepstatin A (10 ng/ml), or their vehicles. (A) LC3-II immunoreactivity (number of cells with three or more LC3-positive dots relative to total cells; upper panel) and LC3-II/LAMP1 immunoreactivity (number of LAMP1-positive cells with three or more LC3 dots relative to total cells; lower panel). Representative images with encircled examples of double-positive cells are shown (n = 3–6 independent cell preparations per condition). (B) p62 immunoreactivity (p62 fluorescence intensity relative to total cells). Representative images of selected experimental conditions with encircled examples of high-intensity cells are shown (n = 3–6 independent cell preparations per condition). *p<0.05, **p<0.01 from vehicle-treated group by two-way ANOVA with Tukey’s multiple comparisons test. Raw numerical data and further statistical details are shown in Figure 2—source data 1.
-
Figure 2—source data 1
Source data for THC impairs autophagy in primary striatal neurons.
- https://cdn.elifesciences.org/articles/56811/elife-56811-fig2-data1-v1.xlsx
Figure 3 with 1 supplement
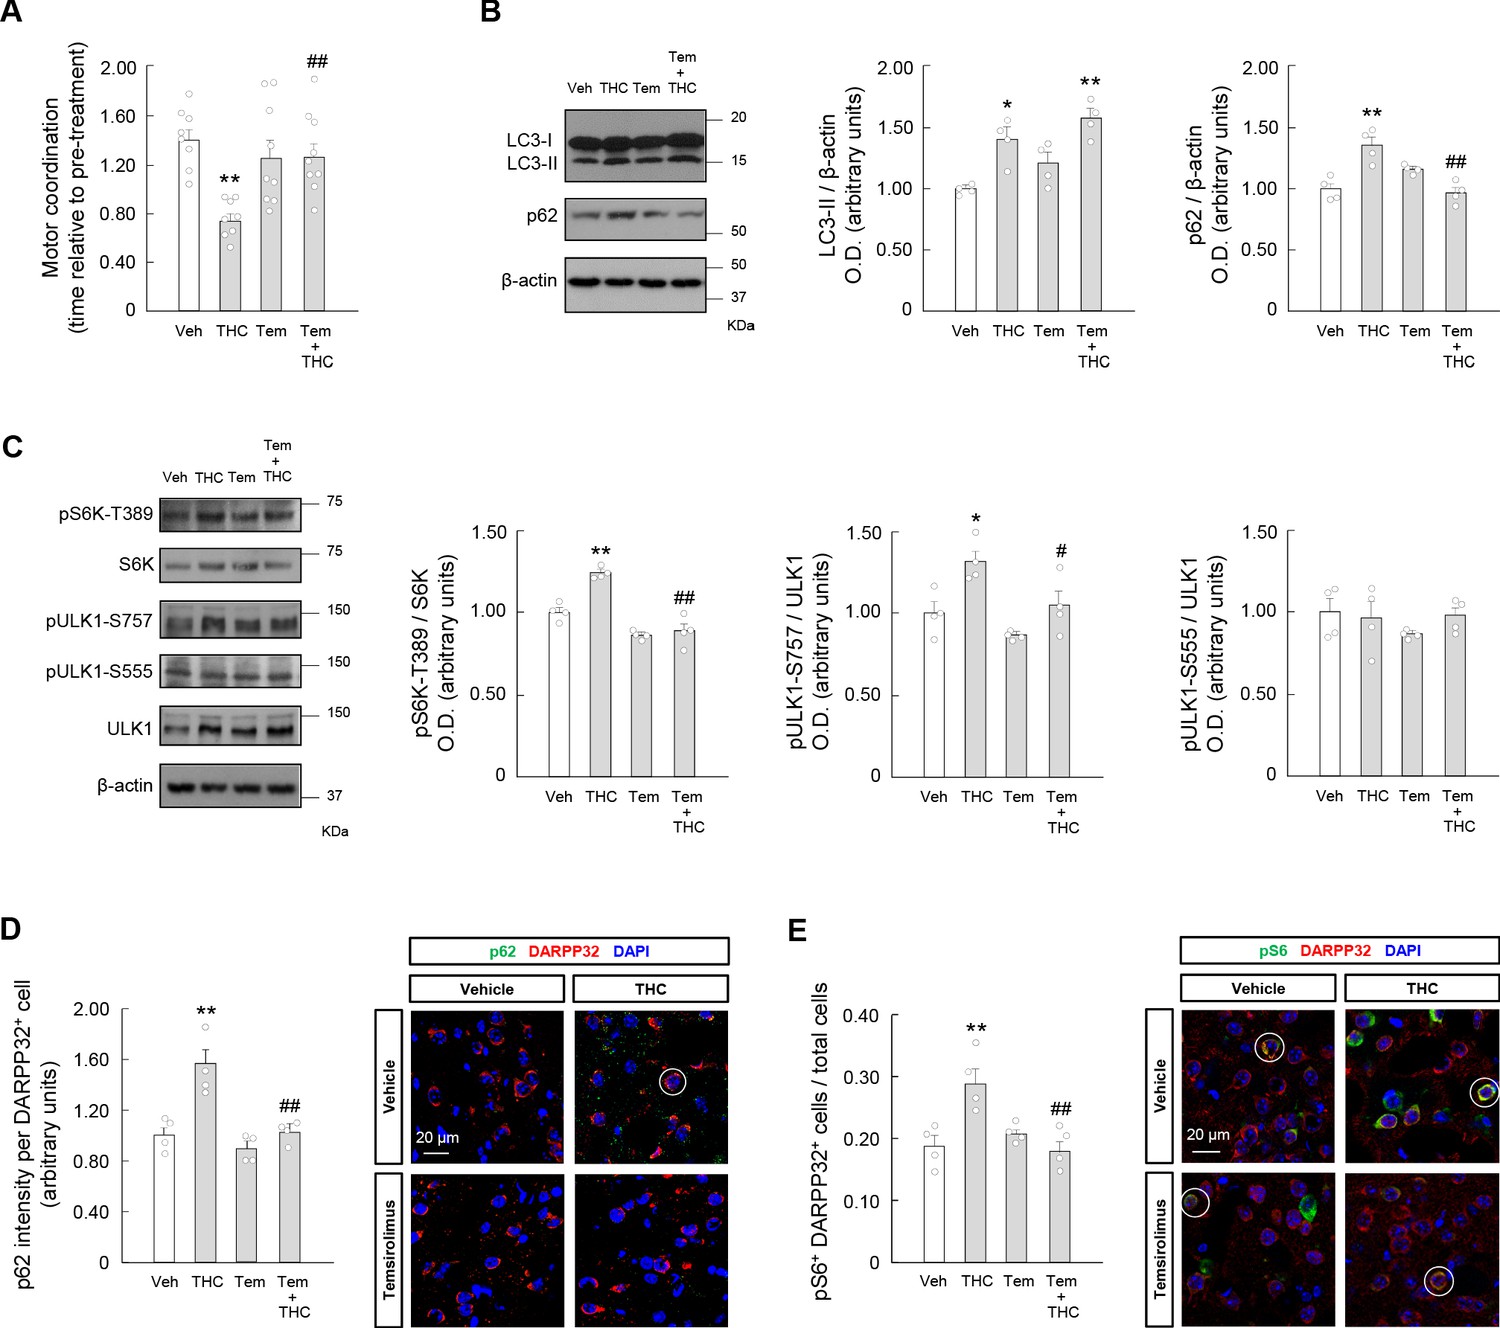
Temsirolimus prevents the THC-induced impairment of striatal autophagy and motor coordination in vivo.
Wild- type C57BL/6N mice were treated with temsirolimus (1 mg/kg as a single i.p. injection) or its vehicle for 20 min, and, subsequently, with THC (10 mg/kg as a single i.p. injection) or its vehicle for 4 hr. (A) Motor coordination (RotaRod test, time to fall relative to pre-treatment; n = 8–9 animals per group). (B, C) Western blot analysis of autophagy markers (panel B) and mTORC1 signaling pathway markers (panel C) in the striatum. Representative blots of each condition, together with optical density values relative to those of loading controls, are shown (n = 4 animals per group). Blots were cropped for clarity. Electrophoretic migration of molecular weight markers is depicted on the right-hand side of each blot. (D, E) Immunofluorescence analysis of p62 (p62 fluorescence intensity per DARPP32-positive cell; panel D) and phosphorylated ribosomal protein S6 (phospho-S6/DARPP32 double-positive cells relative to total cells; panel E) in the dorsal striatum (n = 4 animals per group). Representative images with encircled examples of a high-intensity cell (panel D) or double-positive cells (panel E) are shown. *p<0.05, **p<0.01 from vehicle-treated group, or #p<0.05, ##p<0.01 from THC-treated group, by one-way ANOVA with Tukey’s multiple comparisons test. Raw numerical data and further statistical details are shown in Figure 3—source data 1.
-
Figure 3—source data 1
Source data for Temsirolimus prevents the THC-induced impairment of striatal autophagy and motor coordination in vivo.
- https://cdn.elifesciences.org/articles/56811/elife-56811-fig3-data1-v1.xlsx
Figure 3—figure supplement 1
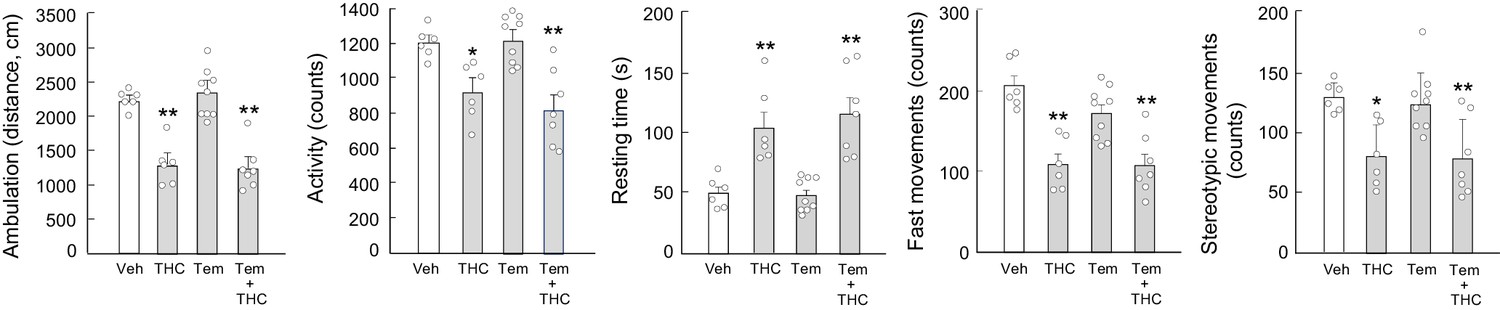
Temsirolimus does not rescue THC-induced hypolocomotion.
Wild-type C57BL/6N mice (n = 6–9 animals per group) were treated with temsirolimus (1 mg/kg as a single i.p. injection) or its vehicle for 20 min, and, subsequently, with THC (10 mg/kg as a single i.p. injection) or its vehicle for 4 hr. Animals were then subjected to the open field test for 10 min. Total distance travelled (cm), overall activity (counts), resting time (s), fast movements (counts) and stereotypic movements (counts) were determined. *p<0.05, **p<0.01 from vehicle-treated group by one-way ANOVA with Tukey’s multiple comparisons test. Raw numerical data and further statistical details are shown in Figure 3—source data 1.
Figure 4 with 1 supplement
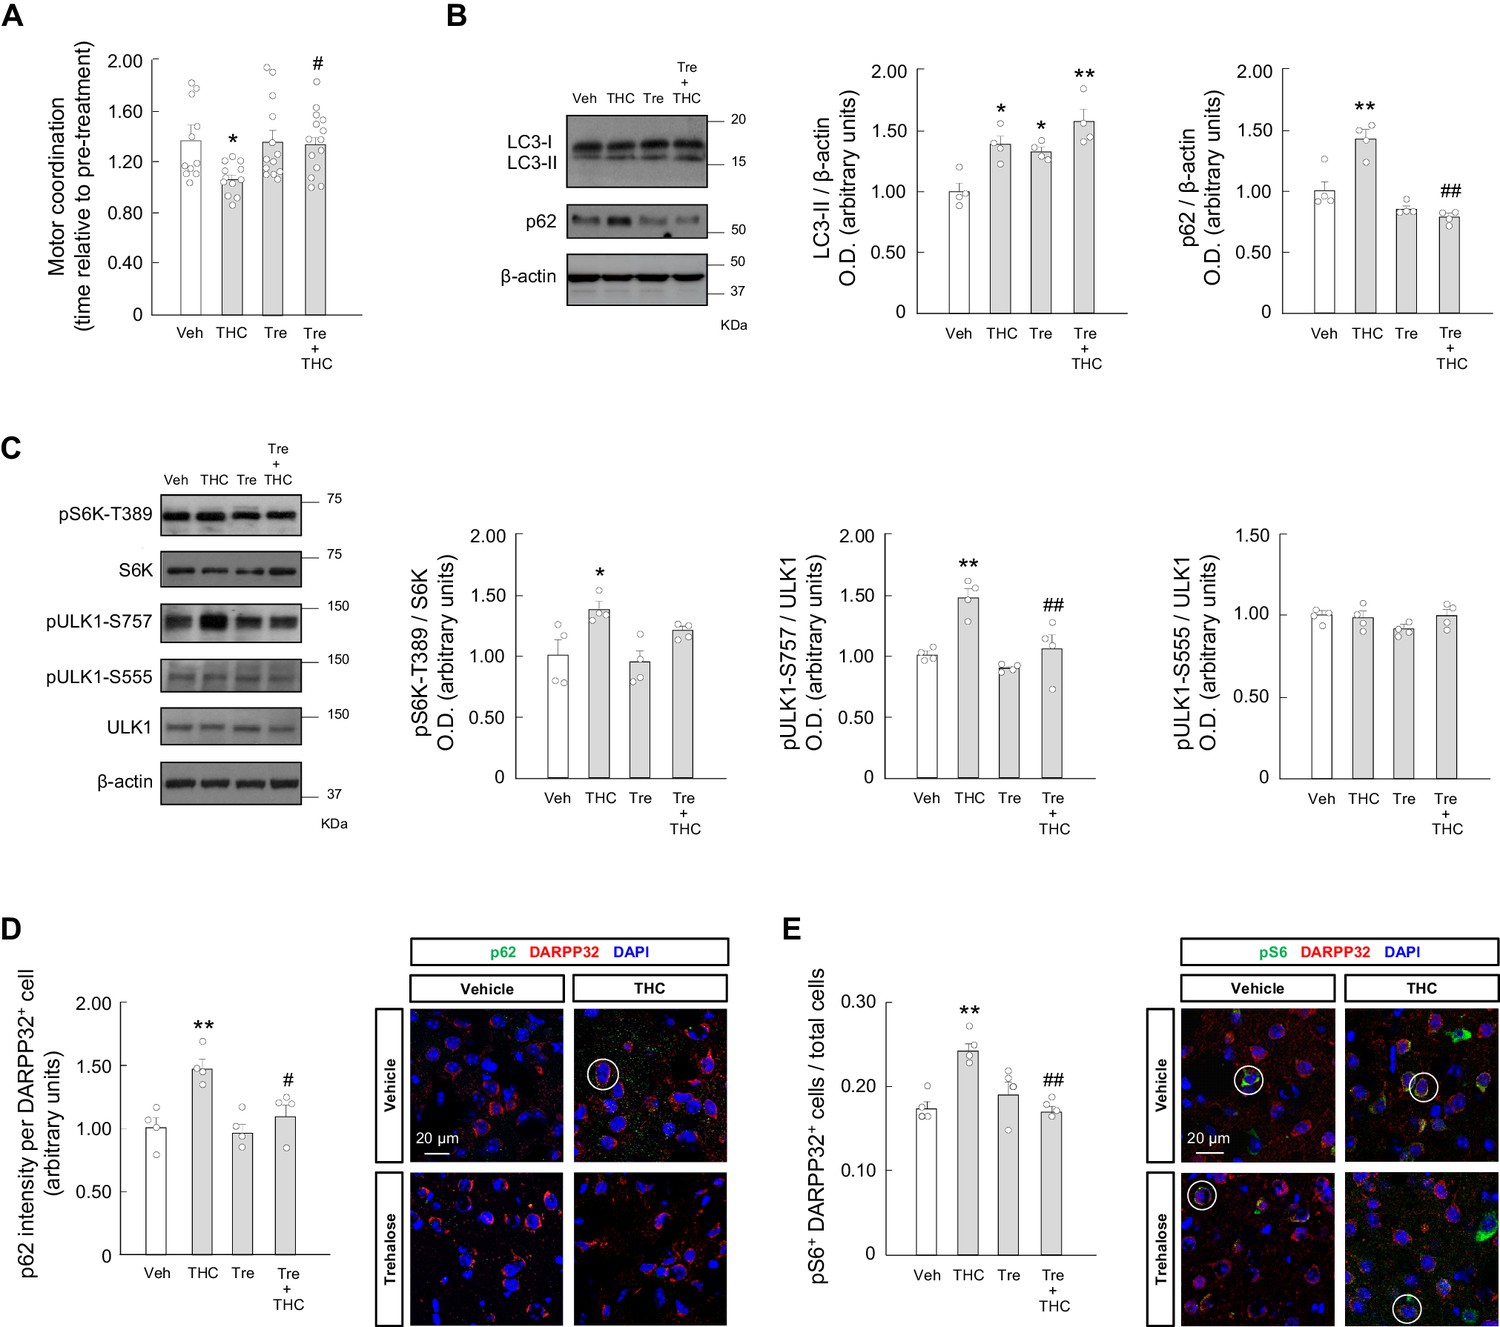
Trehalose prevents the THC-induced impairment of striatal autophagy and motor coordination in vivo.
Wild-type C57BL/6N mice were given trehalose (10 g/L) or plain water ad libitum for 24 hr, and, subsequently, were treated with THC (10 mg/kg as a single i.p.injection) or its vehicle for 4 hr. (A) Motor coordination (RotaRod test, time to fall relative to pre-treatment; n = 11–14 animals per group). (B, C) Western blot analysis of autophagy markers (panel B) and mTORC1 signaling pathway markers (panel C) in the striatum. Representative blots of each condition, together with optical density values relative to those of loading controls, are shown (n = 4 animals per group). (D, E) Immunofluorescence analysis of p62 (p62 fluorescence intensity per DARPP32-positive cell; panel D) and phosphorylated ribosomal protein S6 (phospho-S6/DARPP32 double-positive cells relative to total cells; panel E) in the dorsal striatum (n = 4 animals per group). Representative images with encircled examples of a high-intensity cell (panel D) or double-positive cells (panel E) are shown. *p<0.05, **p<0.01 from vehicle-treated group, or #p<0.05, ##p<0.01 from THC-treated group, by one-way ANOVA with Tukey’s multiple comparisons test. Raw numerical data and further statistical details are shown in Figure 4—source data 1.
-
Figure 4—source data 1
Source data for Trehalose prevents the THC-induced impairment of striatal autophagy and motor coordination in vivo.
- https://cdn.elifesciences.org/articles/56811/elife-56811-fig4-data1-v1.xlsx
Figure 4—figure supplement 1
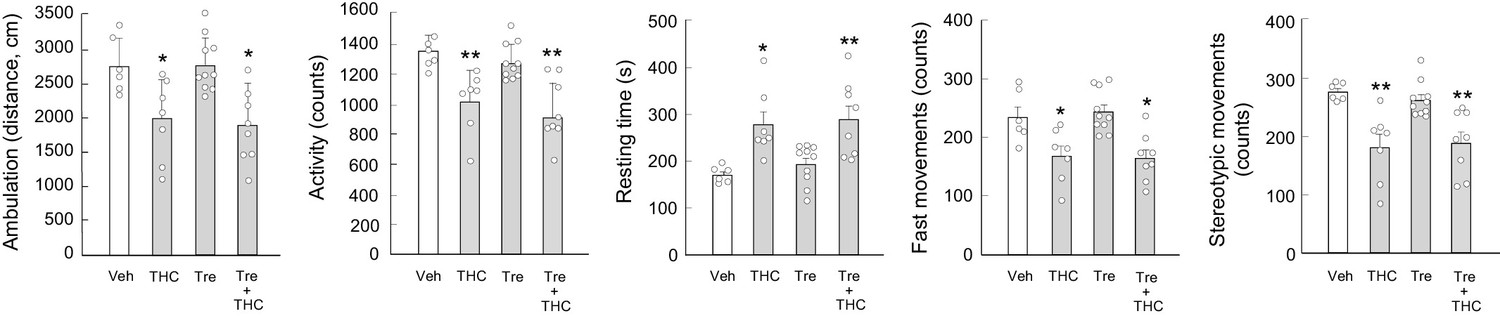
Trehalose does not rescue THC-induced hypolocomotion.
Wild-type C57BL/6N mice (n = 6–10 animals per group) were given trehalose (10 g/L in drinking water) or plain water ad libitum for 24 hr, and, subsequently, with THC (10 mg/kg as a single i.p. injection) or its vehicle for 4 hr. Animals were then subjected to the open field test for 10 min. Total distance travelled (cm), overall activity (counts), resting time (s), fast movements (counts) and stereotypic movements (counts) were determined. *p<0.05, **p<0.01 from vehicle-treated group by one-way ANOVA with Tukey’s multiple comparisons test. Raw numerical data and further statistical details are shown in Figure 4—source data 1.
Figure 5 with 1 supplement
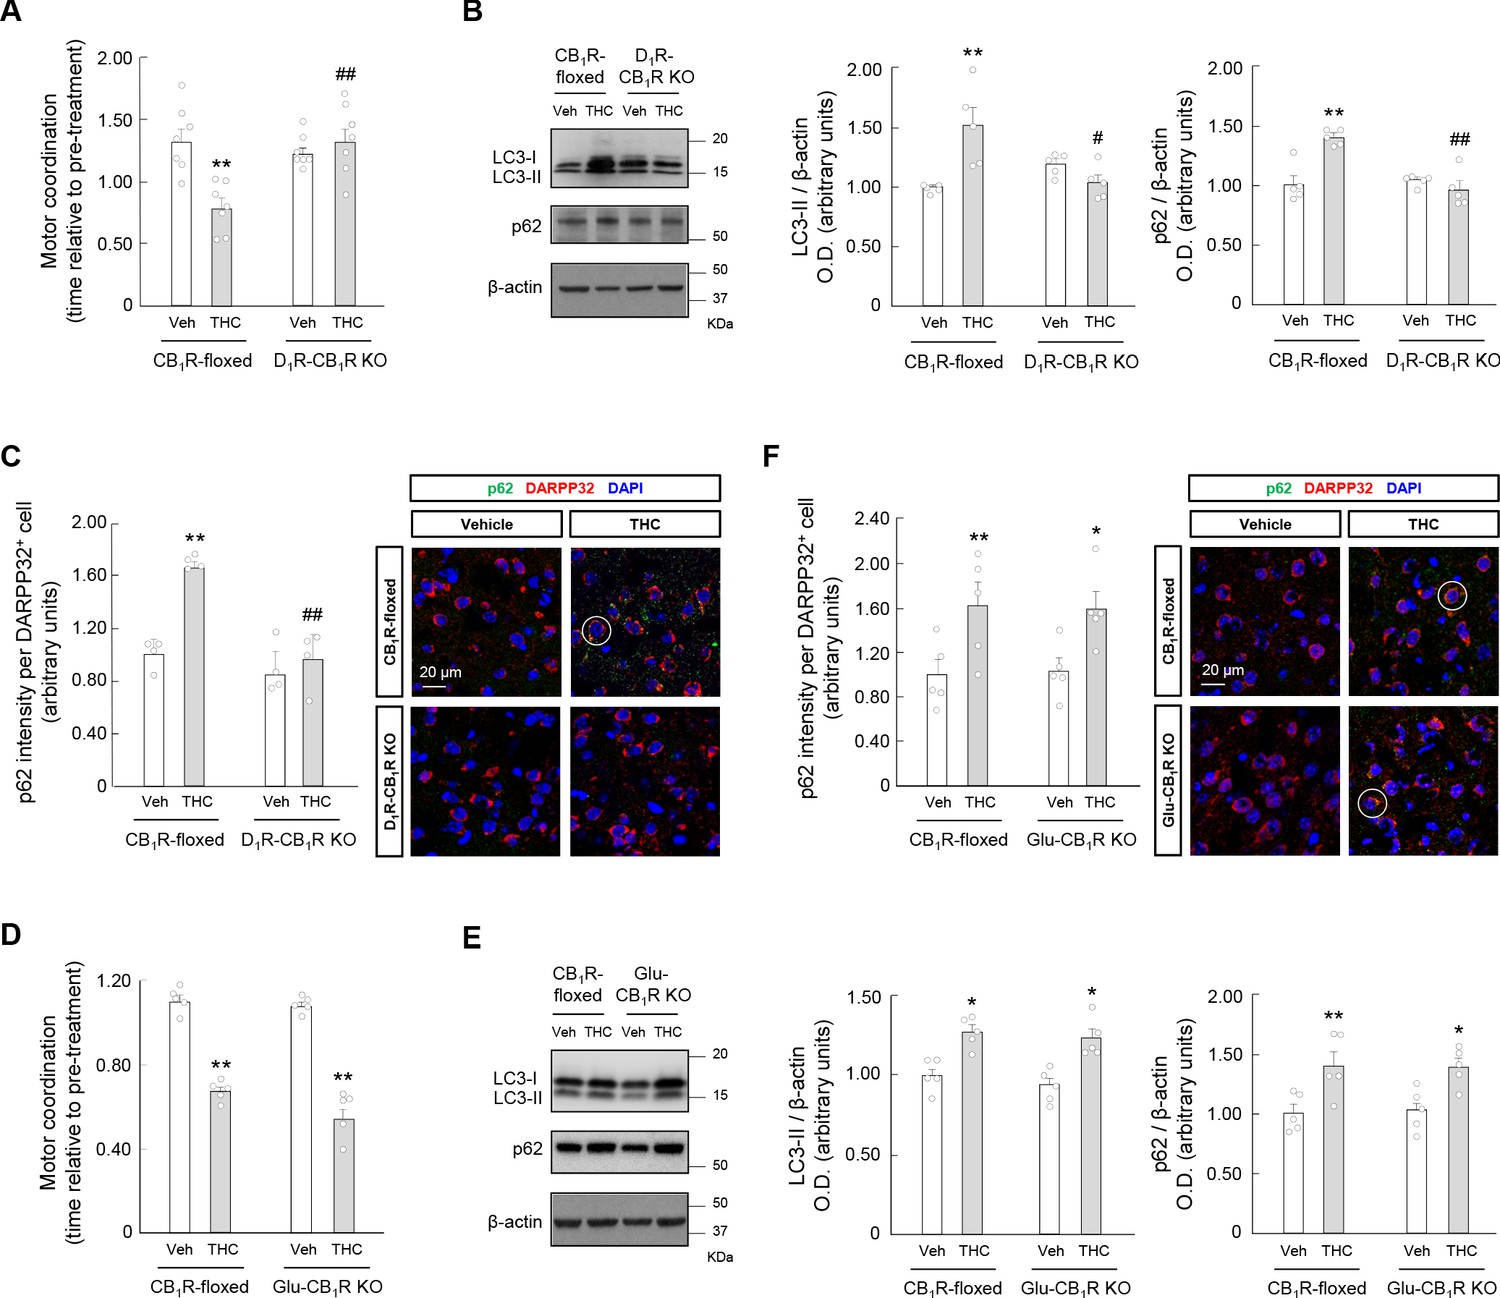
Cannabinoid CB1 receptors located on D1R-MSNs, but not on glutamatergic neurons, are required for the THC-induced impairment of striatal autophagy and motor coordination in vivo.
(A–C) D1R-CB1R KO mice and CB1R-floxed control littermates were treated with THC (10 mg/kg as a single i.p.injection) or its vehicle for 4 hr. Panel A, Motor coordination (RotaRod test, time to fall relative to pre-treatment; n = 7 animals per group). Panel B, Western blot analysis of autophagy markers in the striatum. Representative blots of each condition, together with optical density values relative to those of loading controls, are shown (n = 5 animals per group). Blots were cropped for clarity. Electrophoretic migration of molecular weight markers is depicted on the right-hand side of each blot. Panel C, Immunofluorescence analysis of p62 (p62 fluorescence intensity per DARPP32-positive cell) in the dorsal striatum (n = 4 animals per group). Representative images with an encircled example of high-intensity cell are shown. (D–F) Glu-CB1R KO mice and CB1R-floxed control littermates were treated with THC (10 mg/kg as a single i.p. injection) or its vehicle for 4 hr. Panel D, Motor coordination (RotaRod test, time to fall relative to pre-treatment; n = 5 animals per group). Panel E, Western blot analysis of autophagy markers in the striatum. Representative blots of each condition, together with optical density values relative to those of loading controls, are shown (n = 5 animals per group). Blots were cropped for clarity. Electrophoretic migration of molecular weight markers is depicted on the right-hand side of each blot. Panel F, Immunofluorescence analysis of p62 (p62 fluorescence intensity per DARPP32-positive cell) in the dorsal striatum (n = 4 animals per group). Representative images with an encircled example of high-intensity cell are shown. *p<0.05, **p<0.01 from the corresponding vehicle-treated group, or #p<0.05, ##p<0.01 from the corresponding THC-treated CB1R-floxed group, by two-way ANOVA with Tukey’s multiple comparisons test. Raw numerical data and further statistical details are shown in Figure 5—source data 1.
-
Figure 5—source data 1
Source data for Cannabinoid CB1 receptors located on D1R-MSNs, but not on glutamatergic neurons, are required for the THC-induced impairment of striatal autophagy and motor coordination in vivo.
- https://cdn.elifesciences.org/articles/56811/elife-56811-fig5-data1-v1.xlsx
Figure 5—figure supplement 1
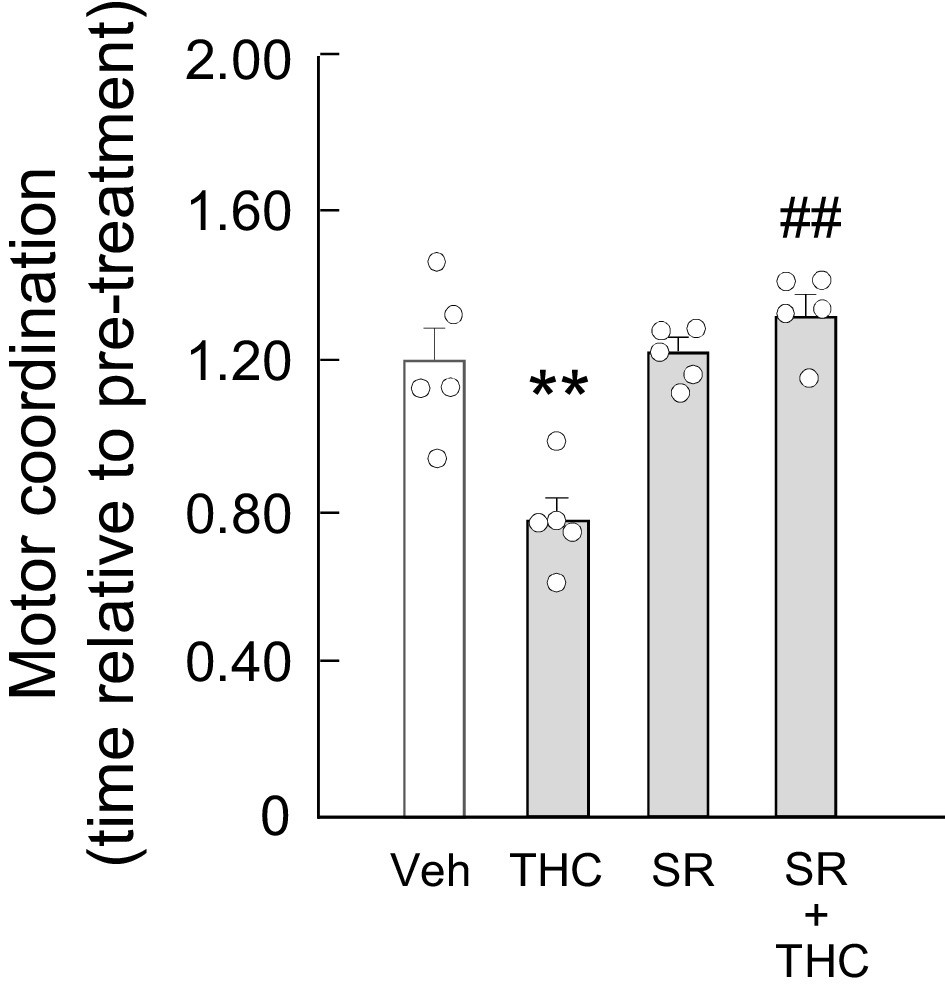
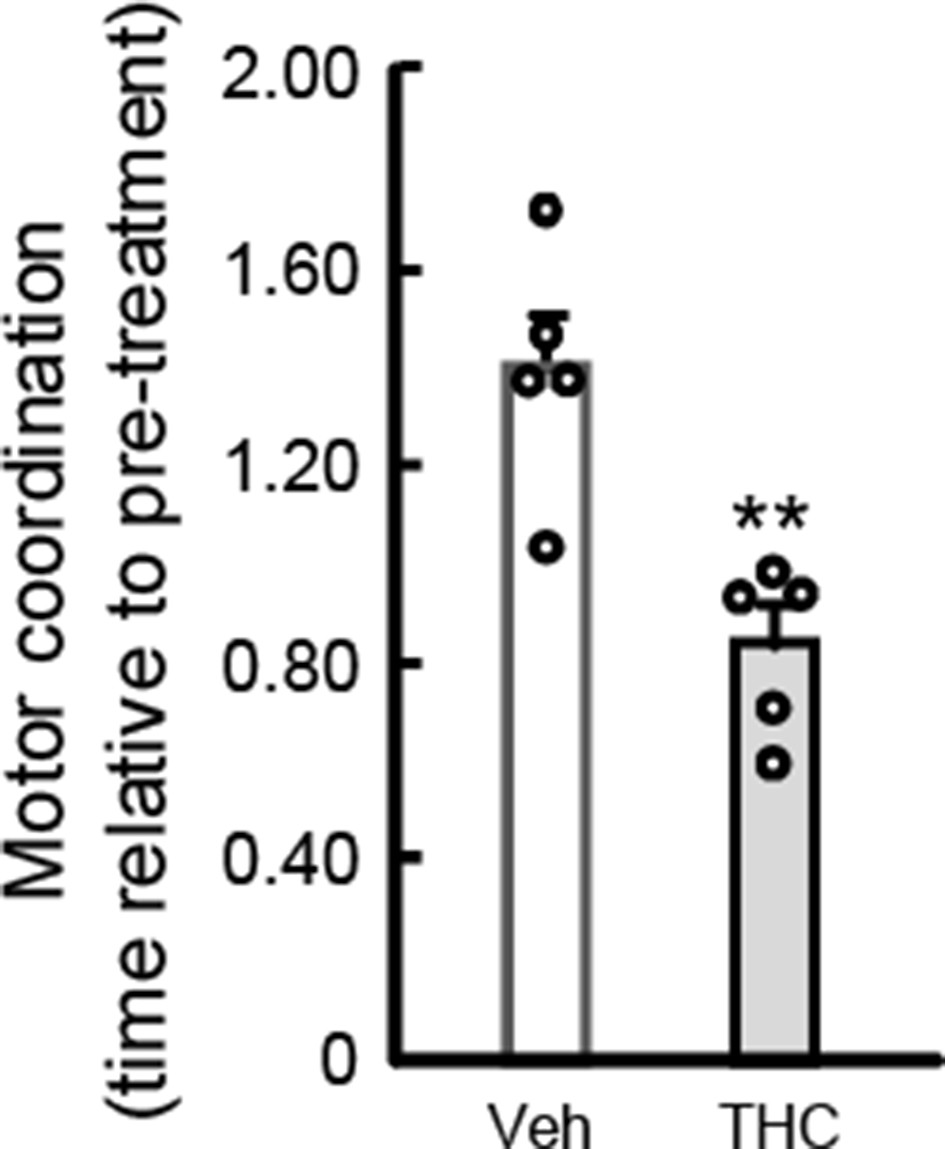
Rimonabant rescues THC-induced motor dyscoordination.
Wild-type C57BL/6N mice (n = 5 animals per group) were treated with SR141716 (rimonabant; 3 mg/kg as a single i.p. injection) or its vehicle for 20 min, and, subsequently, with THC (10 mg/kg as a single i.p. injection) or its vehicle for 4 hr. Animals were then subjected to the RotaRod test (time to fall relative to pre-treatment). **p<0.01 from vehicle-treated group, or ##p<0.01 from THC-treated group, by one-way ANOVA with Tukey’s multiple comparisons test. Raw numerical data and further statistical details are shown in Figure 5—source data 1.
Figure 6 with 1 supplement
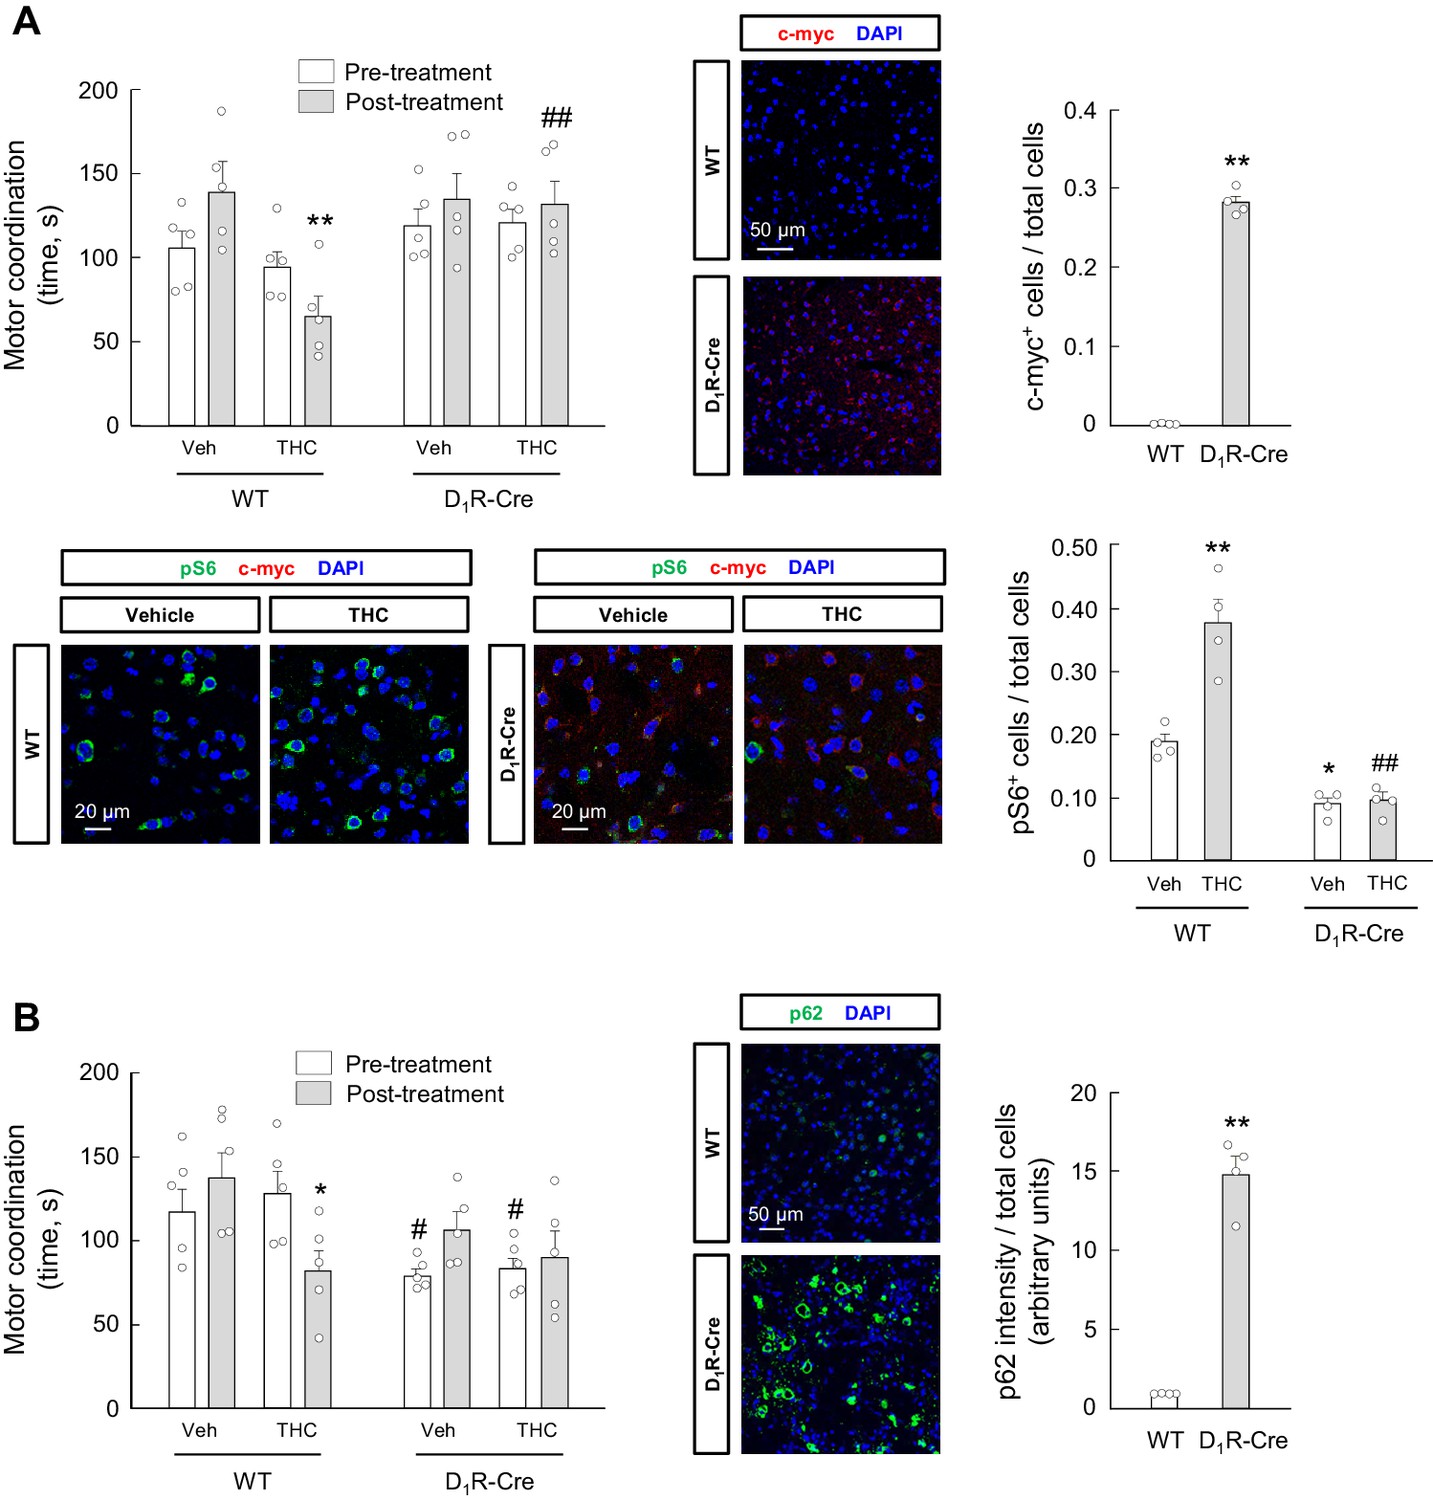
mTORC1 and p62 in D1R-MSNs participate in the THC-induced impairment of motor coordination in vivo.
(A) D1R-Cre mice and wild-type control littermates were injected stereotactically into the dorsal striatum with a CAG-DIO-dnRaptor rAAV, and left untreated for 4 weeks. Animals were subsequently treated with THC (10 mg/kg as a single i.p. injection) or its vehicle for 4 hr, and motor coordination was evaluated (RotaRod test, time to fall in seconds; n = 5 animals per group). **p<0.01 from vehicle-treated WT/post-treatment group, or ##p<0.01 from THC-treated WT/post-treatment group, by two-way ANOVA with Tukey’s multiple comparisons test. Representative images of c-myc tag and phosphorylated ribosomal protein S6 staining in the dorsal striatum, together with their quantification (c-myc-positive cells relative to total cells, or phospho-S6-positive cells relative to total cells), are shown (n = 4 animals per group). **p<0.01 from WT group by unpaired Student t-test (c-myc immunofluorescence); *p<0.05, **p<0.01 from vehicle-treated/WT group, or ##p<0.01 from THC-treated/WT group, by two-way ANOVA with Tukey’s multiple comparisons test (phospho-S6 immunofluorescence). (B) D1R-Cre mice and wild-type control littermates were injected stereotactically into the dorsal striatum with a CAG-DIO-p62 rAAV, and left untreated for 4 weeks. Animals were subsequently treated with THC (10 mg/kg as a single i.p. injection) or its vehicle for 4 hr, and motor coordination was evaluated (RotaRod test, time to fall in seconds; n = 5 animals per group). *p<0.05 from vehicle-treated WT/post-treatment group, or #p<0.05 from the respective WT/pre-treatment group, by two-way ANOVA with Tukey’s multiple comparisons test. Representative images of p62 staining in the dorsal striatum, together with their quantification (p62 fluorescence intensity relative to total cells), are shown (n = 4 animals per group). **p<0.01 from WT group by unpaired Student t-test. Raw numerical data and further statistical details are shown in Figure 6—source data 1.
-
Figure 6—source data 1
Source data for mTORC1 and p62 in D1R-MSNs participate in the THC-induced impairment of motor coordination in vivo.
- https://cdn.elifesciences.org/articles/56811/elife-56811-fig6-data1-v1.xlsx
Figure 6—figure supplement 1
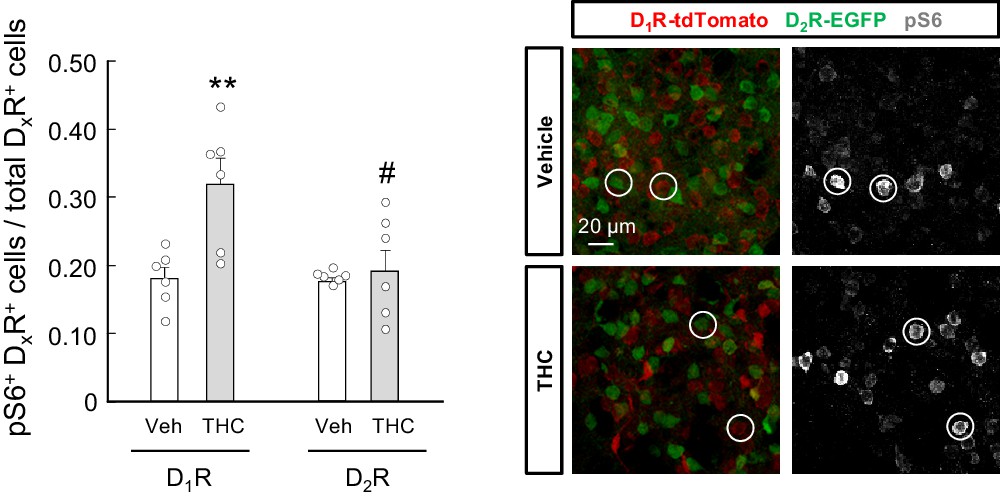
THC activates the mTORC1 pathway in D1R-MSNs but not D2R-MSNs in vivo.
Drd1a-tdTomato;Drd2-EGFP mice were treated with THC (10 mg/kg as a single i.p. injection) or its vehicle for 4 hr. Immunofluorescence analysis of phosphorylated ribosomal protein S6 in the dorsal striatum (phospho-S6/tdTomato-double-positive cells relative to total tdTomato-positive cells, or phospho-S6/EGFP-double-positive cells relative to total EGFP-positive cells; n = 6 animals per group). Representative images with encircled examples of double-positive cells are shown. **p<0.01 from vehicle-treated D1R group, or #p<0.05 from THC-treated D1R group, by two-way ANOVA with Tukey’s multiple comparisons test. Raw numerical data and further statistical details are shown in Figure 6—source data 1.
Author response image 1
Tables
Key resources table
| Reagent type (species) or resource | Designation | Source or reference | Identifiers | Additional information |
|---|---|---|---|---|
| Strain, strain background (Mus musculus, C57BL/6N, male) | Cnr1fl/fl;Drd1aCre | Monory et al., 2007; doi:10.1371/journal.pbio.0050269 | N/A | Conditional mutant mice in which the CB1 receptor gene (Cnr1) is absent from D1R (Drd1a)-expressing cells |
| Strain, strain background (Mus musculus, C57BL/6N, male) | Drd1aCre | Lemberger et al., 2007; doi:10.1186/1471-2202-8-4 | N/A | Transgenic mice expressing Cre recombinase in D1R (Drd1a)-expressing cells |
| Strain, strain background (Mus musculus, C57BL/6N, male) | Cnr1fl/fl;Neurod6Cre | Monory et al., 2006; doi:10.1016/j.neuron.2006.07.006 | N/A | Conditional mutant mice in which the CB1 receptor gene (Cnr1) is absent from dorsal telencephalic glutamatergic (Neurod6-expressing) neurons |
| Strain, strain background (Mus musculus, C57BL/6N, male) | Drd1a-tdTomato;Drd2-EGFP | Suárez et al., 2014; doi:10.1016/j.biopsych.2013.05.006 | N/A | Transgenic mice expressing the tdTomato and EGFP reporter genes under the control of the Drd1a gene promoter and the Drd2 gene promoter, respectively |
| Strain, strain background (Mus musculus, C57BL/6N, male) | C57BL/6N | Harlan Laboratories | RRID:MGI:5902763 | Wild-type mice |
| Transfected construct (Homo sapiens) | Myc-Raptor (ΔCT) expression vector | Addgene Hara et al., 2002; doi:10.1016/s0092-8674(02)00833–4. Koketsu et al., 2008; doi:10.1152/ajpendo.00253.2007 | Plasmid #1859; RRID:Addgene_1859 | Vector backbone: pRK-5; construct generated by PCR-mediated deletion of1293 base pairs at the Raptor C-terminus |
| Transfected construct (Homo sapiens) | HA-p62 expression vector | Addgene | Plasmid #28027; RRID:Addgene_28027 | Vector backbone: pcDNA4/TO |
| Genetic reagent (Homo sapiens) | CAG-DIO rAAV expression vector | Klugmann et al., 2005; doi:10.1016/j.mcn.2004.10.002 Bellocchio et al., 2016; doi:10.1523/JNEUROSCI.1192–16.2016 | CAG-DIO rAAV Hybrid serotype 1/2 | Recombinant adeno-associated virus (rAAV) for Cre-driven transgene expression with a CAG promoter |
| Biological sample (Mus musculus) | Primary striatal neurons | Harlan Laboratories (C57BL/6N mice) | C57BL/6N RRID:MGI:5902763 | In vitro cell cultures |
| Antibody | Anti-LC3B (rabbit polyclonal) | Sigma-Aldrich | Cat. #L7543; RRID:AB_796155 | IF (1:300); WB (1:4000) |
| Antibody | Anti-p62 (rabbit polyclonal) | Enzo Life Sciences | Cat. #BML-PW9860-0025; RRID:AB_2052149 | IF (1:250); WB (1:1000) |
| Antibody | Anti-p62 (rabbit polyclonal) | Progen | Cat. #GP62-C; RRID:AB_2687531 | WB (1:1000) |
| Antibody | Anti-LAMP1 (rabbit polyclonal) | Abcam | Cat. #ab25245 RRID:AB_449893 | IF (1:1000) |
| Antibody | Anti-DARPP32 (mouse monoclonal) | BD Biosciences | Cat. #611520; RRID:AB_398980 | IF (1:700) |
| Antibody | Anti-phospho-S6-S235/S236 (rabbit polyclonal) | Cell Signaling | Cat. #2211; RRID:AB_331679 | IF (1:300) |
| Antibody | Anti-phospho-S6-S240/S244 (rabbit polyclonal) | Cell Signaling | Cat. #5364; RRID:AB_10694233 | IF (1:800) |
| Antibody | Anti-c-Myc (mouse monoclonal) | Sigma-Aldrich | Cat. #11-667-149-001; RRID:AB_390912 | IF (1:500) |
| Antibody | Anti-phospho-S6K-T389 (mouse monoclonal) | Cell Signaling | Cat. #9206; RRID:AB_2285392 | WB (1:1000) |
| Antibody | Anti-total-S6K (rabbit polyclonal) | Cell Signaling | Cat. #9202; RRID:AB_331676 | WB (1:1000) |
| Antibody | Anti-phospho-ULK1-S757 (rabbit polyclonal) | Cell Signaling | Cat. #6888; RRID:AB_10829226 | WB (1:1000) |
| Antibody | Anti-phospho-ULK1-S555 (rabbit polyclonal) | Cell Signaling | Cat. #5869; RRID:AB_10707365 | WB (1:1000) |
| Antibody | Anti-total-ULK1 (rabbit polyclonal) | Cell Signaling | Cat. #8054; RRID:AB_11178668 | WB (1:1000) |
| Antibody | Anti-β-actin (mouse monoclonal) | Sigma-Aldrich | Cat. #A5441; RRID:AB_476744 | WB (1:4000) |
| Antibody | Anti-mouse monoclonal IgG (HRP-linked whole antibody) | GE-Healthcare Lifescience | Cat. #NA931; RRID:AB_772210 | WB (1:5000) |
| Antibody | Anti-rabbit monoclonal IgG (HRP-linked whole antibody) | GE-Healthcare Lifescience | Cat. #NA934; RRID:AB_2722659 | WB (1:5000) |
| Antibody | Goat anti-guinea pig IgG (H+L) (HRP-linked secondary antibody) | Invitrogen | Cat. #A18769; RRID:AB_2535546 | WB (1:5000) |
| Antibody | Goat anti-mouse IgG (H+L) (cross-adsorbed, Alexa Fluor 488) | Invitrogen | Cat. #A-11001; RRID:AB_2534069 | IF (1:500) |
| Antibody | Goat anti-mouse IgG (H+L) (cross-adsorbed, Alexa Fluor 594) | Invitrogen | Cat. #A-11005; RRID:AB_2534073 | IF (1:500) |
| Antibody | Goat anti-mouse IgG (H+L) (cross-adsorbed, Alexa Fluor 647) | Invitrogen | Cat. #A-21235; RRID:AB_2535804 | IF (1:500) |
| Antibody | Goat anti-rabbit IgG (H+L) (cross adsorbed, Alexa Fluor 488) | Invitrogen | Cat. #A-11008; RRID:AB_143165 | IF (1:500) |
| Antibody | Goat anti-rabbit IgG (H+L) (cross adsorbed, Alexa Fluor 594) | Invitrogen | Cat. #A-11012; RRID:AB_2534079 | IF (1:500) |
| Antibody | Goat anti-rabbit IgG (H+L) (cross adsorbed, Alexa Fluor 647) | Invitrogen | Cat. #A-21244; RRID:AB_2535812 | IF (1:500) |
| Commercial assay or kit | Papain dissociation system (PDS) | Worthington | Cat. #LK 003153 | In vitro cell cultures |
| Chemical compound, drug | Δ9-tetrahydro-cannabinol (THC) | THC Pharm GmbH | Dronabinol | In vivo experiments (10 mg/kg, i.p.);in vitro experiments (0.75 μM) |
| Chemical compound, drug | Rimonabant (SR141716) | Cayman Chemical | Cat. #9000484 | In vivo experiments: (3 mg/kg, i.p.) |
| Chemical compound, drug | Temsirolimus | LC Labs | Cat. #T-8040 | In vivo experiments (1 mg/kg, i.p.) |
| Chemical compound, drug | Trehalose | Merck-Calbiochem | Cat. #90210 | In vivo experiments (10 g/L in drinking water) |
| Chemical compound, drug | HU-210 | Tocris | Cat. #0966 | In vitro experiments (10 nM) |
| Chemical compound, drug | Hydroxychloroquine | Merck | Cat. #509272 | In vitro experiments (0.1 mM) |
| Chemical compound, drug | E64d | Enzo Life Sciences | Cat. #BML-PI107-0001 | In vitro experiments (0.1 μM) |
| Chemical compound, drug | Pepstatin A | Enzo Life Sciences | Cat. #ALX-260–085 M005 | In vitro experiments (10 ng/ml) |
| Software, algorithm | Graph Pad Prism 8.0 | GraphPad Software Inc | RRID:SCR_002798 | Descriptive analysis and statistics |
| Software, algorithm | IBM SPSS | IBM Corporation | RRID:SCR_002865 | Statistical power analysis |
| Software, algorithm | Image J | NIH | RRID:SCR_003070 | Western blot and immune-microscopy image analysis |
| Software, algorithm | TCS-SP8 Leica Application Suite X, LASX | Leica | RRID:SCR_013673 | SP8 AOBS confocal microscopy image capture |
| Software, algorithm | ACTITRACKUPG V2.7 | Panlab | Cat. #76–0610 | Motor activity analysis |
| Other | DAPI stain | Invitrogen | Cat. #D1306; RRID:AB_2629482 | IF (1 µg/mL) |
| Other | RotaRod LE8200 | Harvard Apparatus | Cat. #LE8200 (76–0237) | Motor coordination testing |
| Other | IR actimeter (ActiTrack) | Panlab | Cat. #76–0127, #76–0131, #76–0134, #76–0125 | Motor activity testing |
Author response table 1
| Motor coordination (time to fall, s) | ||||||
|---|---|---|---|---|---|---|
| Raw Data | Vehicle | THC | ||||
| Pre-treatment | Post-treatment | Post-treatment/Pre-treatment | Pre-treatment | Post-treatment | Post-treatment/Pre-treatment | |
| 93 | 101 | 1.08 | 113 | 71 | 0.63 | |
| 91 | 131 | 1.43 | 113 | 112 | 0.99 | |
| 79 | 122 | 1.54 | 101 | 105 | 1.05 | |
| 72 | 130 | 1.81 | 64 | 48 | 0.75 | |
| 100 | 143 | 1.44 | 80 | 80 | 1.00 | |
| Mean | 87 | 125 | 1.46 | 94 | 83 | 0.88 |
| SEM | 5.05 | 6.96 | 0.12 | 9.66 | 11.62 | 0.08 |
| CI | 72.98 | 106.10 | 1.14 | 67.38 | 50.92 | 0.66 |
| 101.00 | 144.70 | 1.78 | 121.00 | 115.50 | 1.11 | |
Additional files
Download links
A two-part list of links to download the article, or parts of the article, in various formats.
Downloads (link to download the article as PDF)
Open citations (links to open the citations from this article in various online reference manager services)
Cite this article (links to download the citations from this article in formats compatible with various reference manager tools)
Inhibition of striatonigral autophagy as a link between cannabinoid intoxication and impairment of motor coordination
eLife 9:e56811.
https://doi.org/10.7554/eLife.56811


