Bedrock radioactivity influences the rate and spectrum of mutation
- Univ Lyon, Université Claude Bernard Lyon 1, CNRS UMR 5023, ENTPE, Laboratoire d’Ecologie des Hydrosystèmes Naturels et Anthropisés, France
- LPC, Université Clermont Auvergne, CNRS/IN2P3 UMR6533, France
- Univ Lyon, Université Jean Moulin Lyon 3, CNRS UMR 5600 Environnement Ville Société, France
- Univ Lyon, Université Claude Bernard Lyon 1, CNRS UMR 5558, Laboratoire de Biométrie et Biologie Evolutive, France
- Institut Universitaire de France, France
Figures
Figure 1 with 1 supplement
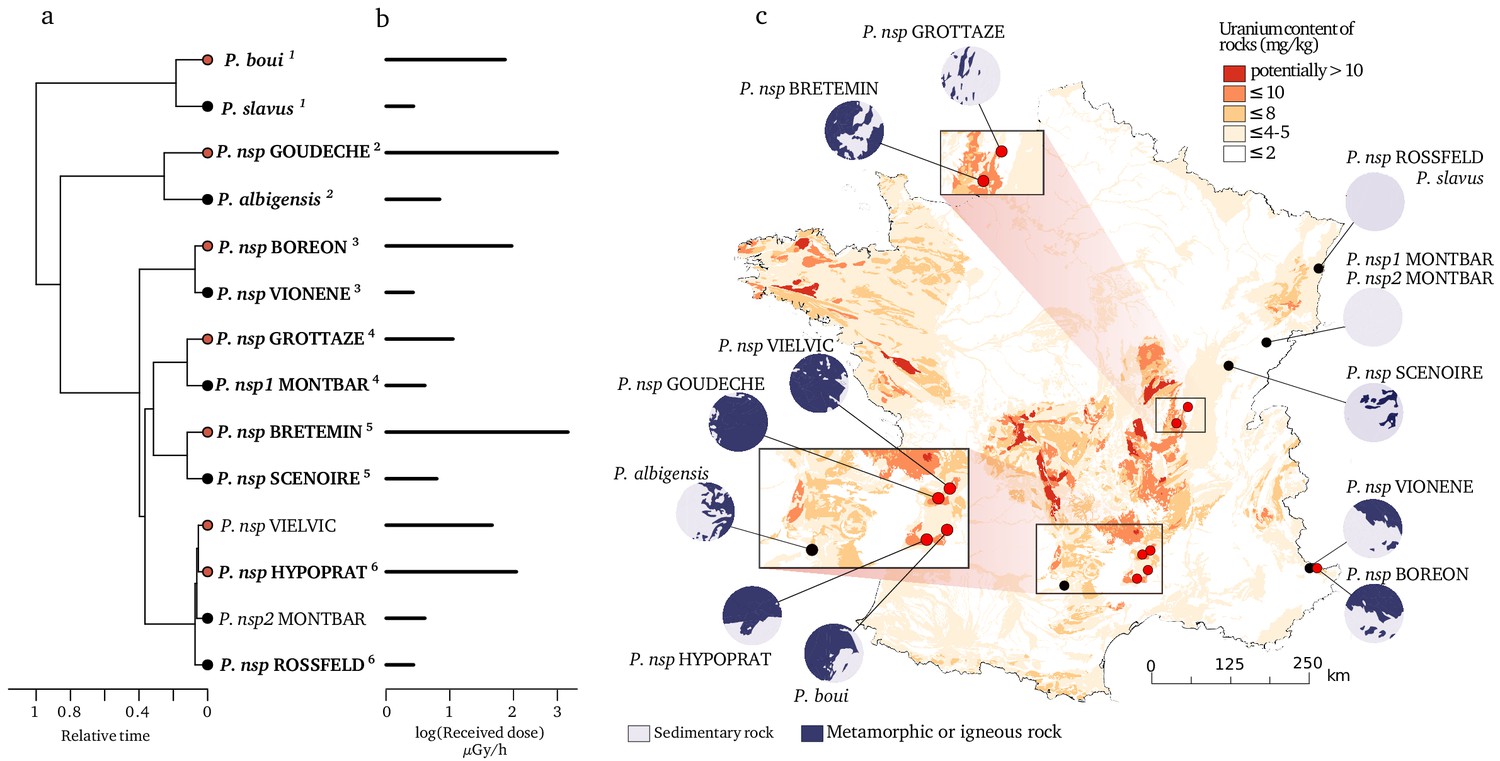
Species and locations selected to study the impact of bedrock radioactivity on the mutation rate and spectrum.
Fourteen species with contrasted bedrock radioactivity exposure were selected (black dot: low exposure, red dot: high exposure). Based on their phylogenetic history (a), we further selected six monophyletic pairs of closely related species to compare their mutational spectrum (Vielvic and Montbar are excluded because of unresolved phylogeny, pairs are indicated using superscript numbers). Received dose of radioactivity was determined from measurements of radioactivity in the sediments of the sampled sites (b). For each site, the areal proportion of low-radioactivity sedimentary rocks and high-radioactivity metamorphic and igneous rocks in a radius of 15 km around the sampling (λ15) site is represented with circles next to the map (c).
Figure 1—figure supplement 1
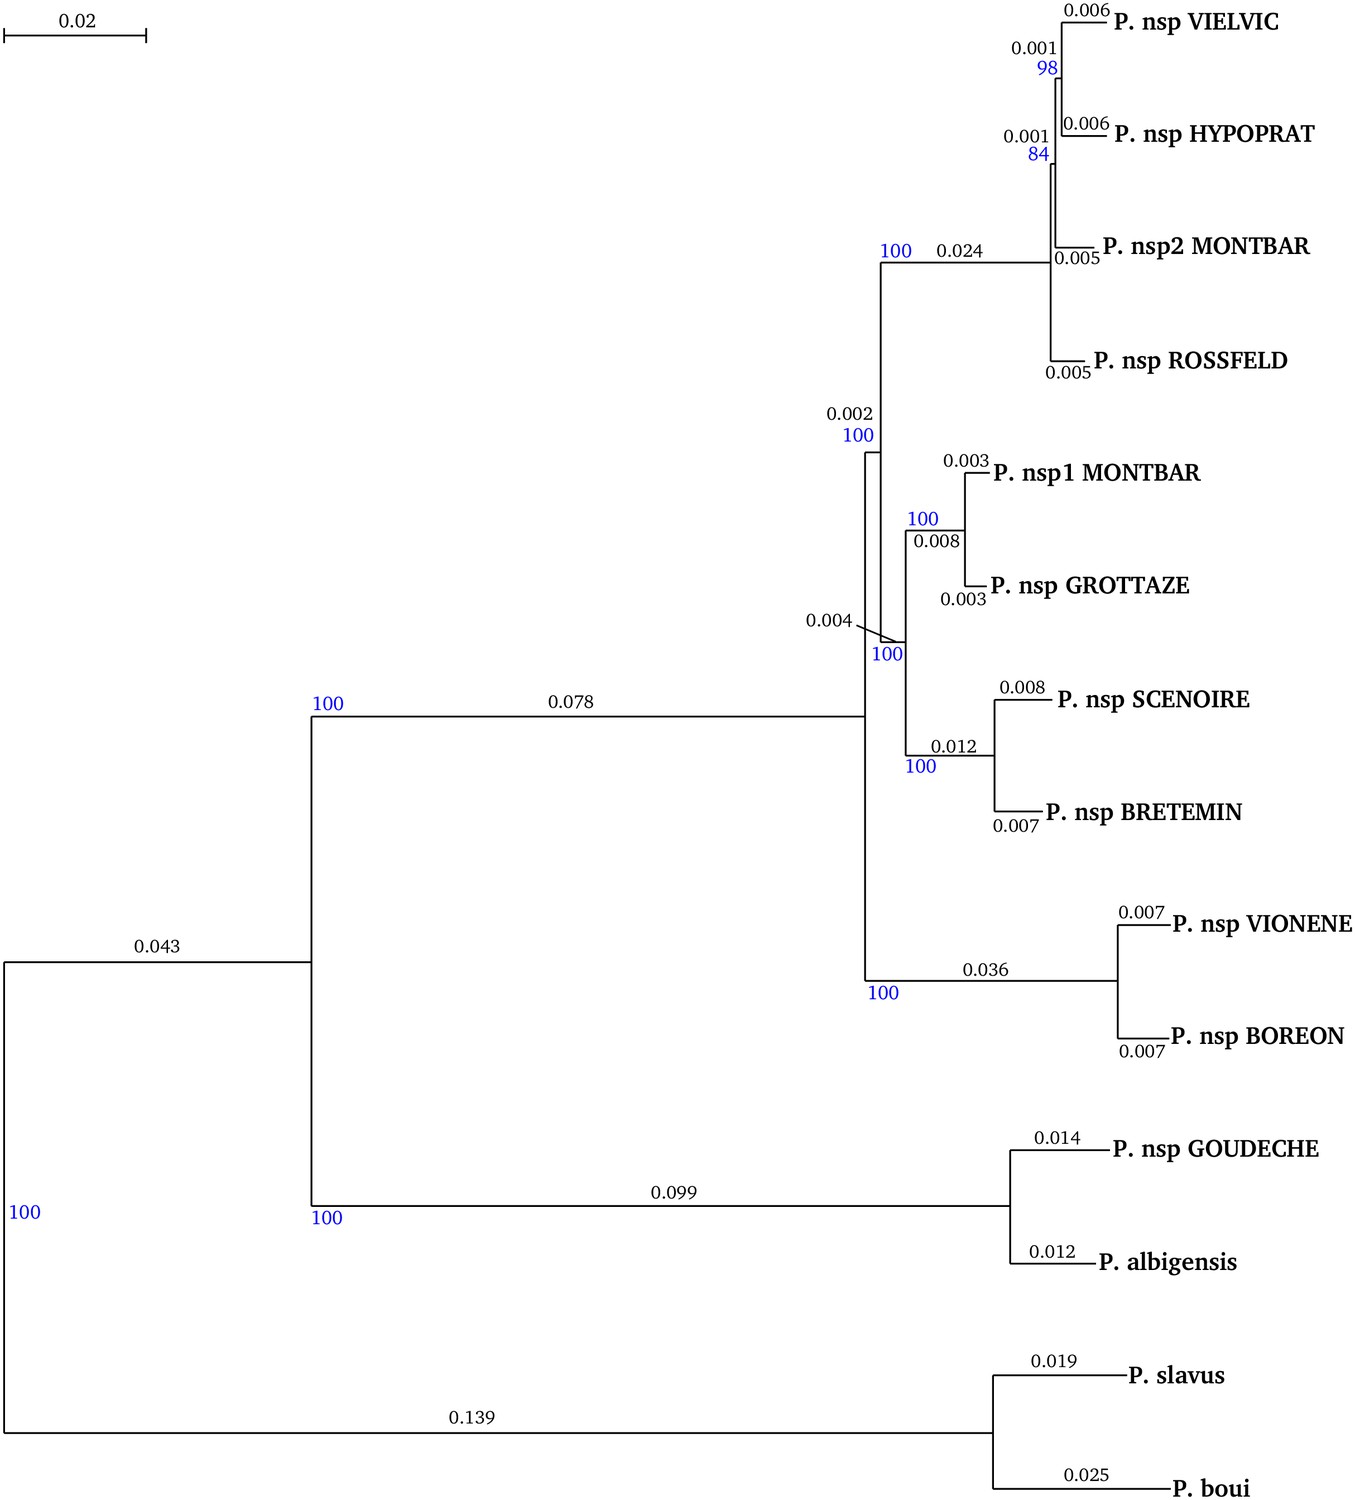
Phylogeny of the 14 species used to compute synonymous substitution rates.
Tree was built with the concatenation of the 2490 genes with PhyML3.0, under a GTR+G+I model with 100 bootstrap replicates. Bootstrap value are indicated with blue numbers, branch length (i.e. substitution rate) are indicated with black numbers.
Figure 2
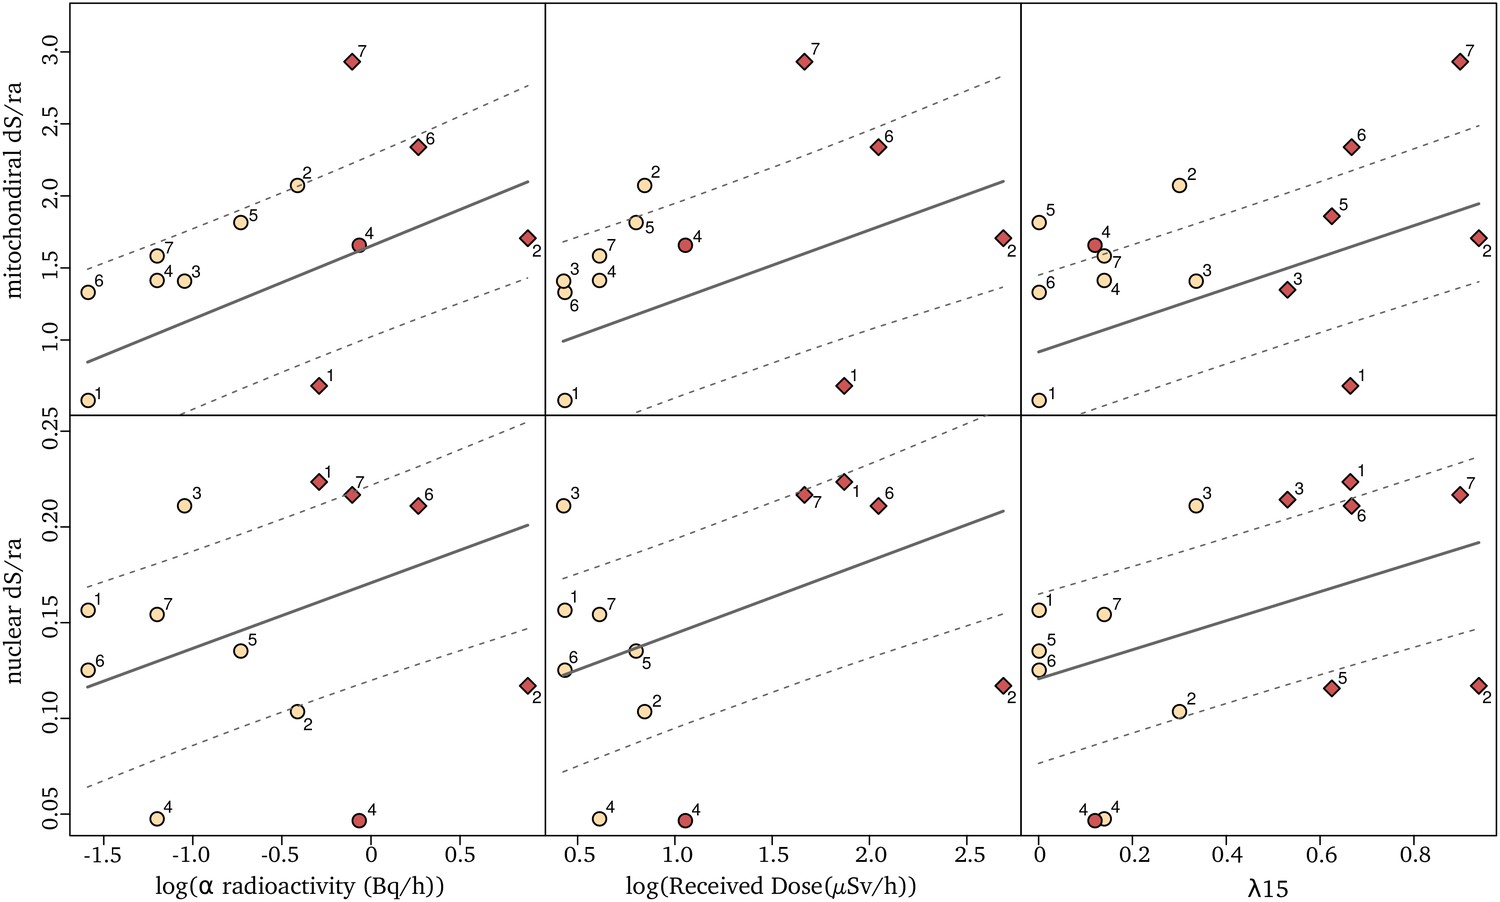
Relationships between synonymous substitution rate relative to the root age (dS/ra) and radioactivity measured either as the sediment α radioactivity (left), the received dose (middle) or the proportion of igneous and metamorphic rock in a radius of 15 km around the sampling sites, λ15 (right).
Each dot represents a species nuclear (top) and mitochondrial (bottom) dS/ra. The fit of the pGLS model is indicated with a solid line and the confidence interval of the correlation is indicated with dashed lines. The two species of a pair are labeled with a number as in Figure 1 (the number seven corresponds to the two species not forming a pair), with in red the species of the pair living in the highest α radioactivity. Species in sedimentary formations (λ15 < 50%) are depicted with circles and species in igneous/metamorphic formations (λ15 > 50%) with a diamond.
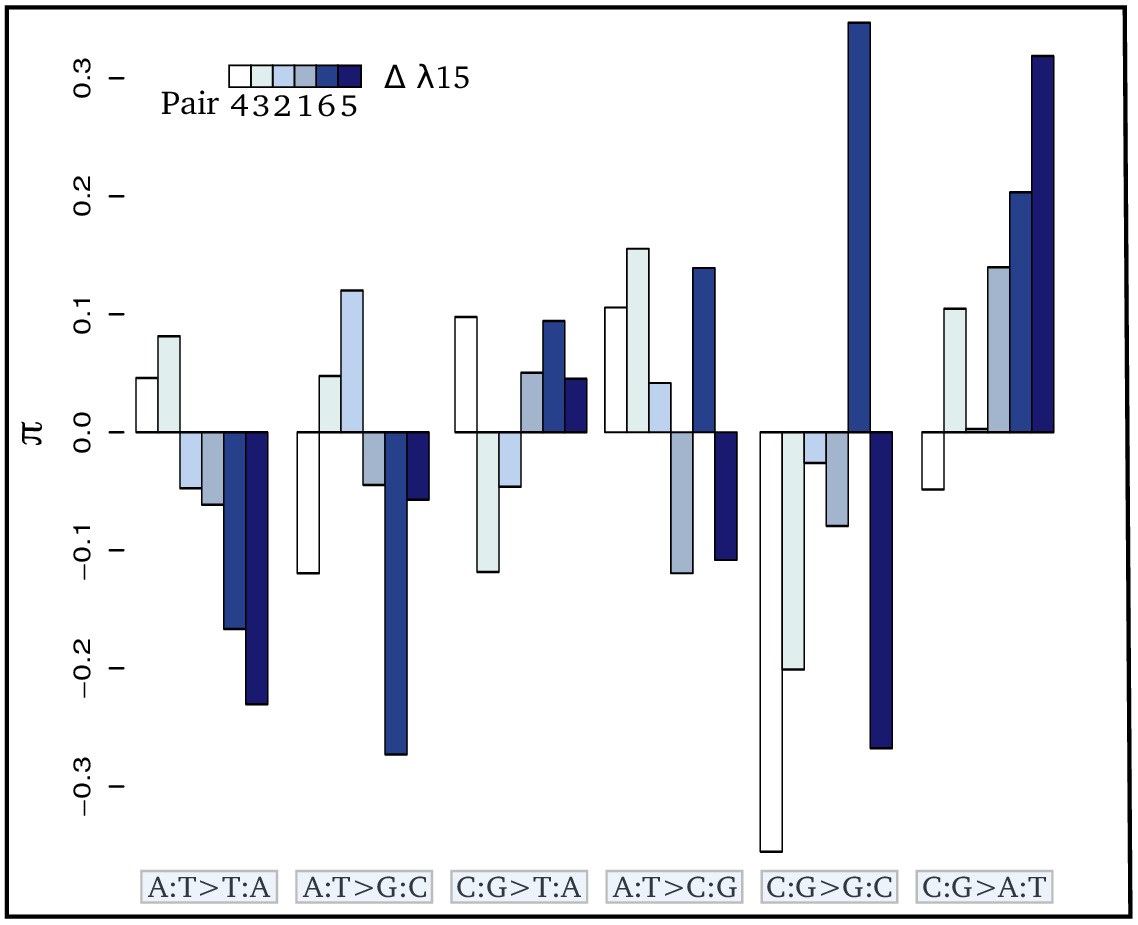
Figure 3 with 1 supplement
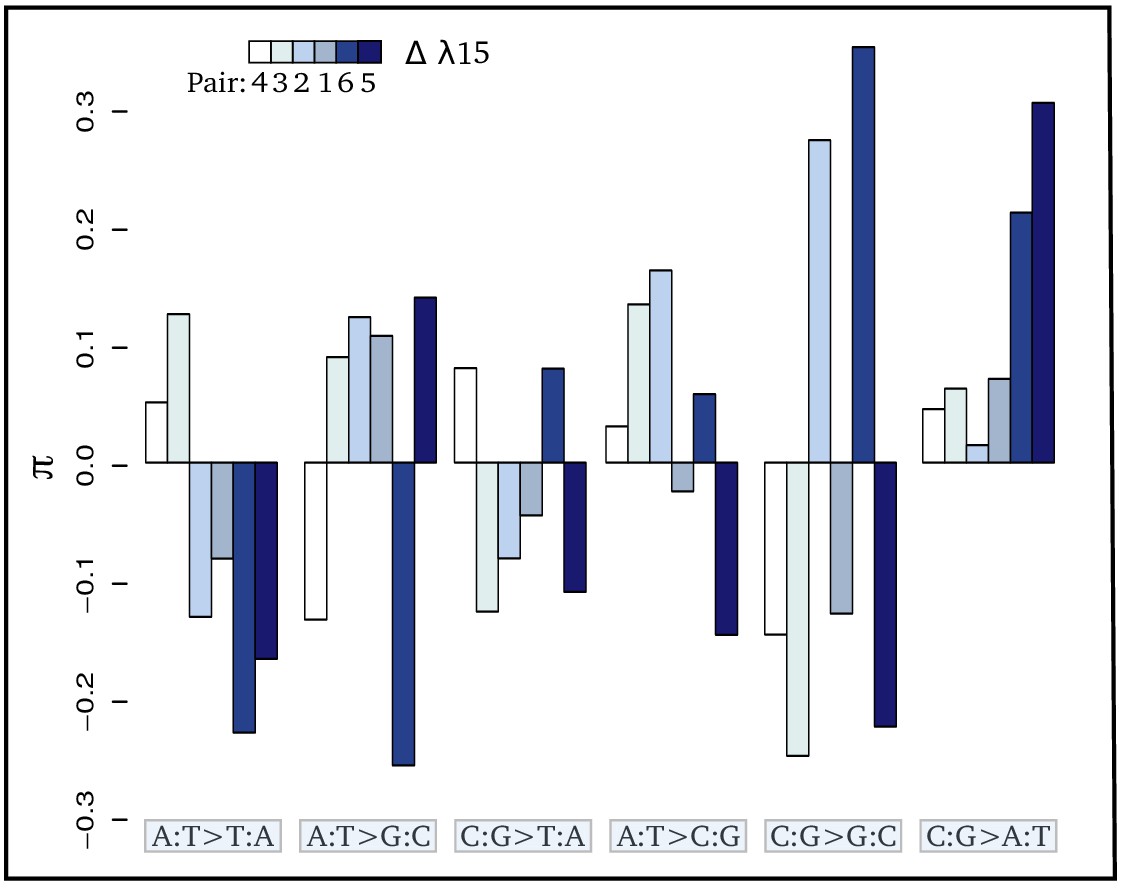
Contrasts (π) of the relative proportion of each mutation [p(i:j→k:l)] in each pair of sister species: where + and - refer respectively to the species exposed to the higher and lower level of radioactivity in the pair m.
Thus, positive bars represent a higher proportion of the given mutation in the species living in the high radioactivity rock. From left to right, bars are in increasing order of difference (Δ) in λ15 (the areal proportion of igneous and metamorphic rock in a radius of 15 km around the site) between the two species of each pair. From left to right, mutations are in increasing order of correlation with radioactivity. Numbers below the color scale indicate the species pair number as in Figure 1.
Figure 3—figure supplement 1
Contrasts (π) of the relative proportion of each mutation computed only on third positions in each pair of sister species: where + and - refer respectively to the species exposed to the higher and lower level of radioactivity in the pair m.
Thus, positive bars represent a higher proportion of the given mutation in the species living in the high radioactivity rock. From left to right, bars are in increasing order of difference (Δ) in λ15 (the areal proportion of igneous and metamorphic rock in a radius of 15 km around the site) between the two species of each pair. From left to right, mutations are in increasing order of correlation with radioactivity. Numbers below the color scale indicate the species pair number as in Figure 1.
Tables
Table 1
Phylogenetic generalized least square (pGLS) regressions of the nuclear synonymous substitution rate (dS/ra) and mitochondrial dS/ra against the α radioactivity measured in the sediments (α radio.), the received dose (RD) of radioactivity, and the surface of metamorphic and igneous bedrock within a 15 km radius around the sampling sites (λ15).
α radioactivity and RD were log transformed to fit with the linear model assumptions. are Cox-Snell pseudo .
| Nuclear dS/ra | Mitochondrial dS/ra | ||||||||
|---|---|---|---|---|---|---|---|---|---|
| Slope | L. ratio | p. value | Slope | L. ratio | p. value | N taxa | |||
| log(α radio.) | 0.034 | 5.995 | 0.014 | 0.393 | 0.506 | 7.895 | 0.005 | 0.482 | 12 |
| log(RD) | 0.038 | 6.51 | 0.011 | 0.419 | 0.491 | 5.981 | 0.015 | 0.392 | 12 |
| λ15 | 0.076 | 9.039 | 0.003 | 0.476 | 1.097 | 11.680 | 0.001 | 0.566 | 14 |
-
Each line corresponds to one likelihood ratio test between the models with and without the given explanatory variable. The impact of multiple predictors that are collinear are unreliable in the linear model framework (Quinn and Keough, 2002). As the three independent variables are collinear (R2 > 0.6) a model with a combination of these variable is not shown.
Table 2
Variation of the mutational spectrum as a function of bedrock radioactivity.
An ordered test is first used to test if mutation counts vary between low and high radioactive habitats while accounting for the dependency among mutation. In parallel, the phylogenetic dependency was taken into account using a Phylogenetic Generalized Least Square (pGLS) regression of the proportion of each mutation against the sediment α radioactivity (α radio.), Received Dose (RD), and areal proportion of metamorphic and igneous rock within a 15 km radius (λ15). α radioactivity and RD are log transformed to fit with the linear model assumptions. are Cox-Snell pseudo .
| Ordered test | pGLS regression | ||||||
|---|---|---|---|---|---|---|---|
| Mutation type | Ordered p. value | Radio. | Slope | L.ratio | P.value | N | |
| P(C:G→A:T) | 0.000 | log(α radio) | 0.013 | 13.010 | 0.000 | 0.662 | 10 |
| log(RD) | 0.014 | 12.079 | 0.006 | 0.635 | 10 | ||
| λ15 | 0.042 | 13.791 | 0.000 | 0.683 | 12 | ||
| P(A:T→T:A) | 0.111 | log(α radio) | −0.009 | 6.819 | 0.072 | 0.433 | 10 |
| log(RD) | −0.011 | 9.348 | 0.030 | 0.541 | 10 | ||
| λ15 | −0.025 | 6.994 | 0.080 | 0.442 | 12 | ||
| P(C:G→T:A) | 0.351 | log(α radio) | 0.012 | 3.323 | 0.612 | 0.242 | 10 |
| log(RD) | 0.010 | 1.684 | 0.776 | 0.131 | 10 | ||
| λ15 | −0.009 | 0.183 | 1.000 | 0.015 | 12 | ||
| P(A:T→C:G) | 0.520 | log(α radio) | 0.001 | 0.121 | 1.000 | 0.010 | 10 |
| log(RD) | 0.000 | 0.015 | 1.000 | 0.001 | 10 | ||
| λ15 | 0.001 | 0.005 | 1.000 | 0.000 | 12 | ||
| P(C:G→G:C) | 0.982 | log(α radio) | 0.005 | 2.137 | 0.864 | 0.163 | 10 |
| log(RD) | 0.006 | 2.403 | 0.726 | 0.181 | 10 | ||
| λ15 | 0.006 | 0.360 | 1.000 | 0.030 | 12 | ||
| P(A:T→G:C) | 0.982 | log(α radio) | −0.022 | 7.778 | 0.075 | 0.477 | 10 |
| log(RD) | −0.019 | 4.004 | 0.180 | 0.284 | 10 | ||
| λ15 | −0.014 | 0.394 | 1.000 | 0.032 | 12 | ||
-
Each line of the pGLS tests corresponds to one likelihood ratio test between the models with and without the given explanatory variable. P values have been corrected following Holm’s method (k=18).
Additional files
-
Supplementary file 1
Fourteen sequenced species with sampling coordinates, synonymous substitution rate relative to the root age for nuclear and mitochondrial genome, α radioactivity measured on each site, effective dose of radioactivity (in μGy/h), and this effective dose corrected for recent human impact (in μGy/h), non-synonymous substitution rate over synonymous substitution rate (), the areal proportion of magmatic and metamorphic rocks in a radius of 15 km around the sampling point (λ15), the GC content for all positions or for third positions, the effective number of codon (ENC) and the raw computed with the CodeMl programm and with the MapNH programm (not relative to root age).
- https://cdn.elifesciences.org/articles/56830/elife-56830-supp1-v2.ods
-
Supplementary file 2
Statistical tests for the mutational spectrum analysis.
An ordered Chi2 test as described in Harris and Pritchard, 2017 has been performed on mutation counts computed on third positions. A Phylogenetic Generalized Least Square (pGLS) regression of the proportion of each mutations against the α radioactivity measured in sediment (α radio.), the Received Dose (RD) modeled with ERICA tool, and the areal proportion of metamorphic and igneous rock within a 15 km radius (λ15) has also been performed. α radioactivity and RD were log transformed to fit with linear model assumptions. are Cox-Snell pseudo .
- https://cdn.elifesciences.org/articles/56830/elife-56830-supp2-v2.ods
-
Supplementary file 3
Phylogenetic Least Square (PGLS) regression of computed with CoEvol, CodeMl, or mapNH against radioactivity measured as the α radioactivity measured in sediments, as the effective dose received by organisms or as the areal proportion of metamorphic and magmatic rocks in a radius of 15 km around the sampled point (λ15).
Each test corresponds to one likelihood ratio test between the models with and without the given explanatory variable. For α radioactivity and received dose, sampled sites with a break in the secular equilibrium were removed, resulting in tests with only 12 taxa.
- https://cdn.elifesciences.org/articles/56830/elife-56830-supp3-v2.ods
-
Transparent reporting form
- https://cdn.elifesciences.org/articles/56830/elife-56830-transrepform-v2.pdf
Download links
A two-part list of links to download the article, or parts of the article, in various formats.
Downloads (link to download the article as PDF)
Open citations (links to open the citations from this article in various online reference manager services)
Cite this article (links to download the citations from this article in formats compatible with various reference manager tools)
Bedrock radioactivity influences the rate and spectrum of mutation
eLife 9:e56830.
https://doi.org/10.7554/eLife.56830


