Optogenetic control of gut bacterial metabolism to promote longevity
- Department of Bioengineering, United States
- Huffington Center on Aging, United States
- Department of Chemical and Biomolecular Engineering, United States
- Department of Molecular & Human Genetics, Baylor College of Medicine, United States
- Systems, Synthetic, and Physical Biology Program, Rice University, United States
- Howard Hughes Medical Institute, United States
- Department of Biosciences, United States
Figures
Figure 1 with 4 supplements
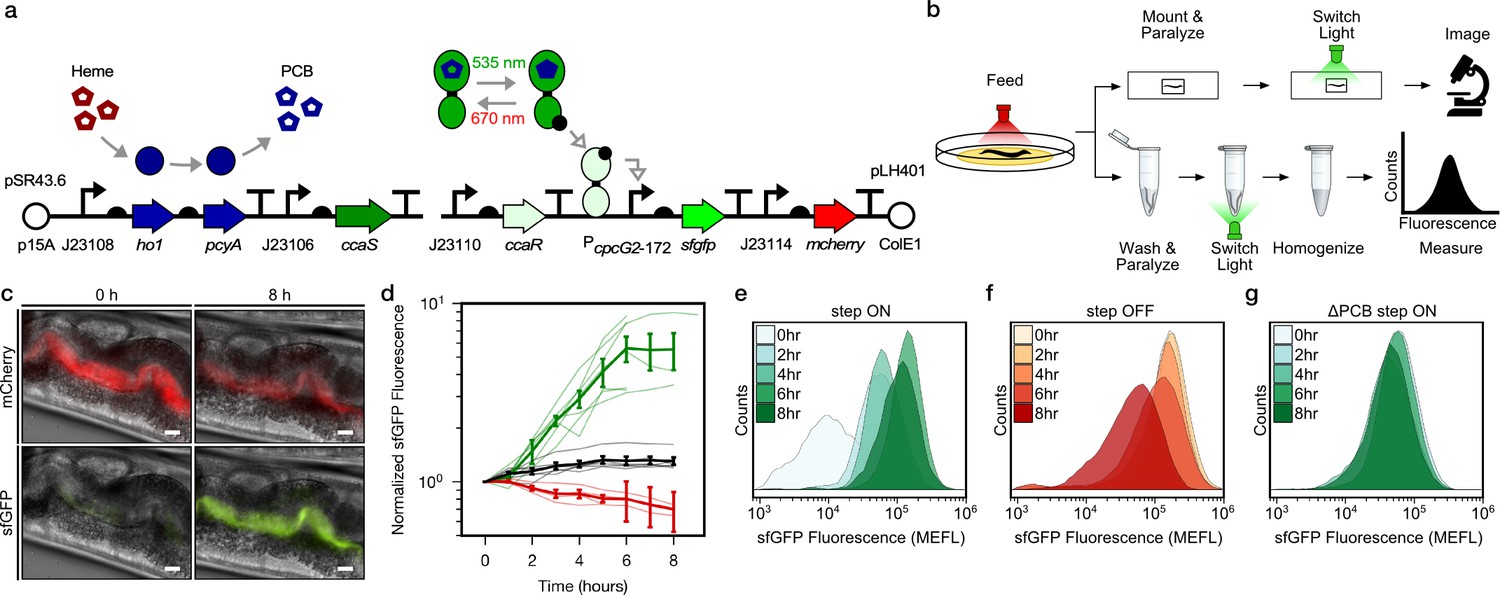
Optogenetic control of C.elegans gut bacterial gene expression.
(a) Strain LH01, which harbors two plasmids: pSR43.6, which encodes the biosynthesis of the PCB chromophore, and pLH401, which encodes the CcaSR TCS with GFP as output and constitutive mCherry production. DNA element legend: origins of replication (circles), promoters (bent arrows), ribosome binding sites (semi-circles), open reading frames (block arrows), transcriptional terminators (vertical lines with flat tops). Protein legend: Dark green protein (CcaS), light green protein (CcaR), black circle (phosphoryl group). Signal legend: filled gray arrows (biochemical or biophysical process), open gray arrows (signal transduction). (b) Microscopy and cytometry workflows. All begin with worms fed bacteria grown in the precondition light condition. Microscopy samples were then paralyzed and imaged while exposed to the experimental light condition. Cytometry samples were washed and paralyzed, exposed to the experimental light condition, and finally homogenized before cytometry. (c) Fluorescence microscopy images 0 and 8 h after green light exposure in the step ON experiment. Scale bar: 10 μm. (d) Response dynamics in the step ON (green) and step OFF (red) microscopy experiments. Black: ΔPCB strain (step ON experiment). Individual- (light lines) and multi-worm average (dark lines) data are shown. n = 7, 4, 6 worms for green, red, black data sets (measured over 2, 3, 1 days, respectively). Error bars: SEM. (e–g) Flow cytometry histograms for response dynamics experiments. MEFL: molecules of equivalent fluorescein.
Figure 1—figure supplement 1
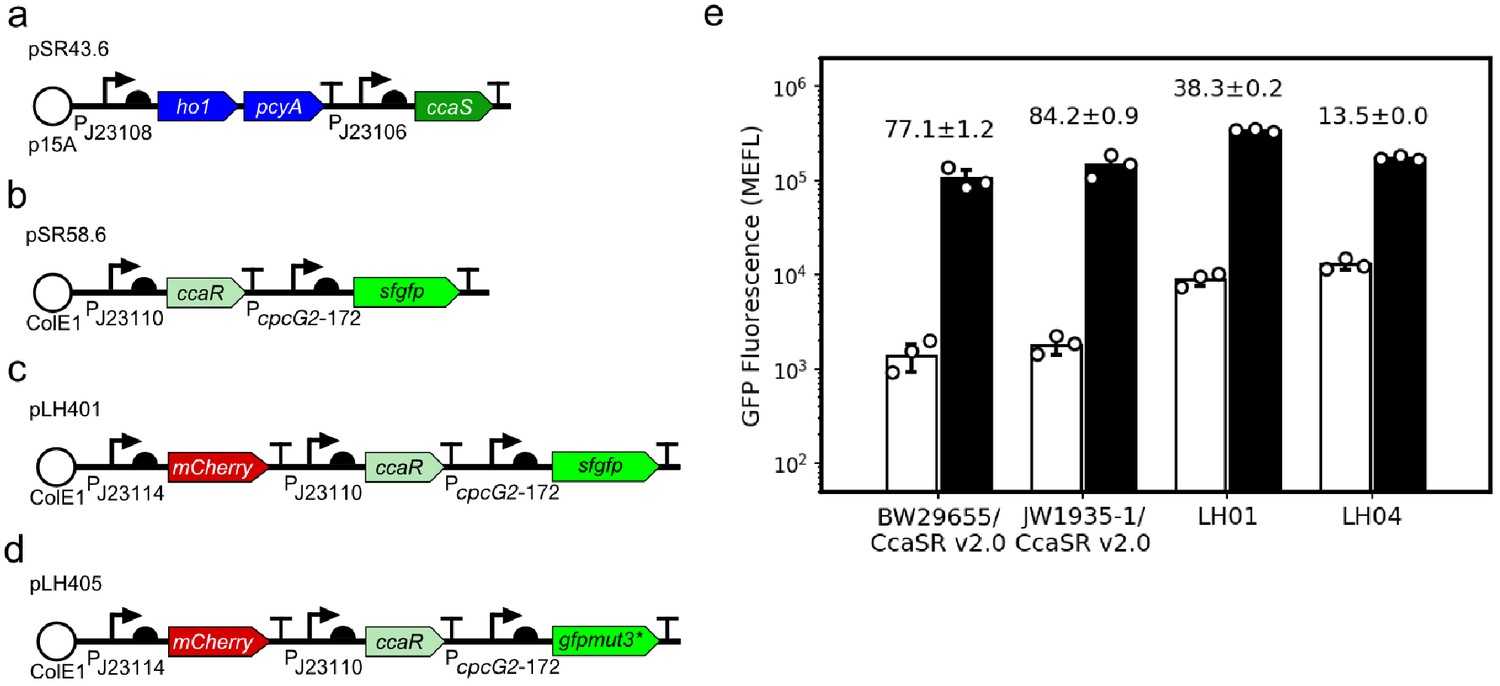
In vitro characterization of GFP reporter strains used in this study.
All optogenetic strains carry our previously published CcaSR v2.0 system, which is encoded on plasmids (a) pSR43.6, (b) pSR58.6, (c) pLH401 (used for microscopy) and (d) pLH405 (used for cytometry) genetic device schematics. We replaced sfgfp with gfpmut3* in pLH405 as we hypothesized that the latter may be less stable and thus result in faster response dynamics. However, we observed no difference in dynamics. (e) Batch culture light responses of CcaSR v2.0 and all GFP reporter strains used in this study. GFP fluorescence was measured by flow cytometry. The dynamic range (ratio of GFP fluorescence in green versus red light) is shown above each data set. We note that CcaSR v2.0 exhibits 77-fold dynamic range in the reference strain BW29655 (ΔenvZ, ΔompR), which is similar to our previous measurement of this strain at 120-fold (Schmidl et al., 2014). The calculated fold-change is sensitive to fluctuations in the measured E. coli autofluorescence and red-light expression level, which likely explains the slight discrepancy. CcaSR v2.0 dynamic range increases slightly to 84.2-fold in ∆rcsA (JW1935-1), which is used throughout this work, due to higher sfGFP expression in green light. The mCherry cassette in pLH401 decreases dynamic range to 38.3-fold due to higher leaky sfGFP expression in red light. In worms, the fold-change in response to green light decreases further to 5.52 ± 2.4 fold (Figure 1d). The use of gfpmut3* in pLH405 further decreases dynamic range to 13.5 ± 0.0 fold for reasons that are not clear, while in worms the fold-change is 8.63 ± 3.6 fold (Figure 1e). Data represent the mean of three independent, autofluorescence-subtracted, biological replicates acquired on three separate days. Error bars: standard deviation.
Figure 1—figure supplement 2
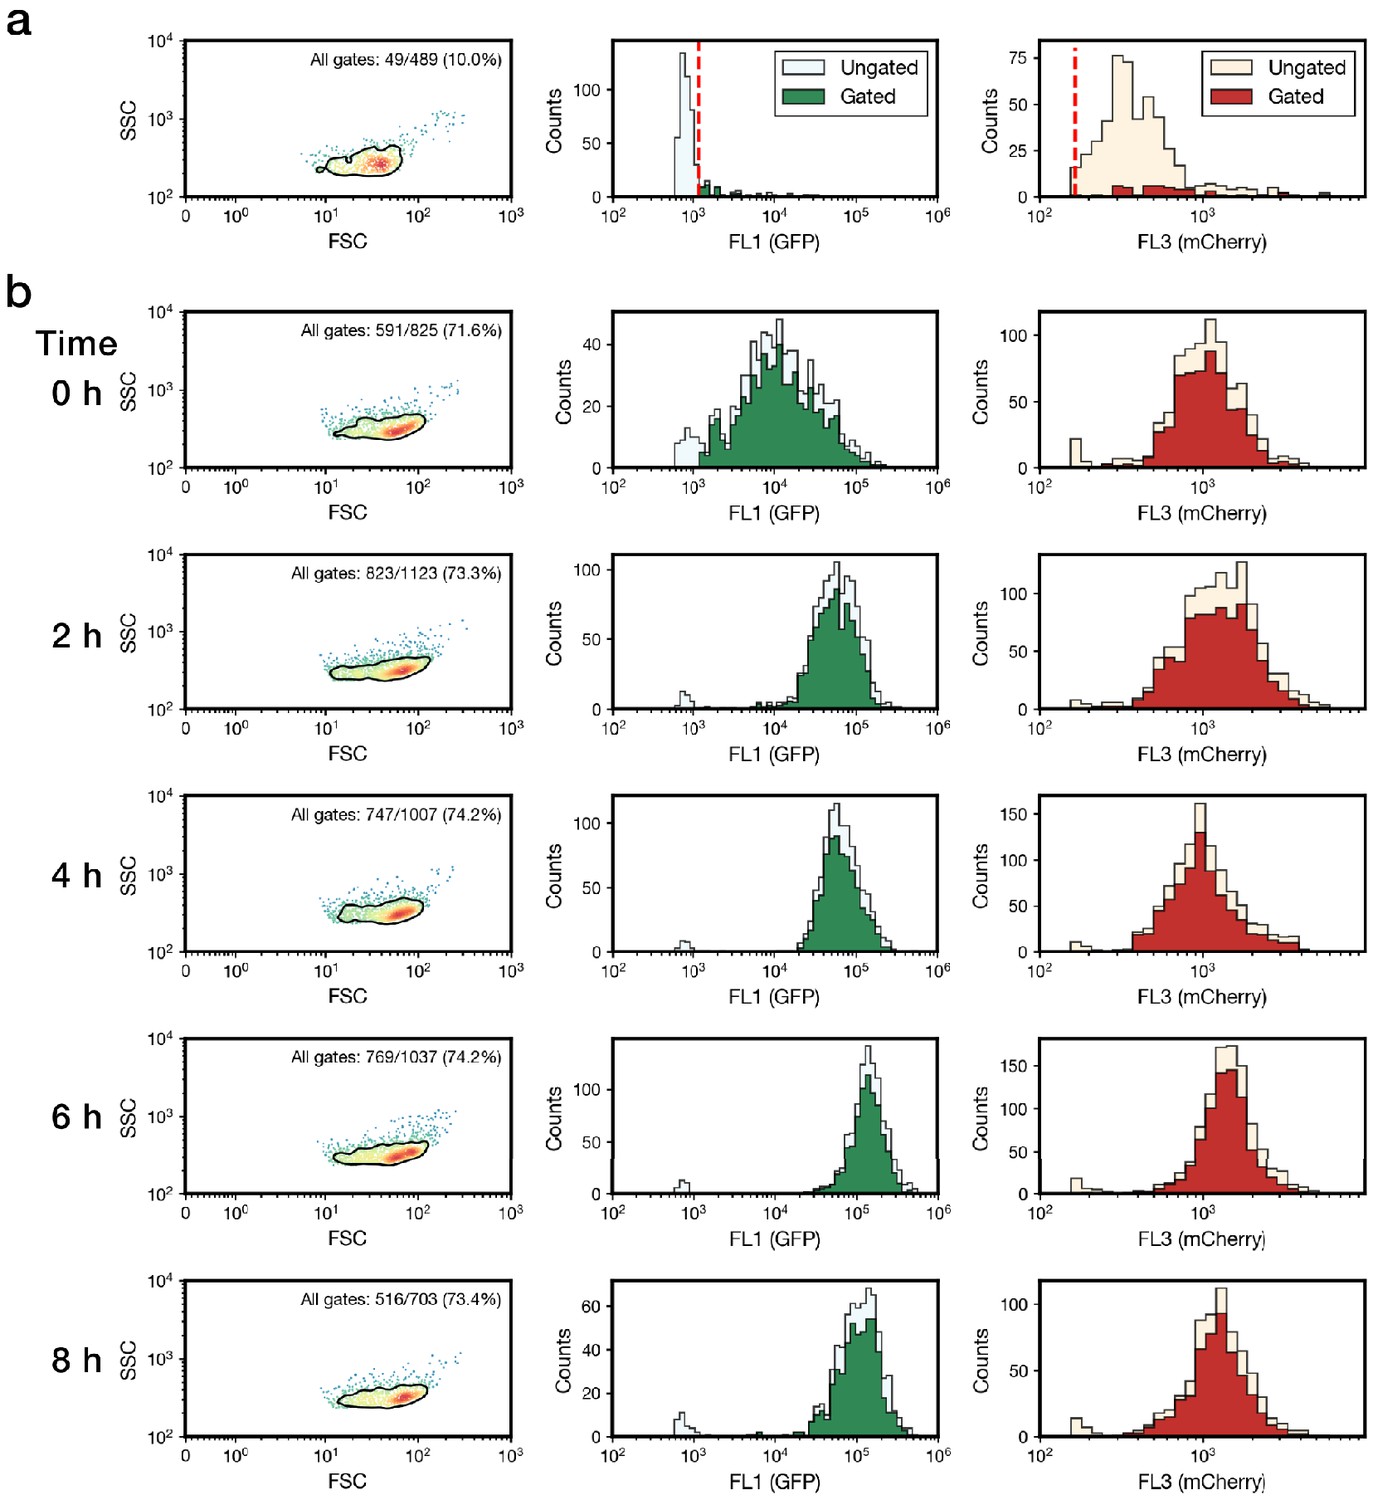
Flow cytometry gating.
(a) Strain LH05 (Supplementary file 1b), which expresses only mCherry, was fed to worms, isolated, and analyzed by flow cytometry to quantify E. coli autofluorescence through the FL1 (GFP) channel. To eliminate events corresponding to cytometer noise and autofluorescence of homogenized worm samples, three gates were then applied: (1) a density gate for the most homogeneous 75% of samples in forward scatter (FSC) vs side-scatter (SSC) (the area within the bold black line in the plots in Column 1), (2) a threshold gate on the FL1 (GFP) channel (marked by a red dashed line; Methods), and (3) a threshold gate for events exhibiting high FL3 (mCherry, red dashed line; Methods). (b) Applying these gates to samples from the step ON experiment (Figure 1e) reveals robust isolation of bacteria with a FSC/SSC profile consistent with our previous in vitro experiments24,47 and an increase in expression of GFPmut3* in response to green light. Ungated data are shown for comparison to gated data in all plots.
Figure 1—figure supplement 3
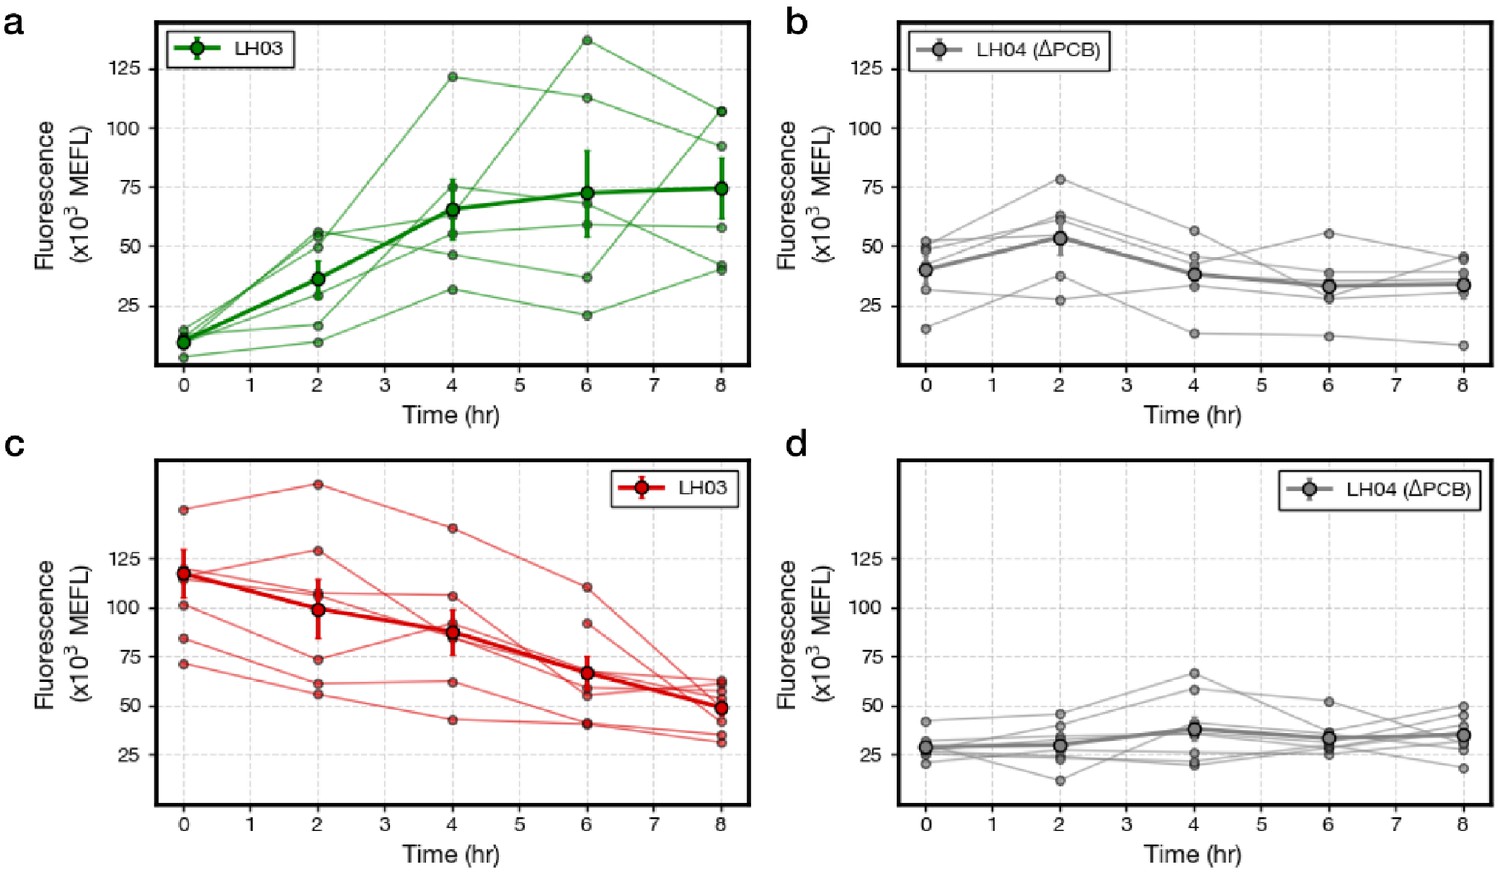
Gene expression dynamics from flow cytometry experiments.
(a) LH03 and (b) LH04 (ΔPCB) step ON results. (c) LH03 and (d) LH04 (ΔPCB) step OFF results. Each individual trajectory (faint lines) corresponds to a single biological replicate. A biological replicate comprises the homogenized contents of five worms collected on a single day. Each biological replicate on a given plot was run on a different day. Population medians taken across all trajectories are shown in bold (Methods). Data are composed of six and eight trajectories in the step ON and step OFF experiments, respectively. Error bars: SEM.
Figure 1—figure supplement 4
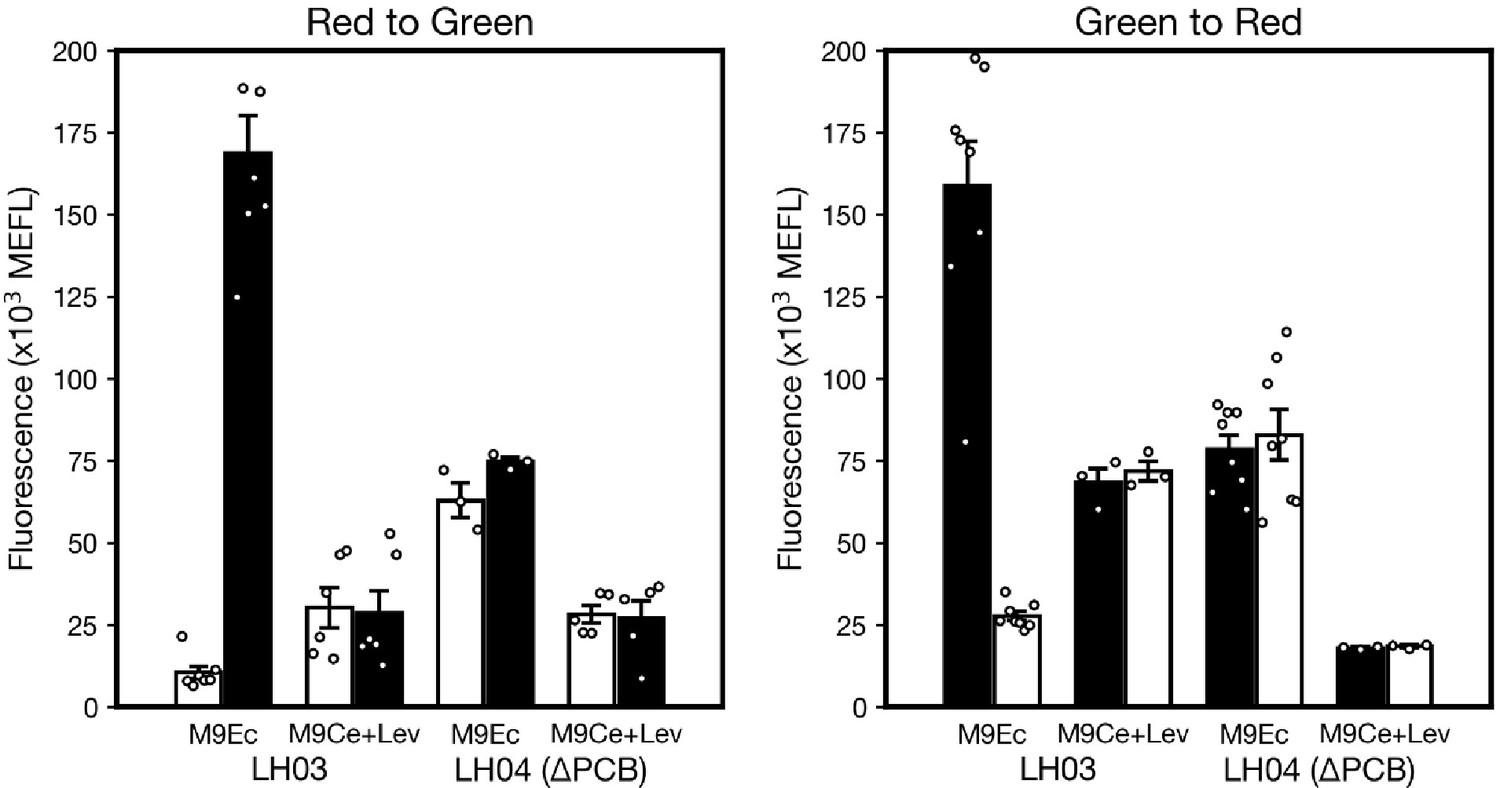
Bacteria on the exterior of worms do not contribute to the measured light response in flow cytometry experiments.
Worms were suspended in clear tubes containing M9Ce+Lev media and levamisole in the flow cytometry experiments. To demonstrate that bacterial cells outside the worm gut (e.g. on the exterior of the worm) do not respond to light in these conditions, samples of pre-conditioned bacteria from the NGM plates were suspended in the M9Ce+Lev or E. coli M9 media supplemented with casamino acids and glucose (M9Ec). These samples were then exposed to either green or red light for 8 hr, then measured via flow cytometry after the fluorophore maturation protocol (Methods). As expected, the bacterial populations are only responsive to light when grown in M9Ec and when the PCB operon is intact (strain JW1935-1/pLH405/pSR43.6, aka LH03). We conclude that the responses shown in data in Figure 1e–f and Figure 1—figure supplement 3 are not due to bacteria outside the worm, nor to bacteria that escape the worm over the course of the experiment, as such cells do not respond to light in the experimental buffer (M9Ce). Data represent 7, 6, 3, and 5 replicates (left); and 8, 3, 8, and 3 replicates (right) over 8 and 10 days, respectively; error bars: SEM. Individual data points for each condition are overlaid as white markers.
Figure 2

Optogenetic control of colanic acid biosynthesis.
(a) Strain MVK29, harboring two plasmids: pSR43.6, which encodes the biosynthesis of the PCB chromophore, and pMK201.2, which includes rcsA under the optogenetic control of CcaSR. RcsA activates transcription of the CA biosynthetic operon, ultimately producing CA. (b) CA secretion levels for MVK29 and control strains exposed to red and green light. JW1935-1 is the E. coli rcsA background strain used in this study. N.D.: below assay limit of detection. (c) Green light intensity versus CA secretion level for MVK29. Data points represent three biological replicates collected on a single day. Dashed line: limit of detection. Error bars indicate standard deviation of the three biological replicates.
Figure 3 with 1 supplement
Light-regulated CA secretion modulates C.elegans mitochondrial dynamics.
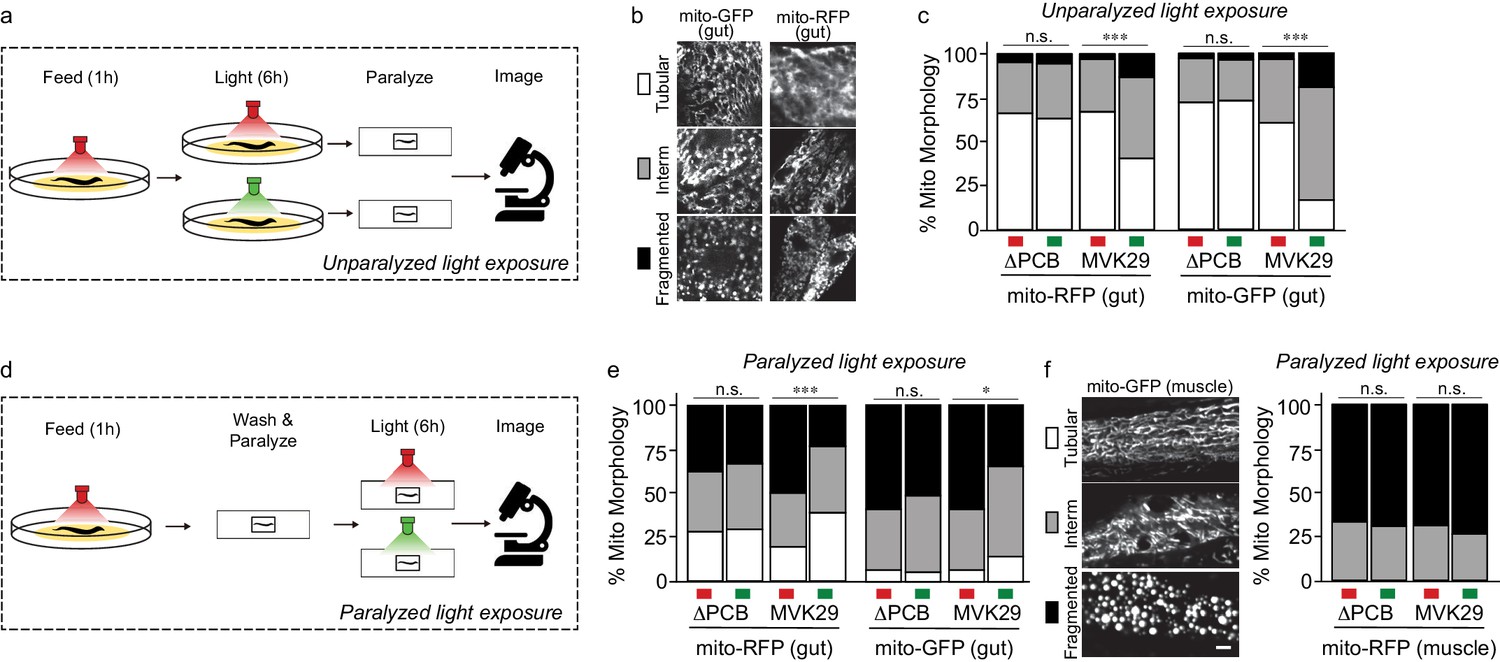
(a) Schematic of experiment for activating CA biosynthesis in situ using unparalyzed light-exposure conditions. (b) Representative images of the mitochondrial network of anterior intestinal cells visualized by either mitochondrially-localized GFP (mito-GFP) or RFP (mito-RFP) immediately distal to the pharynx are scored as fragmented, intermediate, or tubular. Scale bars: 5 μm. (c) Mitochondrial morphology profiles of intestinal cells in unparalyzed worms fed MVK29 while exposed to red or green light for 6 hr. (d) Schematic of experiment for activating CA biosynthesis in situ using paralyzed light-exposure conditions (e) Mitochondrial morphology profiles of intestinal cells in worms fed the indicated strain, and then paralyzed for 6 hr while exposed to red or green light. (f) Representative images of mitochondrial morphology in muscular cells, and the quantification of these images using worms fed the indicated strain, and then paralyzed for 6 hr while exposed to red or green light. The Chi-Squared Test of Homogeneity was used to calculate p-values between conditions in c, e, and f. Combined results are shown from multiple independent replicates and see Figure 3—figure supplement 1 for data of each replicate.
Figure 3—figure supplement 1
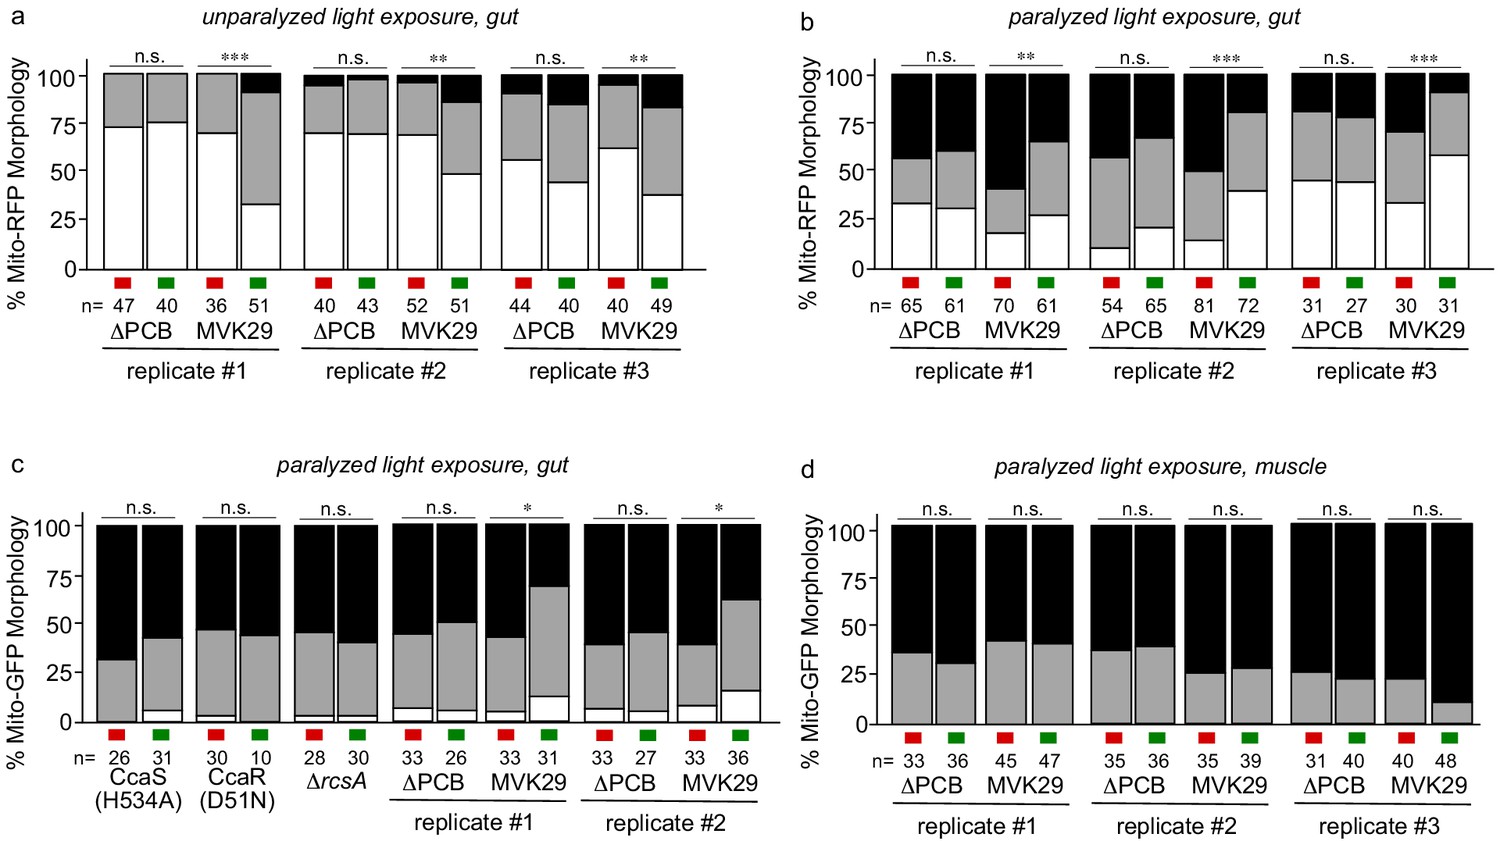
Optogenetic induction of CA in situ regulates mitochondrial dynamics in the gut of C.elegans.
(a) Mitochondrial morphology profiles of intestinal cells in unparalyzed worms fed the indicated strain while exposed to red or green light for 6 hr. The combined result is presented in Figure 3c. (b,c) Mitochondrial morphology profiles of intestinal cells in worms fed the indicated strain, and then paralyzed for 6 hr while exposed to red or green light. The combined result is presented in Figure 3e. (d) Mitochondrial morphology profiles of muscle cells in worms fed the indicated strain, and then paralyzed for 6 hr while exposed to red or green light. The combined result is presented in Figure 3f. **p<0.01, ***p<0.001 by the Chi-Squared Test of Homogeneity.
Figure 4 with 1 supplement
Optogenetically-regulated CA biosynthesis extends worm lifespan.
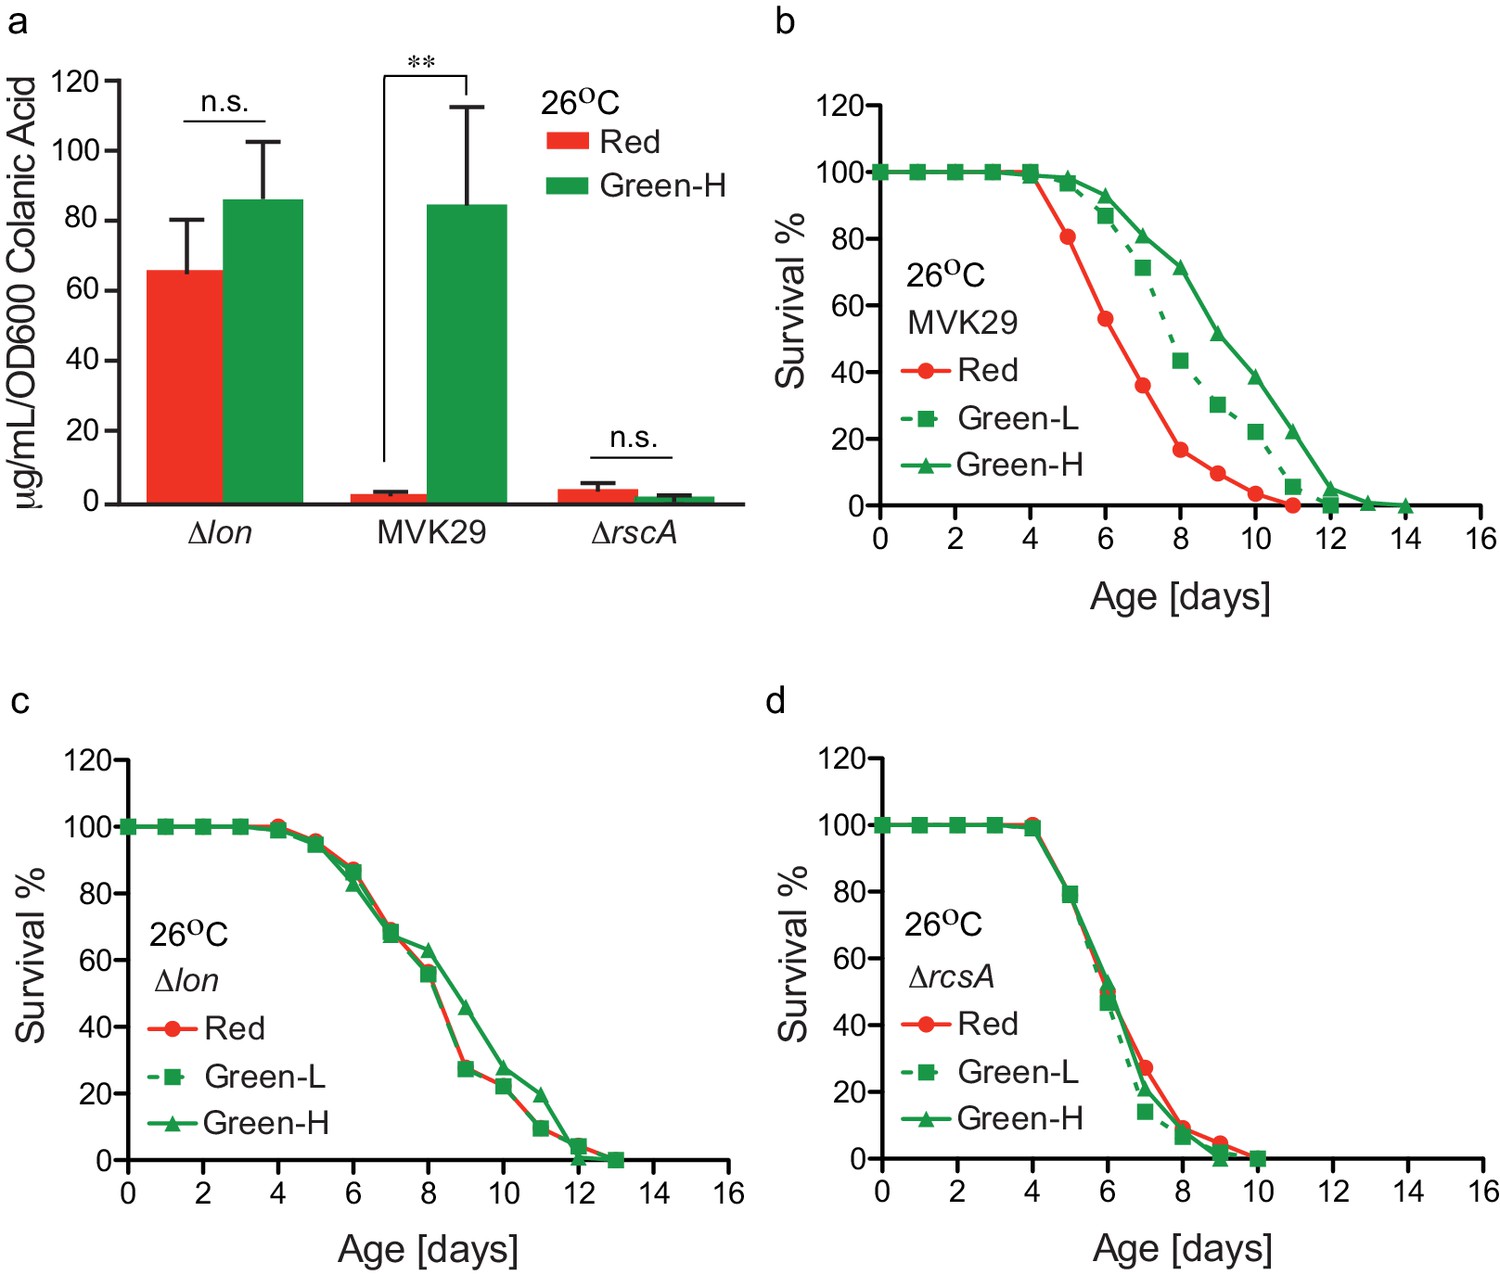
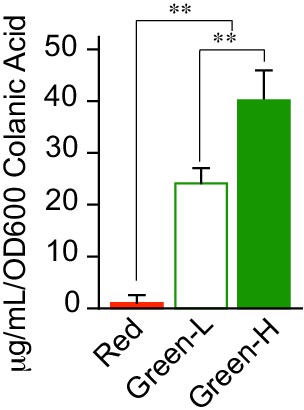
(a) Green light induces CA overproduction in MVK29 to a level comparable to the ∆lon mutant, and neither the ∆lon or the ∆rcsA mutant changes its CA levels in response to the green light exposure. Green-H indicates a high green light intensity yielding high levels of CA production. **p<0.01 by student’s t-test. Experiments were conducted at 26°C. (b) When exposed to green light, worms grown on MVK29 live longer than those exposed to red light, and the magnitude of lifespan extension correlates with green light intensity (p<0.0001 green vs. red, log-rank test). Green-L indicates a low level of green light intensity resulting in intermediate levels of CA production. Experiments were conducted at 26°C. (c–d) The lifespans of worms grown on the ∆lon (c) or the ∆rcsA (d) controls are not affected by light condition (p>0.1 green vs. red, log-rank test). Experiments were conducted at 26°C.
Figure 4—figure supplement 1
Light intensity calibration.
Calibration of light intensities used to compare CA secretion levels from MVK29 to those from Δlon and ΔrcsA in Figure 4. **p<0.01 by student’s t-test.
Tables
Key resources table
| Reagent type (species) or resource | Designation | Source or reference | Identifiers | Additional information |
|---|---|---|---|---|
| Recombinant DNA reagent | pLH401 | This paper | GenBank: MN617156 | Constitutive ccaR expression, PcpcG2-172:sfgfp, constitutive mcherry expression |
| Recombinant DNA reagent | pLH405 | This paper | GenBank: MN617157 | PcpcG2-172:gfpmut3*, constitutive mcherry expression |
| Recombinant DNA reagent | pLH407 | This paper | GenBank: MN617158 | Constitutive mcherry expression |
| Recombinant DNA reagent | pLH412 | This paper | GenBank: MN617159 | Constitutive ccaS(H534A), ho1, and pcyA expression |
| Recombinant DNA reagent | pLH413 | This paper | GenBank: MN617160 | Constitutive ccaR(D51N) expression, PcpcG2-172:rcsA |
| Recombinant DNA reagent | pSR43.6 | Schmidl et al., 2014 | GenBank: MN617163 | Constitutive expression of ccaS, ho1, and pcyA |
| Recombinant DNA reagent | pSR49.2 | Schmidl et al., 2014 | GenBank: MN617164 | Constitutive expression of ccaS |
| Recombinant DNA reagent | pMVK201.2 | This paper | GenBank: MN617161 | Constitutive expression of ccaR, PcpcG2-172:rcsA |
| Recombinant DNA reagent | pMVK228 | This paper | GenBank: MN617162 | Constitutive expression of ccaS |
| Stain, strain background (Escherichia coli) | BW25113 | Baba et al., 2006 | CGSC#: 7626 | Keio parent strain |
| Stain, strain background (Escherichia coli) | ΔrcsA | Baba et al., 2006 | CGSC: JW1935-1 | Low CA production mutant from the Keio collection |
| Stain, strain background (E. coli) | Δlon | Baba et al., 2006 | CGSC: JW0429-1 | High CA production mutant from the Keio collection |
| Genetic reagent (C. elegans) | zu391 | Hermann et al., 2005 | CGC ID: JJ1271 | glo-1(zu391) X |
| Genetic reagent (C. elegans) | zcIs17 | Han et al., 2017 | CGC ID: SJ4143 | zcIs17[Pges-1::mito-GFP] |
| Genetic reagent (C. elegans) | zcIs14 | Han et al., 2017 | CGC ID: SJ4103 | zcIs14[Pmyo-3::mito-GFP] |
| Genetic reagent (C. elegans) | MW2241 | This paper | raxIs145[Pges-1::mito-RFP] | |
| Genetic reagent (C. elegans) | e2117 | Han et al., 2017 | CGC ID: CB4121 | sqt-3(e2117) V |
Additional files
-
Supplementary file 1
Supplementary Tables.
(a) Table of plasmids used in this study. (b) Table of bacterial and worm strains used in this study (c) Statistical analysis of worm lifespan experiments
- https://cdn.elifesciences.org/articles/56849/elife-56849-supp1-v1.docx
-
Transparent reporting form
- https://cdn.elifesciences.org/articles/56849/elife-56849-transrepform-v1.docx
Download links
A two-part list of links to download the article, or parts of the article, in various formats.
Downloads (link to download the article as PDF)
Open citations (links to open the citations from this article in various online reference manager services)
Cite this article (links to download the citations from this article in formats compatible with various reference manager tools)
Optogenetic control of gut bacterial metabolism to promote longevity
eLife 9:e56849.
https://doi.org/10.7554/eLife.56849


