Mechanical inhibition of isolated Vo from V/A-ATPase for proton conductance
- Department of Molecular Biosciences, Kyoto Sangyo University, Kamigamo-Motoyama, Japan
- Institute for Protein Research, Osaka University, Japan
- Research Center for Ultra-High Voltage Electron Microscopy, Osaka University, Research Center for Ultra-High Voltage Electron Microscopy, Mihogaoka, Japan
- Graduate School of Frontier Biosciences, Osaka University, Japan
- RIKEN Center for Biosystems Dynamics Research and SPring-8 Center, Japan
- JEOL YOKOGUSHI Research Alliance Laboratories, Osaka University, Japan
- Department of Molecular Biology, Tokyo University of Pharmacy and Life Sciences, Horinouchi, Hachioji, Japan
Figures
Figure 1 with 1 supplement
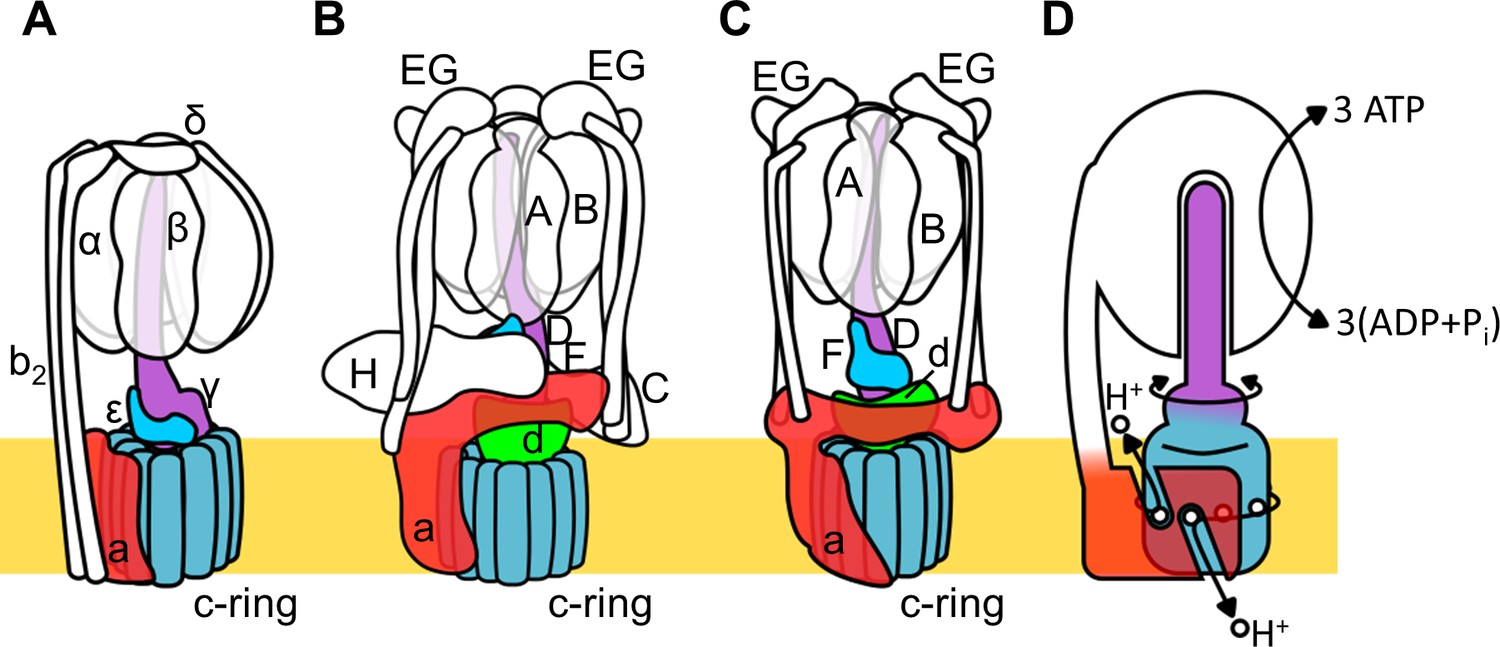
Schematic of rotary ATPase/synthases and the rotary catalytic mechanism.
(A) Bacterial FoF1, (B) yeast V-ATPase, (C) Tth V/A-ATPase, (D) a schematic model of the rotary catalytic mechanism. The subunits of the central rotor complex are colored as follows: c-ring, dark blue; a-subunit, red; central axis, purple and cyan; and d-subunit, green.
Figure 1—figure supplement 1
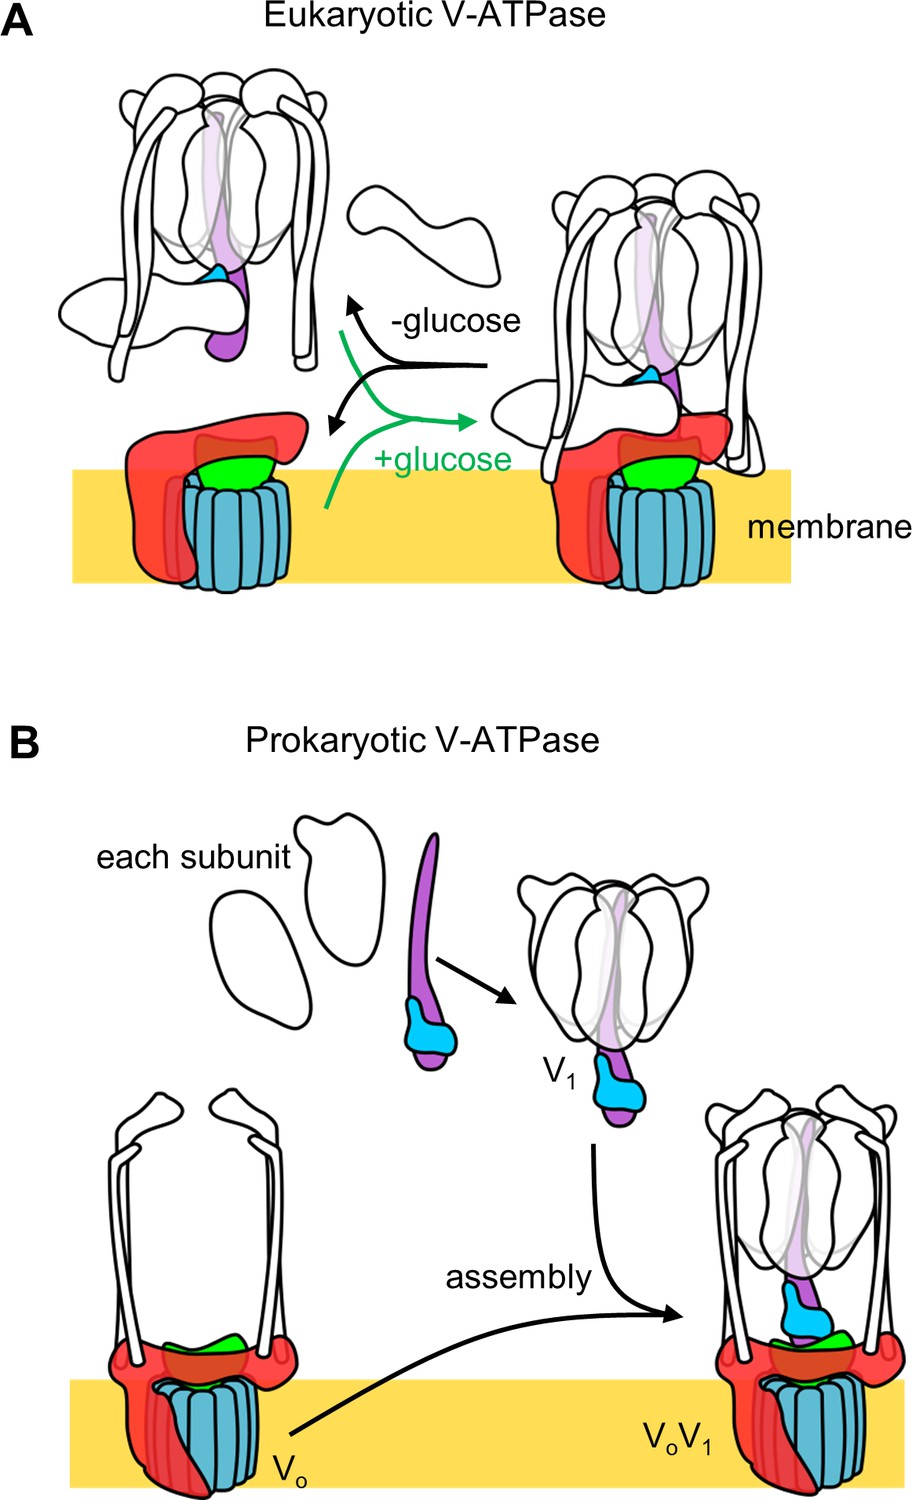
Schematic representation of reversible dissociation of the V1 domain induced by glucose depletion in yeast (A), and the assembly pathway of the holo V/A-ATPase in Tth cells (B).
Figure 2 with 7 supplements
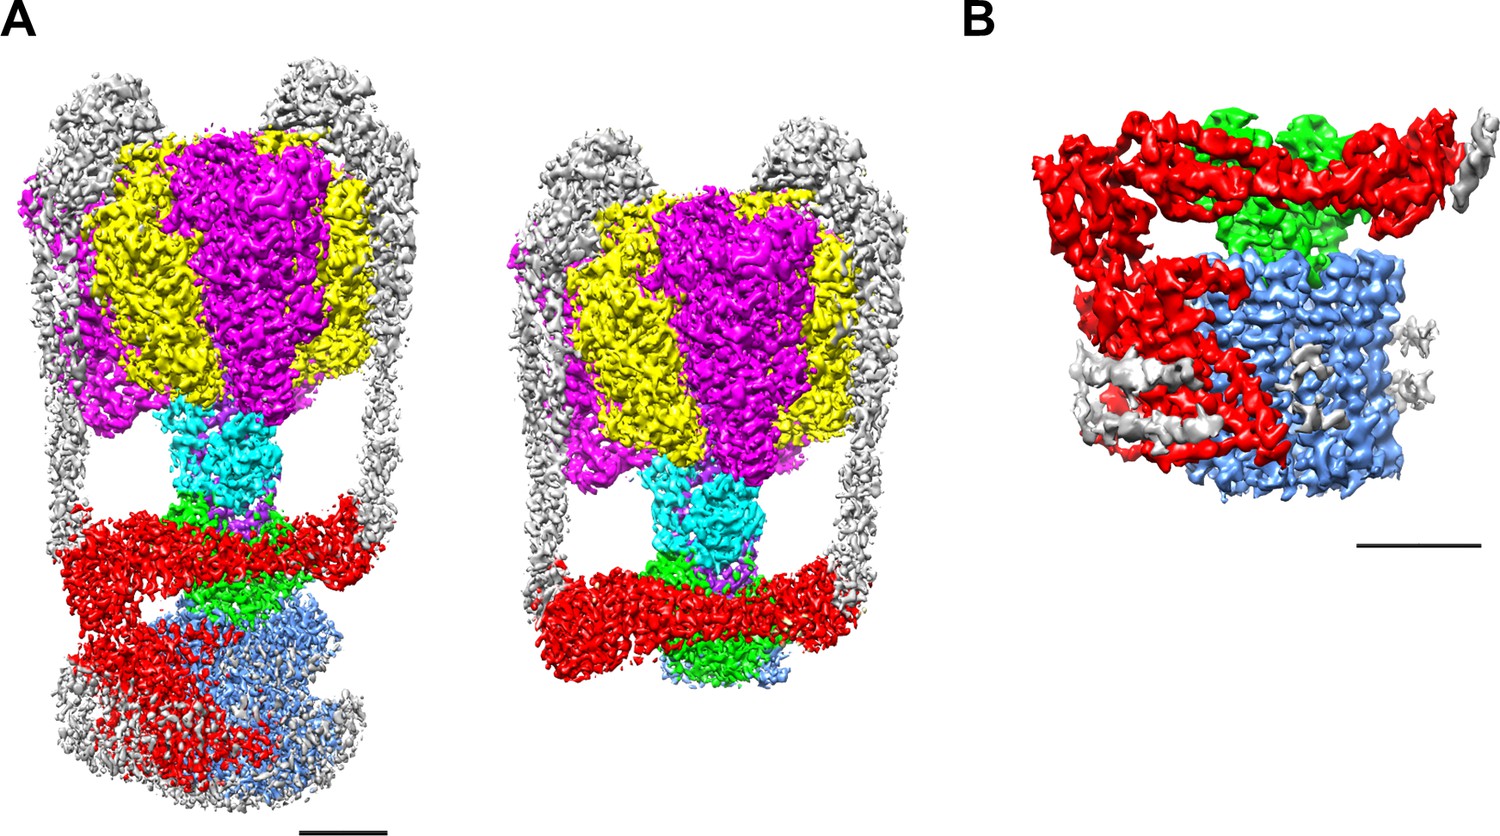
EM density map of the enzyme complex.
(A) The holo Tth V/A-ATPase (left) and the focused refined map of A3B3DFd(EG)2asol (right). (B) The isolated Vo domain. Densities corresponding to the individual subunits are colored as follows: A, magenta; B, yellow; D, purple; F, cyan; E and G, gray; a, red; d, green; and c, dark blue. Scale bar = 30 Å.
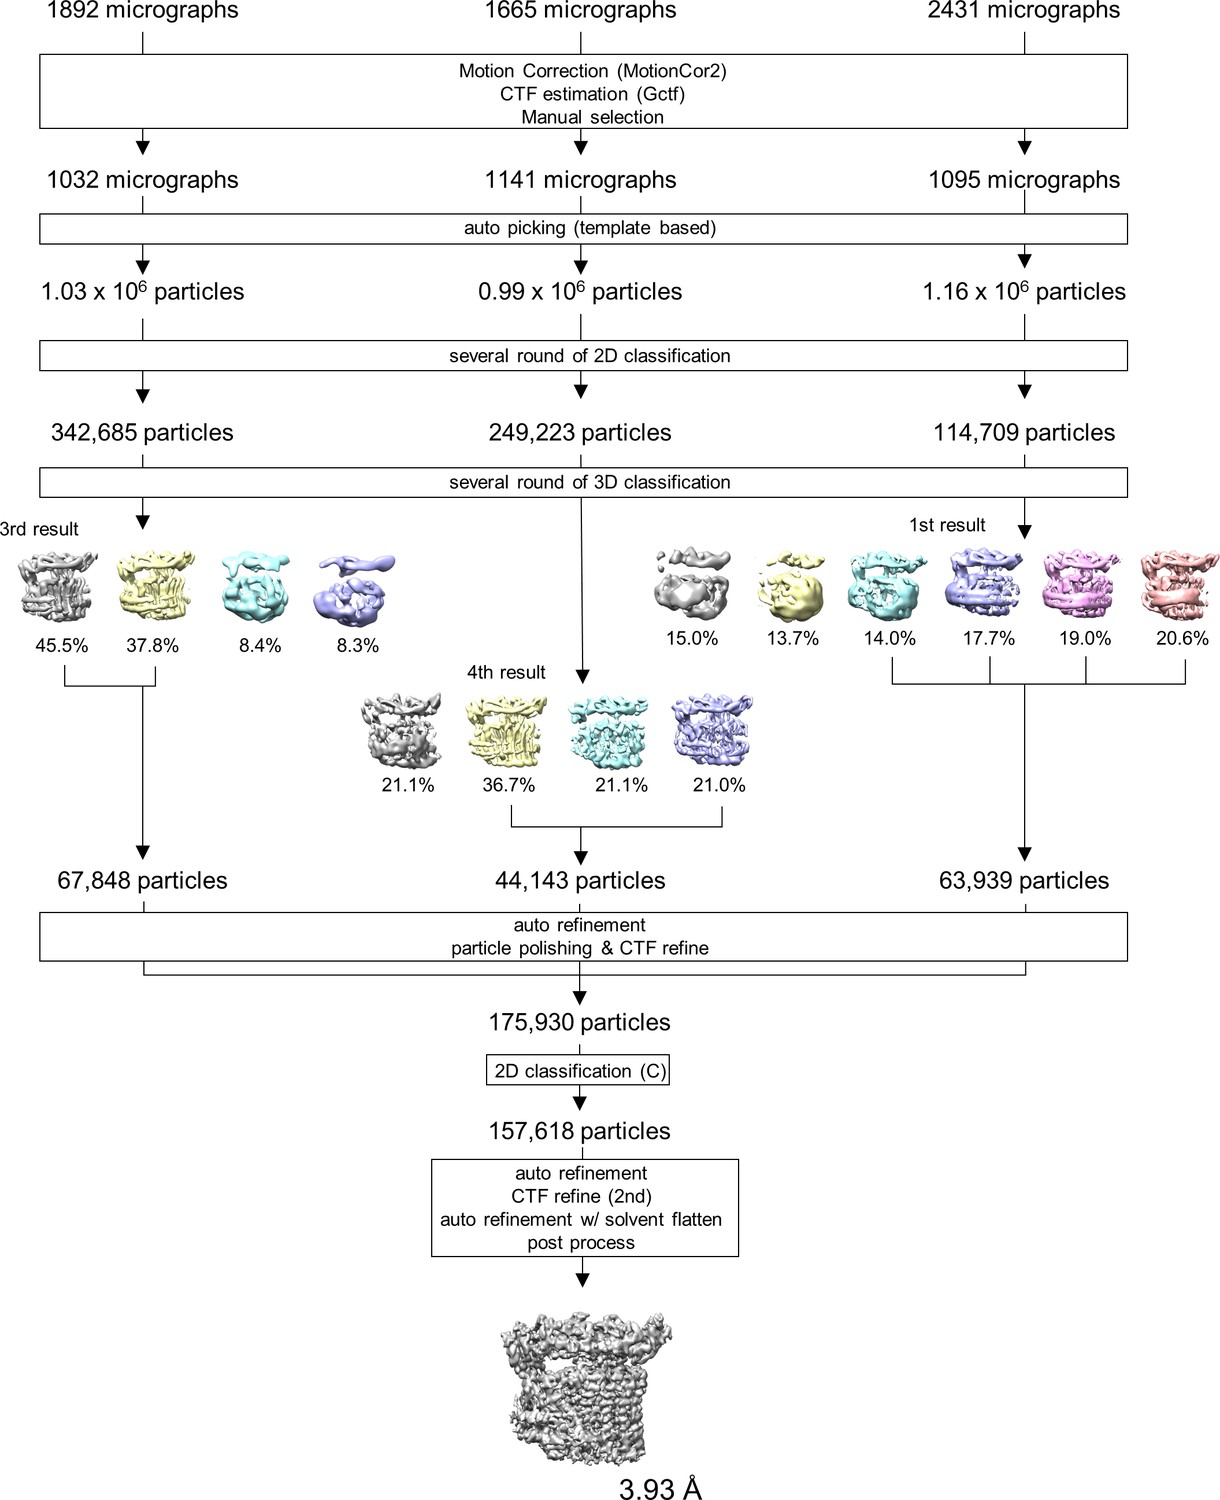
Figure 2—figure supplement 1
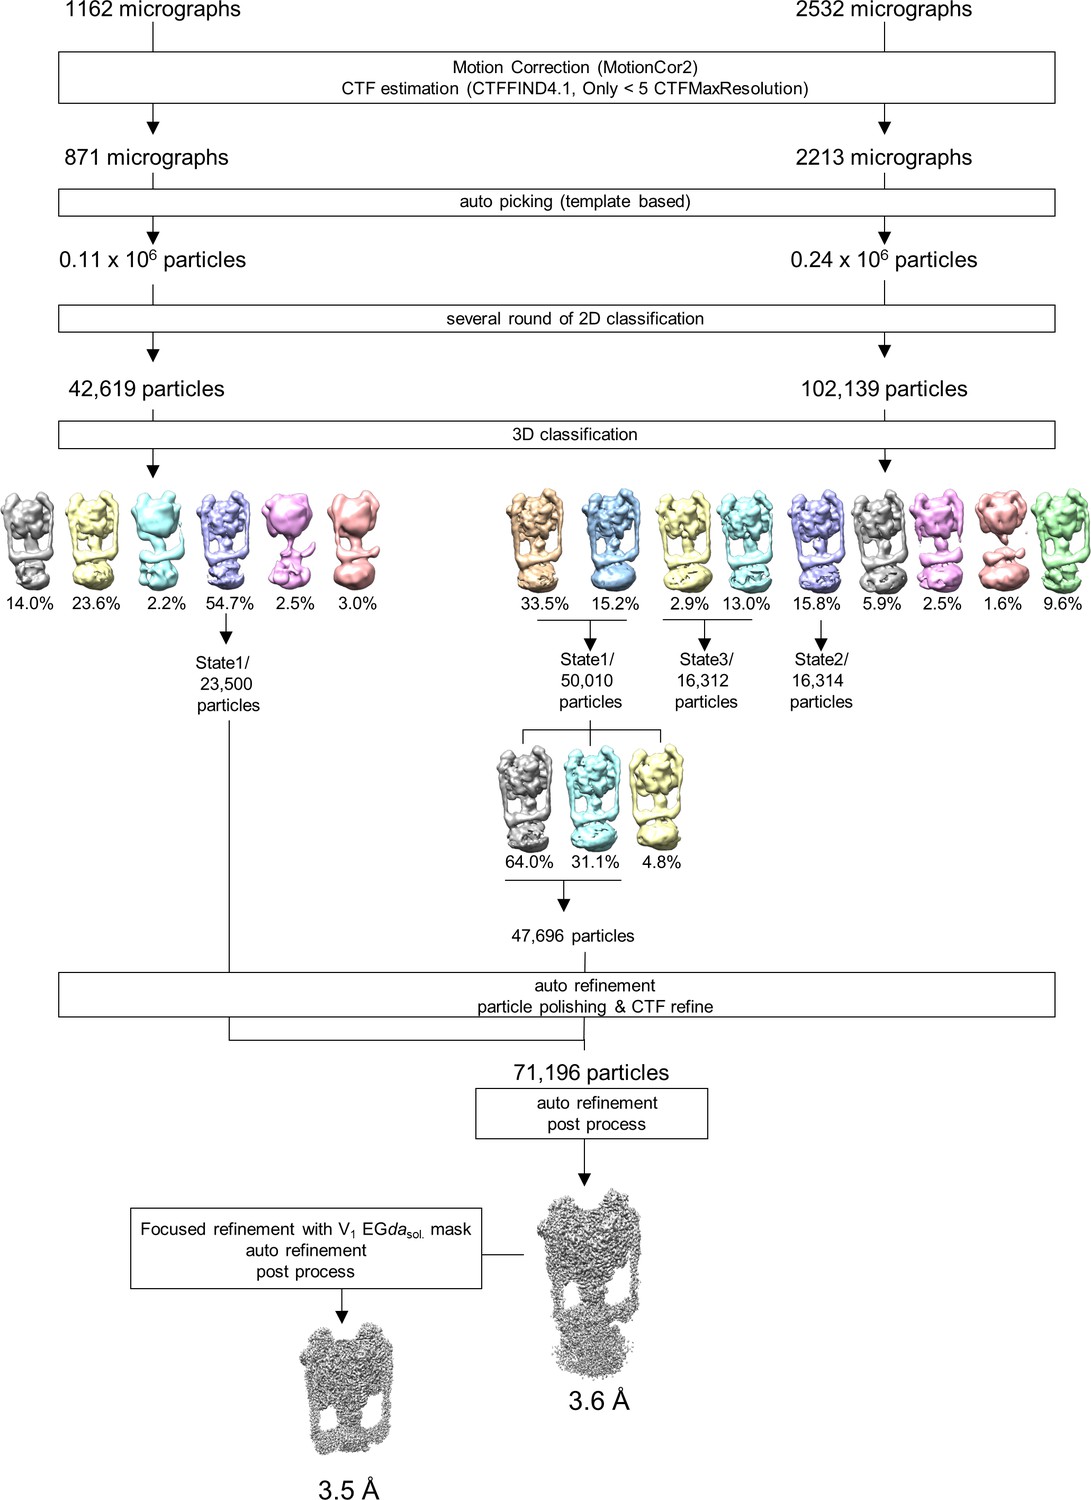
Single particle analysis of Tth V/A-ATPase.
Flow chart of the single particle analysis process for the holo TthV/A-ATPase.
Figure 2—figure supplement 2
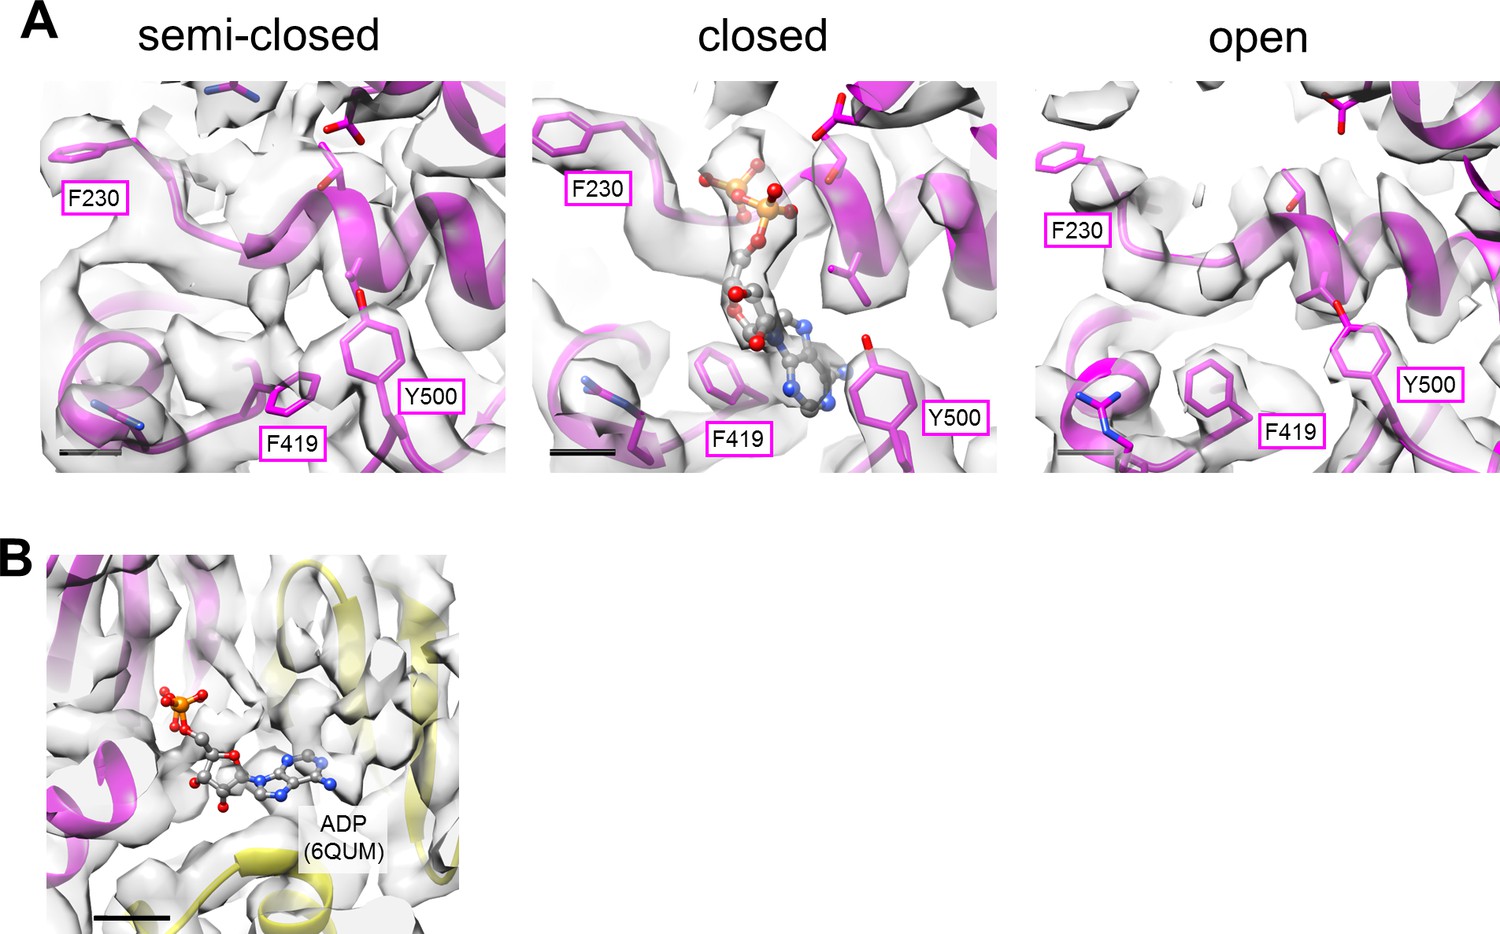
Structures of the nucleotide binding sites in the focused refined map of A3B3DFd(EG)2asol.
(A) The nucleotide binding site in a semi-closed AB pair (left), closed AB pair (center), and open AB pair (right). Some key residues of the A subunit, indicated in magenta box, are represented as sticks. ADP is shown as balls and sticks. Scale bar; 3 Å. (B) The nucleotide binding site within the crown-like structure of A3B3 proposed by Zhou and Sazanov, 2019. ADP is put in the same position as in the structure of Zhou and Sazanov (PDBID: 6QUM). Scale bar; 10 Å.
Figure 2—figure supplement 3
Single particle analysis of TthVo.
Flow chart of the single particle analysis process for the holo TthVo.
Figure 2—figure supplement 4
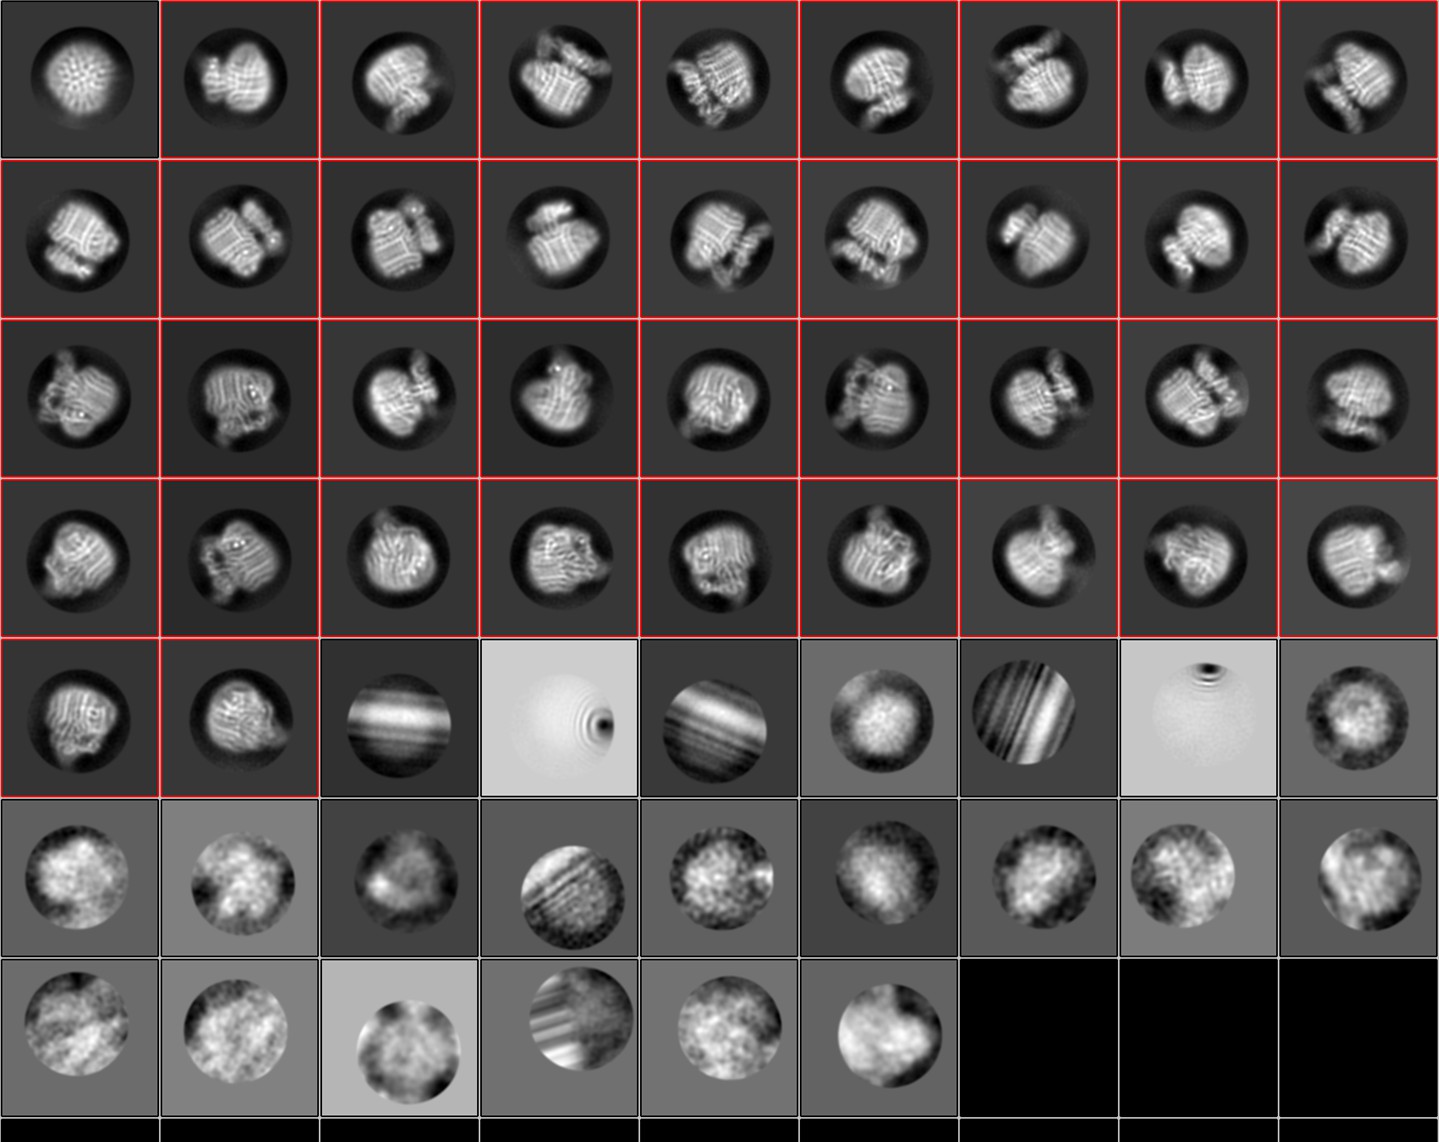
2D class averaged images of the isolated Vo using polished particles.
Figure 2—figure supplement 5
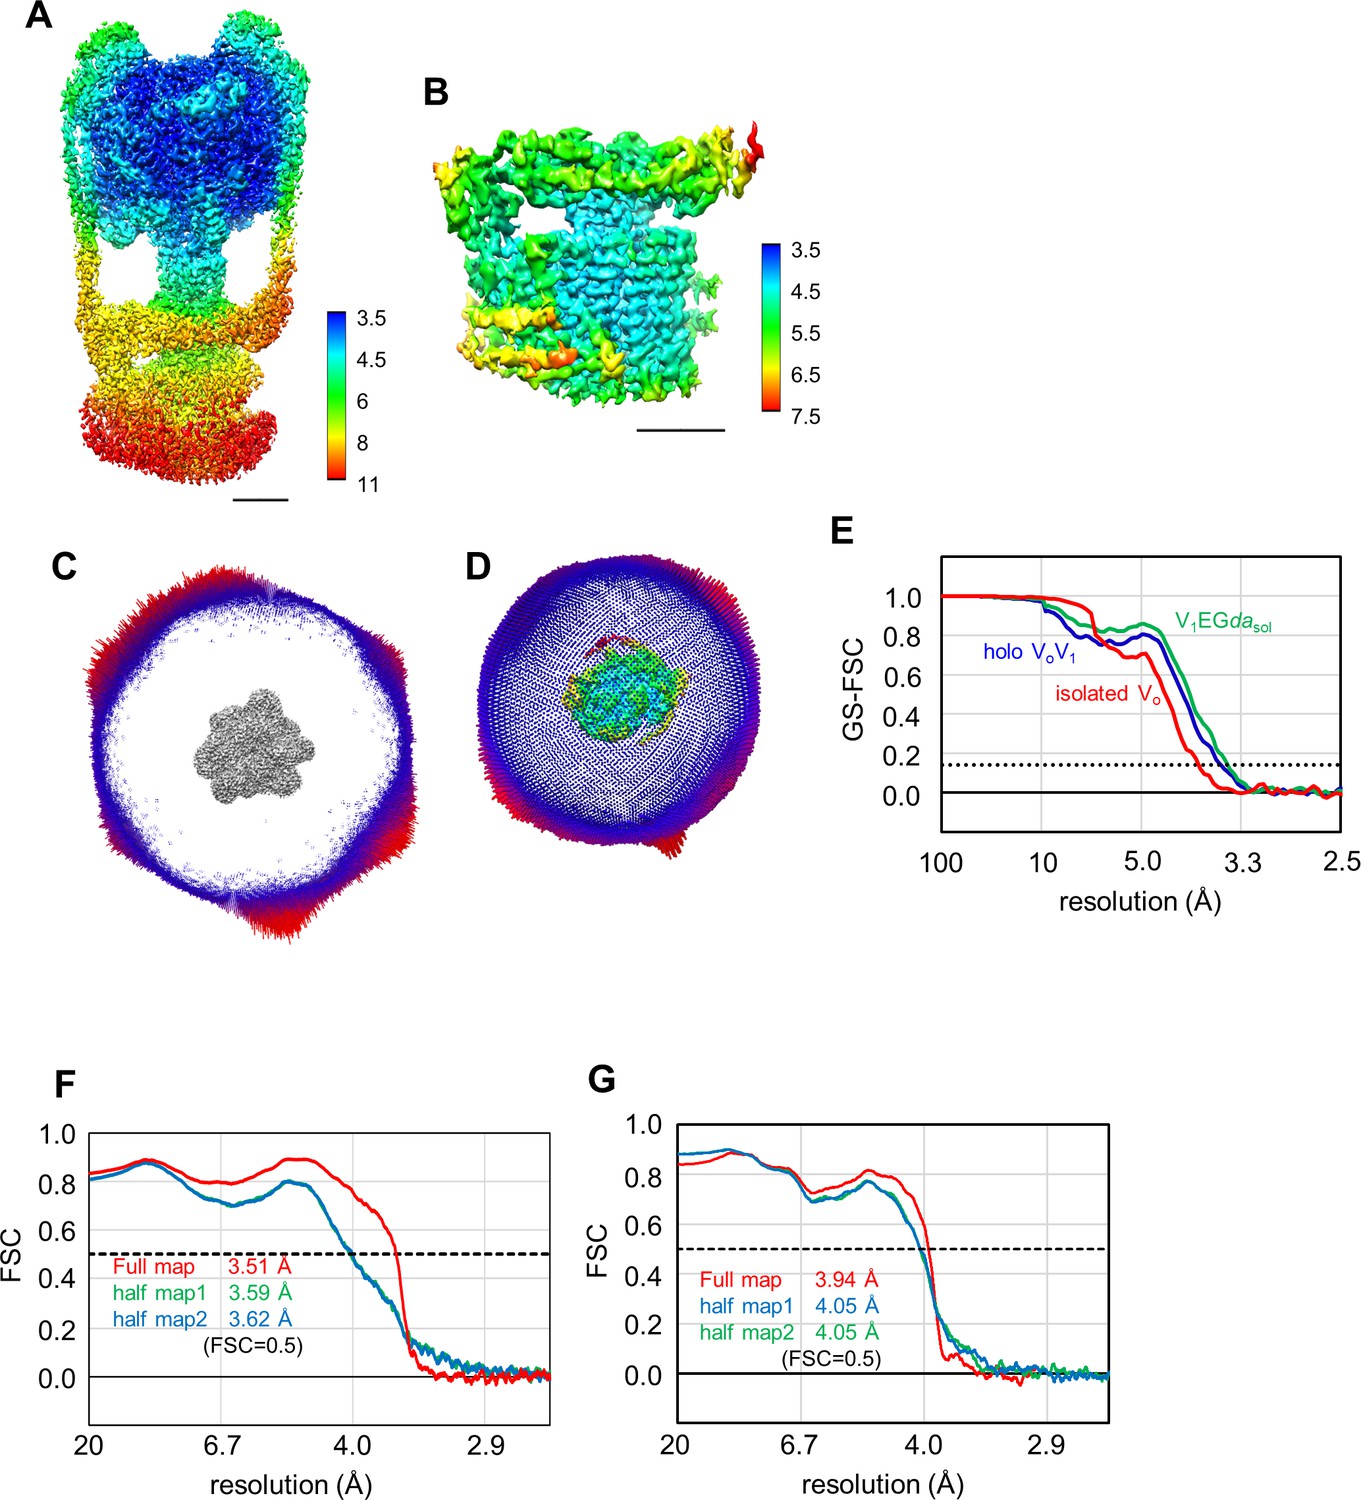
Local resolution maps of the holo TthV/A-ATPase (A) and isolated Vo (B).
Scale bar represents 50 Å for holo V/A-ATPase and 30 Å for isolated Vo. Angular distribution of particles used for final reconstruction of the holo TthV/A-ATPase (C), and isolated Vo (D). Fourier shell correlation (FSC) curves (E). Red line indicates the FSC = 0.143 criteria. FSC curves of the full map and two half maps against the built models with resolution estimated at FSC = 0.5 for V1EGdasol (F), and isolated Vo (G).
Figure 2—figure supplement 6
Representative densities with model fitting for each subunit of TthV1.
The built models are presented as ribbons and sticks. Residue numbers are indicated above the figures. Scale bar = 10 Å.
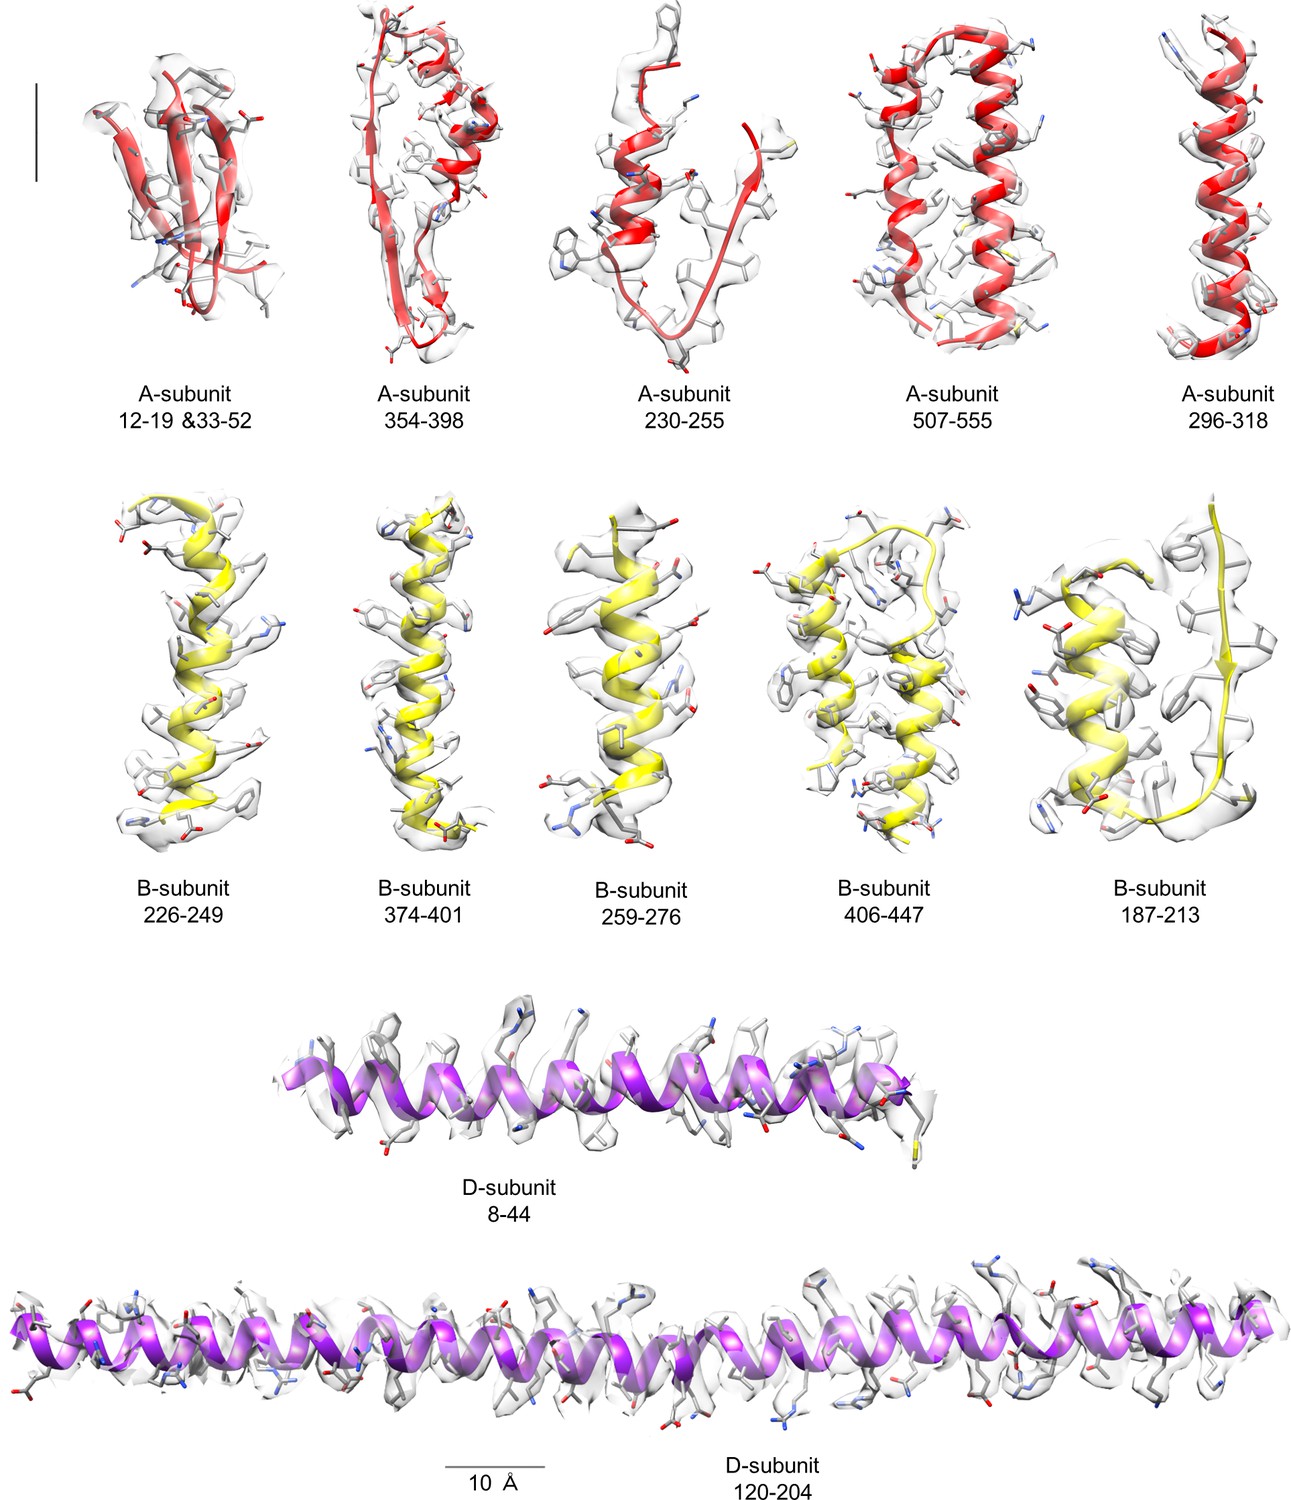
Figure 2—figure supplement 7
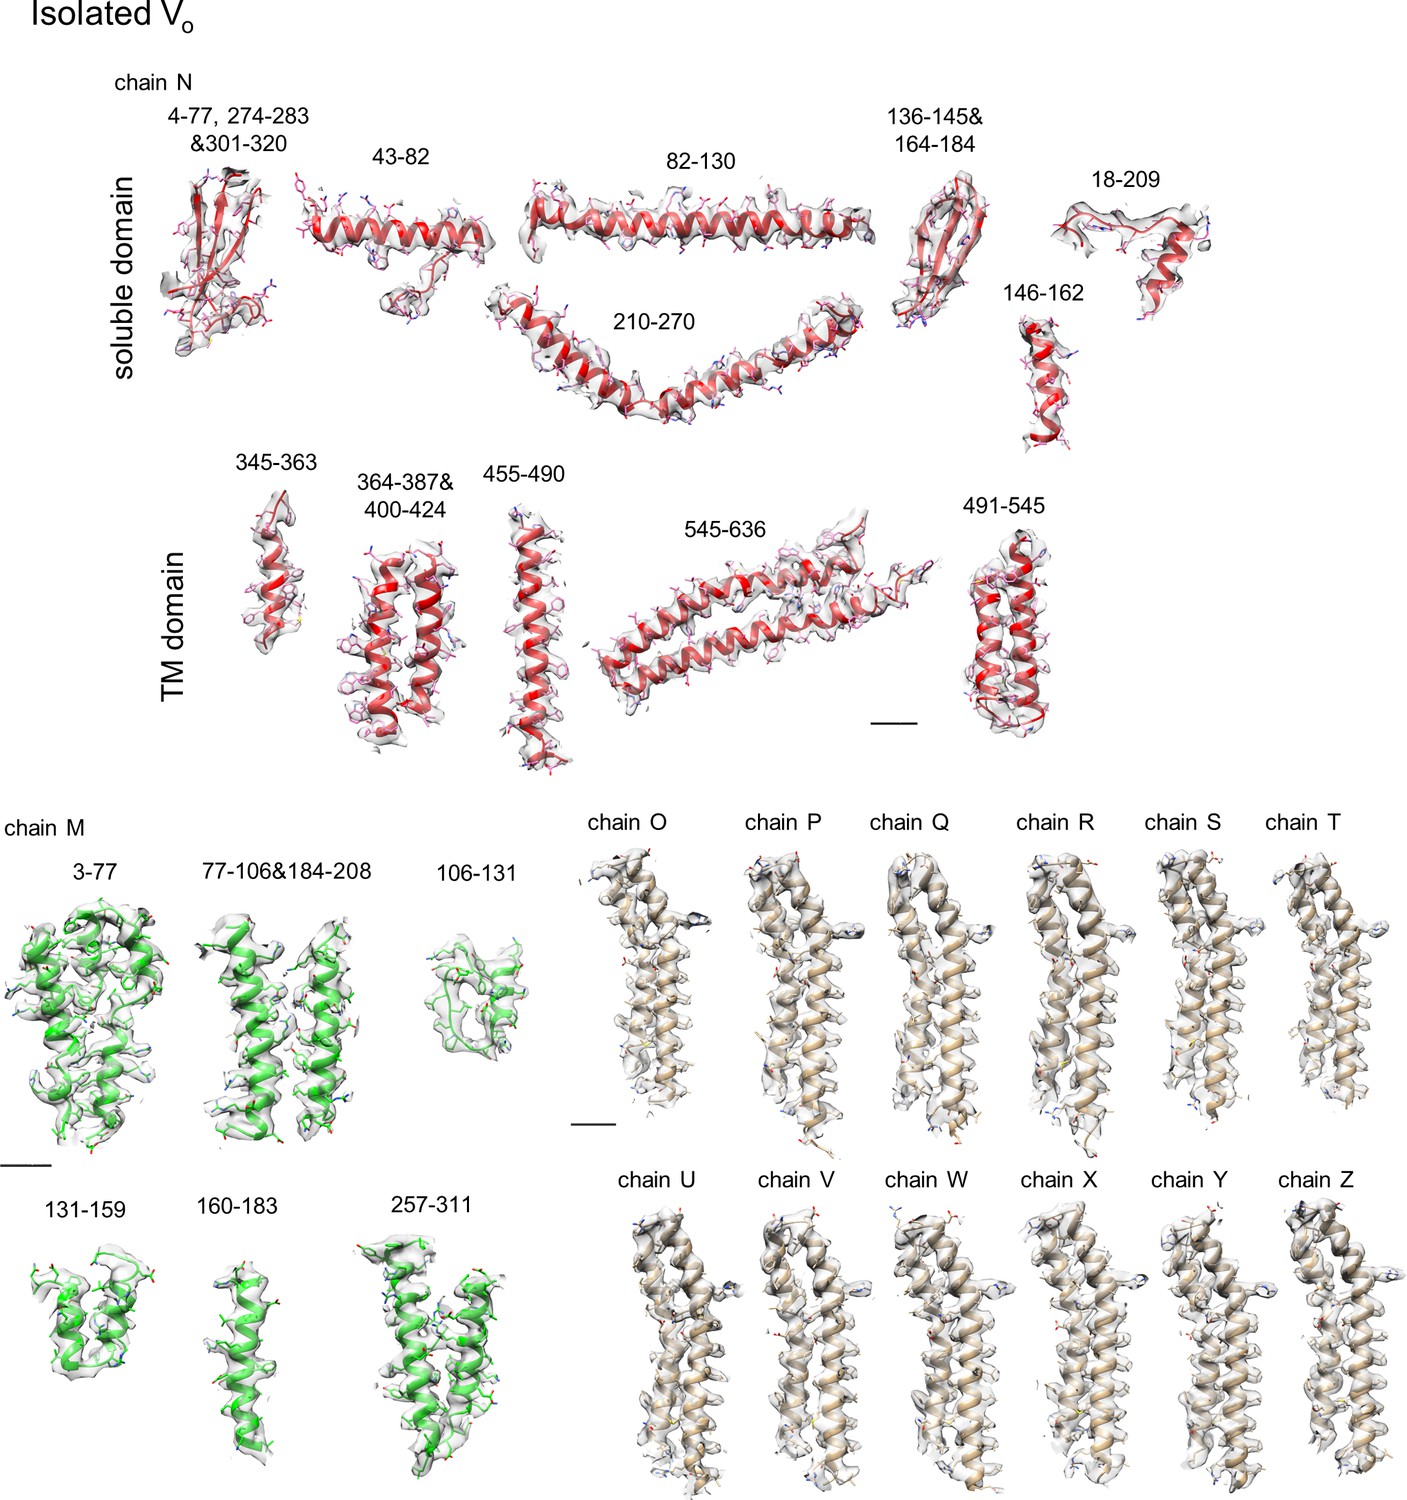
Representative densities with model fitting for each subunit of TthVo.
The built models are presented as ribbons and sticks. Residue numbers are indicated above the figures. Scale bar = 10 Å.
Figure 3 with 2 supplements
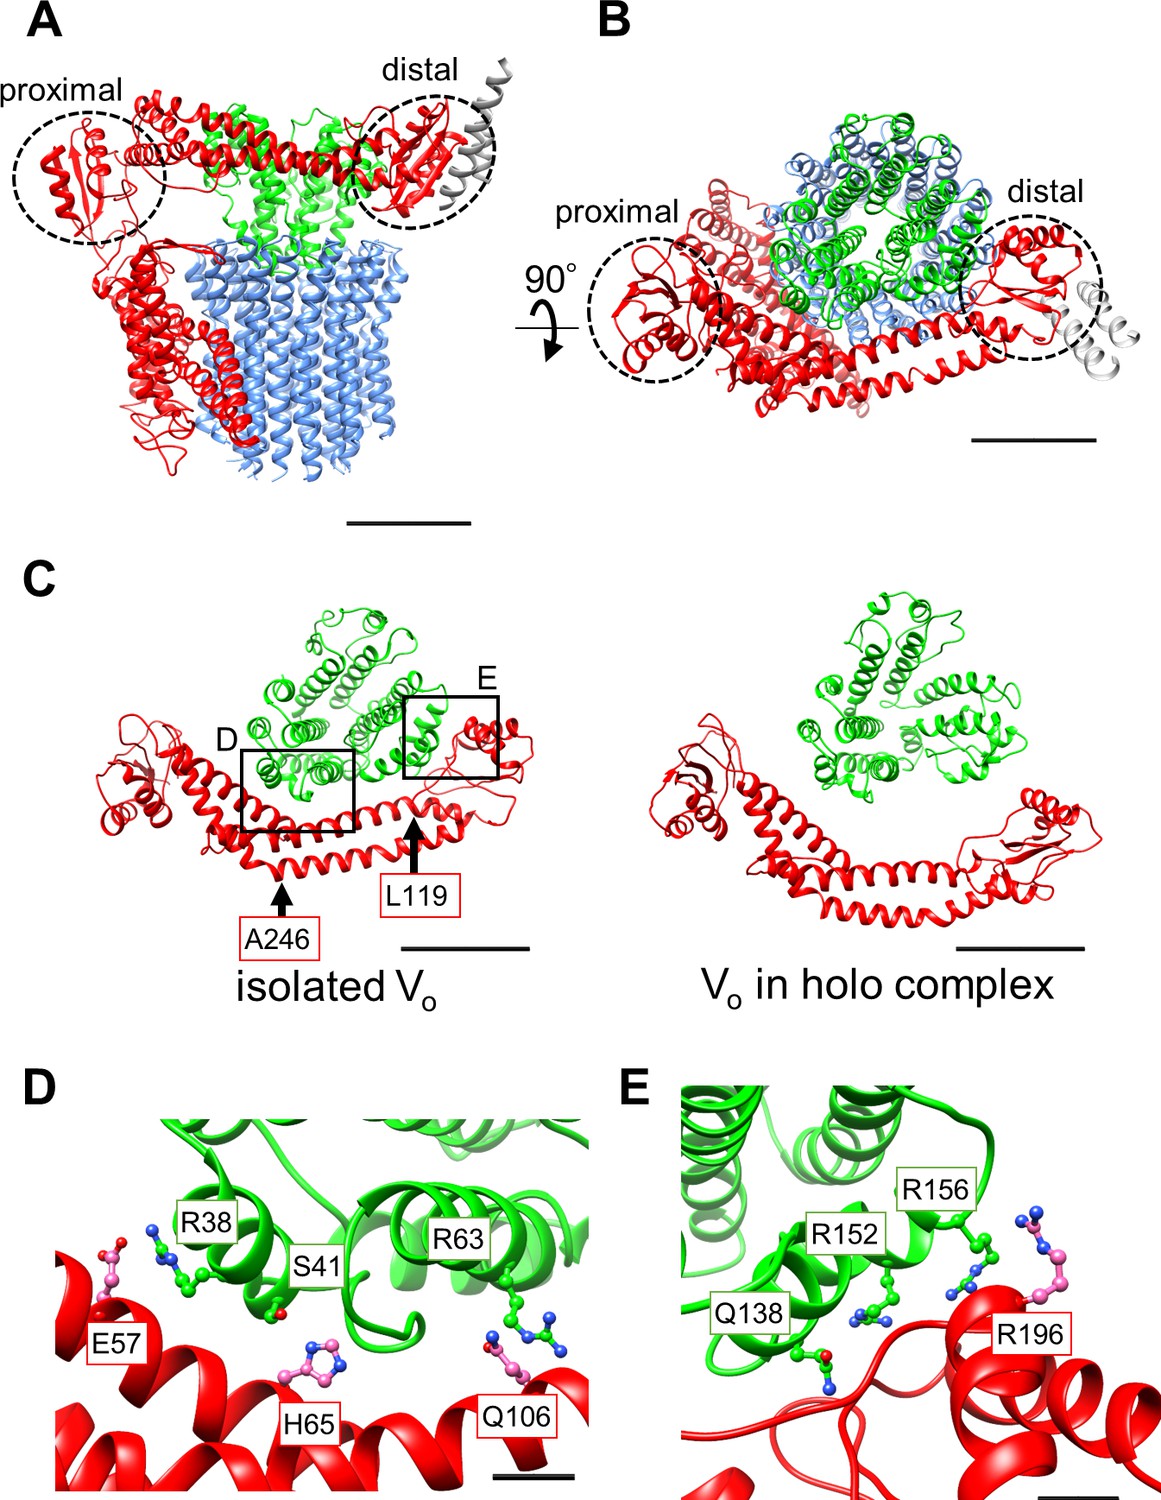
Atomic model of the isolated Vo domain.
(A) Side view and (B) top view of a-, d-, c-, and EG subunits colored as in Figure 2, respectively. Scale bar represents 30 Å. The proximal and distal subdomains of the a-subunit are circled by dotted lines. (C) Comparison of the relative positions of asol (red) and the d subunit (green) in the isolated Vo domain (left) and the Vo domain in the holo complex (right). Arrows indicate the kinking and twisting points in the asol region of the isolated Vo. Scale bar represents 30 Å. (D) and (E) Specific interactions between the asol region and d subunit at the proximal (D) and distal (E) regions. The regions are specified by black squares in C. Scale bar = 5 Å.
Figure 3—figure supplement 1
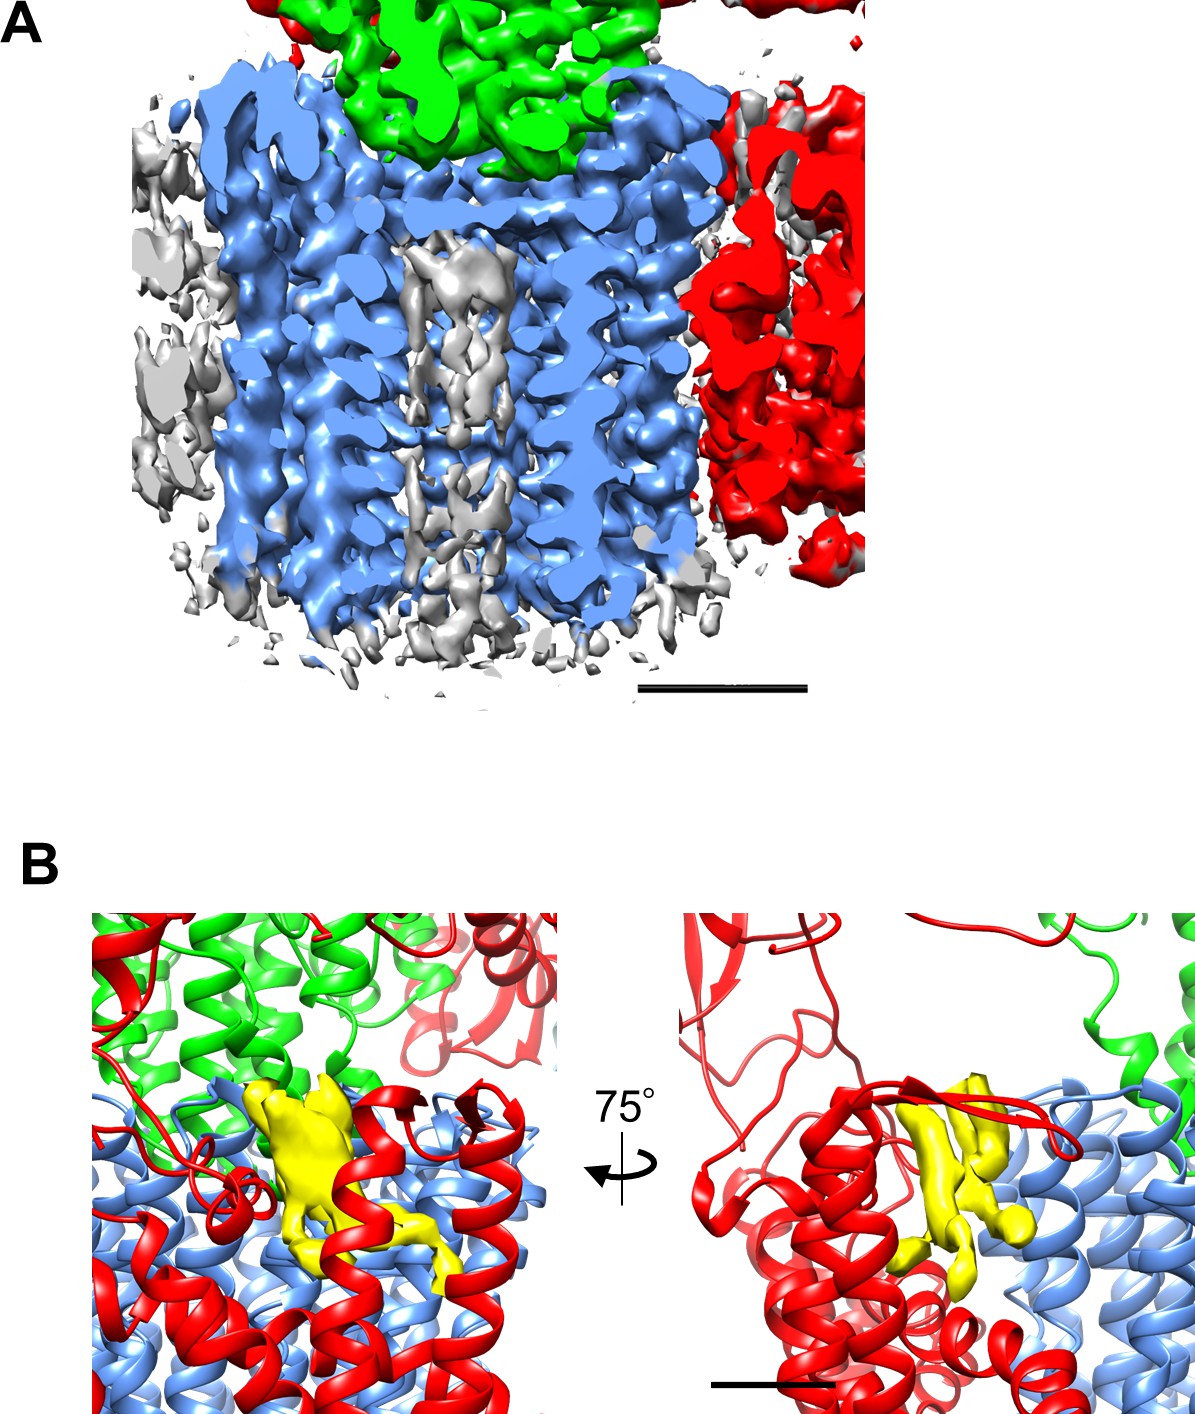
The density corresponding to lipids in Tth Vo.
(A) The cross section of the c-ring region of the Vo density map perpendicular to the cell membrane. The density is colored according to the individual subunits; a (red), d (green), and c (dark blue). Density corresponding to lipid was observed inside the c-ring (grey). (B) Density corresponding to lipid was observed between the a-subunit and c-ring (yellow).
Figure 3—figure supplement 2
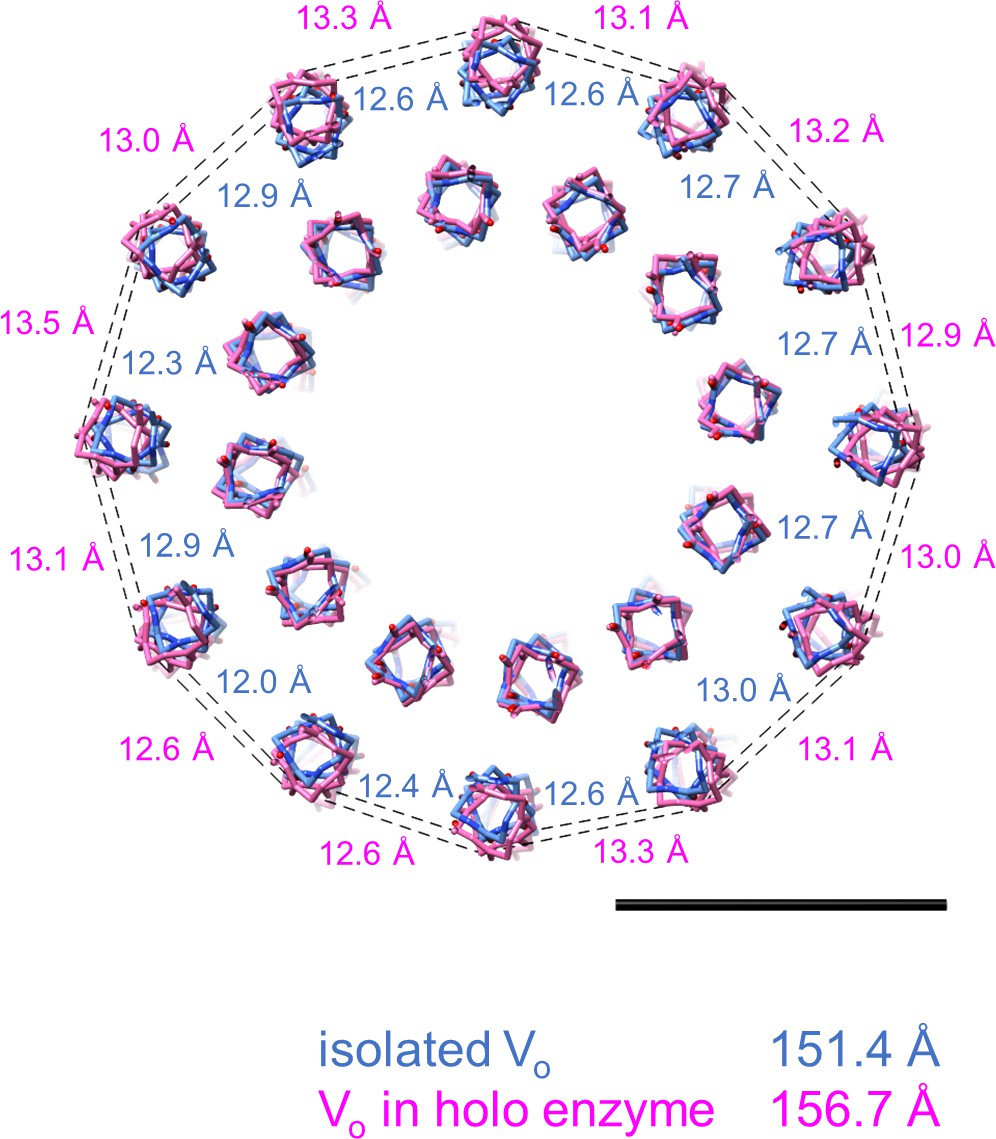
Comparison of circumferences of the rotor c-ring in the isolated Vo and holo-complex.
The dotted lines show the distance between Cα of L71 in adjacent subunits. Scale bar = 20 Å.
Figure 4 with 1 supplement
Structure of the hydrophobic domain of isolated Vo.
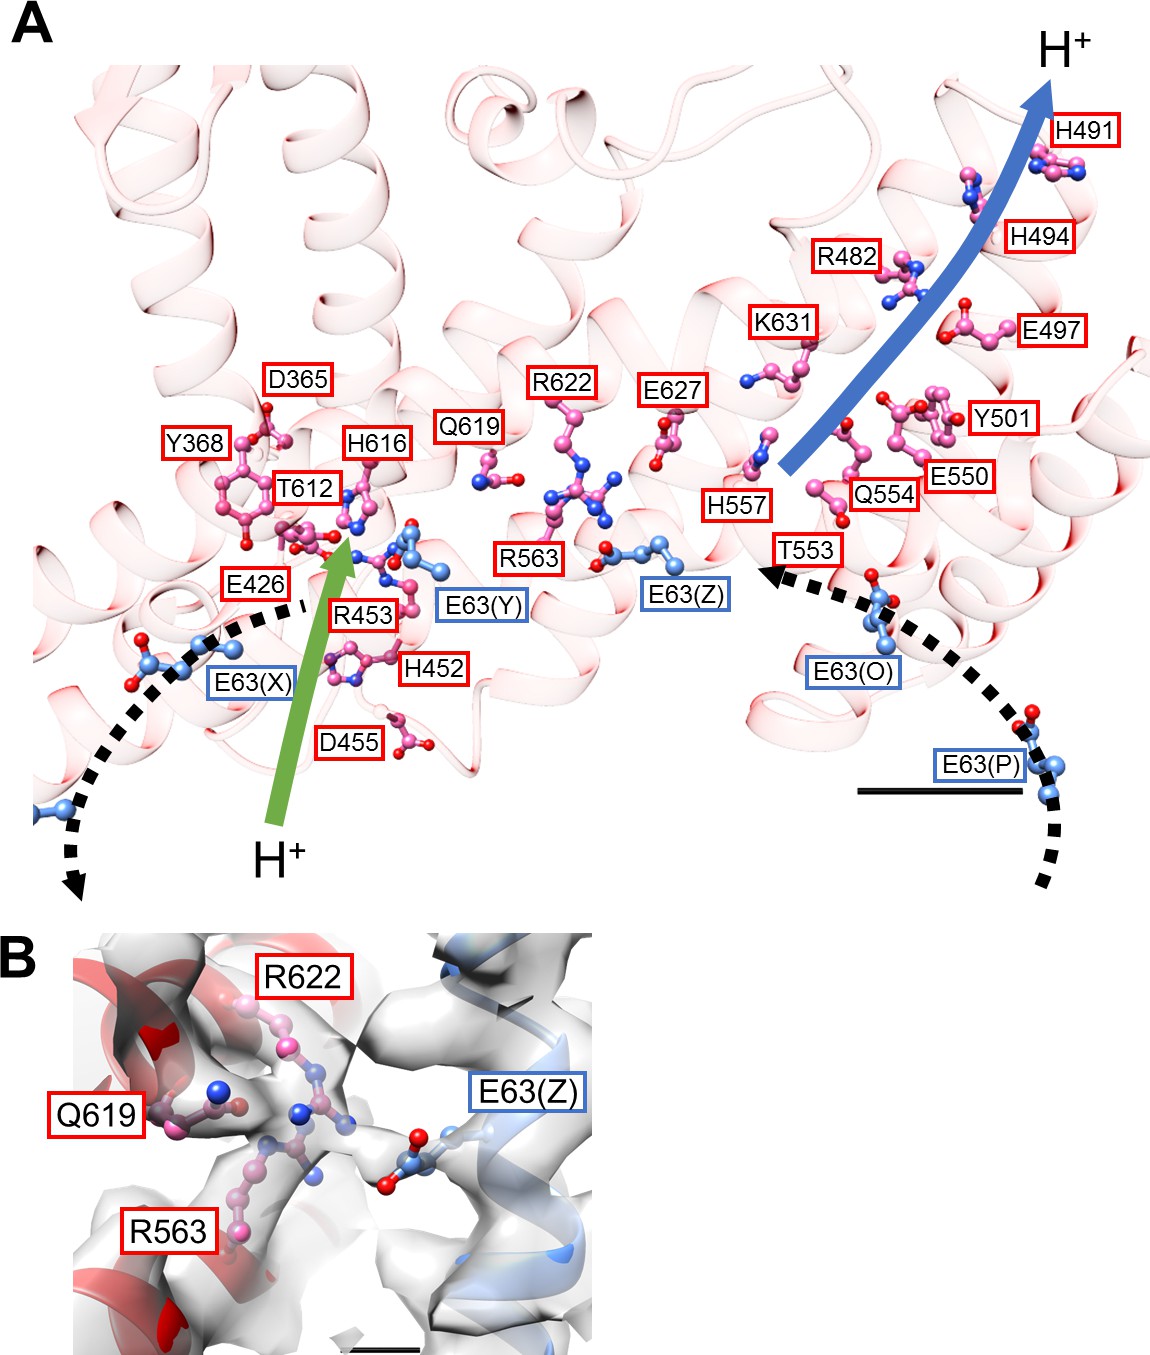
(A) The half-channels for proton translocation on both the cytoplasmic and periplasmic sides of the isolated Vo domain. Residues lining the pathways are represented as balls and sticks. Residues from the a-subunit and c-subunit are indicated in red and blue boxes, respectively. Proton flow, as it would occur in the case of ATP synthesis, is represented by arrows. The solid arrows indicate proton flow from the periplasmic side to the c-subunit (green), and from the c-subunit to the cytoplasmic side (blue). The dotted black arrows indicate proton movement due to rotation of the c12-ring. Scale bar = 10 Å. (B) The salt bridge between a/Arg563, Arg622, Gln619 and c/Glu63. Scale bar = 3 Å.
Figure 4—figure supplement 1
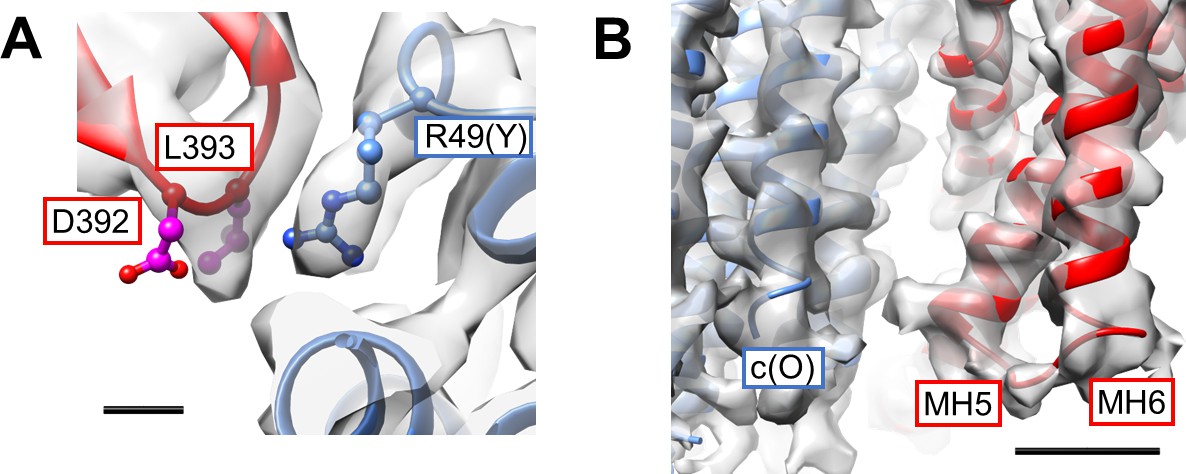
Interactions between the a-subunit and c12-ring.
(A) The cytosolic loop between MH2 and MH3 close to c/Arg49. Scale bar = 3 Å. (B) The periplasmic side of MH5 and MH6 in close proximity to the C-terminal end of the c subunit. Scale bar = 10 Å.
Figure 5
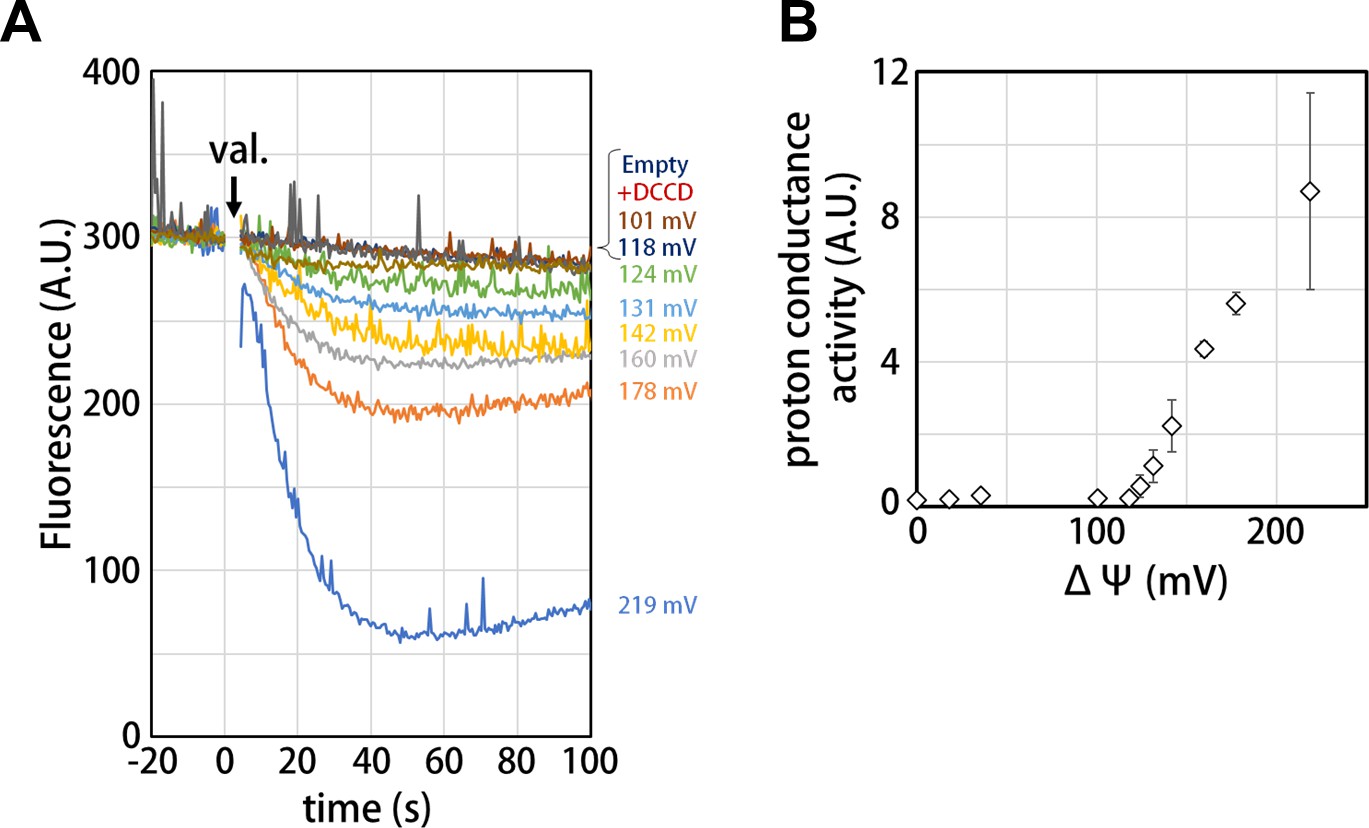
Proton conductance through the isolated Vo domain.
(A) Changes of ACMA fluorescence due to pH changes inside the Vo proteo-liposomes. Values of the membrane potential (ΔΨ) were estimated using the Nernst equation, ΔΨ = RF/zF ln[KCl]o/[KCl]i, as described in the Materials and methods section. (B) The voltage threshold of proton conductance through the Vo domain (mean ± SD, n = 3).
Figure 6 with 2 supplements
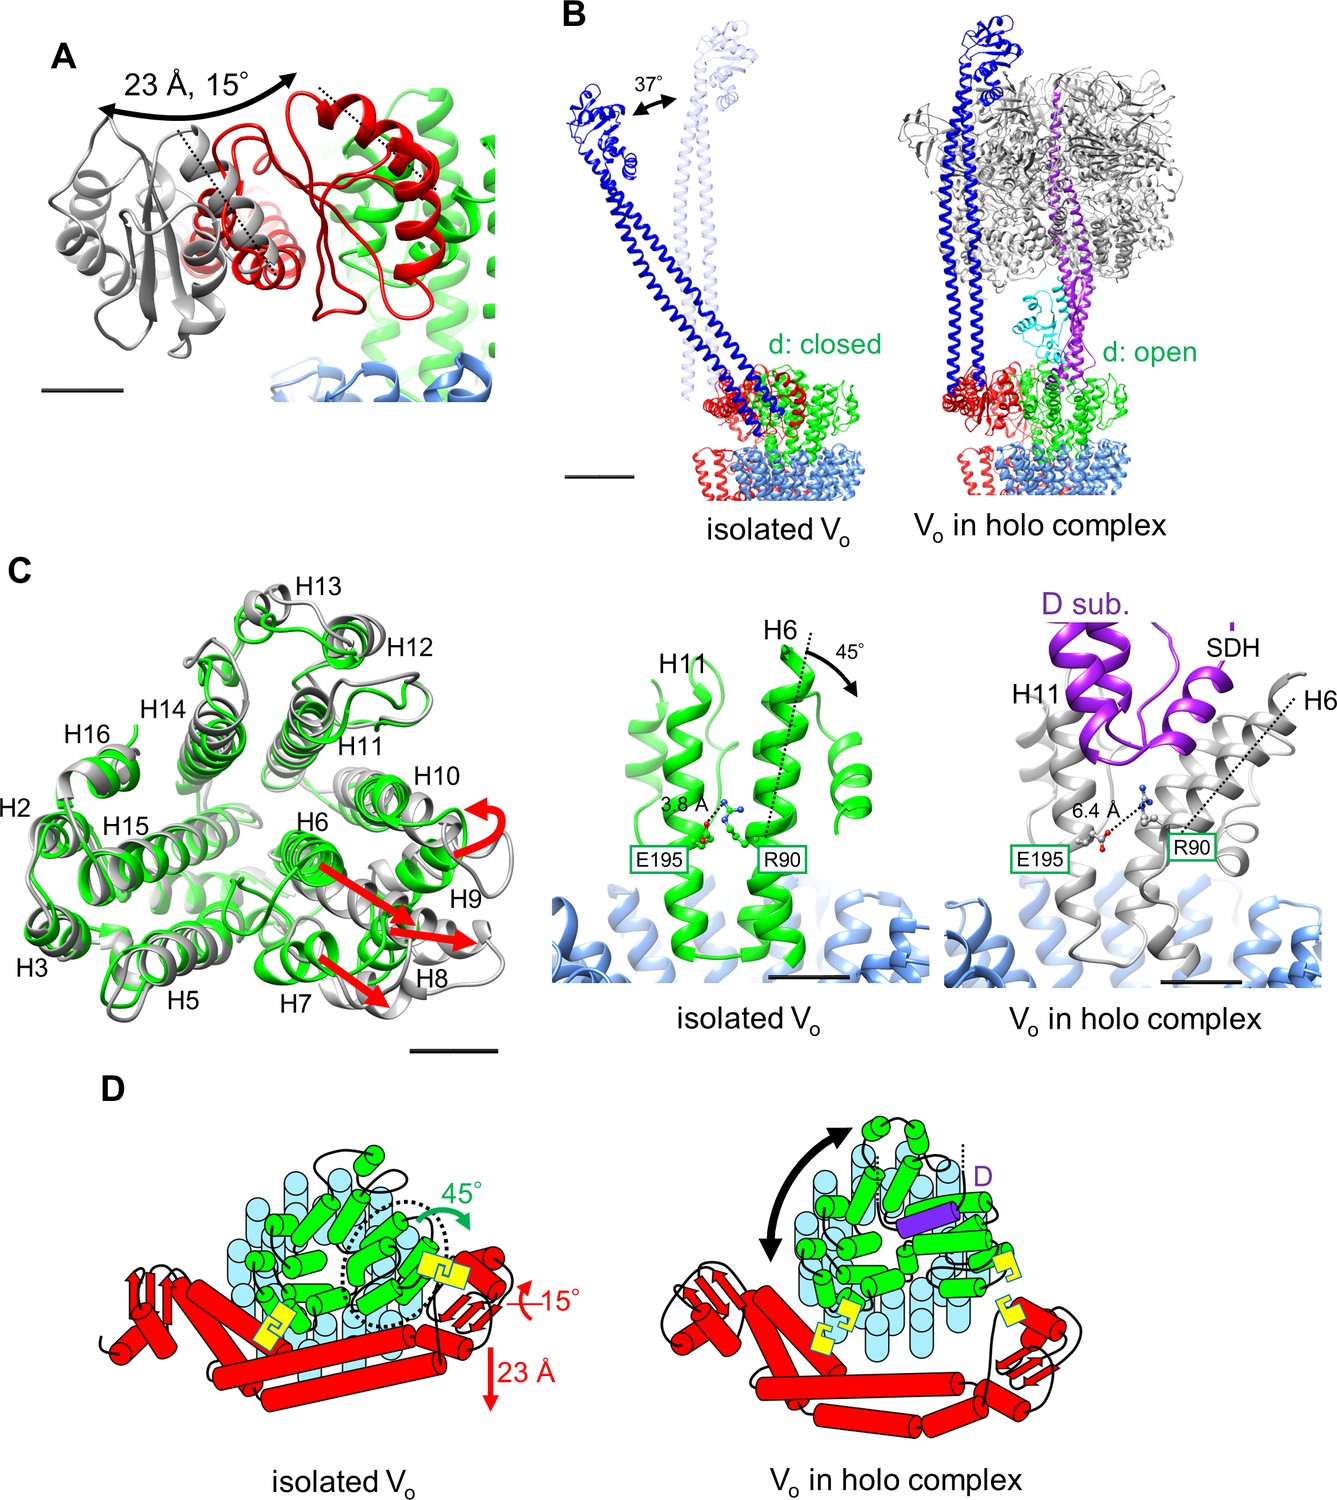
Conformational changes occurring in both the d- and asol subunits as a result of V1 to Vo binding.
(A) Structural changes in the d subunit caused by insertion of the screw driver helix (SDH). A top view of the d-subunit is shown in the left panel. The d-subunit from the isolated Vo domain and the holo enzyme are colored in green and grey, respectively. Red arrows indicate movements of helices 6–9 (H6–H9). The key helices, H6 and H11, of the d-subunit in the isolated Vo domain and holo complex are shown in panel A, center and right. The H6 helix bends 45° as a result of interaction between the d-subunit and SDH. (B) Structural changes in the distal subdomain of asol. Upon the pivoting movement of asol on the proximal subdomain, the distal subdomain swings 25 Å and twists 15° between the isolated Vo (red) and the holo complex (gray). (C) The EG structure in the distal subdomain of asol (EGd) in the isolated Vo domain (left) and in the holo complex (right). (D) A schematic representation of mechanical inhibition of Vo induced by dissociation of V1. In the isolated Vo domain, rotation of the central rotor is inhibited by interactions between the d-subunit and asol (yellow box, Figure 3D, E).
Figure 6—figure supplement 1
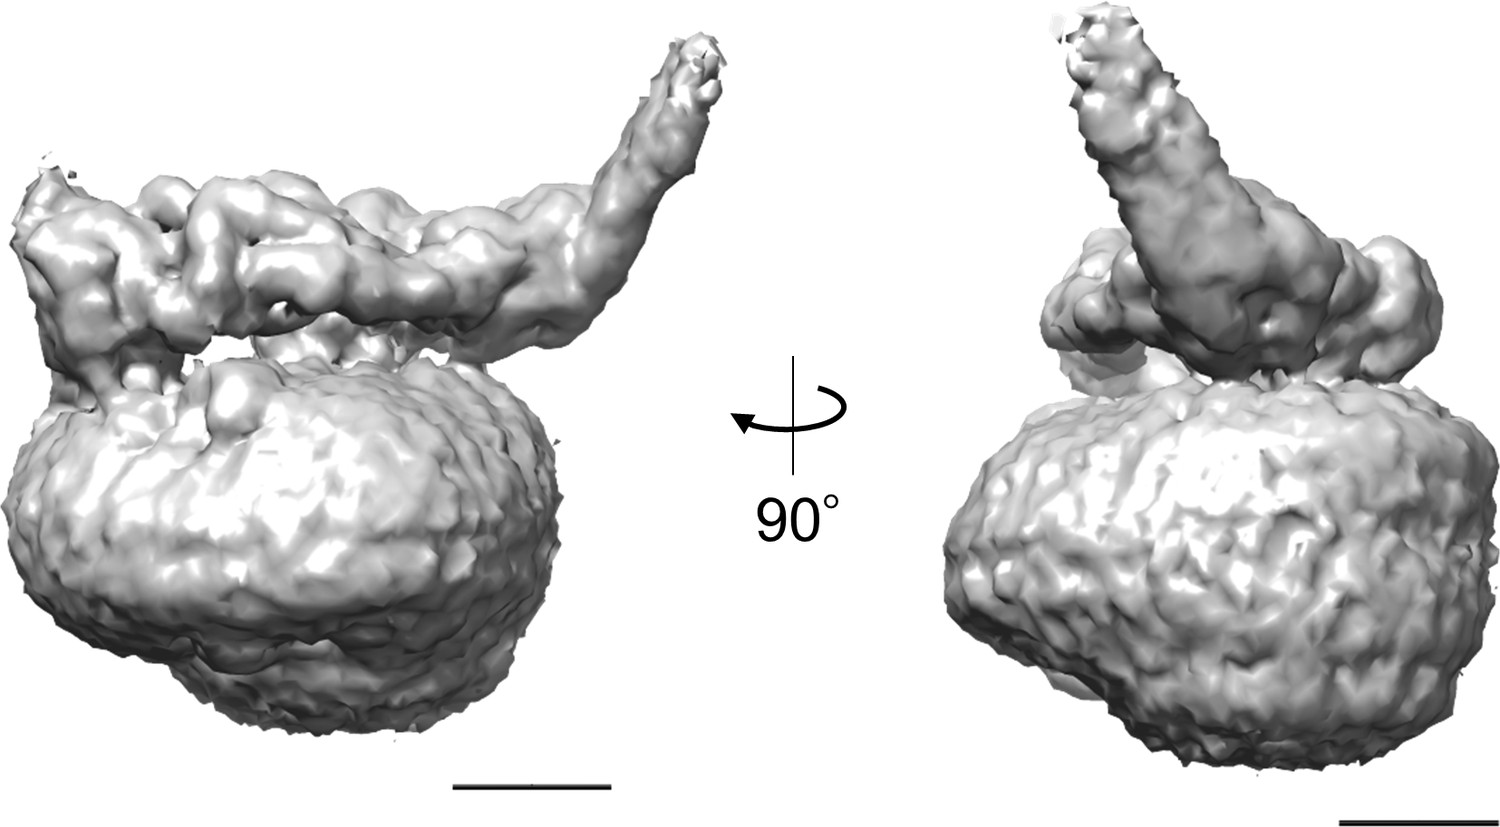
Low resolution electron density map of isolated Vo.
The density map clearly indicates that the EG subunit at the distal subdomain of asol tilts away from the V1 side. Scale bar = 20 Å.
Figure 6—figure supplement 2
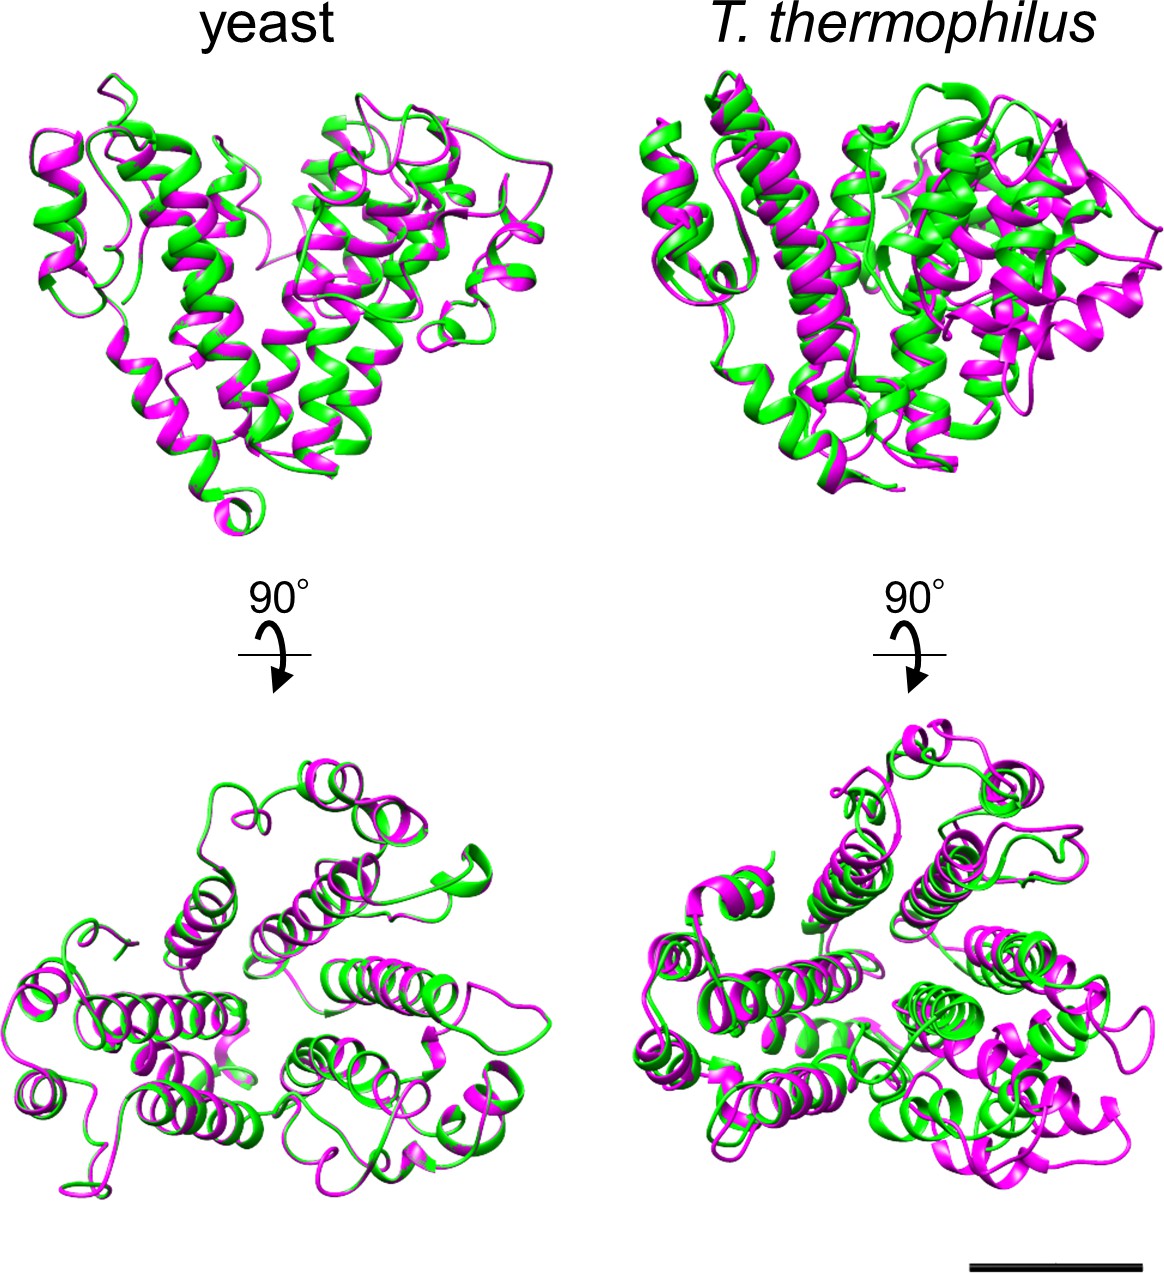
Conformational changes in the d subunit induced by association of V1 with Vo in yeast V-ATPase (left) and in TthV/A-ATPase (right).
Structure of the d subunit in isolated Vo is shown in green and structure of the d subunit in the holo complex is shown in magenta. PDBID: yeast Vo (6O7U), yeast V-ATPase (6O7V), T. thermophilus V/A-ATPase (6QUM). Scale bar = 20 Å.
Videos
Video 1
Conformational changes of the d-subunit between isolated Vo and Vo in holo-enzyme.
A morphed movie focuses on the conformational changes of the d-subunit between isolated Vo and Vo in the holo-enzyme. a-, d-, c- and d-subunits are colored in red, green, dark blue, and orange, respectively. d/R90 and d/E195 are represented as balls and sticks. The density map of isolated Vo is shown as a semi-transparent surface.
Video 2
Conformational changes of a hydrophilic arm of the a-subunit linked to movement of the EG subunits.
A morphed movie focusing on the conformational changes of a hydrophilic arm of the a-subunit between isolated Vo and Vo in the holo-enzyme. EGp and EGd indicate proximal and distal EG subunits. The position of EGd was determined from the low-resolution density map (Figure 6—figure supplement 1). The hydrophilic arm of the a-subunit associated with binding EGd to one of the B subunits from V1, is forced to swing away from the d-subunit, resulting in disruption of the specific interaction between the subunits.
Tables
Key resources table
| Reagent type (species) or resource | Designation | Source or reference | Identifiers | Additional information |
|---|---|---|---|---|
| Strain, strain background T. thermophilus | HB8 | Tamakoshi et al., 1997 | ||
| Chemical compound, drug | 14:0 PC (DMPC) | Avanti polar lipid | 850345 | |
| Chemical compound, drug | 16:0-18:1 PC (POPC) | Avanti polar lipid | 850457 | |
| Chemical compound, drug | n-Dodecyl-beta-D-maltopyranoside | cosmo bio | D-1304 | |
| Chemical compound, drug | Biobeads SM-2 | bio-rad | 1523920 | |
| Chemical compound, drug | L-α-Phosphatidylcholine from soybean, Type II-S | Merck | P5638 | |
| Chemical compound, drug | n-octyl-β-D-glucoside | sigma aldrich | 850511P | |
| Chemical compound, drug | 9-Amino-6-Chloro-2-Methoxyacridine | Thermo Fisher | A1324 | |
| Chemical compound, drug | Carbonyl cyanide 4-(trifluoromethoxy)phenylhydrazone | sigma aldrich | C2920 | |
| Chemical compound, drug | Valinomycin | sigma aldrich | V0627 | |
| Software, algorithm | RELION | Zivanov et al., 2018 | RRID:SCR_016274 | |
| Software, algorithm | MotionCor2 | Zheng et al., 2017 | RRID:SCR_016499 | |
| Software, algorithm | Gctf | Zhang, 2016 | RRID:SCR_016500 | |
| Software, algorithm | COOT | http://www2.mrc-lmb.cam.ac.uk/personal/pemsley/coot/ | RRID:SCR_014222 | |
| Software, algorithm | Phenix | https://www.phenix-online.org/ | RRID:SCR_014224 | |
| Software, algorithm | MolProbity | http://molprobity.biochem.duke.edu | RRID:SCR_014226 |
Table 1
CryoEM data collection, refinement and model statistics.
| TthV/A-ATPase | V1EGdasol | Isolated Vo | |
|---|---|---|---|
| Data collection | |||
| Electron microscope | Titan Krios | CRYOARM200 | |
| Electron detector | Falcon II | K2 summit | |
| Magnification | 75,000 | 50,000 | |
| Voltage (kV) | 300 | 200 | |
| Electron exposure (e-/Å2) | 91 | 79.2 | |
| Defocus range (μm) | 2.4–3.0 | 1.0–3.0 | |
| Pixel size (Å) | 1.1 | 1.1 | |
| Movie No. | 3694 | 5988 | |
| Frame per movie | 34 | 60 | |
| Automation software | EPU | JADAS | |
| Data processing | |||
| Total extracted particles | 3.5 × 10⁵ | 3.14 × 10⁶ | |
| Total particle after 2D | 144,758 | 706,617 | |
| Resolution (Å) | 3.6 | 3.5 | 3,93 |
| Sharpening B-factor | −81.07 | −60.25 | −110.87 |
| EMDB ID | 30013 | 30014 | 30015 |
| Model building and refinement | |||
| Initial models | - | 5Y5Y | 5Y5X, 1V9M |
| Building and refinement package | - | COOT, phenix | COOT, phenix |
| Total atom No. | - | 26,631 | 13,888 |
| Total residue No. | - | 3418 | 1894 |
| Total chain No. | - | 8 | 16 |
| Ligands | - | ADP | - |
| cc_mask | - | 0.85 | 0.82 |
| Ramachandran favored | - | 88.89% | 92.75% |
| Ramachandran outliers | - | 0.03% | 0.00% |
| Rotamer outliers | - | 11.45% | 0.37% |
| c-beta deviation | - | 0 | 0 |
| CaBLAM outliers | - | 5.94% | 2.84% |
| Clashscore | - | 6.38 | 20.01 |
| RMSD bonds (Å) | - | 0.006 | 0.006 |
| RMS angle (°) | - | 0.669 | 0.725 |
| MolProbity score | - | 2.73 | 2.26 |
| PDB ID | - | 6LY8 | 6LY9 |
Additional files
Download links
A two-part list of links to download the article, or parts of the article, in various formats.
Downloads (link to download the article as PDF)
Open citations (links to open the citations from this article in various online reference manager services)
Cite this article (links to download the citations from this article in formats compatible with various reference manager tools)
Mechanical inhibition of isolated Vo from V/A-ATPase for proton conductance
eLife 9:e56862.
https://doi.org/10.7554/eLife.56862


