Unsupervised machine learning reveals risk stratifying glioblastoma tumor cells
- Department of Cell and Developmental Biology, Vanderbilt University, United States
- Vanderbilt-Ingram Cancer Center, Vanderbilt University Medical Center, United States
- Department of Pathology, Microbiology and Immunology, Vanderbilt University Medical Center, United States
- Department of Neurological Surgery, Vanderbilt University Medical Center, United States
Figures
Figure 1 with 6 supplements

RAPID identifies single cell phenotypes associated with continuous clinical variables that are stable and validated via complementary approaches.
(a) Graphic of tumor processing and data collection. After data collection and standard pre-processing, non-immune, non-endothelial glioblastoma cells were computationally isolated for analysis by RAPID. (b) RAPID workflow on glioblastoma cells identified from 28 patients and computationally pooled for t-SNE analysis. Cell subsets were automatically identified by FlowSOM and were systematically assessed for association with patient overall or progression-free survival. 43 glioblastoma cell subsets were identified and were color-coded based on hazard ratio of death and p-values (HR >1, red; HR <1, blue). Cell density, FlowSOM clusters, and cluster significance are depicted on t-SNE plots. (c) RAPID results were tested for stability. Each tumor was randomly subsampled for 4,710 cells multiple times. Each of these cell subsampling runs was subject to 100 iterative FlowSOM analyses and an F-measure was calculated for each cluster. Only clusters with an F-measure of greater than 0.5 were considered stable. Then, the phenotypes of stable clusters associated with patient outcome were assessed via RMSD and used to determine stable phenotypes. (d) Validation of the findings from the mass cytometry data was done using lower dimensional gating strategies and an orthogonal technology to confirm the biological findings.
Figure 1—figure supplement 1
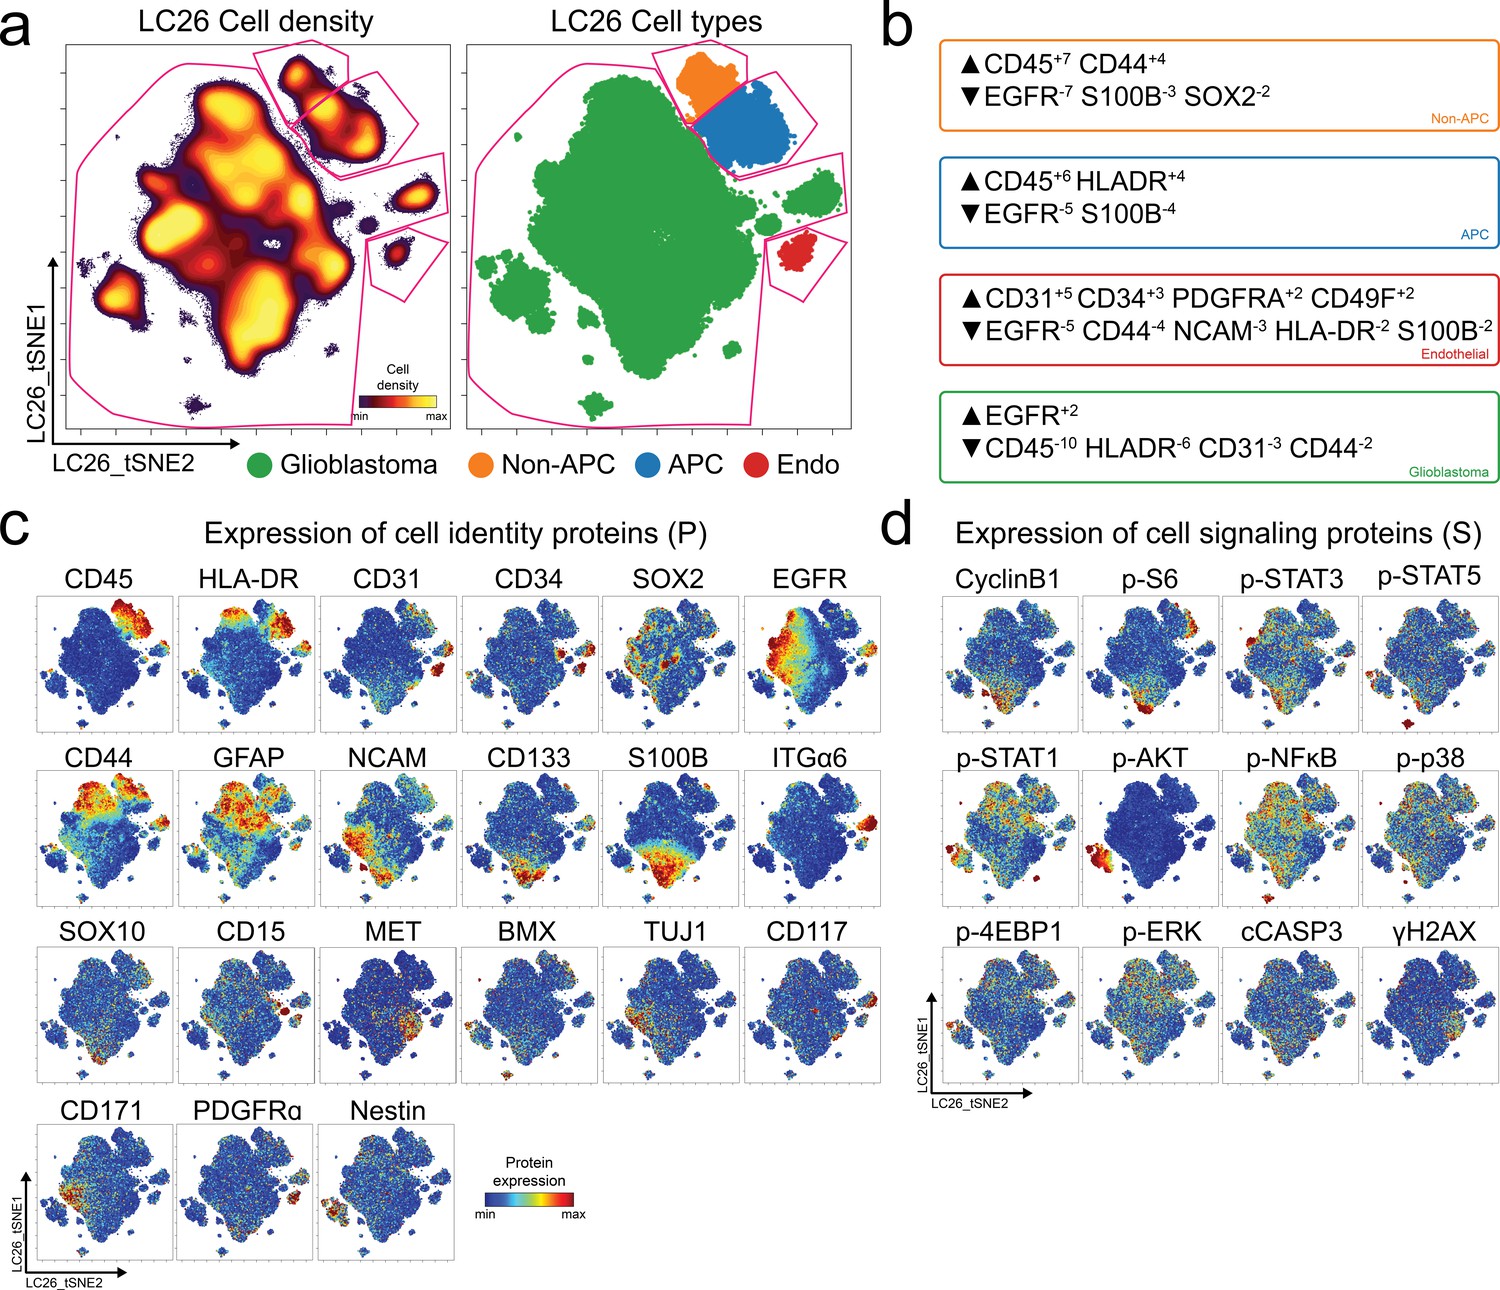
Single cell quantification of identity proteins and phospho-protein signaling in glioblastoma.
(a) t-SNE plots of cell density (left) and major cell types in a patient tumor (LC26) colored by expert gating (right) for antigen presenting cells (APC, blue), other immune cells (non-APC, orange), endothelial cells (Endo, red), and glioblastoma cells (green) using CD45, CD31, and HLA-DR to identify cells. Pink lines indicate where expert gates were drawn. (b) MEM protein enrichment scores for populations indicated by color in (a), using the other three populations as reference. (c) Per-cell expression levels of 21 identity proteins, (d) 9 phosphorylated signaling effectors, proliferation marker cyclin B1, apoptotic signaling factor cleaved caspase 3 (cCASP3), and DNA damage marker γH2AX in LC26 are depicted. Heat indicates protein or phospho-protein expression per cell; scale is specific to each measured feature.
Figure 1—figure supplement 2
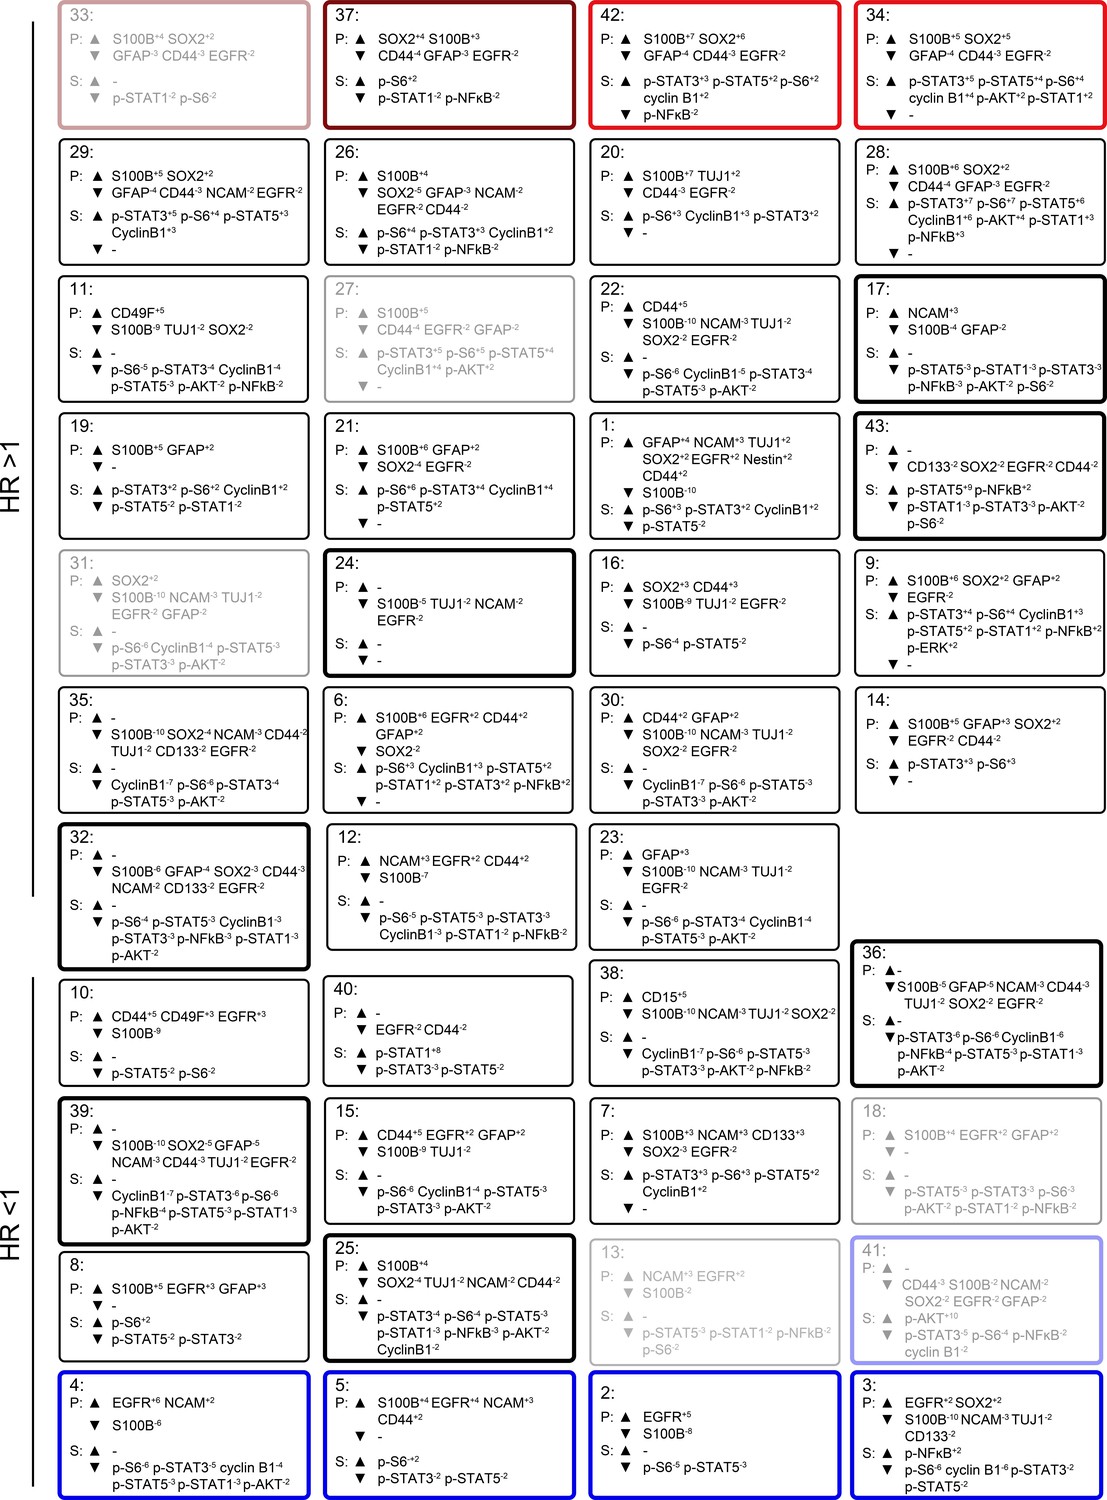
Quantitative MEM labels of the enriched identity proteins and signaling features of all glioblastoma cell subsets identified by RAPID.
Enrichment of identity proteins (P) and phosphorylated signaling effectors (S) of glioblastoma cell subsets identified by RAPID was quantified using MEM. GNP and GPP cells are labeled in red and blue, respectively. Populations detected in every patient sample (abundances ranging from 0.02% to 28.05%) are outlined in bold. Populations deemed unstable (either by F-measure <0.5 or representing phenotypes displayed in less than 50% of cell subsampling runs) are faded.
Figure 1—figure supplement 3
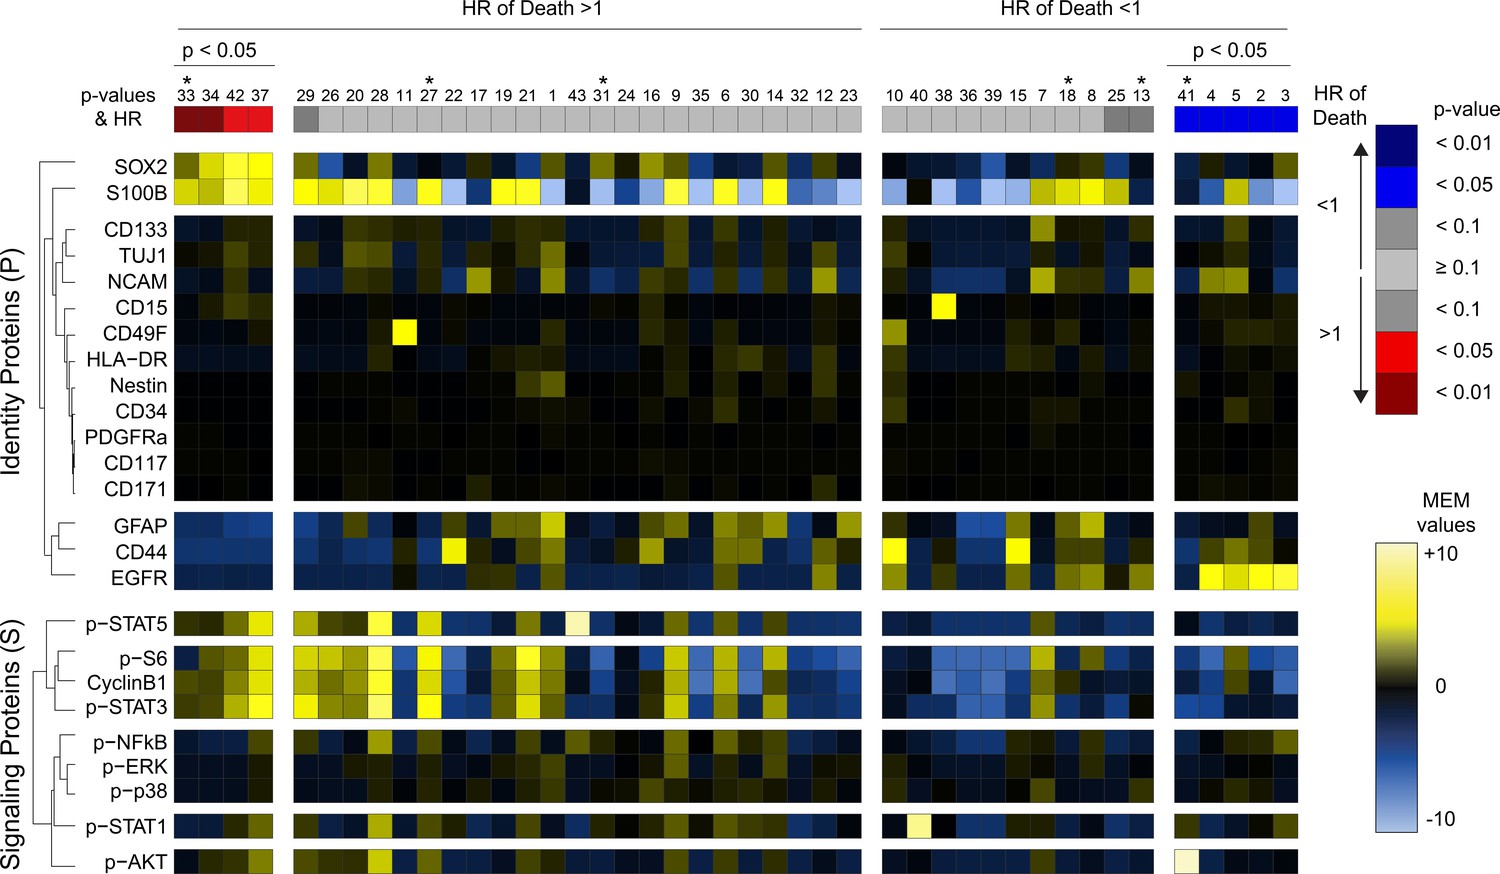
Glioblastoma cell subsets showed differential enrichment of identity proteins and phosphorylated signaling effectors.
Forty-three glioblastoma cell subsets automatically identified by FlowSOM are arranged according to their associations with overall survival (HR >1, left; HR <1, right) and statistical significance of that association (p-values). The heatmap represents the MEM values of glioblastoma cell subsets (columns). GNP cells are labeled in red, while GPP cells are labeled in blue. Hierarchical clustering was performed based on MEM values and is depicted on the left of the heatmap for measured features. HR = hazard ratio of death. Asterisks (*) above indicate that clusters are not stable (F-measure of <0.5 or phenotypes identified in less than 50% of cell subsampling runs).
Figure 1—figure supplement 4
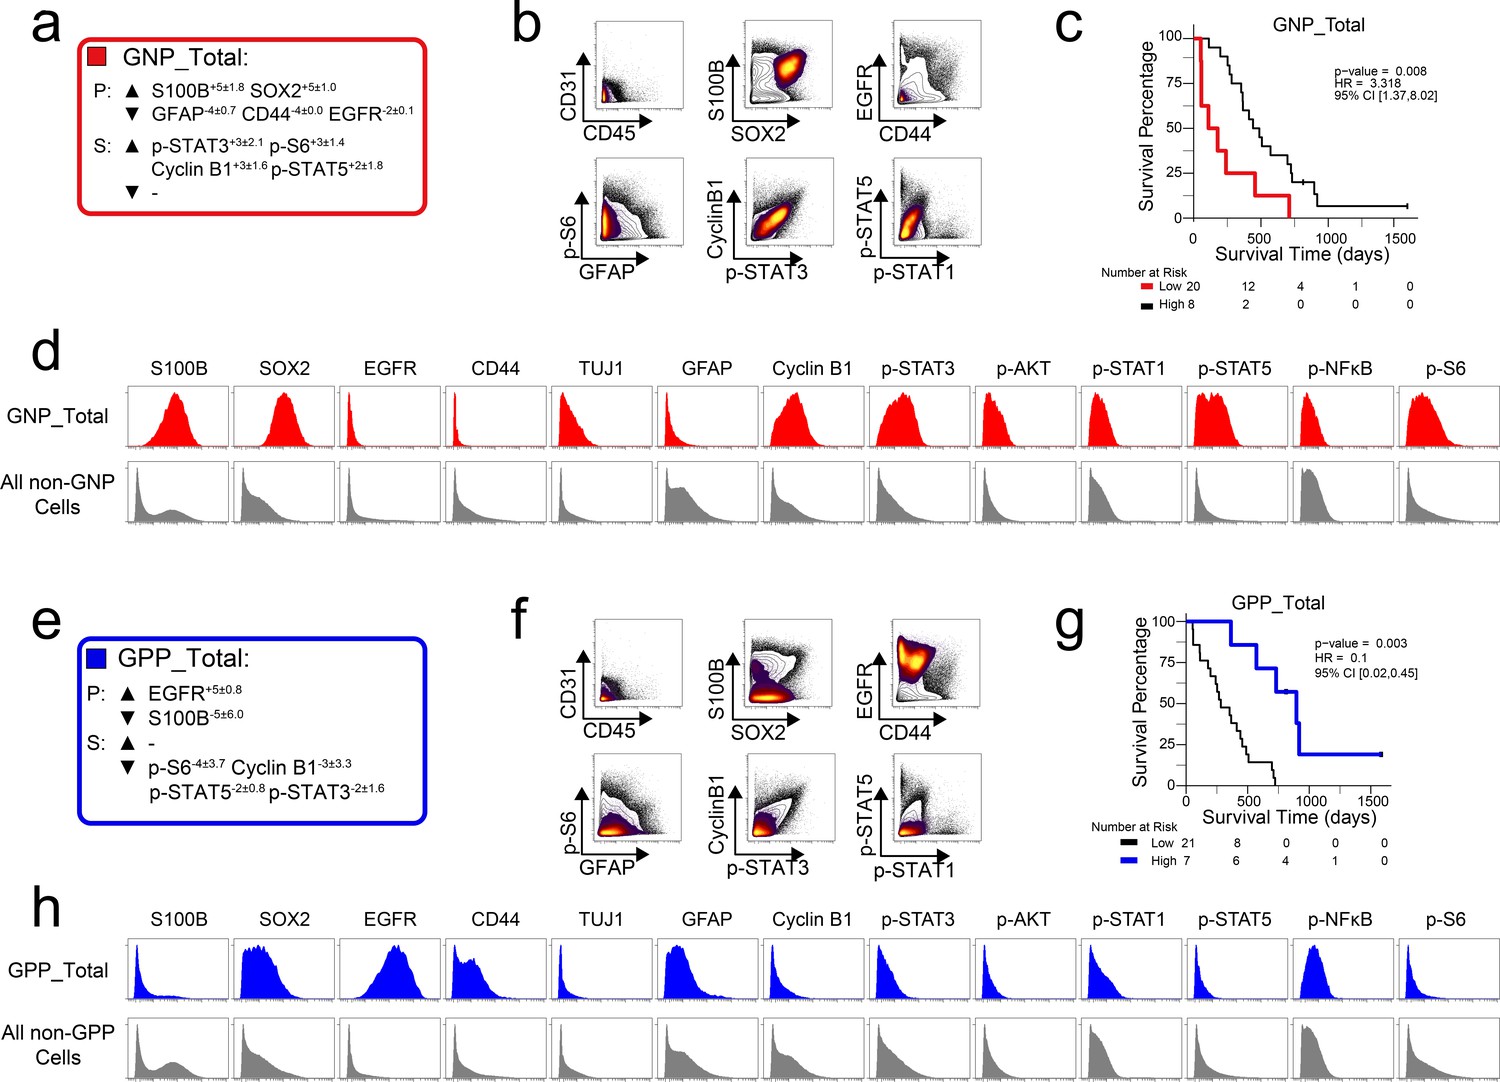
Divergent phenotypes are associated with patient outcomes.
(a) Enrichment (upwards arrowhead) or lack (downwards arrowhead) of identity proteins (P) and phosphorylated signaling effectors (S) on Glioblastoma Negative Prognostic cell subsets was quantified using MEM. Average MEM scores are shown for three GNP subsets ± the standard deviation. (b) Combined GNP cell subsets (density contours) were mapped over biaxial plots of all other tumor cells (black contours). (c) Overall survival of patients for high (>2.96%) total GNP content compared to patients with low (<2.96%) GNP content. (d) Histogram plots of GNP cells (red) and all other glioblastoma cells (gray) illustrate the expression of identity proteins and phosphorylated signaling effectors. (e) Enrichment (upwards arrowhead) or lack (downwards arrowhead) of identity proteins (P) and phosphorylated signaling effectors (S) on Glioblastoma Positive Prognostic cell subsets was quantified using MEM. Average MEM scores are shown for three GNP subsets ± the standard deviation. (f) Combined GPP cell subsets (density contours) were mapped over biaxial plots of all other tumor cells (black contours). (g) Overall survival of patients for high (>8.65%) total GPP content compared to patients with low (<8.65%) GPP content. (h) Histogram plots of each GPP cell subset (blue) and all other glioblastoma cells (gray) illustrate the expression of proteins and phosphorylated signaling effectors.
Figure 1—figure supplement 5
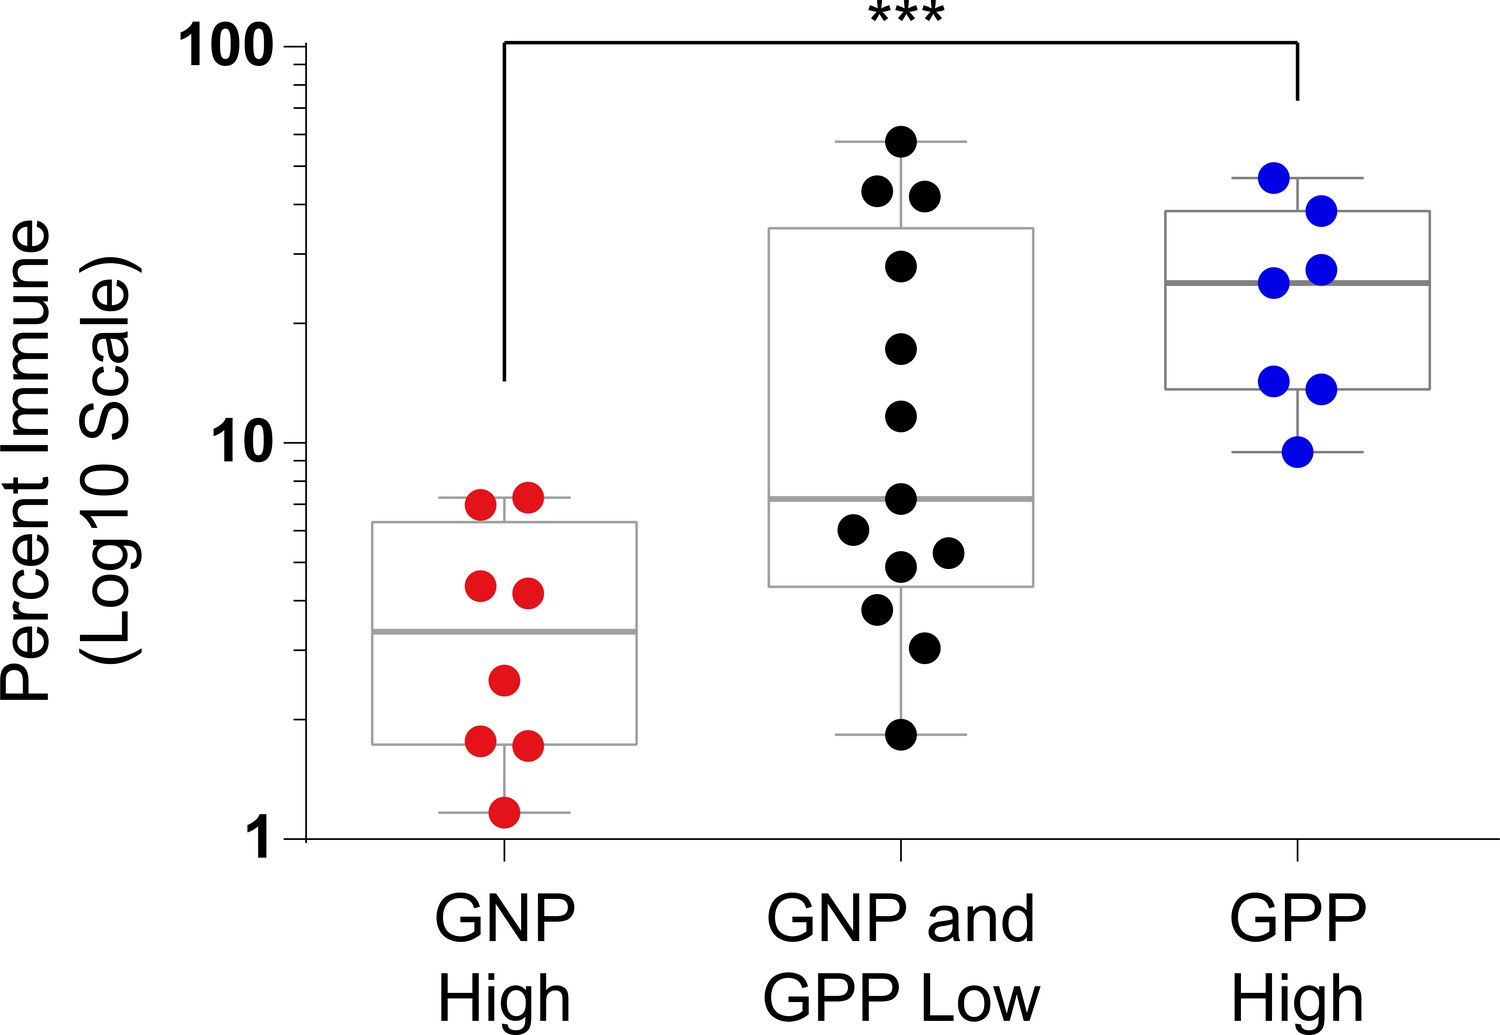
Abundance of immune cells correlated with the abundance of prognostic cell subsets.
Box and whisker plot of immune abundance (%, log10 scale) on the y-axis and patients divided into three groups: GNP high (red,>2.96% GNP cells), GPP high (blue,>8.65% GPP), or GNP and GPP low (gray). Box encompasses the 25th to 75th percentile, gray horizontal line indicates the median, and whiskers extend to the minimum and maximum values. ***p=0.0008, two-tailed t-test.
Figure 1—figure supplement 6

RAPID identified four populations associated with time to disease progression.
(a) Enrichment of identity proteins (P) and phosphorylated signaling effectors (S) of GNP cell subsets revealed by analysis of disease progression (GNPPFS) was quantified using MEM. (b) Histogram plots of each GNPPFS cell subset (red) and all other glioblastoma cells (gray) illustrate the expression of proteins and phosphorylated signaling effectors. (c) Combined GNPPFS cell subsets (red circles) were mapped over biaxial plots of all other tumor cells (black contours). (d) For each subset, PFS was compared between patients with high vs low cell abundance (see Materials and methods). (e) Enrichment of identity proteins (P) and phosphorylated signaling effectors (S) of the GPPPFS cell subset was quantified using MEM. (f) PFS was compared between patients with high vs low GPPPFS cell abundance (g) Histogram plots of the GPPPFS cell subset (blue) and all other glioblastoma cells (gray) illustrate the expression of proteins and phosphorylated signaling effectors. (h) The GPPPFS cell subset (blue circles) was mapped over biaxial plots of all other tumor cells (black contours).
Figure 2
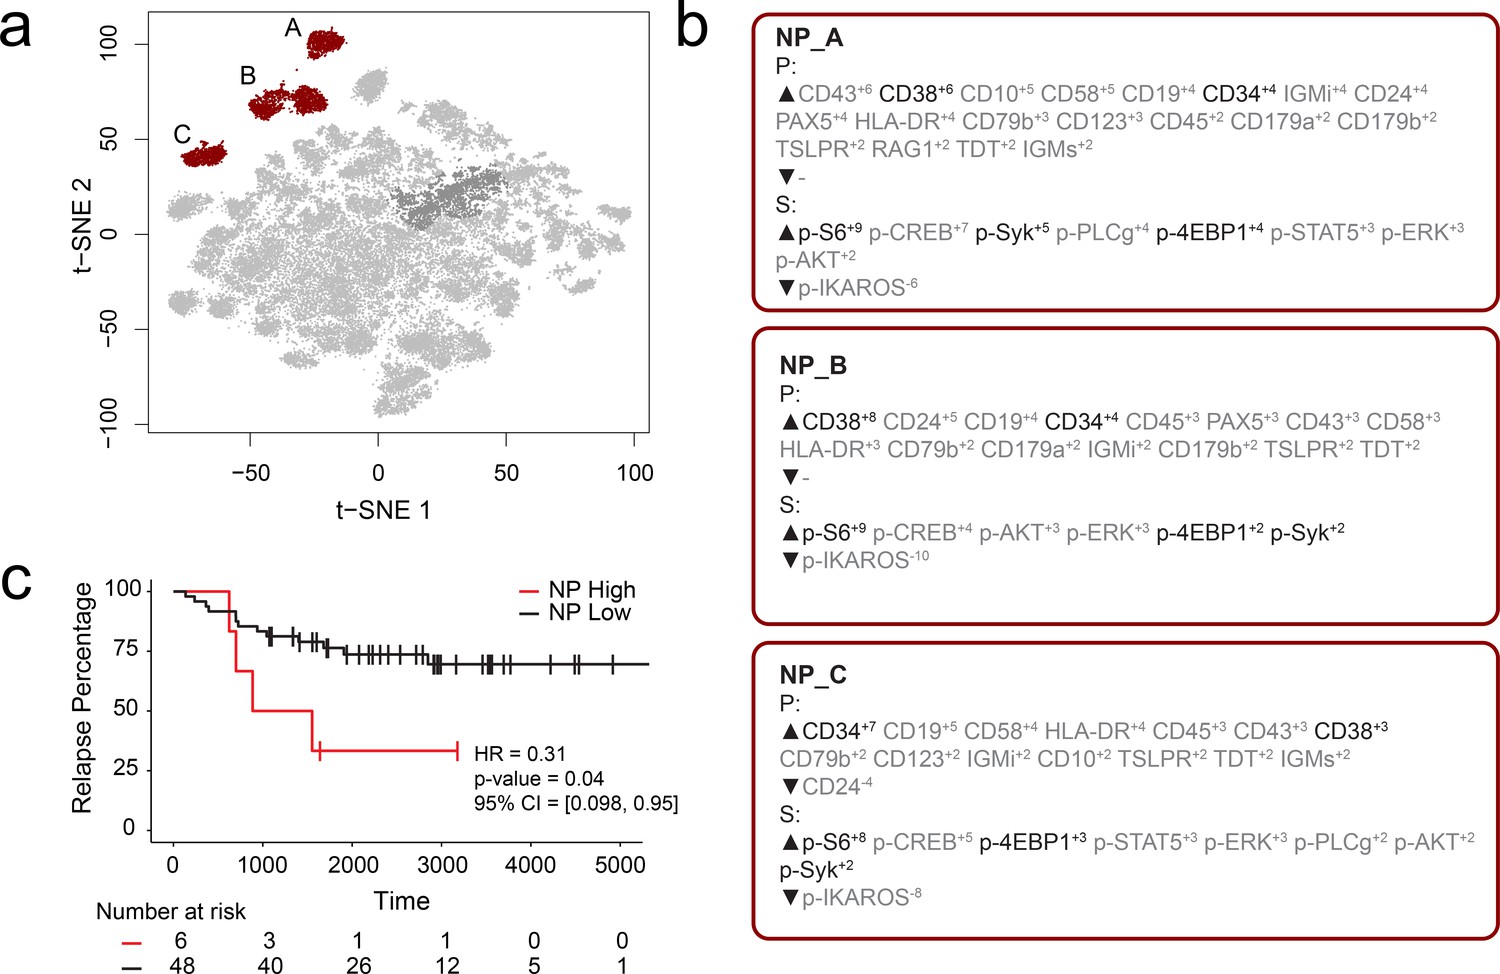
RAPID analysis of a published B-cell leukemia dataset to identify negative prognostic cell subsets.
(a) t-SNE plot of 54 B-cell leukemia patient samples with negative prognostic populations (A, B, C) colored in red. (b) MEM labels for three negative prognostic cell subsets (NP_A, NP_B, NP_C). Features important in the original discovery of predictors of relapse are colored in black. (c) Kaplan-Meier Curve comparing time to relapse in patients with high abundance of negative prognostic cells (identified by RAPID) to patients with low abundance of negative prognostic cells.
Figure 3
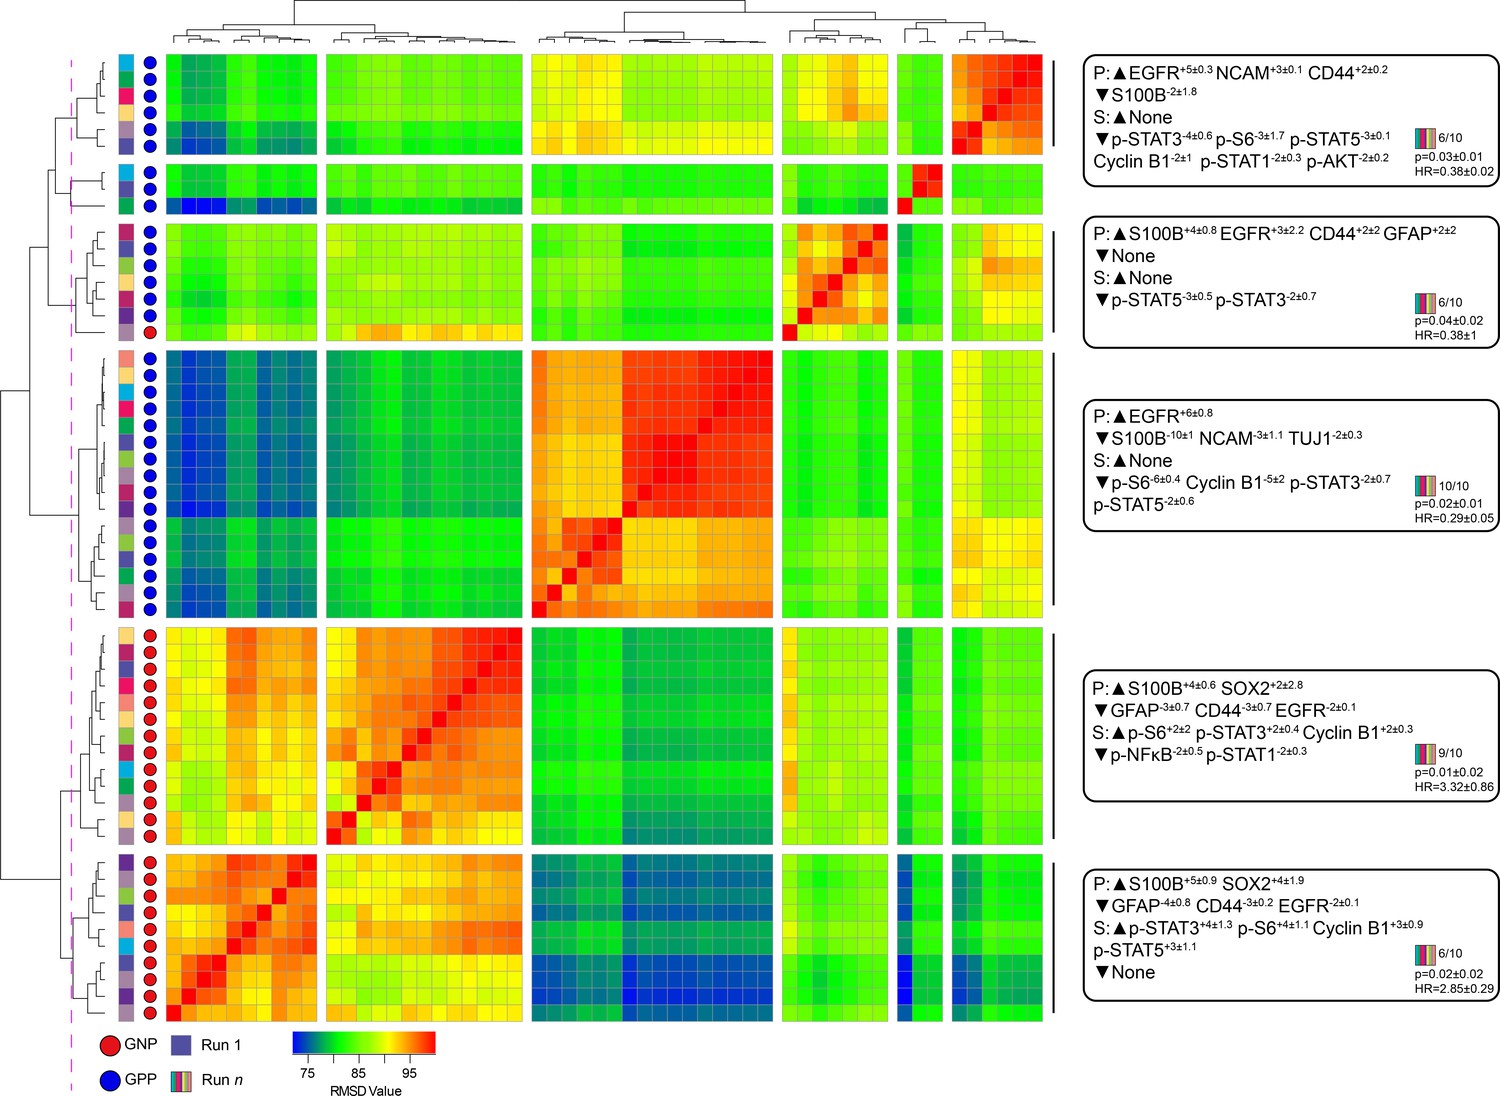
Subsampling of glioblastoma cells repeatedly resulted in GNP and GPP subsets with similar phenotypes.
RMSD map comparing MEM scores for stable GNP and GPP subsets identified in the main figures and from nine additional t-SNE runs. GNP subsets are noted by red circles and GPP subsets are noted by blue circles. Colored boxes to the left of the red or blue circles indicate the t-SNE run from which the subset is derived. Median MEM labels (± standard deviation) are shown for five major populations to the right. The number of t-SNE analyses represented in each group, as well as median p-value and hazard ratio (HR) are noted in the bottom right corner of each MEM label.
Figure 4
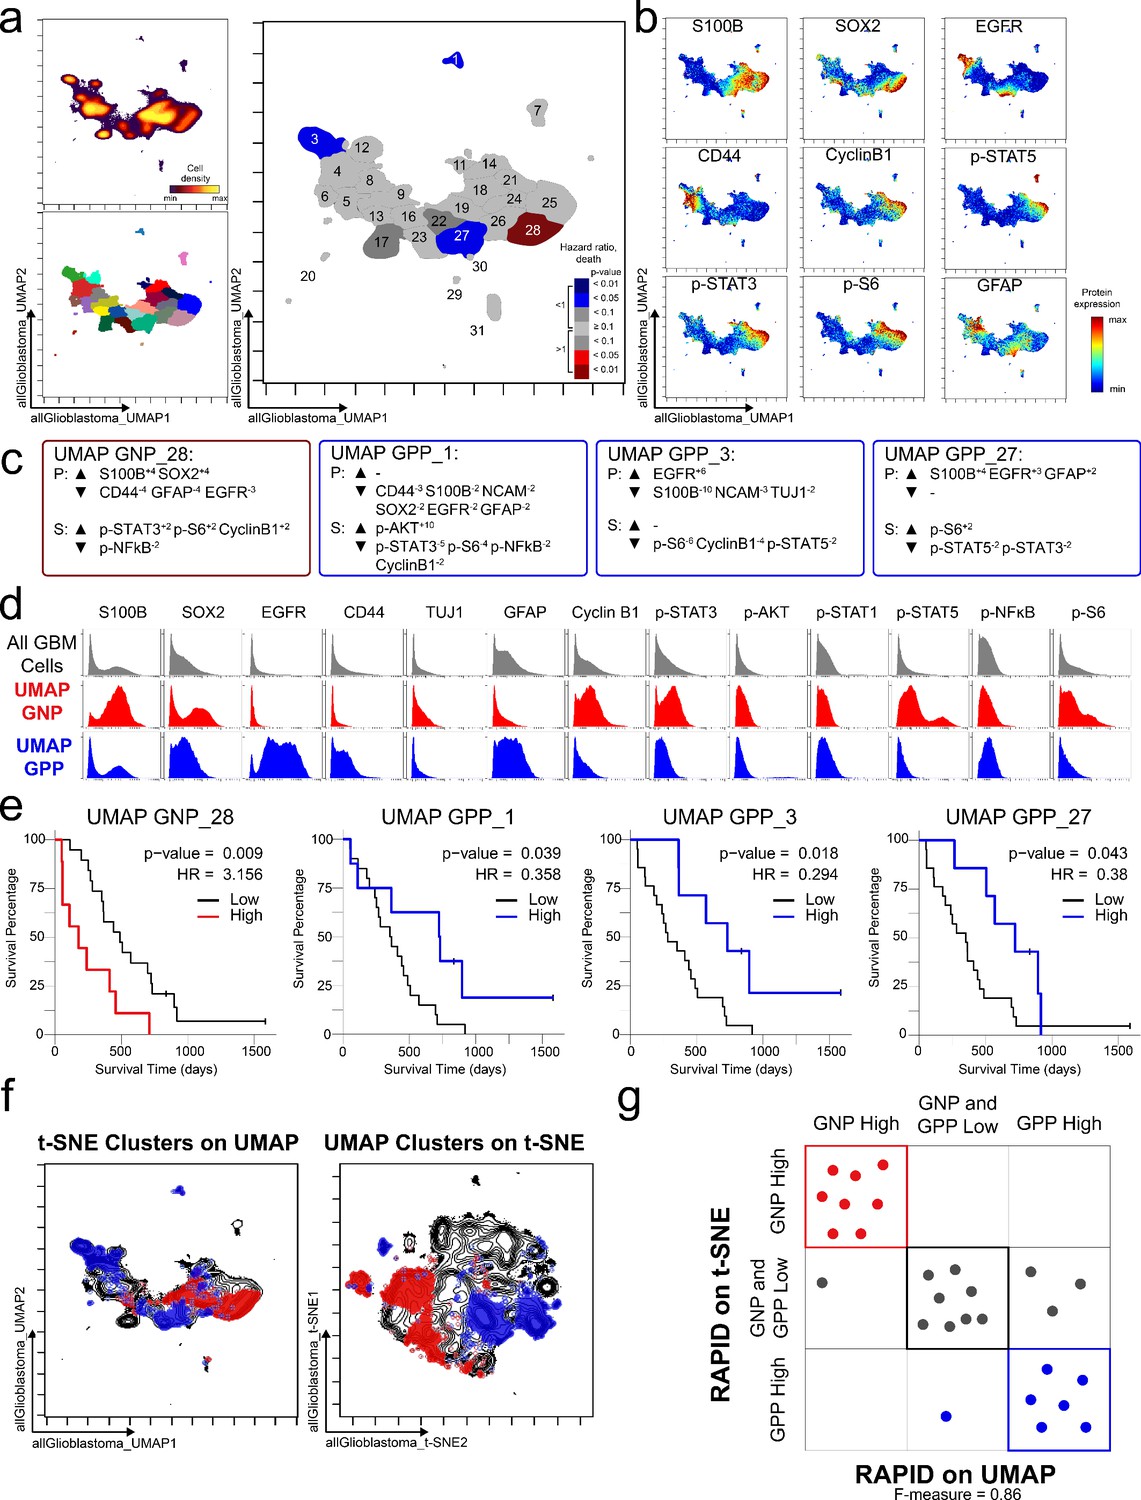
GNP and GPP cells were also identified using dimensionality reduction tool UMAP in the RAPID algorithm.
(a) UMAP analysis of 131,880 cells from 28 patients. Upper left plot - heat on cell density; lower left plot – colored by FlowSOM cluster; right plot – colored by GNP(red)/GPP(blue) designation and p-value. (b) Per-cell expression levels of 5 identity proteins, 3 phosphorylated signaling effectors, and proliferation marker cyclin B1 are depicted. (c) Enrichment of identity proteins (P) and phosphorylated signaling effectors (S) of glioblastoma cell subsets was quantified using MEM. GNP and GPP cells are labeled in red and blue, respectively. (d) Histogram analysis depicts the expression of key identity proteins and phosphorylation signaling effectors of GNP (red) and GPP (blue) compared to all glioblastoma (GBM) cells (gray, top row). (e) Overall survival curves for four UMAP-identified populations associated with survival. Cox-proportional hazard model was used to determine a hazard ratio (HR) of death. Censored patients are indicated by vertical ticks. (f) GNP (red) and GPP (blue) cells identified via t-SNE (‘t-SNE GNP’ or ‘t-SNE GPP’) and UMAP (‘UMAP GNP’ or ‘UMAP GPP’) are overlaid on either UMAP or t-SNE axes. (g) Categorization of each patient (dots) based on GNP high (red), GPP high (blue), or neither (gray) according to abundance based on RAPID using t-SNE or RAPID using UMAP (F-measure = 0.86).
Figure 5
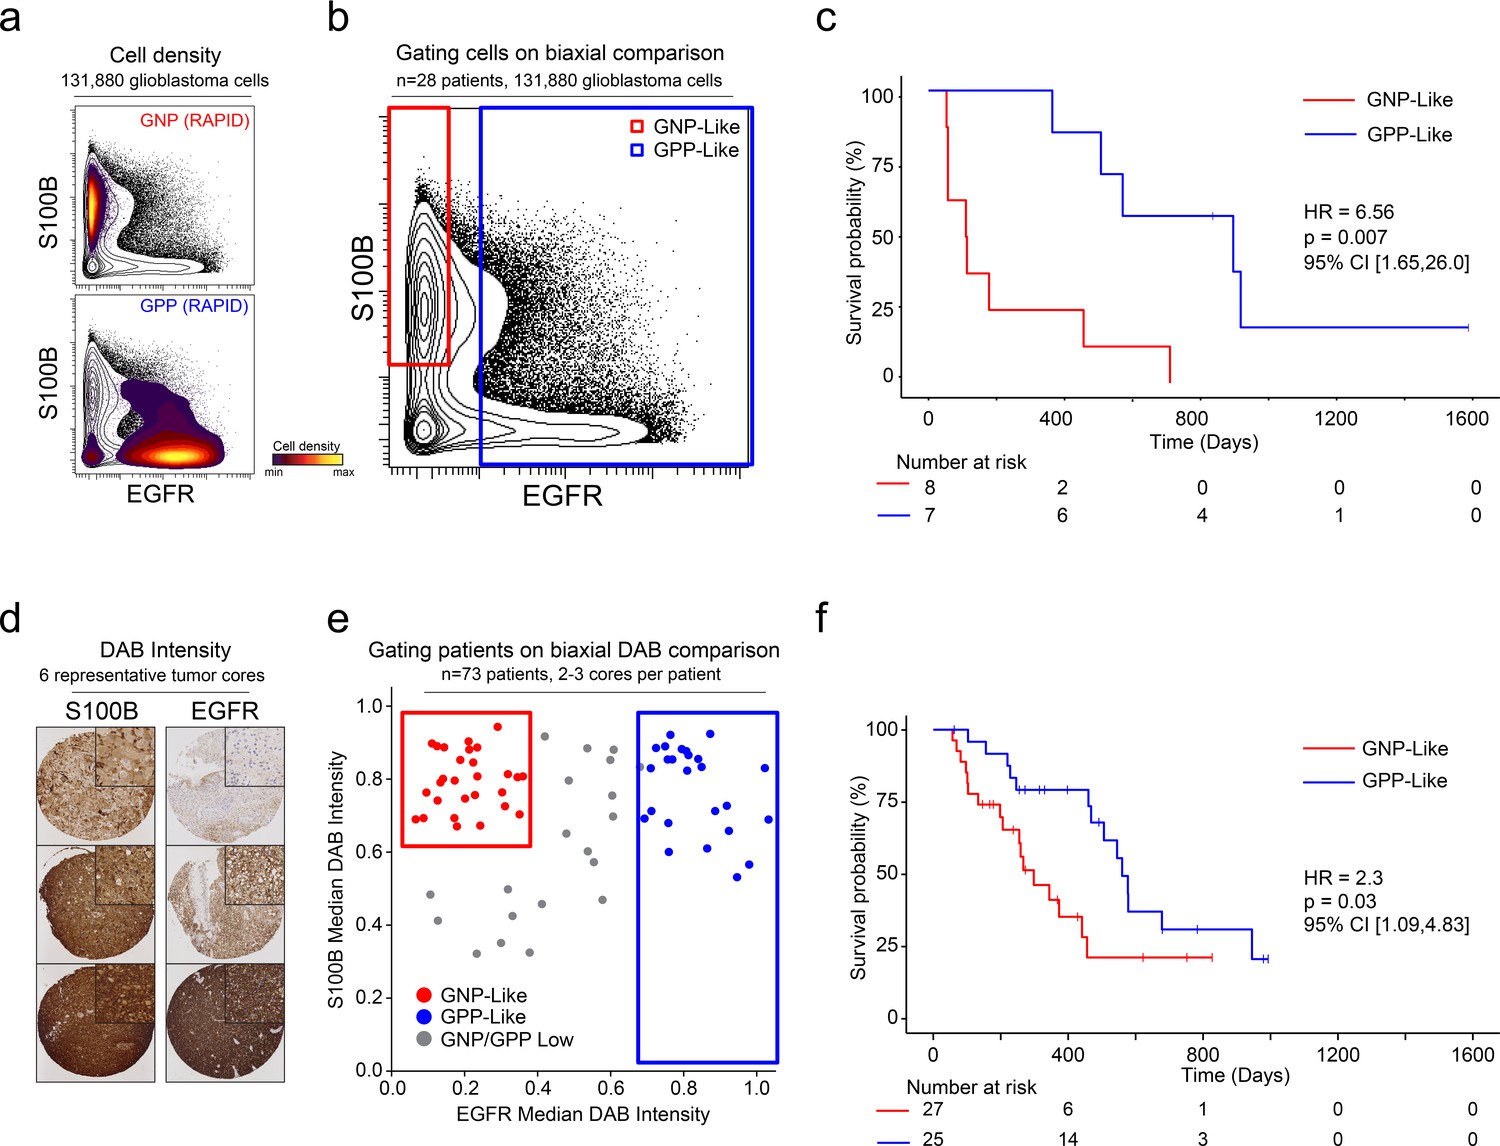
A simple gating strategy based on S100B and EGFR can stratify patients using mass cytometry or immunohistochemistry data.
(a) Biaxial plot of S100B (y-axis) and EGFR (x-axis). Gray contours depict all 131,880 cells from all patients. Density contour overlays depict GNP (top) or GPP (bottom) cells identified by the RAPID algorithm. (b) Biaxial plot of S100B (y-axis) and EGFR (x-axis). Gray contours depict all 131,880 cells from all patients as in (a). Red box indicates gate for S100B+/EGFR- cells, called GNP-like. Blue box indicates gate for EGFR+ cells, called GPP-like. (c) Kaplan Meier curve comparing overall survival (in days) of patients with high percentages of GNP-like cells in red (red gate in a, >65.7% = high) and patients with high percentages of GPP-like cells in blue (blue gate in a, >31.2% = high). The hazard ratio of death, calculated using a Cox proportional hazards model, is 6.56 (p=0.0007). (d) Example TMA cores stained for S100B (left) or EGFR (right). Brown signal is from 3,3′-Diaminobenzidine (DAB). (e) Graph depicting DAB signal intensity for S100B (y-axis) or EGFR (x-axis) from tissue microarray immunohistochemistry on 73 glioblastoma patient samples. The red box outlines patients described as GNP-like (S100Bhigh/EGFRlow) and the blue box outlines patients designated GPP-like (EGFRhigh). All other patients are shown in gray. (f) A Kaplan-Meier curve showing overall survival (in days) of patients in the GNP-like (red) or GPP-like (blue) groups. The hazard ratio of death, calculated using a Cox proportional hazards model, is 2.3 (p-value=0.03).
Tables
Key resources table
| Reagent type (species) or resource | Designation | Source or reference | Identifiers | Additional information |
|---|---|---|---|---|
| Biological sample (Homo Sapien) | Primary glioblastoma tumors | Vanderbilt University Medical Center | Freshly isolated from primary glioblastoma resections | |
| Reagent | Rhodium | Fluidigm | Cat# 201103A | MC (1:4000) |
| Antibody | Anti-Cyclin B1 (mouse-monoclonal) | BD Biosciences | RRID:AB_395287 Cat#554176 Clone: GNS-1 | MC (1:100) |
| Antibody | Anti-TUJ1 (mouse-monoclonal) | Biolegend | RRID:AB_2313773 Cat#801201 Clone: TUJ1 | MC (1:100) |
| Antibody | Anti-cCasp3 (rabbit-monoclonal) | Fluidigm | RRID:AB_2847863 Cat#3142004A Clone: 5A1E | MC (1:100) |
| Antibody | Anti-CD117 (mouse-monoclonal) | Fluidigm | RRID:AB_2847864 Cat#3143001B Clone:104D2 | MC (1:100) |
| Antibody | Anti-S100B (mouse-monoclonal) | BD Biosciences | RRID:AB_647296 Cat#612376 Clone: 19/S100B | MC (1:100) |
| Antibody | Anti-CD31 (mouse-monoclonal) | Fluidigm | RRID:AB_2737262 Cat#3145004B Clone: WM59 | MC (1:100) |
| Antibody | Anti-ɣH2AX (mouse-monoclonal) | Fluidigm | RRID:AB_2847865 Cat# 3147016A Clone: JBW301 | MC (1:100) |
| Antibody | Anti-CD34 (mouse-monoclonal) | Fluidigm | RRID:AB_2810243 Cat#3148001B Clone: 581 | MC (1:100) |
| Antibody | p-4E-BP1 (T37/T46) | Fluidigm | RRID:AB_2847866 Cat# 3149005A Clone: 236B4 | MC (1:100) |
| Antibody | Anti-p-STAT5 (Y694) (mouse-monoclonal) | Fluidigm | RRID:AB_2744690 Cat#3150005A Clone:47 | MC (1:100) |
| Antibody | Anti-BMX (mouse-monoclonal) | BD Biosciences | RRID:AB_2290762 Cat# 610793 Clone: 40/BMX | MC (1:100) |
| Antibody | Anti-p-AKT (S473) (rabbit-monoclonal) | Fluidigm | RRID:AB_2811246 Cat#3152005A Clone: D9E | MC (1:100) |
| Antibody | Anti-p-STAT1 (Y701) (rabbit-monoclonal) | Fluidigm | RRID:AB_2811248 Cat#3153003A Clone: 58D6 | MC (1:100) |
| Antibody | Anti-CD45 (mouse-monoclonal) | Fluidigm | RRID:AB_2810854 Cat# 3154001B Clone: HI30 | MC (1:400) |
| Antibody | Anti-NCAM/CD56 (mouse-monoclonal) | Biolegend | RRID:AB_604092 Cat# 318302 Clone: HCD56 | MC (1:100) |
| Antibody | Anti-p-p38 (T180/Y182) (rabbit-monoclonal) | Fluidigm | RRID:AB_2661826 Cat# 3156002A Clone: D3F9 | MC (1:100) |
| Antibody | Anti-p-STAT3 (Y705) (mouse-monoclonal) | Fluidigm | RRID:AB_2811100 Cat# 3158005A Clone: 4/P-STAT3 | MC (1:100) |
| Antibody | Anti-ITGα6/CD49F (rat-monoclonal) | Biolegend | RRID:AB_345296 Cat# 313602 Clone: GoH3 | MC (1:100) |
| Antibody | Anti-CD133 (mouse-monoclonal) | Miltenyi Biotech | RRID:AB_244339 Cat# 130-090-422 Clone: AC133 | MC (1:50) |
| Antibody | Anti-PDGFRα (mouse-monoclonal) | Biolegend | RRID:AB_755996 Cat#323502 Clone: 16A1 | MC (1:50) |
| Antibody | Anti-SOX2 (mouse-monoclonal) | BD Biosciences | RRID:AB_10694256 Cat# 561469 Clone: O30-678 | MC (1:100) |
| Antibody | Anti-SSEA-1/CD15 (mouse-monoclonal) | Fluidigm | RRID:AB_2810970 Cat# 3164001B Clone: W6D3 | MC (1:100) |
| Antibody | Anti-EGFR (mouse-monoclonal) | Biolegend | RRID:AB_10945161 Cat# 352902 Clone:AY13 | MC (1:100) |
| Antibody | Anti-p-NFκB p65 (S529) (mouse-monoclonal) | Fluidigm | RRID:AB_2847867 Cat# 3166006A Clone: K10-895.12.50 | MC (1:100) |
| Antibody | Anti-L1CAM (mouse-monoclonal) | BD Biosciences | RRID:AB_395337 Cat#554273 Clone: 5G3 | MC (1:100) |
| Antibody | Anti-Nestin (mouse-monoclonal) | Millipore | RRID:AB_2251134 Cat# MAB5326 Clone:10C2 | MC (1:100) |
| Antibody | Anti-CD44 (mouse- monoclonal) | Biolegend | RRID:AB_1501199 Cat# 338802 Clone: BJ18 | MC (1:100) |
| Antibody | Anti-GFAP (mouse-monoclonal) | BD Biosciences | RRID:AB_396366 Cat# 556328 Clone: 1B4 | MC (1:200) |
| Antibody | Anti-p-ERK1/2 (T202/Y204) (rabbit-monoclonal) | Fluidigm | RRID:AB_2811250 Cat#3171010A Clone: D13.14.4E | MC (1:100) |
| Antibody | Anti-p-S6 (S235/S236) (mouse-monoclonal) | Fluidigm | RRID:AB_2811251 Cat#3172008A Clone: N7-548 | MC (1:100) |
| Antibody | Anti SOX10 (mouse-monoclonal) | Santa Cruz | RRID:AB_10844002 Cat#sc-365692 Clone: A-2 | MC (1:100) |
| Antibody | Anti-HLA-DR (mouse-monoclonal) | Fluidigm | RRID:AB_2665397 Cat# 3174001B Clone: L243 | MC (1:200) |
| Antibody | Anti-p-HH3 (rat-monoclonal) | Fluidigm | RRID:AB_2847869 Cat# 3175012A Clone: HTA28 | MC (1:400) |
| Antibody | Anti-Histone H3 (rabbit-monoclonal) | Fluidigm | RRID:AB_2847870 Cat# 3176016A Clone: D1H2 | MC (1:200) |
| Antibody | S100B (rabbit-polyclonal) | Dako | RRID:AB_2811056 Cat#GA50461-2 | IHC (RTU) |
| Antibody | EGFR | Santa Cruz | RRID:AB_10920395 Cat# sc-373746 Clone: A-10 | IHC (1:100) |
| Software, algorithm | RAPID | https://github.com/cytolab/RAPID | ||
| Data files | FCS data files | https://flowrepository.org/id/FR-FCM-Z24K |
Additional files
-
Source data 1
TMA Source Data.
- https://cdn.elifesciences.org/articles/56879/elife-56879-data1-v2.xlsx
-
Supplementary file 1
RAPID and Citrus Comparison.
- https://cdn.elifesciences.org/articles/56879/elife-56879-supp1-v2.docx
-
Supplementary file 2
Cell Subset Abundance and Population Totals per Patient.
- https://cdn.elifesciences.org/articles/56879/elife-56879-supp2-v2.xlsx
-
Supplementary file 3
Patient Characteristics.
- https://cdn.elifesciences.org/articles/56879/elife-56879-supp3-v2.docx
-
Supplementary file 4
CyTOF Panel.
- https://cdn.elifesciences.org/articles/56879/elife-56879-supp4-v2.docx
-
Supplementary file 5
Tumor Cell Abundance per Cell Subset.
- https://cdn.elifesciences.org/articles/56879/elife-56879-supp5-v2.xlsx
-
Supplementary file 6
Individual per-patient view of marker expression and subset abundance.
- https://cdn.elifesciences.org/articles/56879/elife-56879-supp6-v2.pdf
-
Transparent reporting form
- https://cdn.elifesciences.org/articles/56879/elife-56879-transrepform-v2.docx
Download links
A two-part list of links to download the article, or parts of the article, in various formats.
Downloads (link to download the article as PDF)
Open citations (links to open the citations from this article in various online reference manager services)
Cite this article (links to download the citations from this article in formats compatible with various reference manager tools)
Unsupervised machine learning reveals risk stratifying glioblastoma tumor cells
eLife 9:e56879.
https://doi.org/10.7554/eLife.56879


