KDM5A mutations identified in autism spectrum disorder using forward genetics
- Eugene McDermott Center for Human Growth and Development, University of Texas Southwestern Medical Center, United States
- Department of Neuroscience, University of Texas Southwestern Medical Center, United States
- Center for the Genetics of Host Defense, University of Texas Southwestern Medical Center, United States
- Department of Molecular and Human Genetics, Baylor College of Medicine, United States
- Texas Children’s Hospital, United States
- Institute of Human Genetics, University of Leipzig Medical Center, Germany
- The Saxon Epilepsy Center Kleinwachau, Germany
- Department of Genetics, King Faisal Specialist Hospital and Research Centre, Saudi Arabia
- Cellular and Molecular Research Center, Sabzevar University of Medical Sciences, Islamic Republic of Iran
- Non-Communicable Diseases Research Center, Sabzevar University of Medical Sciences, Islamic Republic of Iran
- Pardis Clinical and Genetics Laboratory, Islamic Republic of Iran
- Division of Human Genetics, Avicenna Research Institute, Mashhad University of Medical Sciences, Islamic Republic of Iran
- Greenwood Genetic Center, United States
- Department of Medical Genetics, University of British Columbia, British Columbia Children’s and Women’s Hospital Research Institute, Canada
- Department of Genetics, King Saud Medical City, Saudi Arabia
- Department of Pediatrics and Genetics, University of Colorado School of Medicine, United States
- Department of Neuromuscular Diseases, University College London, Queen Square Institute of Neurology, United Kingdom
- Department of Psychiatry, University of Texas Southwestern Medical Center, United States
- Peter O’Donnell Jr. Brain Institute, University of Texas Southwestern Medical Center, United States
Figures
Figure 1 with 2 supplements
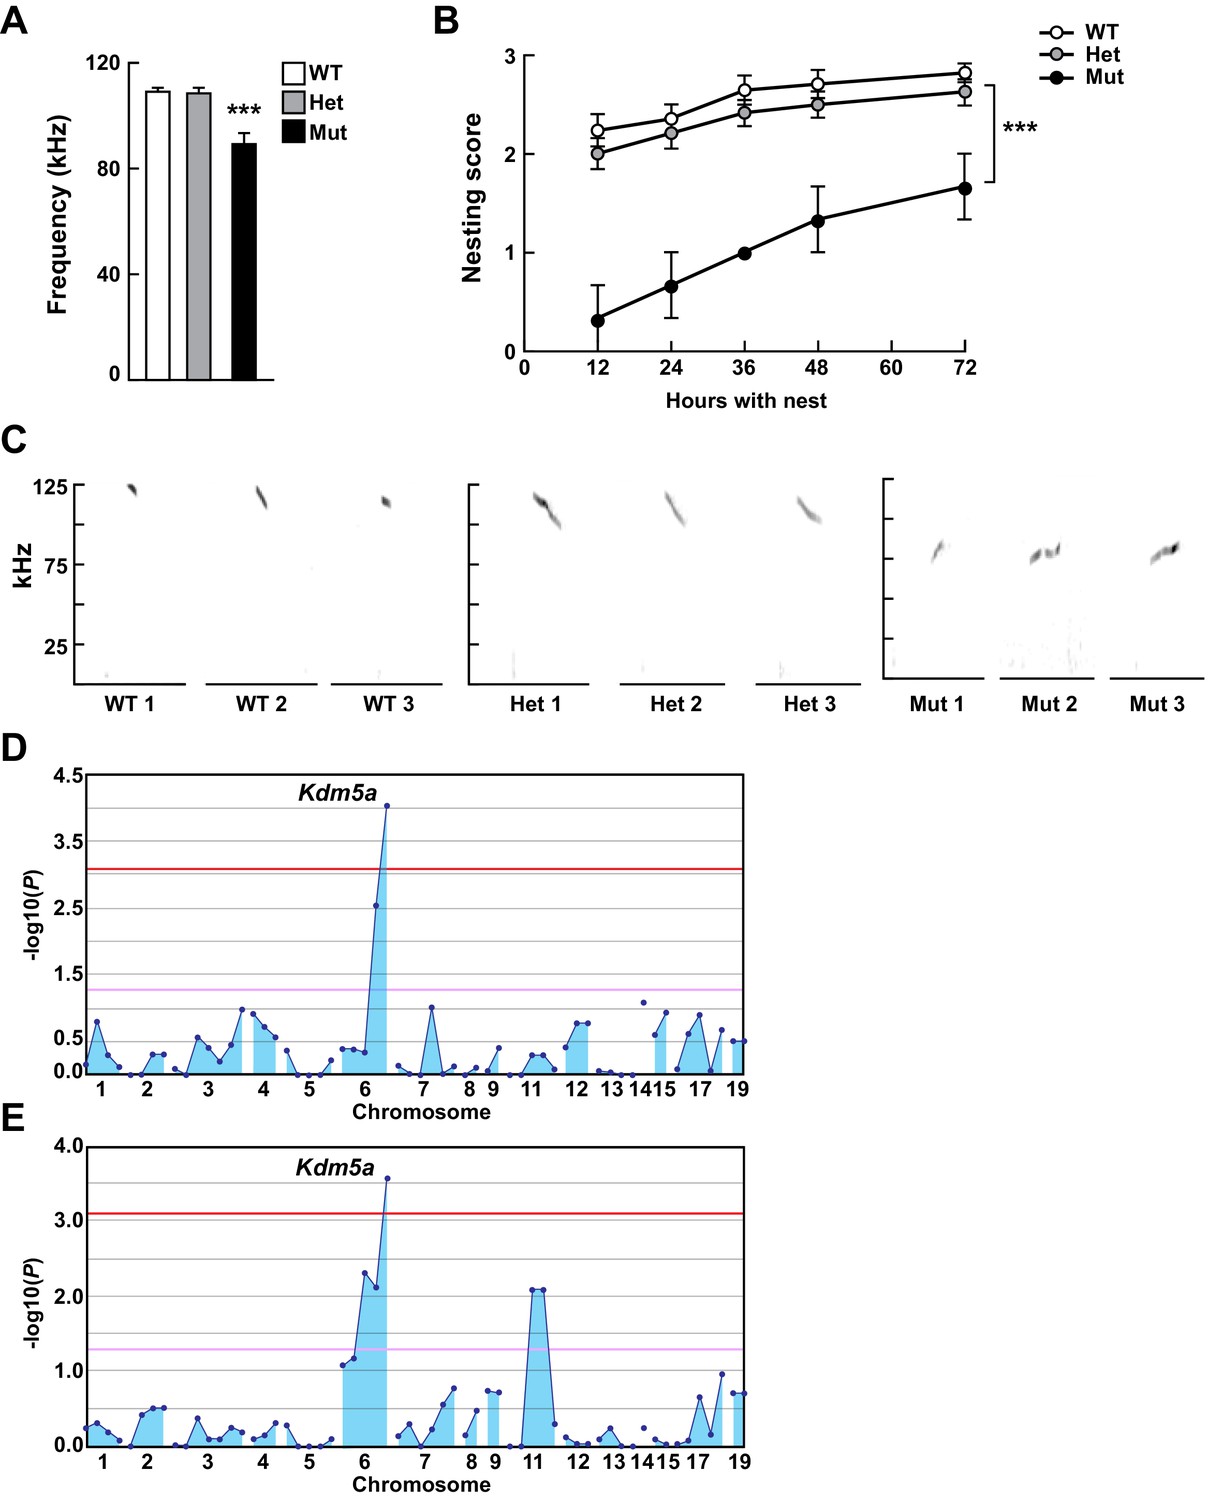
Mapping Selbst, an ASD-like phenotype of altered vocalization.
(A, B) Quantitative phenotype data (maximum peak frequency (A) and nesting score (B)) were used for linkage analyses (n = 17 WT, 24 Het, 3 Mut). Corresponding phenotypic data plotted against genotype at the Kdm5a mutation site are shown. Values are mean ± SEM ((A) ***p=0.0001; (B) time p<0.0001, genotype ***p=0.0003, time x genotype p=0.5155). Data were analyzed using ordinary one-way ANOVA (A) or two-way ANOVA (B), followed by Tukey's multiple comparisons test. (C) Representative spectrograms of vocalizations from WT, heterozygous (Het), and homozygous (Mut) mutant mice (n = 3 WT, 3 Het, 3 Mut). (D, E) Linkage plots showing P values calculated using the recessive model for the ultrasonic vocalization (USV) (D) and the nesting (E) phenotypes. The -log10 P values (y axis) are plotted against the chromosomal positions of 60 mutations (x axis) identified in the G1 founder of the pedigree. Horizontal red and pink lines indicate thresholds of p=0.05 with or without Bonferroni correction, respectively.
Figure 1—figure supplement 1
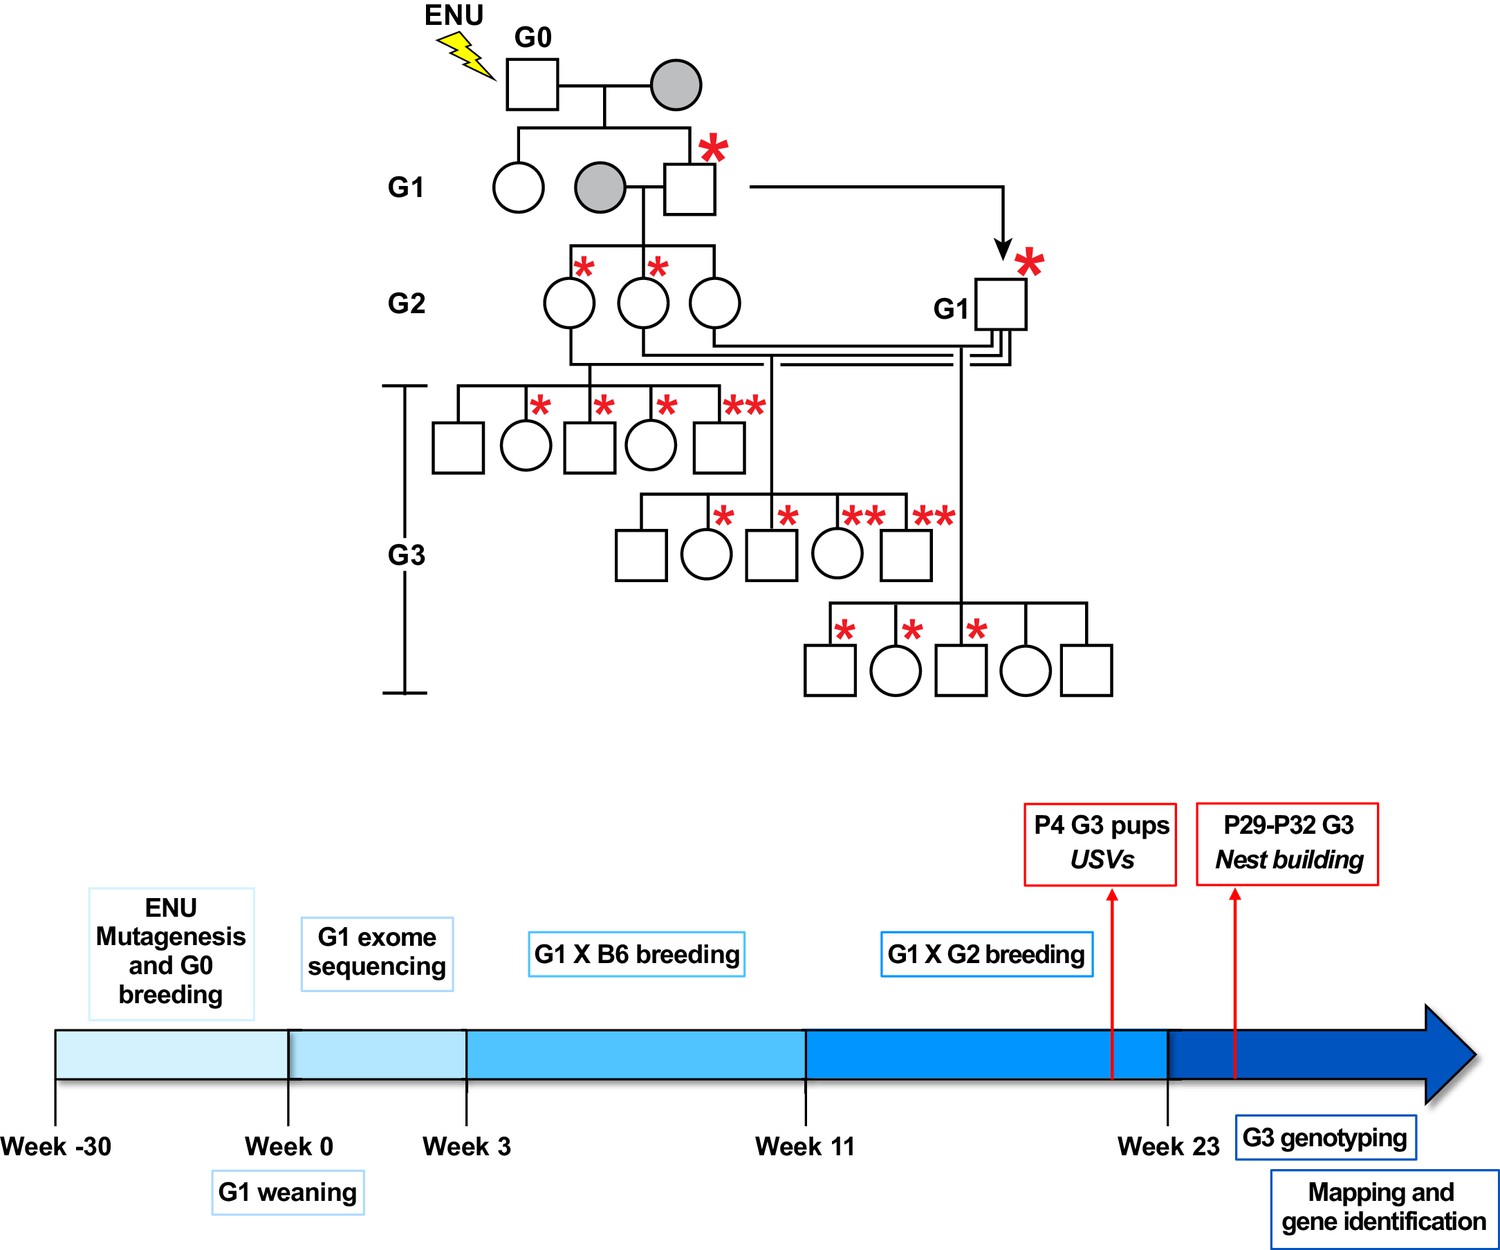
Summary of the gene identification pipeline.
Related to Figure 1. Mutagenized G0 males were bred to WT C57BL/6J (B6) females (grey). G1 males, carrying mutations derived from the G0 male, were crossed to WT B6 females (grey). G2 females were then backcrossed to their G1 father to produce ~30–50 G3 mice with ENU-induced mutations. Asterisks represent mutations derived from the G0 male. Large asterisks indicate initial germline transmission. USVs were recorded from P4 G3 pups and nest building was assessed between P29 and P32.
Figure 1—figure supplement 2
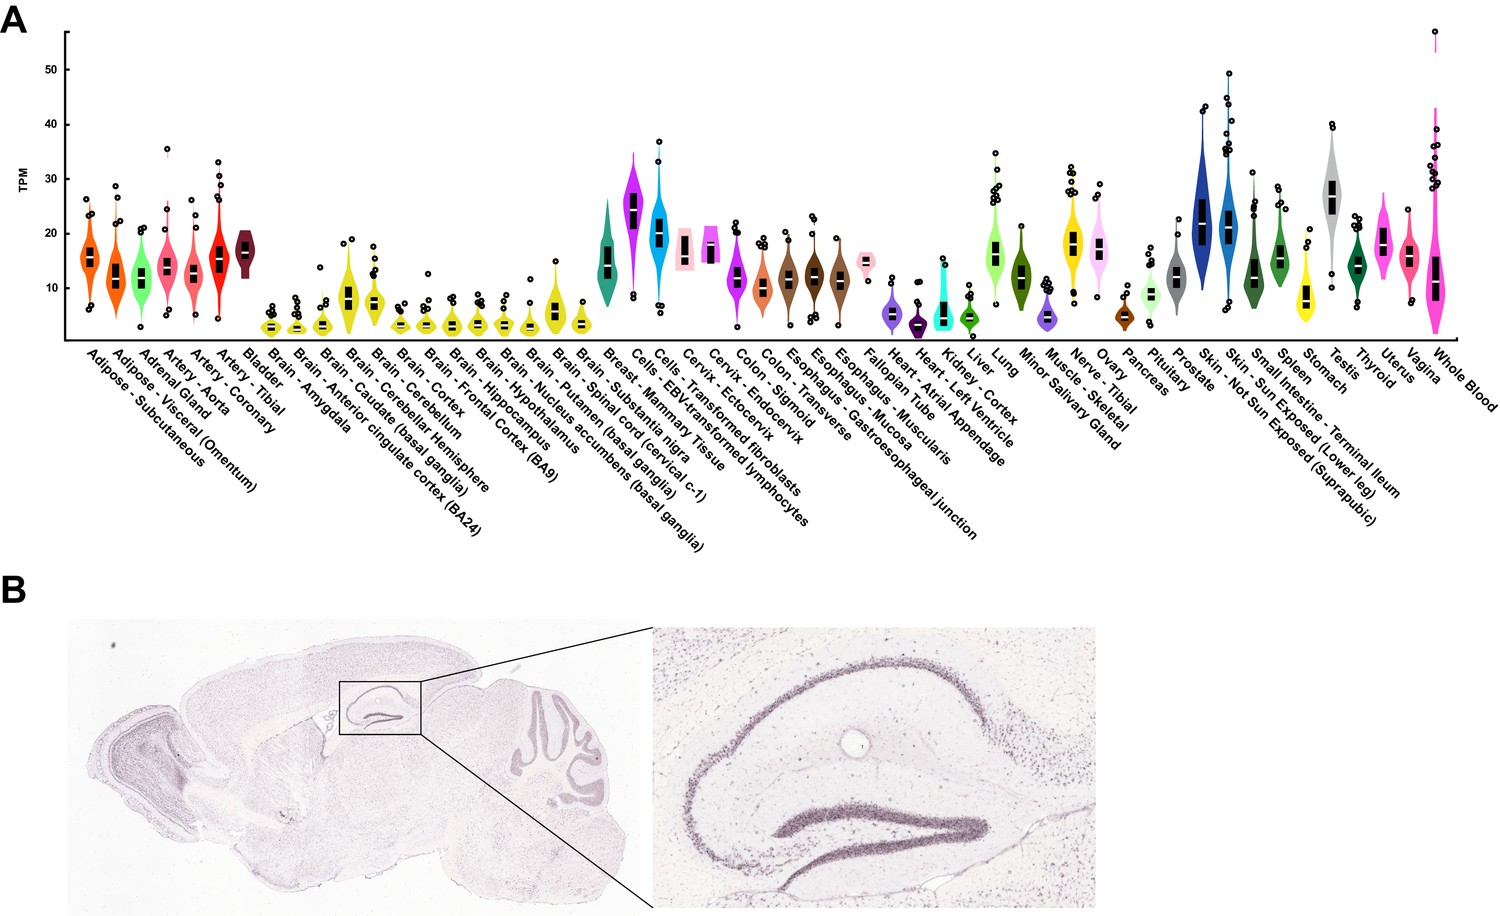
KDM5A is ubiquitously expressed across tissues.
Related to Figure 1. (A) Human KDM5A tissue expression data publicly available from GTEx (Genotype-Tissue Expression Portal). (B) Kdm5a expression in the mouse brain, with inset showing high hippocampal expression. Data publicly available from the Allen Mouse Brain Atlas.
Figure 2 with 4 supplements

Loss of Kdm5a results in abnormal vocalizations, repetitive behaviors, and deficits in social behavior, learning, and memory.
(A) Generation of Kdm5a-/- constitutive knockout (KO) mice. Schematic of the targeted Kdm5a locus disrupting exon 13 resulting in a frameshift and loss of KDM5A. (B) Western blot analysis from cortical tissue lysates of WT, Kdm5a+/- (Het), or Kdm5a-/- (KO) mice showed a ~ 50% decrease in KDM5A protein level in the Het and complete loss of KDM5A in the KO mice compared to WT. Representative immunoblots from three independent experiments (n = 3 WT, 3 Het, 3 KO). (C) KO mice have severe reduction in the maximum peak frequency of ultrasonic vocalizations (USVs) and in the number of USVs measured at P4 (***p<0.0001; n = 22 WT, 49 Het, 9 KO). (D) KO mice spent 60% of the time wringing and clasping their forepaws compared to 5% for WT and 4% for Het littermates (***p<0.0001; n = 25 WT, 25 Het, 10 KO). (E) KO mice spent more time self-grooming compared to WT and Het littermates (*p=0.0107; n = 6 WT, 7 Het, 5 KO). During the duration of the analysis, WT and Het mice had ~1-2 grooming events, while KO mice had ~3-4 grooming events. (F) KO mice traveled a longer distance, and spent less time in the center and more time in the periphery of the open field compared to WT and Het littermates (total distance: **p=0.0014, time in center: **p=0.0015, time in periphery: *p=0.0143; n = 13 WT, 13 Het, 7 KO). (G) KO mice showed decreased social interaction with a novel partner mouse compared to WT and Het littermates (**p=0.0021; n = 11 WT, 8 Het, 6 KO). For (C), (D), (E), (F), and (G) data were analyzed using ordinary one-way ANOVA followed by Tukey's multiple comparisons test. (H) Compared to their control littermates, KO mice have an impaired learning shown by the latency to locate the hidden platform that does not decrease during the training phase of the Morris water maze task (day p<0.0001, genotype ***p<0.0001, day x genotype p=0.0012; n = 13 WT, 10 Het, 6 KO). Data were analyzed using two-way ANOVA followed by Tukey's multiple comparisons test. (I) KO mice performed poorly in the Morris water maze probe test compared to their control littermates and spent more time in non-target quadrants (Others) (WT: **p=0.0057, Het: **p=0.0034, KO: ***p<0.0001, target WT vs target KO: ***p=0.0004, target Het vs target KO: ***p<0.0001, target WT vs target Het: p=0.4433; n = 13 WT, 10 Het, 6 KO). Data were analyzed using unpaired t test for the within-genotype analyses and ordinary one-way ANOVA followed by Tukey's multiple comparisons test for the across-genotype analyses. All behaviors, except USV analysis, were assessed at 5–9 weeks of age. All values are mean ± SEM.
Figure 2—figure supplement 1
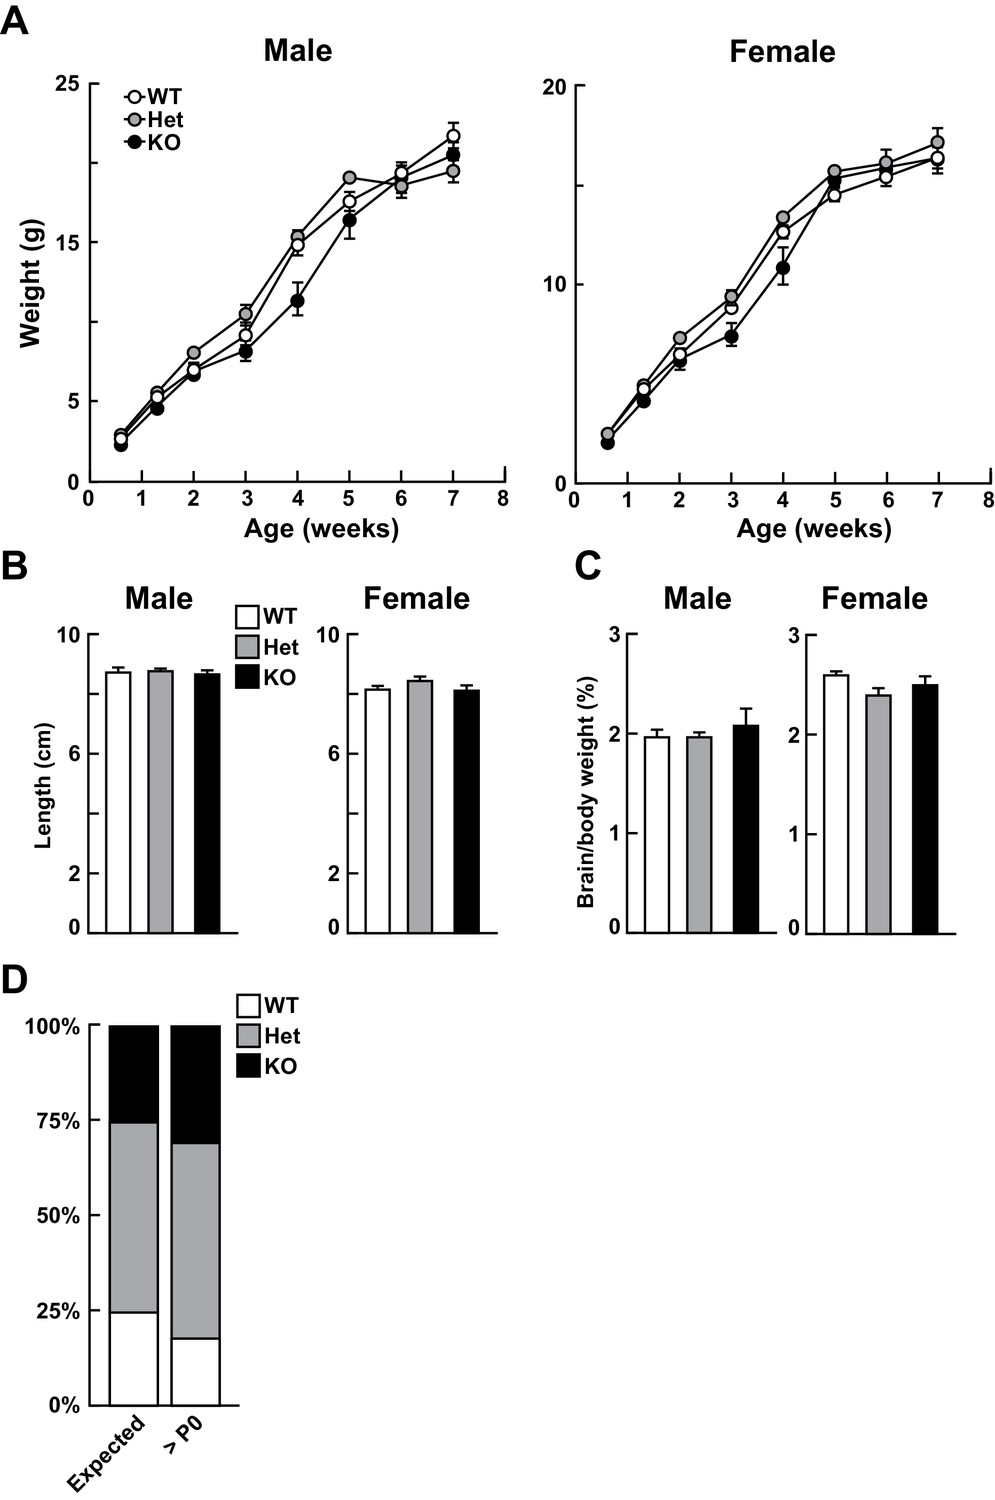
Loss of Kdm5a does not affect growth.
Related to Figure 2. (A) Both male and female Kdm5a-/- (constitutive knockout, KO) mice do not show any significant change in body weight compared to wild type (WT) or Kdm5a+/- (Het) littermates (males: time p<0.0001, genotype p=0.1292, time x genotype p<0.0001; males: n = 7–11 WT, 7–11 Het, 3–5 KO; females: time p<0.0001, genotype p=0.0904, time x genotype p<0.0001; females: n = 7–16 WT, 6–14 Het, 6–8 KO). Data were analyzed using a mixed-effects model (restricted maximum likelihood; REML) followed by Tukey's multiple comparisons test. (B) Male and female KO mice do not show any significant change in body length compared to WT or Het littermates (nose-to-rump length measured at 6–8 weeks of age; males: p=0.7368, n = 7 WT, 12 Het, 5 KO; females: p=0.1064, n = 7 WT, 12 Het, 8 KO). (C) Brain to body weight ratios measured at 6–8 weeks of age were not significantly different between genotypes (males: p=0.4618, n = 7 WT, 12 Het, 3 KO; females: p=0.1016, n = 6 WT, 11 Het, 6 KO). Values are mean ± SEM. For (B) and (C), data were analyzed using ordinary one-way ANOVA followed by Tukey's multiple comparisons test. (D) KO mice are born in expected Mendelian ratios. The number of mice born from each genotype was not significantly different from the number of expected mice based on Mendelian ratios. Data from seven litters, >postnatal day (P)0, X2 test, p=0.4419.
Figure 2—figure supplement 2
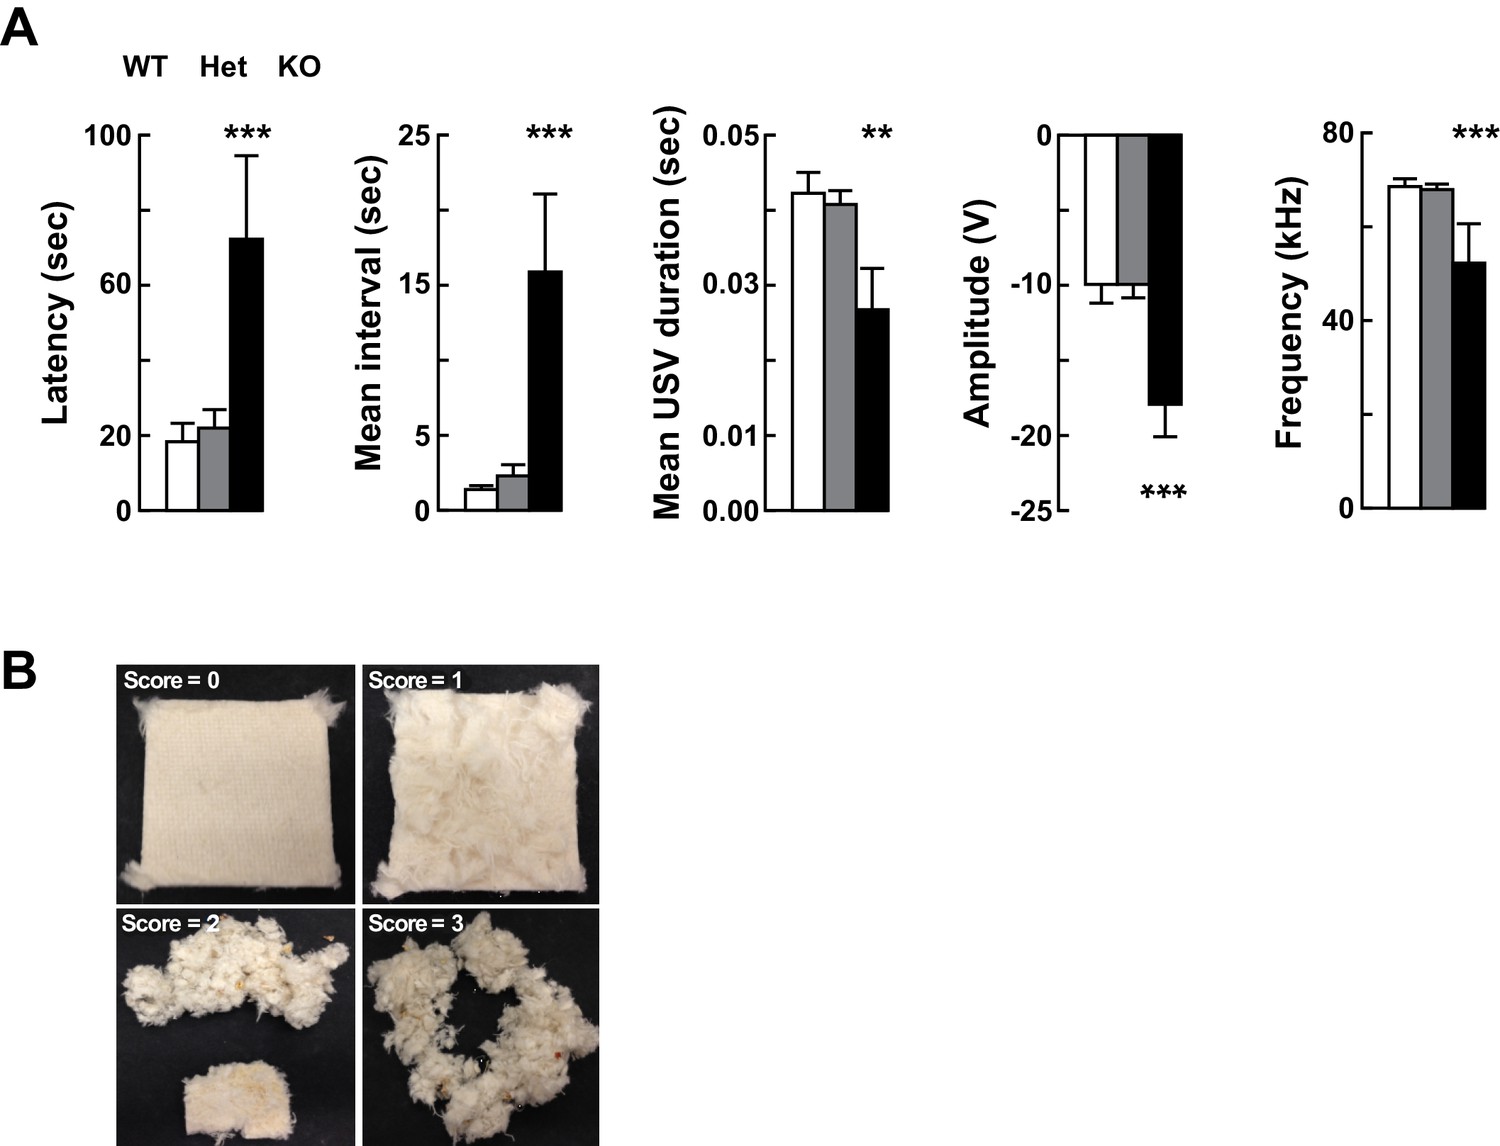
Altered vocalizations following loss of Kdm5a.
Related to Figure 2. (A) Kdm5a KO mice have an increased latency to emit ultrasonic vocalizations (USVs), an increased interval between USVs, and reductions in duration, amplitude, and frequency of USVs (latency to call: ***p=0.0002, n = 22 WT, 49 Het, 9 KO; mean interval between USVs: ***p<0.0001, n = 22 WT, 49 Het, 9 KO; mean USV duration: **p=0.0061, n = 22 WT, 49 Het, 7 KO; max peak amplitude: ***p=0.0003, n = 22 WT, 49 Het, 9 KO; mean peak frequency: ***p≤0.0001, n = 22 WT, 49 Het, 9 KO). USVs were measured at P4. Values are mean ± SEM. Data were analyzed using ordinary one-way ANOVA followed by Tukey's multiple comparisons test. (B) Nest-building scoring, with 0 being no nest construction to 3 being a well-structured nest.
Figure 2—video 1
Related to Figure 2.
Video recording of male WT and Kdm5a-/- mice during the modified tail suspension test at 6–7 weeks of age to quantify forepaw wringing.
Figure 2—video 2
Related to Figure 2.
Video recording of female WT and Kdm5a-/- mice during the modified tail suspension test at 6–7 weeks of age to quantify forepaw wringing.
Figure 3
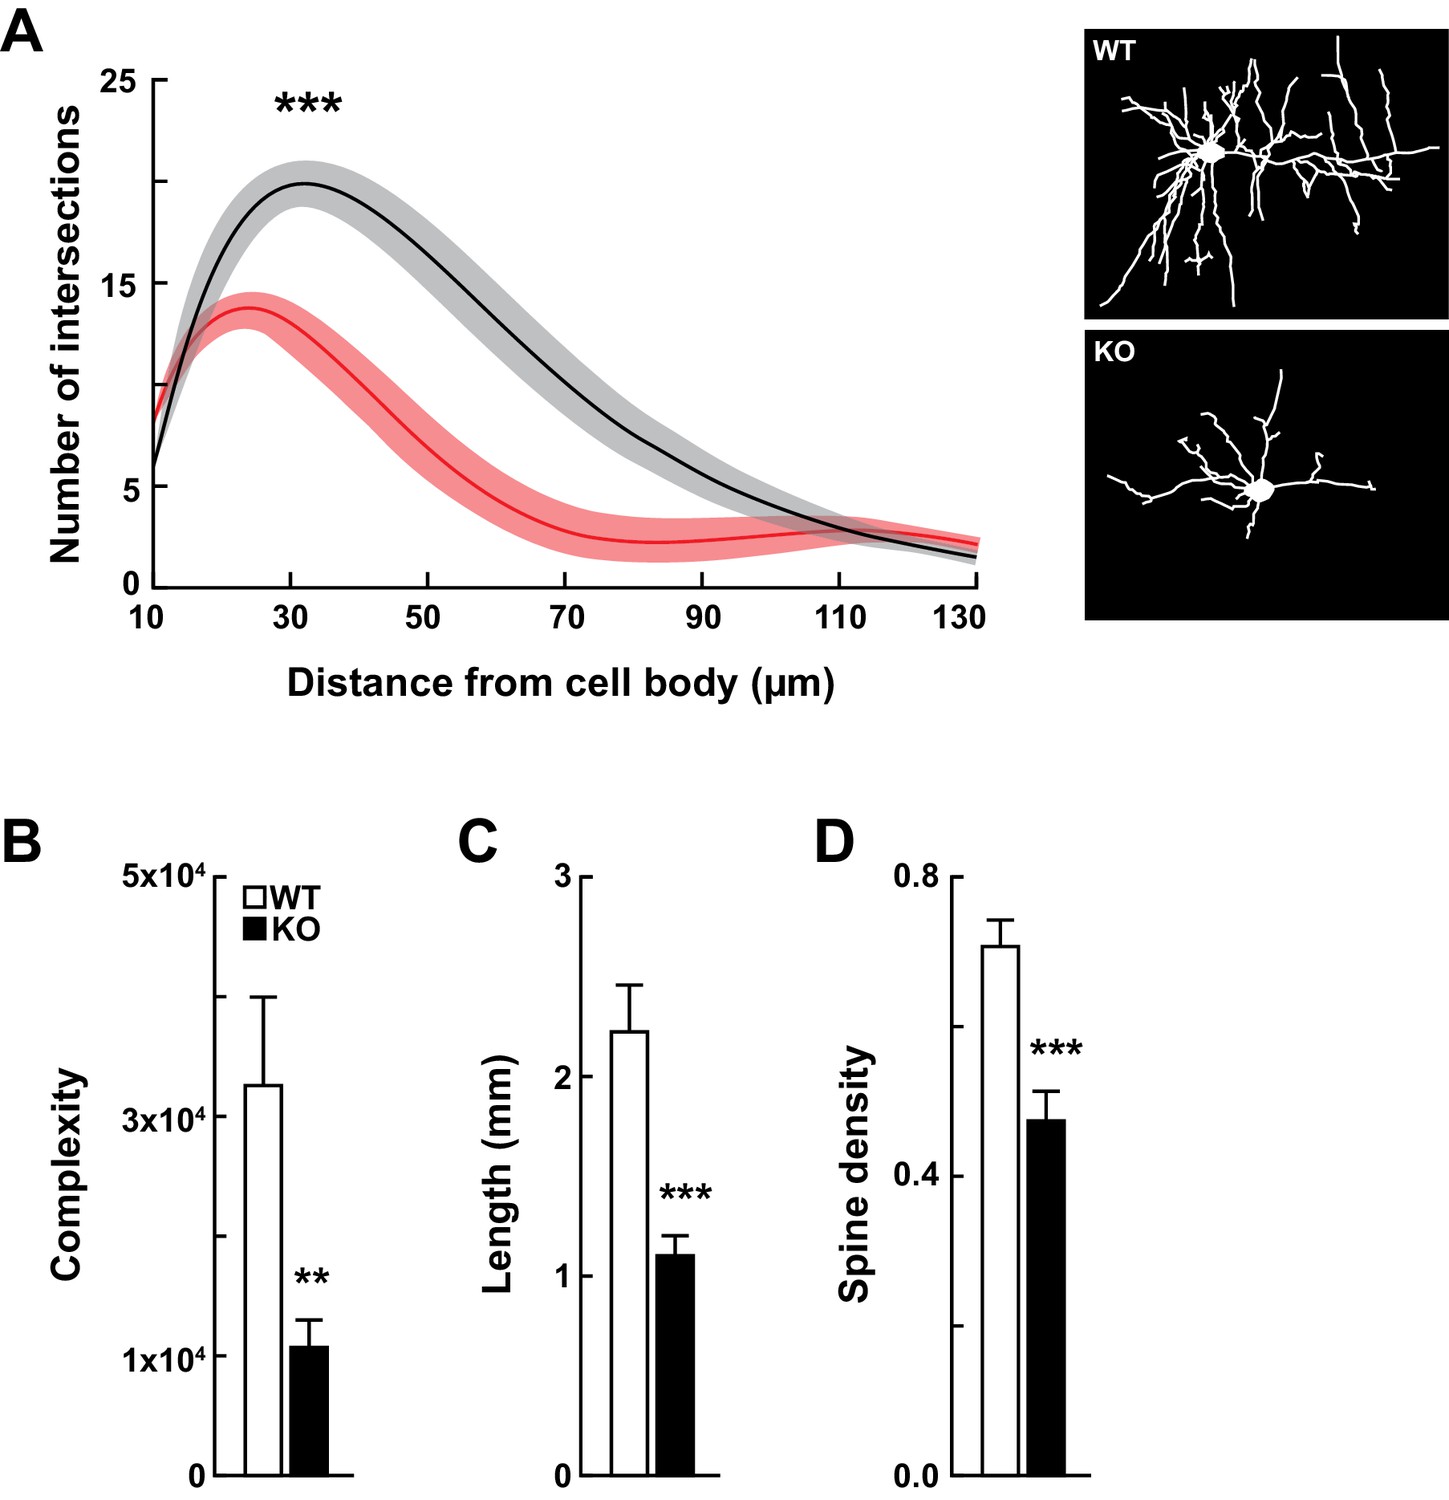
Kdm5a knockout mice have impaired dendritic morphogenesis.
(A) Sholl analysis from Golgi-Cox-stained neurons revealed a reduction in dendritic complexity of cortical neurons from KO mice (red) compared to WT (black) littermates (***p<0.0001). Data were analyzed using two-way ANOVA followed by Tukey's multiple comparisons test. (Right) Representative tracings of Golgi-Cox-stained cortical layer II/III neurons. Golgi-Cox staining showed significantly reduced dendritic complexity (B, **p=0.0066), length (C, ***p<0.0001), and spine density (D, ***p<0.0001) of cortical neurons from KO mice compared to WT littermates. Data were obtained from basal dendrites of cortical layer II/III neurons from mice at 14–16 weeks of age. Data were analyzed using unpaired t test. All values are mean ± SEM (n = 15 WT, 15 KO).
Figure 4 with 4 supplements
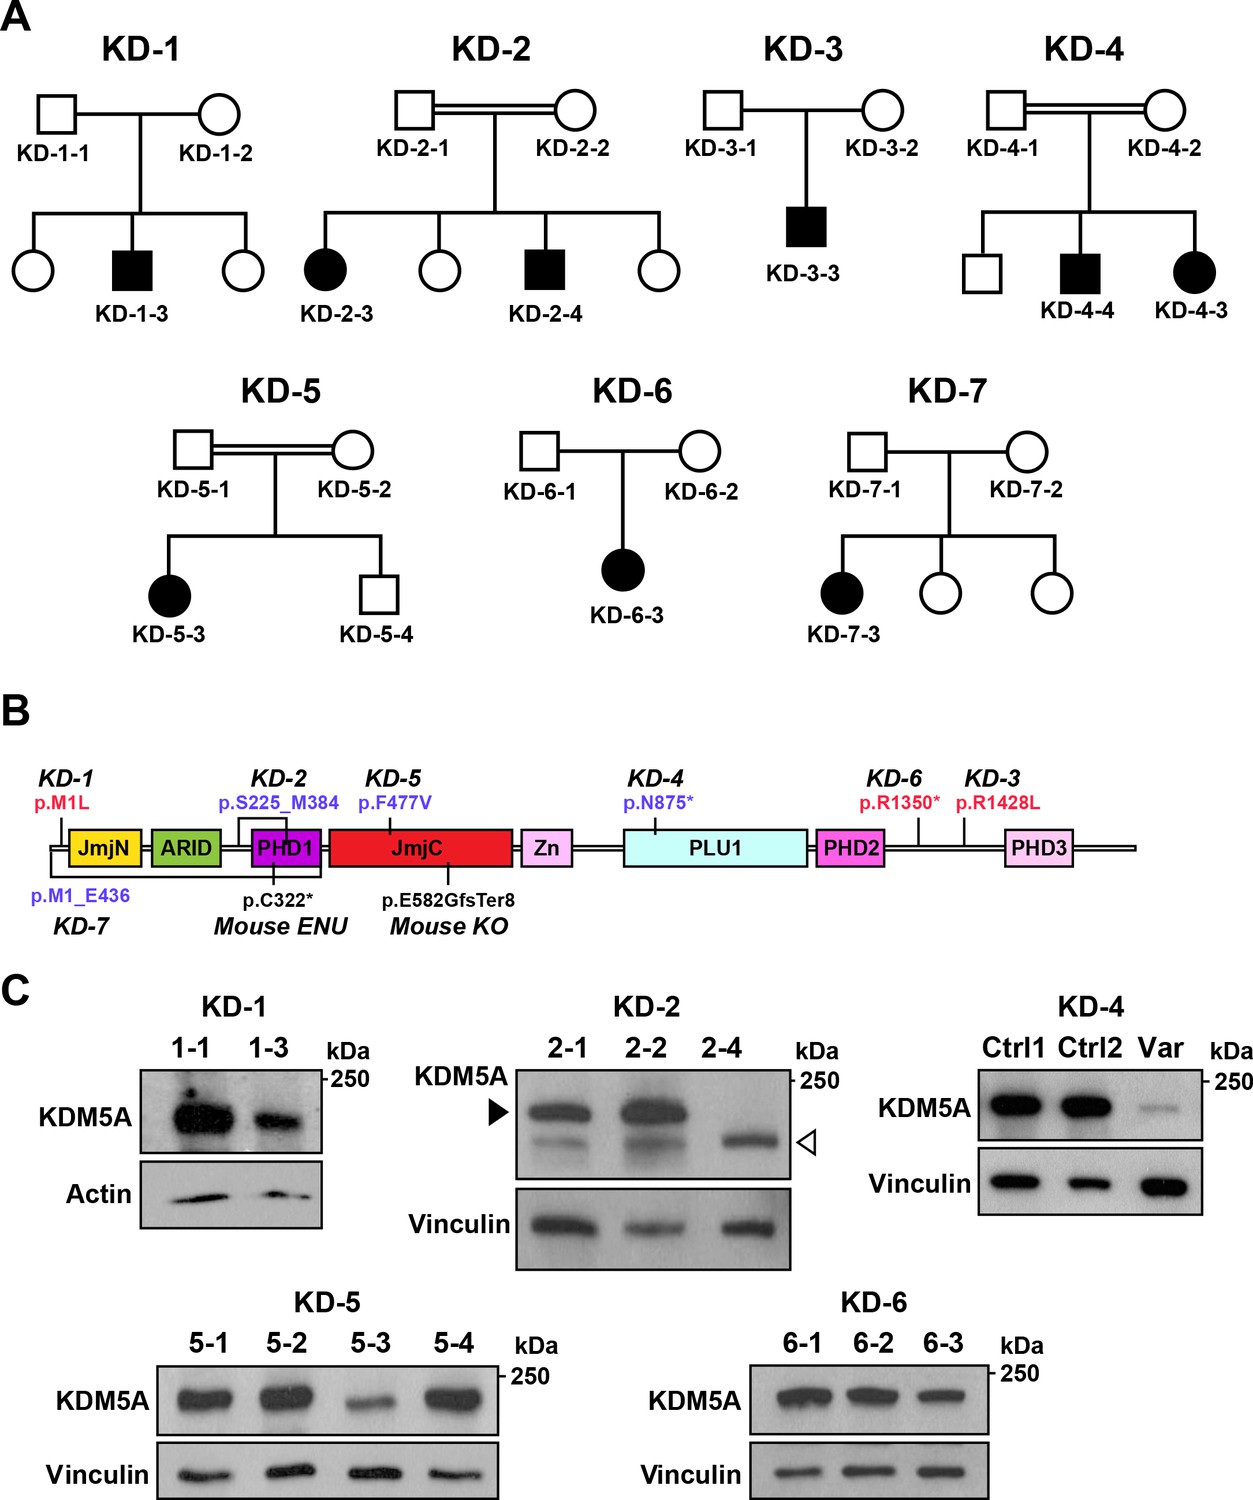
Identification of KDM5A mutations in patients with ASD.
(A) Pedigrees of seven families with KDM5A mutations in nine probands with ASD. Double lines: first cousin status; circles: females; squares: males; shaded symbols: affected individuals. (B) A schematic of KDM5A domains and location of the identified mutations. De novo and recessive mutations are indicated in red and blue, respectively. The Selbst mutation is a cysteine to premature stop codon substitution at position 322 of the protein. ARID, A-T rich interaction domain; JmjC, Jumonji C; JmjN, Jumonji N; PHD, plant homeodomain; PLU1, putative DNA/chromatin binding motif; Zn, zinc finger. (C) Western blot analysis of lymphoblastoid cell line lysates from affected individuals (KD-1–3, KD-2–4, KD-5–3, and KD-6–3) and unaffected family members (KD-1–1, KD-2–1, KD-2–2, KD-5–1, KD-5–2, KD-5–4, KD-6–1, and KD-6–2) showed reduced KDM5A protein in affected individuals KD-1–3, KD-5–3, and KD-6–3, and a truncated KDM5A protein in affected individual KD-2–4. Western blot analysis of HEK293T cells with knock-in of the splice site mutation present in affected individuals KD-4–3 and KD-4–4 (Var) and HEK293T cells which underwent transfection but kept the reference sequence (Ctrl 1 and Ctrl 2), showed a decrease in KDM5A protein level in the targeted cells compared to control cells. β-actin and vinculin were used as loading controls. The black arrowhead points to the KDM5A band (196 kDa) and the white arrowhead points to the truncated KDM5A band (174 kDa).
Figure 4—figure supplement 1
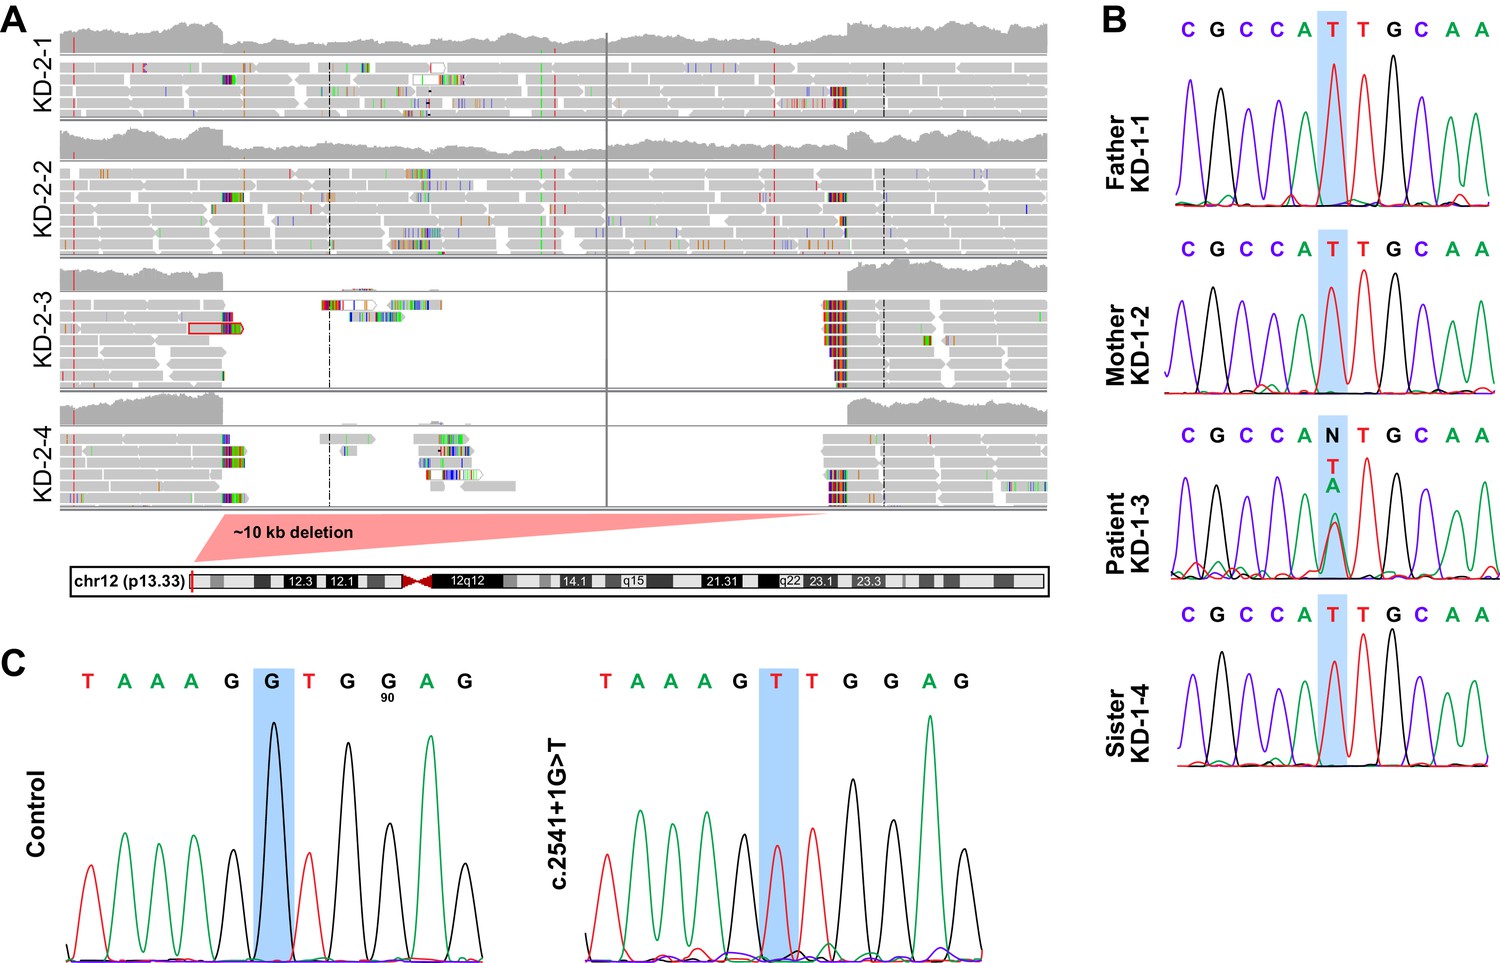
Related to Figure 4.
(A) Deletion map in family KD-2. Patients KD-2–3 and KD-2–4 have exons 6 through 9 of KDM5A deleted (~10 kb), which leads to the formation of a truncated protein. (B) Sanger sequencing in family KD-1. Patient KD-1–3 has a de novo missense mutation (A to T) in the first methionine of KDM5A, which gets substituted by a leucine. Data shown for reverse sequence. (C) Sanger sequencing of HEK293T cells with knock-in of the splice site mutation present in KD-4. The successful knock-in clone has a homozygous G to T substitution.
Figure 4—figure supplement 2
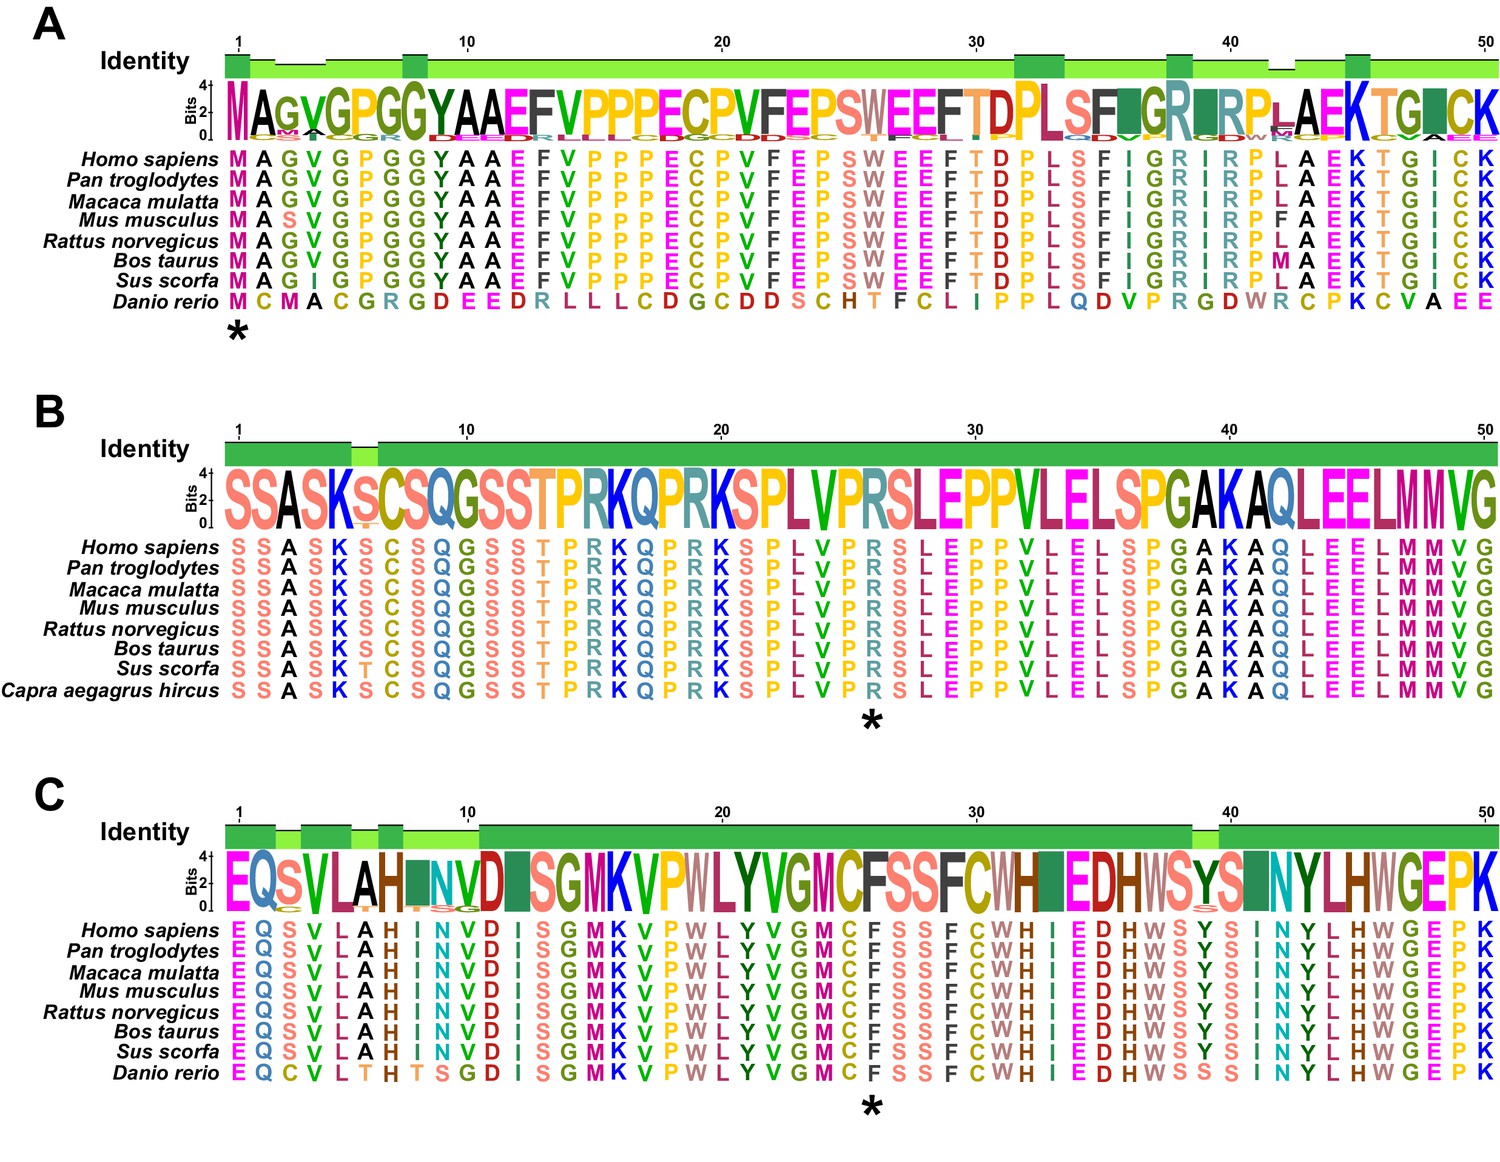
Related to Figure 4.
The Met1 (A), Arg1428 (B), and Phe477 (C) residues of KDM5A (denoted by the asterisks) are highly conserved across species. Met1, Arg1428, and Phe477 are mutated in KD-1–3, KD-3–3, and KD-5–3, respectively.
Figure 4—video 1
Related to Figure 4.
Video recording of patient KD-4–3.
Figure 4—video 2
Related to Figure 4.
Video recording of patient KD-4–4.
Figure 5 with 3 supplements
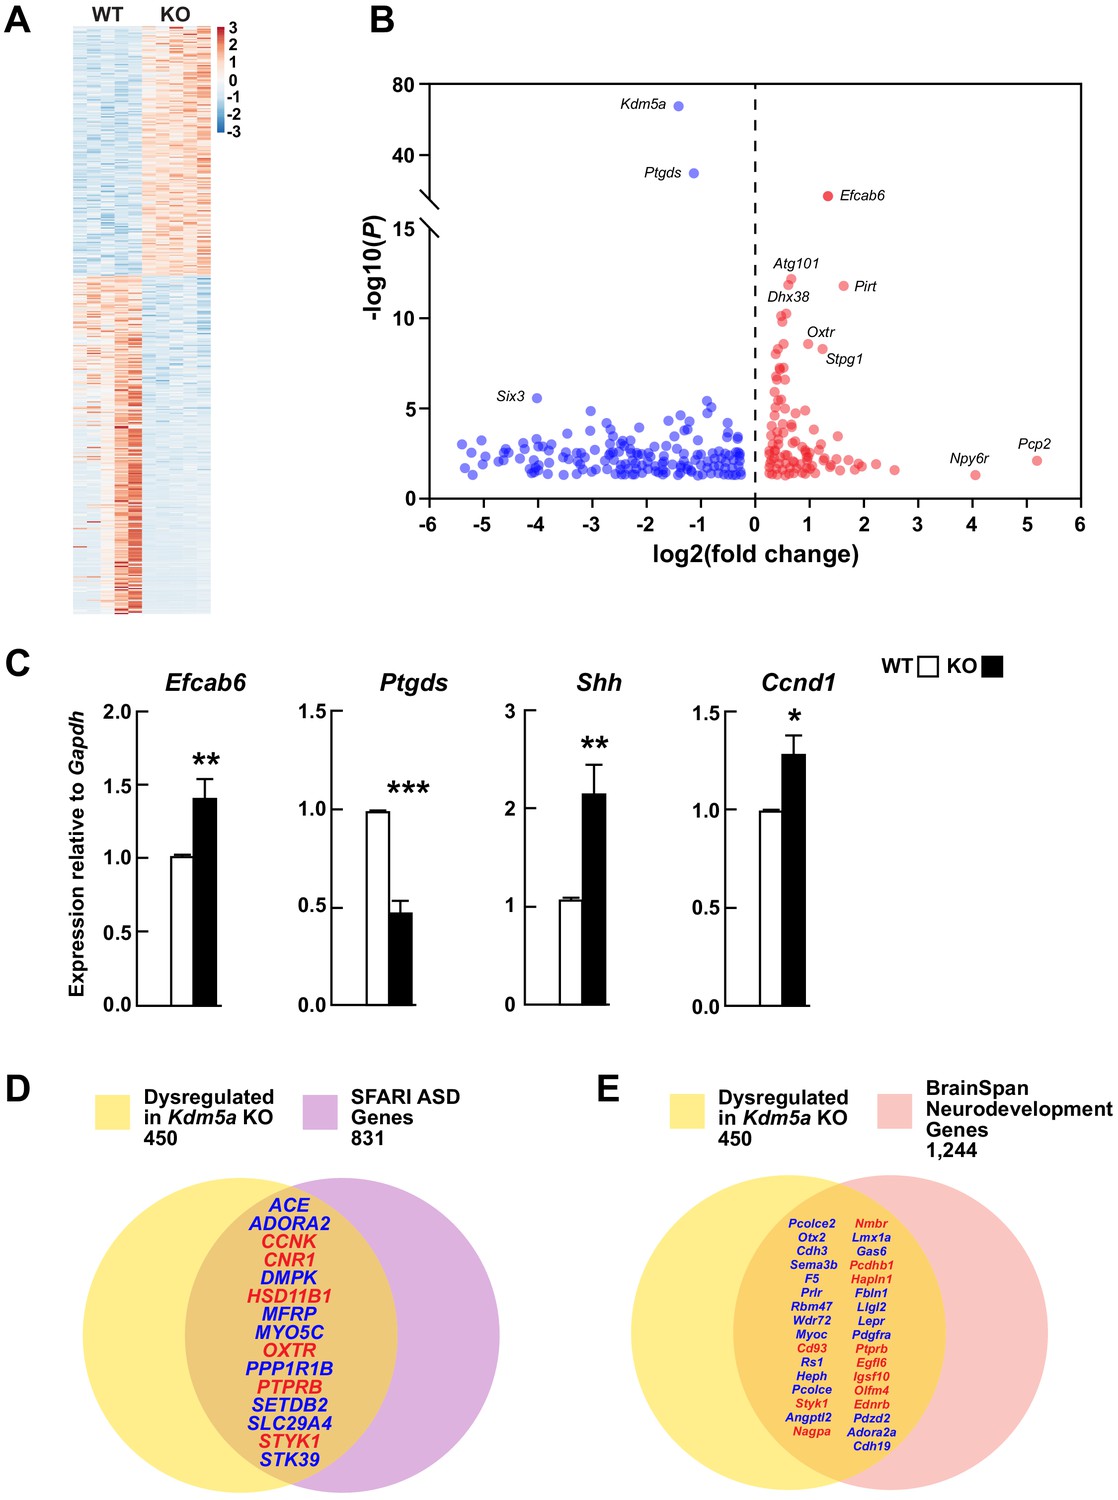
Transcriptional dysregulation in hippocampi of Kdm5a knockout mice.
(A) Heatmap showing hippocampal gene expression profiles in WT and Kdm5a-/- (KO) mice at 6–8 weeks of age (n = 5 WT, 5 KO). Red and blue indicate upregulation and downregulation, respectively. Data plotted from genes with a log2 fold change ≥ |0.3| and FDR-corrected p≤0.05. (B) Volcano plot of the RNA-seq data showing the log2 fold change in gene expression in Kdm5a-/- compared to WT hippocampi. (C) qRT-PCR gene expression validation of the most upregulated and downregulated genes in Kdm5a-/- hippocampi, Efcab6 and Ptgds, respectively, as well as upregulation of Shh and its downstream target Ccnd1. Values are mean ± SEM (Efcab6: **p=0.0084, Ptgds: ***p<0.0001, Shh: **p=0.0056, Ccnd1: *p=0.0114; n = 5 WT, 5 KO). Data were analyzed using unpaired t test. Genes dysregulated following loss of Kdm5a overlap with homologs of known ASD genes (D) and of genes underlying neurodevelopment (E). Red and blue indicate upregulated and downregulated genes, respectively.
-
Figure 5—source data 1
Genes dysregulated in the hippocampus of Kdm5a KO mice.
A total of 450 genes were differentially dysregulated in the Kdm5a KO compared to WT (FDR-corrected p≤0.05; log2 fold change ≥ |0.3|; n = 5 WT, 5 KO).
- https://cdn.elifesciences.org/articles/56883/elife-56883-fig5-data1-v1.xlsx
Figure 5—figure supplement 1
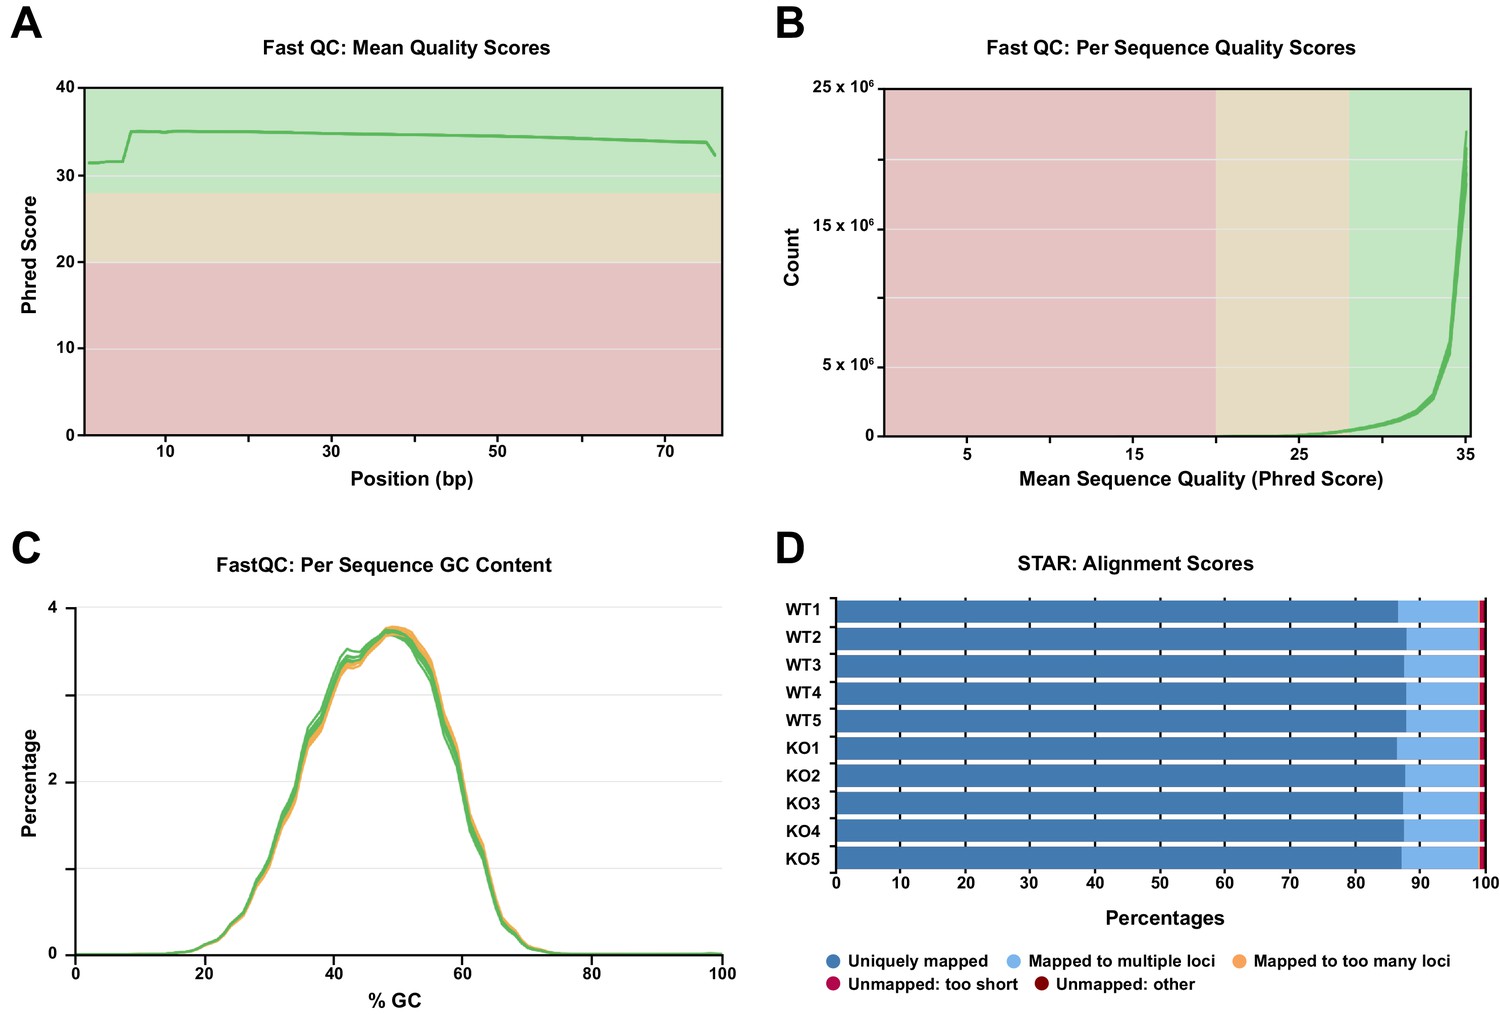
Quality control metrics of RNA-seq reads as determined by FastQC and STAR.
Related to Figure 5. (A) Phred quality score distribution across all bases. All sequences had a quality score above 30. (B) Quality score distribution over all sequences. (C) The mean GC content (%) distribution for all sequences. (D) STAR alignment results showing that for each sample sequenced (n = 5 WT, 5 KO), 87% to 88% of reads uniquely mapped to the reference mouse genome, with less than 1% of reads unmapped.
Figure 5—figure supplement 2
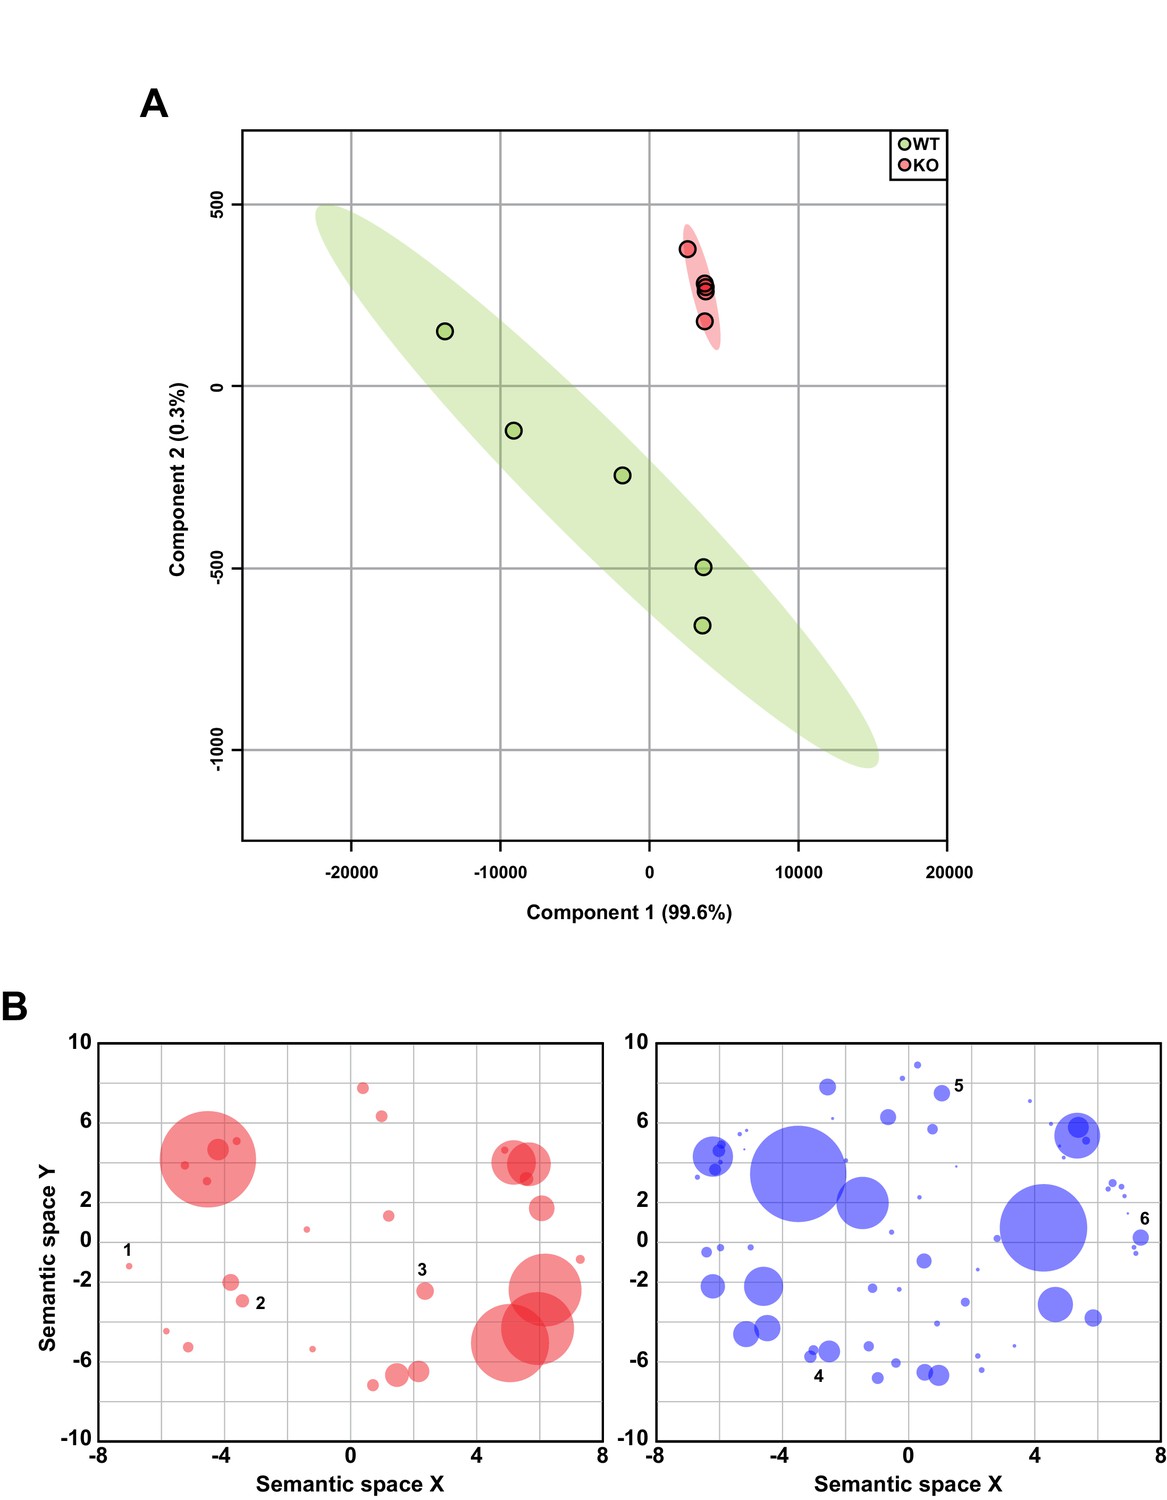
Related to Figure 5.
(A) Principal component analysis of hippocampal RNA-seq data (n = 5 WT, 5 KO). (B) Scatterplot of GO categories with semantically similar terms clustered together. Each circle represents a GO category with size corresponding to the number of genes in that category. GO terms with p<0.05 are plotted. Upregulated genes (red) are significantly enriched in genes involved in the regulation of neurological processes (1), RNA splicing (2), and cell division (3), and downregulated genes (blue) are involved in cell-cell signaling (4), cell proliferation (5), and tissue development (6).
-
Figure 5—figure supplement 2—source data 1
Gene ontology analysis of genes dysregulated in the hippocampus of Kdm5a-/- mice.
- https://cdn.elifesciences.org/articles/56883/elife-56883-fig5-figsupp2-data1-v1.xlsx
Figure 5—figure supplement 3

Expression levels of Kdm5b, Kdm5c, and Kdm5d remain unchanged following loss of Kdm5a.
Related to Figure 5. RNA-seq analysis from the hippocampus of WT and Kdm5a KO mice showed no changes in expression of the other KDM5 family members. Values are mean ± SEM (n = 5 WT, 5 KO; Kdm5b: p=0.3764, Kdm5c: p=0.7742, Kdm5d: p=0.9347). Data were analyzed using unpaired t test.
Tables
Table 1
Clinical phenotype of patients with KDM5A mutations identified in this study.
All findings reported at latest exam. Mutations are reported on human genome GRCh37/hg19 coordinates. MAF, minor allele frequency in gnomAD; NP, not present; UK, unknown. * Proband received extensive speech therapy since early childhood.
| Patient | KD-1-3 | KD-2-3 | KD-2-4 | KD-3-3 | KD-4-3 | KD-4-4 | KD-5-3 | KD-6-3 | KD-7-3 |
|---|---|---|---|---|---|---|---|---|---|
| Sex | Male | Female | Male | Male | Female | Male | Female | Female | Female |
| Age at latest evaluation (years) | 5 | 12 | 8 | 18 | 3 | 20 | 4 | 40 | 13 |
| Nucleotide change(NM_001042603) | c.1A>T | Deletion of exons 6 through 9 | Deletion of exons 6 through 9 | c.4283G>T | c.2541+1G>T | c.2541+1G>T | c.1429T>G | c.4048C>T | Deletion of exons 1 through 10 |
| Amino acid change | p.Met1Leu | --- | --- | p.Arg1428Leu | --- | --- | p.Phe477Val | p.Arg1350* | --- |
| MAF (%) | NP | --- | --- | NP | NP | NP | NP | NP | --- |
| Inheritance | de novo | Recessive | Recessive | de novo | Recessive | Recessive | Recessive | de novo | Recessive |
| Weight (percentile) | 95th | 90th | 99th | 1st | 84th | <1st | 50th | 10th | <1st |
| Height (percentile) | 98th | 96th | 99th | <1st | 99th | 7th | 30th | 25th | <1st |
| Head circumference (percentile) | 50th | <5th | 99th | UK | 50th | <5th | <5th | <3rd | <2nd |
| ASD | + | + | + | + | + | + | + | UK | UK |
| Absent speech | + | + | + | - * | + | + | + | Few words | + |
| Intellectual disability | + | + | + | + | + | + | + | + | + |
| Developmental delay | + | + | + | + | - | + | + | + | + |
| Seizures | + | + | - | + | - | - | - | + | - |
| Motor impairment | + | + | + | - | + | + | + | + | + |
| Muscle hypotonia | + | + | + | - | - | + | + | - | + |
| Feeding difficulties | + | + | + | + | - | + | + | - | - |
| Facial dysmorphisms | - | + | + | + | - | - | + | + | + |
| Abnormal MRI | UK | Hypoplastic corpus callosum | Hypoplastic corpus callosum, mild hippocampal atrophy | UK | - | UK | Periventricular leukomalacia | Gliosis of the parieto-central pyramidal tracts and mild atrophy of the parietal region | UK |
| Cardiac defects | Murmur | Atrial septal defect | - | Ventricular septal defect | - | - | Atrial septal defect | - | Murmur, coarctation of the aorta |
Key resources table
| Reagent type (species) or resource | Designation | Source or reference | Identifiers | Additional information |
|---|---|---|---|---|
| Antibody | ‘Mouse monoclonal’ anti-β-Actin | Abcam | # ab6276; RRID:AB_2223210 | WB (1:1000) |
| Antibody | ‘Rabbit polyclonal’ anti-KDM5A | Abcam | # ab70892; RRID:AB_2280628 | WB (1:1000) |
| Antibody | ‘Rabbit polyclonal’ anti-Vinculin | Cell Signaling | # 4650S; RRID:AB_10559207 | WB (1:1000) |
| Blood samples (Homo sapiens) | Referring clinicians | N/A | ||
| Cell line (H. sapiens) | Lymphoblastoid cell lines | UTSW Human Genetics Clinical Laboratory | N/A | |
| Cell line (H. sapiens) | HEK293T | ATCC | # CRL-3216; RRID:CVCL_0063 | |
| Strain, strain background (Mus musculus) | C57BL/6N | Charles River Laboratories | Strain Code: 027 | Wild type mice |
| Strain, strain background (M. musculus) | C57BL/6J | In-house | In-house | Kdm5a-/- CRISPR/Cas9 mice |
| Sequence-based reagent | Kdm5a-/- CRISPR/Cas9 sgRNA | Integrated DNA Technologies | N/A | TTAATACGACTCACTATAGGGGATACAACTTTGCCGAAG |
| Sequence-based reagent | Shh_F | Integrated DNA Technologies | qPCR primer | ACTGGGTCTACTATGAATCC |
| Sequence-based reagent | Shh_R | Integrated DNA Technologies | qPCR primer | GTAAGTCCTTCACCAGCTTG |
| Sequence-based reagent | Ccnd1_F | Integrated DNA Technologies | qPCR primer | TTCCCTTGACTGCCGAGAAG |
| Sequence-based reagent | Ccnd1_R | Integrated DNA Technologies | qPCR primer | AAATCGTGGGGAGTCATGGC |
| Sequence-based reagent | Efcab6_F | Integrated DNA Technologies | qPCR primer | CTGGAGCAGTGAGGGTCAAC |
| Sequence-based reagent | Efcab6_R | Integrated DNA Technologies | qPCR primer | ATGGTCCCCGTGTCCCTAAG |
| Sequence-based reagent | Ptgds_F | Integrated DNA Technologies | qPCR primer | GCTCCTTCTGCCCAGTTTTC |
| Sequence-based reagent | Ptgds_R | Integrated DNA Technologies | qPCR primer | CCCCAGGAACTTGTCTTGTTGA |
| Recombinant DNA reagent | pU6-(BbsI)_CBh-Cas9-T2A-mCherry (plasmid) | Addgene | RRID:Addgene_64324 | Plasmid for CRISPR knock-in |
| Software, algorithm | Adobe Illustrator | Adobe | RRID:SCR_010279 | |
| Software, algorithm | GraphPad Prism | GraphPad | RRID:SCR_002798 | |
| Software, algorithm | Avisoft-RECORDER | Avisoft Bioacoustics | RRID:SCR_014436 |
Additional files
Download links
A two-part list of links to download the article, or parts of the article, in various formats.
Downloads (link to download the article as PDF)
Open citations (links to open the citations from this article in various online reference manager services)
Cite this article (links to download the citations from this article in formats compatible with various reference manager tools)
KDM5A mutations identified in autism spectrum disorder using forward genetics
eLife 9:e56883.
https://doi.org/10.7554/eLife.56883


